FY2017 Third-Quarter Results - enplas · Actions Implemented as of FY2017 Third Quarter 12
21
FY2017 Third-Quarter Results January 25, 2017 Enplas Corporation Copyright ©2017 ENPLAS CORPORATION, All rights reserved
Transcript of FY2017 Third-Quarter Results - enplas · Actions Implemented as of FY2017 Third Quarter 12

FY2017 Third-Quarter Results
January 25, 2017
Enplas Corporation
Copyright ©2017 ENPLAS CORPORATION, All rights reserved

Notes
・ “fiscal 2016” or “FY2016” refers to the year ending
March 31, 2016.
・ “fiscal 2017” or “FY2017” refers to the year ending
March 31, 2017.
Copyright ©2017 ENPLAS CORPORATION, All rights reserved

Agenda
■ FY2017 Management Policy
■ FY2017 3rd Quarter Results
■ Business Trends and Strategies by Segment
■ FY2017 Plan(Consolidated)
3Copyright ©2017 ENPLAS CORPORATION, All rights reserved
■ FY2017 3rd Quarter Results Overview

Operational Excellence
Specification Technology
Multiple Growth
4Copyright ©2017 ENPLAS CORPORATION, All rights reserved
FY2017 Management Policy
5Copyright ©2017 ENPLAS CORPORATION, All rights reserved
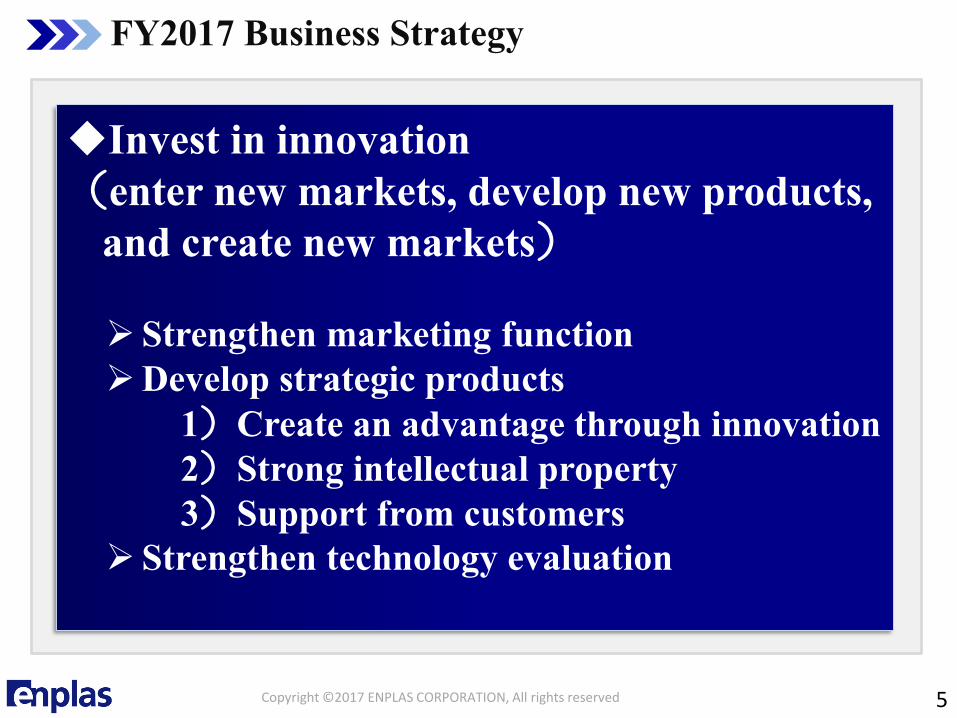
Invest in innovation
(enter new markets, develop new products,
and create new markets)
Strengthen marketing function
Develop strategic products
1)Create an advantage through innovation
2)Strong intellectual property
3)Support from customers
Strengthen technology evaluation
FY2017 Business Strategy

FY2017 FY2016 FY2017
9M/3Q Results 9M/3Q Results ChangeHalf-year
Plan
Full-year
Plan
Net Sales 249.4 295.5 -15.6% 170.0 320.0
COGS Ratio 53.2% 45.4% 7.8 pts 51.7% 52.5%
Operating
Income 35.1 81.5 -56.9% 25.0 42.0Ordinary
Income 35.9 82.9 -56.7% 25.0 40.0
Net Income 47.9 58.1 -17.6% 17.0 49.0Comprehensive
Income 51.4 55.0 -6.5% ― ―
Net Income Per
Share373.05 yen 441.08 yen -68.03 yen 132.84 yen 382.90 yen
6
FY2017 Third Quarter Business Results
Copyright ©2017 ENPLAS CORPORATION, All rights reserved
(100 million yen)
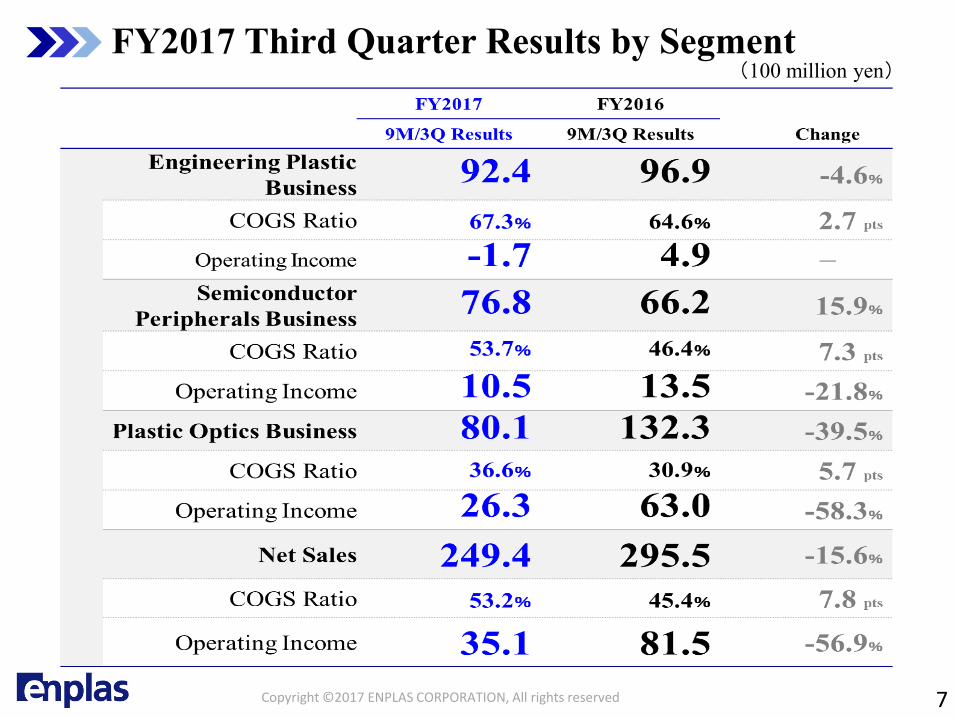
FY2017 Third Quarter Results by Segment
Copyright ©2017 ENPLAS CORPORATION, All rights reserved 7
(100 million yen)
8
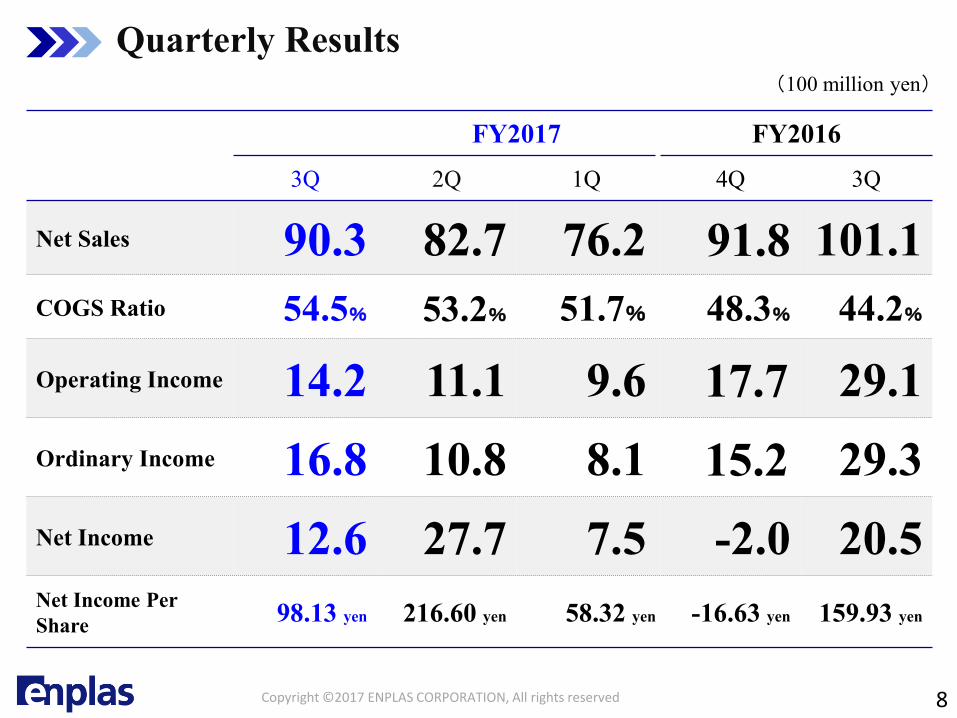
Quarterly Results
Copyright ©2017 ENPLAS CORPORATION, All rights reserved
FY2017 FY2016
3Q 2Q 1Q 4Q 3Q
Net Sales 90.3 82.7 76.2 91.8 101.1
COGS Ratio 54.5% 53.2% 51.7% 48.3% 44.2%
Operating Income 14.2 11.1 9.6 17.7 29.1
Ordinary Income 16.8 10.8 8.1 15.2 29.3
Net Income 12.6 27.7 7.5 -2.0 20.5Net Income Per
Share98.13 yen 216.60 yen 58.32 yen -16.63 yen 159.93 yen
(100 million yen)

9
Quarterly Results by Segment
Copyright ©2017 ENPLAS CORPORATION, All rights reserved
(100 million yen)

Third Quarter Overview
10Copyright ©2017 ENPLAS CORPORATION, All rights reserved
FY2017 9M/3Q FY2017 1st Half Change
107.84 yen 106.38 yen 1.46 yen
Average Exchange Rate (US$)
FY2017 3Q FY2017 2Q Change
2.5 -0.3 2.8
Non-operating profit and loss (100 Million yen)
Foreign exchange gain of 280 million yen (2Q: Foreign exchange loss of 1
million yen)
Loss of 80 million yen on equity method investments (2Q: 50 million yen)
FY2017 9M/3Q FY2016 9M/3Q Change
107.84 yen 121.45 yen -13.61 yen
<Reference>

Third Quarter Overview
11
COGS Ratio
FY2017 3Q FY2017 2Q Change
54.5% 53.2% 1.3 pts
Impairment on illiquid inventory in Semiconductor Peripherals Business
Changing sales mix
Copyright ©2017 ENPLAS CORPORATION, All rights reserved
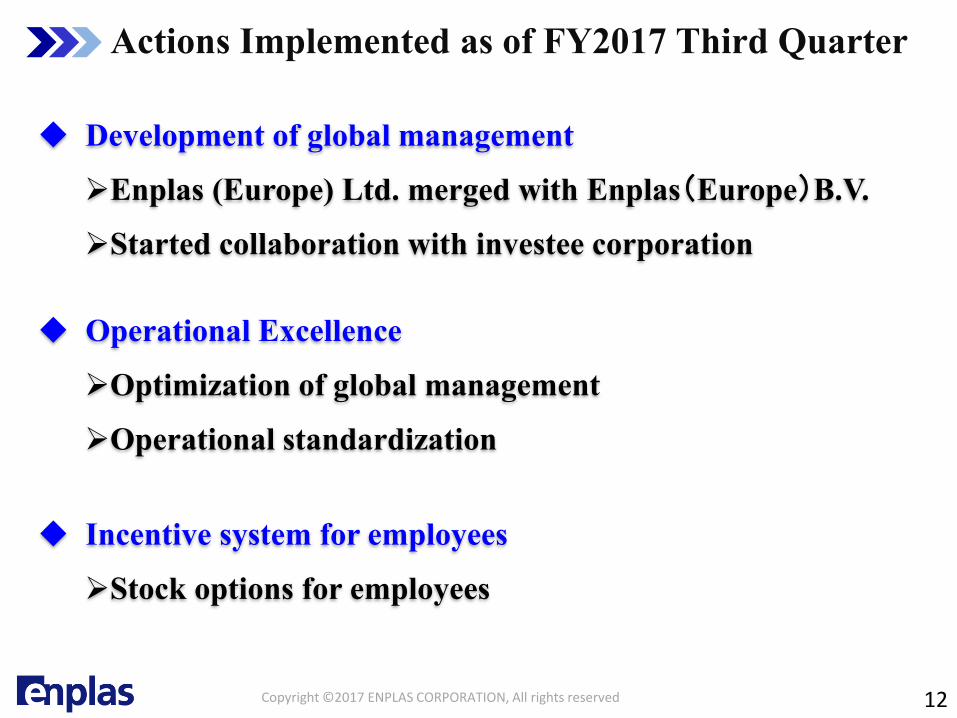
Actions Implemented as of FY2017 Third Quarter
12
Development of global management
Enplas (Europe) Ltd. merged with Enplas(Europe)B.V.
Started collaboration with investee corporation
Copyright ©2017 ENPLAS CORPORATION, All rights reserved
Incentive system for employees
Stock options for employees
Operational Excellence
Optimization of global management
Operational standardization

13Copyright ©2017 ENPLAS CORPORATION, All rights reserved

FY2017 FY2017
Full-year 9M/3Q Results
Net Sales 320.0 249.4
COGS Ratio 52.5% 53.2%
Operating Income 42.0 35.1
Ordinary Income 40.0 35.9
Net Income 49.0 47.9
Net Income Per Share 382.90 yen 373.05 yen
14
FY2017 Plan
Copyright ©2017 ENPLAS CORPORATION, All rights reserved
(100 million yen)

15
FY2017 Plan by Segment
FY2017 FY2017
Full-year 9M/3Q Result
Engineering Plastic Business 122.0 92.4
Semiconductor Peripherals
Business 95.0 76.8
Plastic Optics Business 103.0 80.1
Copyright ©2017 ENPLAS CORPORATION, All rights reserved
(100 million yen)

16
FY2017 FY2016
Full-year 9M/3Q Results Results
Capital expenditures 62.0 57.2 21.5
Depreciation 23.0 17.4 27.0
R&D 11.0 8.1 11.0
FY2017 Plan (Reference)
Copyright ©2017 ENPLAS CORPORATION, All rights reserved
(100 million yen)
※Capital expenditures plan changed

Business Trends and Strategies by Segment
17Copyright ©2017 ENPLAS CORPORATION, All rights reserved

18
Strengthen ability to offer specification based solutions to customers
Develop a thorough product strategy
Establish a high efficiency global production system
FY2017
Sales Plan: 12.2 billion yen(FY2017 9M/3Q: 9.24 billion yen)
Copyright ©2017 ENPLAS CORPORATION, All rights reserved
Engineering Plastic Business (100 million yen)

19
Improve ability to adapt to changes in the business environment
Strengthen global production system
Develop competitive solutions
Create competitive advantage based on speed
FY2017
Sales Plan: 9.5 billion yen
(FY2017 9M/3Q: 7.68 billion yen)
Copyright ©2017 ENPLAS CORPORATION, All rights reserved
Semiconductor Peripherals Business(100 million yen)

20
FY2017
Sales Plan: 10.3 billion yen
(FY2017 9M/3Q: 8.01 billion yen)
Achieve stable growth by expanding customer base
Revise production system
Develop new products for the high-speed communications market
Copyright ©2017 ENPLAS CORPORATION, All rights reserved
Plastic Optics Business(100 million yen)

Financial Results for the Third Quarter of
the Year Ending March 31, 2017
http://www.enplas.co.jp/
Any statements in this presentation which are not historical are future projections based on certain assumptions and executive judgments drawn from currently available information. Please note that actual performance may vary significantly from any particular projection due to various factors. Factors affecting our actual performance include but are not limited to: (i) changes in economic conditions or demand trends related to Enplas’s business operations; (ii) fluctuation of foreign exchange rates or interest rates; and (iii) our ability to continue R&D, manufacturing and marketing in a timely manner in the electronics business sector, where technological innovations are rapid and new products are launched continuously. All the information in this document is the property of Enplas Corporation. All parties are prohibited, for whatever purpose, to copy, modify, reproduce, transmit, etc. this information regardless of ways and means without prior written permission of Enplas Corporation.
Enplas Corporation
Copyright ©2017 ENPLAS CORPORATION, All rights reserved