FY2017 Results Investor Presentation...• Signed MOU in Jan 2017 with CMA CGM Group to strengthen...
23
FY2017 Results Investor Presentation 26 March 2018
Transcript of FY2017 Results Investor Presentation...• Signed MOU in Jan 2017 with CMA CGM Group to strengthen...

FY2017 Results Investor Presentation
26 March 2018
CONTENT Page
Reviews of FY2017
• FY2017 highlights 4
• Well positioned to capture growth 5
• Financial highlights 6
• Net profit analysis 7
• Terminal profit analysis- increasing contributions from subsidiaries 8
• Terminal profit by regions 9
• Equity throughput on the rise 10
• Analysis of equity throughput 11
• Throughput growth vs market 12
• Remained financially prudent 13
The Five Year Plan – Key milestones in FY17
• Further enhance synergies 15
• Strategic partnerships to maximize synergies 16
• Global footprint further extended 17
• Maximizing value in China market 18
• Diversifying to terminal-related logistics business 19
• Continue to enhance efficiencies 20
Our response to market challenges 22
2

3
FY2017 Reviews
GLOBALIZATION

FY2017 Highlights
• Total throughput was 100.2mn TEU*, up 5.4% yoy, total equity throughout was 32.0mn, up 8.6% yoy; excluding QPI and QQCT, total throughput increased 13.4% to 87.9mn TEU, equity throughput was 29.7mn, up11% yoy
• Own 48 port companies, operate and manage 269 berths and 35 ports worldwide, of which 179 are for containers with handling capacity of 102.7 mn TEU, and 116.5mn TEU designed capacity
• Completed four investments, namely Noatum, Zeebrugge, Nantong and Wuhan Yangluo; subsidiaries increased to 15 from 10 in FY16
• Stepped up development in terminal extended logistics services
• Adopted unified management and information system to promote the unification of the
information systems for terminals
• Introduced and applied innovative information technologies to optimise the workflow and
business operations of various departments through information and electronic means
• Introduced terminal operating systems from Navis and TSB
* Included throughput of QPI from May to Dec 2017 and 2016 full year throughput of QQCT was included
4

5
Well positioned to capture growth
Increasing demand for
terminals with modern facilities
Increasing demand for
terminal network with modern facilities and subnetworks
Pressing demand for full logistics
services
Solid Business model with
perfect integrations
Decision of investment in port companies links closely with network of routes of shipping companies
Network of ports and global network not only satisfies demand of shipping alliances but also provides differentiated services to clients of shipping companies
Upstream and downstream extended services provided by port operator can better serve the shipping companies ‘ needs of full logistics services
Trend of mega vessel
Formation of shipping alliances
Extended services from upstream
and downstream & the connections
Port operator with supports from shipping
company
Changing landscape of the shipping industry
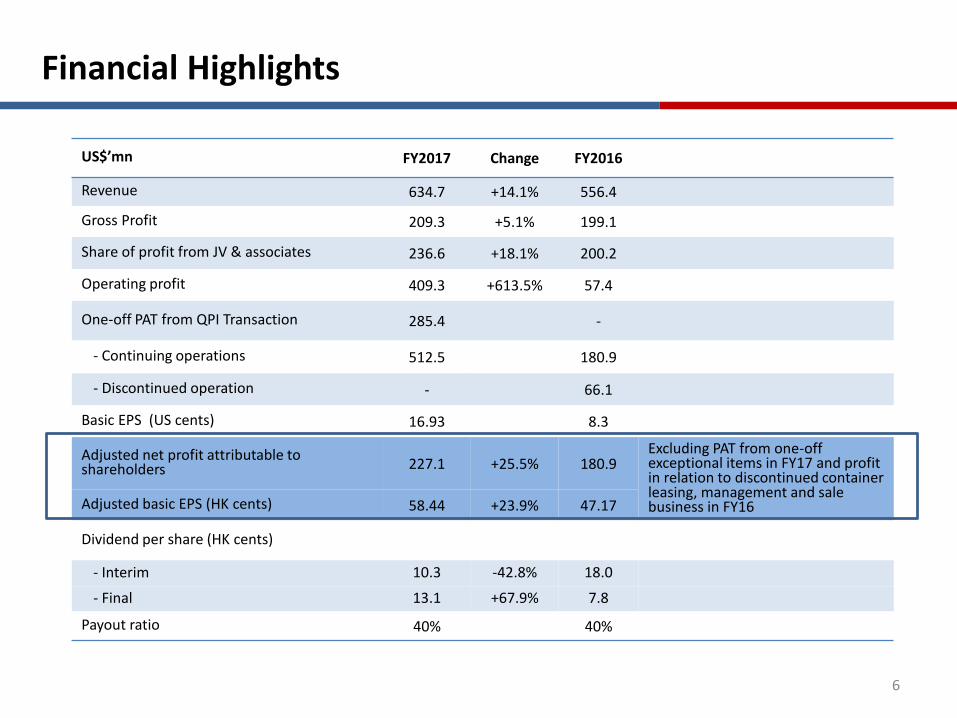
Financial Highlights
US$’mn FY2017 Change FY2016
Revenue 634.7 +14.1% 556.4
Gross Profit 209.3 +5.1% 199.1
Share of profit from JV & associates 236.6 +18.1% 200.2
Operating profit 409.3 +613.5% 57.4
One-off PAT from QPI Transaction 285.4 -
- Continuing operations 512.5 180.9
- Discontinued operation - 66.1
Basic EPS (US cents) 16.93 8.3
Adjusted net profit attributable to shareholders 227.1 +25.5% 180.9
Excluding PAT from one-off exceptional items in FY17 and profit in relation to discontinued container leasing, management and sale business in FY16Adjusted basic EPS (HK cents) 58.44 +23.9% 47.17
Dividend per share (HK cents)
- Interim 10.3 -42.8% 18.0
- Final 13.1 +67.9% 7.8
Payout ratio 40% 40%
6

Net profit analysis
7
US$ mn FY2017 YoY FY2016
Terminal profit 295.1 +21.6% 242.4
Adjusted net profit* 227.1 +25.5% 180.9
Bohai Rim 27.5%
Pearl River Delta 29.9%
Yangtze River Delta 23.3%
S.E Coast & others 4.5%
S.W Coast 0.7%
Overseas 14.2%
FY17 Terminal profit by regions
FY17 FY16
QPI 18.3% Yantian 21.1%
Yantian 17.4% QQCT 20.0%
Shanghai Pudong 7.8% PCT 12.9%
Shanghai Mingdong 7.1% Shanghai Pudong 8.5%
PCT 6.8% Shanghai Mingdong 8.0%
Guangzhou Nansha 5.2% Guangzhou Nansha 5.1%
Kumport 4.3% Hong Kong 5.4%
Hong Kong 5.1% Ningbo Yuan Dong 3.1%
Ningbo Yuan Dong 3.0% Quanzhou 3.1%
Quanzhou 2.7% Lianyungang 2.3%
77.6% 89.4%
* Excluding profit after tax from one-off exceptional items in FY17 and profit in relation to discontinued container leasing, management and sale business in FY16
Top 10 profit contributors

Terminal profit analysis –Increasing contributions from subsidiaries
8
28
59
38
58
0
10
20
30
40
50
60
70
Subsidiaries (exclude PCT) Subsidiaries
FY16 FY17
US’mn
+38.1%
• Terminal profit of subsidiaries, exclude PCT, increased 38.1% yoy
• Terminal profit of non-subsidiaries increased 29.2% yoy
• Higher depreciation, amortization and outsources stevedoring expenses, as well as the payment of fee for the use of land and shoreline of the eastern part of Pier 3 in 1H17, negatively impacted the performance of PCT in FY17, we expect the costs of PCT will be lower in FY18 compared with FY17
185
237
0
50
100
150
200
250
Non-subsidiaries
FY16
FY17
US’mn
+29.2%

Terminal profit by regions
• Profit from Pearl River Delta region increased 7.4% on higher contribution from Nansha mainly driven by the increased calls from OCEAN Alliance and enhanced efficiency from co-management
• Profit from Bohai Rim region increased by 64.3% mainly due to contribution from QPI
• Profit from Yangtze River Delta region up12.2% yoy, mainly contributed by Ningbo Yuan Dong and Shanghai Pudong
82.1
49.3
61.2
39.2
9.1
1.5
88.1 81.1
68.7
41.8
13.4
2.1 0
10
20
30
40
50
60
70
80
90
100
Pearl RiverDelta
Bohai Rim Yangtze RiverDelta
Overseas SoutheastCoast and
others
SouthwestCoast
US$
mn
FY2016
FY2017
US$ mn FY2017 YoY %* % of total
Pearl River Delta 88.1 +7.4 29.9%
Bohai Rim* 81.1 +64.3 27.5%
Yangtze River Delta 68.7 +12.2 23.3%
Southeast Coast and others 13.4 +47.1 4.5%
Southwest Coast 2.1 +42.0 0.7%
Overseas terminal** 41.8 +6.7 14.2%
Total 295.1 21.8% 100%
9
*Provision impairment amounted to US19.8mn on Qinhuangdao in FY16 **Net profit of Noatum and Vado were included since 2017

Equity throughput on the rise
5.1
7.2
5.4
6.1
2.5
0.5
5.2
8.0
5.6
7.5
2.9
0.5
0
2
4
6
8
10
Bohai Rim Pearl RiverDelta
YangtzeRiver Delta
Overseas SoutheastCoast &others
SouthwestCoast
TEU
mn
FY2016
FY2017
* Excluded QQCT’s throughput in 2016 and QPI’s throughput from May to Dec 2017**Throughput of Noatum and Vado were included since 2017
10
TEU mn FY2017 YoY % % of total
Bohai Rim* 5.2 +1.1 17.4%
Pearl River Delta 8.0 +11.6 27.1%
Yangtze River Delta 5.6 +3.4 18.8%
Southeast Coast and others
2.9 +16.8 9.8%
Southwest Coast 0.5 +19.2 1.8%
Overseas ** 7.5 +22.3 25.1%
Total 29.7 +11.5 100.0%
• Growth in 2017 throughput of terminals was driven by increased calls from Ocean Alliance, contributions from Vado and Noatum
• Increased support from OCEAN Alliance and parent company especially in Xiamen, Nansha and PCT

11
Analysis of equity throughput
10,027
19,446
11,053
20,946
0
5,000
10,000
15,000
20,000
25,000
Subsidiaries Non-subsidiaries
FY16
FY17
‘000 TEU
+10.2%
+7.7%

Throughput growth vs the market
Source: Chinese Port (中國港口網)
Total throughput 000’TEU COSCO SHIPPING Ports Total throughout of the region
FY 2017 YoY % FY2016 FY2017 YoY % FY2016
Bohai Rim* 15,975 +5.7% 15,113 62,843 +5.2% 59,761
Yangtze River Delta 19,631 +6.1% 18,508 71,844 +9.7% 65,465
Southeast Coast and others 5,080 +12.1% 4,533 15,671 +8.8% 14,401
Pearl River Delta 27,049 +9.5% 24,697 50,672 +7.5% 47,137
Southwest Coast 1,357 +19.2% 1,138 4,602 +17.4% 3,920
12
* Not include QPI’s throughput from May-Dec 2017 and QQCT’s 2016 full year throughput

Remained financially prudent
13
US$mn As of 31 Dec 2017 YoY As of 31 Dec 2016
Total debt 2,334 +55.3% 1,503
Average cost of debt % 3.22 -0.15pp 3.37
Cash on hand 566.4 -32.3% 837.1
Net debt to equity 30.2% 14.0%
Interest coverage 12.5x 5.9x
Net asset 5,845 +22.7% 4,766
Total assets 8,954 +31.9% 6,786
We adopted a disciplined investment strategy, every investment we made has aligned with our overall development plan,
• In choosing overseas investment, we will consider whether the project align with our strategy of building a global terminal network that can provide linkage effects on costs, services and synergies
• As for the investment at home, we will consider whether it will help maximize our values in the China market and enhance our profitability, the investment in QPI is a good example

14
The Five Year Plan -key milestones in FY2017
SYNERGY

Further enhance synergies
• In 2017, Ocean Alliance continued to increase calls at our terminals; more contributions from Ocean Alliance are expected in 2018
• Further enhanced synergies with parent company, throughput contributions from parent company continued to increase
Subsidiaries Contributions from Ocean Alliance as % of total throughput in FY2017
Compared with FY2016
PCT 66.4% +25.8%
Xiamen 79.7% +136.0%
Nansha 32.2% +53.5%
Lianyungang 59.0% +30.1%
15
Contributions from Parent company as % of Total throughput in FY2017
Compared with FY2016
Subsidiaries 23.3% +41.2%
Major non-subsidiaries (PSA, Euromax, Hong Kong , Antwerp)
41.7% +41.3%
Other non-subsidiaries 26.0% +4.9%

Strategic partnerships to maximize synergies
Continue to establish close partnerships and good relationships with port groups, terminaloperators and international liner companies to further maximize synergies
• Formed strategic partnership with QPI in developing overseas businesses; with bothparties’ professional operations, management and executions, we expect to achievemore success; QPI’s investing in our CSP AD Ports is a concrete step of our partnership
• Signed MOU in Jan 2017 with CMA CGM Group to strengthen the cooperation betweenboth parties in the field of global port investment and operations
• Signed a strategic cooperation agreement with China Gezhouba Group International Engineering Co., Ltd. in May open a new chapter in the field of investment, construction and logistics for global ports
• Partner with Wuhan Iron and Steel in Wuhan Yangluo project signify a joint effort of two big players
• In additions, strategic alliances will be formed with China Communications Construction and China Railway
16

Global footprint further extended
• Acquired 51% stake in Noatum
• Increased stake in Zeebrugge and made it the second overseas wholly-owned terminal following PCT
Dedicated to building a global terminal network with controlling stake that offers linkage effects on costs, services and synergies
17

Maximizing value in China market
• Strategic investment in QPI to enjoy the growth of the whole port, QPI was the biggest contributor of terminal profit in FY17 and made up 18.3% of the total • This new model of strategic investment in port
authority acts as a significant reference for our future deployment of resources in local market
• Investment in Nantong and Wuhan Yangluo to seize the development opportunities in the Yangtze River Economic Belt
• Integrations of existing terminals to enhance competitiveness and profitability • Guangzhou Nansha and Guangzhou South
Oceangate under same management • Yingkou terminals under same management • Merged of DCT, DPCT and DICT• Co-management of Hong Kong terminals
18

Diversifying to terminal-related logistics business
• Diversifying business into terminal-related logistics businesses to
• optimize full development potential of entire port districts
• further penetrate the business chain
• build economies of scale
• enhance operational efficiency, competitiveness and profitability
• Stepped up development pace in FY17
• Obtained the rights from Nantong Municipal Government to use the 5,412mu of landoutside Nantong Tonghai Terminal to develop a logistics park
• Partnered with Wuhan Iron and Steel (Group) Corporation to develop a 700mutransportation centre with full logistics services in Wuhan Yangluo
• Signed a leasing agreement with Abu Dhabi Ports Company for the development of a270,000m2 container freight station outside CSP AD Ports
• More concrete developments will be achieved in 2018
19

Continue to enhance efficiencies
The Group is committed to optimising terminal assets and enhancing the terminal operational
efficiency
• Signed subscription agreements with Navis and TSB for their terminal operating systems
• Adopted a unified management and information system to promote the unification of
the information systems for terminals, the headquarters of the Company can examine
the operation status of each of its terminals in real time and regularly quantify the
business performance with unified performance indicators
• Introduced and applied innovative information technologies to optimise the workflow
and business operations of various departments through information and electronic
means
• Formulated standardised and unified operational standards for core processes such as
gate management, yard operations and front-line terminal operations
• Productivity of our terminals was further enhanced in FY17 • Total bridge efficiency of our subsidiaries continued to improve, e.g. PCT and Jinjiang
Pacific increased by 9.7% and 14% respectively compared with FY16
20

21
CONTROL
Our responses to market challenges

Our responses to market challenges
Limited chance fortariff hike
Sino-US Trade War
Trade protectionism
• Growth to be driven by volume
• Diversify business to terminal extended logistics services
• Formation of a global terminal network that has linkage effects on costs, services & synergies
• Limited impact as only two terminals of us handle containers for transpacific routes
• Increase business from other shipping routes
22

Disclaimer
23
This presentation contains certain forward-looking statements with respect to the financial condition, results of operations and business of COSCO SHIPPING Ports Limited (“COSCO SHIPPING Ports”) and certain plans and prospects of the management of COSCO SHIPPING Ports.
Such forward-looking statements involve known and unknown risks, uncertainties and other factors which may cause the actual result or performance of COSCO SHIPPING Ports to be materially different from any future results or performance expressed or implied by such forward looking statements. Such forward- looking statements are based on numerous assumptions regarding COSCO SHIPPING Ports’ present and future business strategies and the political and economic environment in which COSCO SHIPPING Ports will operate in the future.
The representations, analysis and advice made by COSCO SHIPPING Ports in this presentation shall not be construed as recommendations for buying or selling shares of COSCO SHIPPING Ports. COSCO SHIPPING Ports shall not be responsible for any action or non-action made according to the contents of this presentation.