FY2016 Statistical Digest - Montgomery County,...
43
1 FY2016 Statistical Digest Montgomery County Circuit Court Administrative Office of Montgomery County Circuit Court
Transcript of FY2016 Statistical Digest - Montgomery County,...

1
FY2016 Statistical DigestMontgomeryCountyCircuitCourt
Administrative Office of Montgomery County Circuit Court
Ensuring Accountability and Public Trust Continual and Collaborative Review of
Court Performance Montgomery County Circuit Court manages and tracks the progress of its cases monitoring in
particular its caseload and case processing performance to ensure that court operations are both
effective and efficient Montgomery County Circuit Court is a leader in case management as well as
data quality and case processing analysis The courtrsquos case processing performance is comparable to
several other Maryland jurisdictions as similar case management practices and monitoring systems have
been implemented statewide
Despite the resource challenges of the past several years including budget reductions the Hon John
W Debelius III Circuit and County Administrative Judge the Hon Barbara Meiklejohn Clerk of the
Court and Court Administrator Judy K Rupp have reaffirmed their commitment to maintaining and
enhancing court operations to fulfill the courtrsquos mission of administering justice in an honest fair and
efficient manner Resources are allocated to ensure that case information is collected and recorded in a
manner that provides an accurate reflection of the court events Further all concur that the courtrsquos
management decisions in particular those regarding case processing should be based on systematic
analyses of data that it collects rather than relying upon anecdotes or assumptions
Understanding how court performance relates and responds to the countyrsquos demographic profile its
economic climate as well as budgetary constraints is critical to the efficient management of the courtrsquos
caseload and allows the court to anticipate and prepare for the future needs of the community To
achieve these goals court leaders engage in close communication collaboration and coordination
Responsibility for upholding the courtrsquos core mission must - and does - extend beyond the executive
leadership team to all court staff Court leadership has fostered strong staff awareness of and
commitment to the importance of recording and collecting data that reflects the courtrsquos performance
and has instilled the understanding that while there is a large amount of paperwork associated with
each case the circuit court is not merely processing paper but rather serving the residents of
Montgomery County with legal matters that affect their lives
2
Montgomery County Statistics and their Impact on the Circuit Court Caseload
This section of the statistical digest highlights some characteristics of Montgomery County residents
served by the Montgomery County Circuit Court Understanding the countyrsquos population in particular its
socio-demographic characteristics and their trends helps the court develop programs and services that
meet the current and future needs of residents Furthermore by monitoring these trends the court is in a
better position to make informed decisions related to the resources required to support the efficient and
effective administration of justice
Population of Montgomery County
Since the US Census Bureau conducted the last census in 2010 Montgomery Countyrsquos population has
exceeded one million Its estimated 2016 population is 1043863 adding 72000 residents (a 74
increase) since 2010 (971777)1 The county has remained the most populous jurisdiction in the state since
1989 and is the 42nd most populous county in the United States based on the 2016 US Census estimates2
Montgomery County is also the only Maryland jurisdiction with a population over 1 million accounting
for 174 of the statersquos six-million population Montgomery County has nearly 136000 more residents
than Prince Georgersquos County (908000) the second most populous county in the state (see Table 1)
Between 2010 and 2016 Montgomery Countyrsquos population increased by 67700 a 69 increase The size
of the increase is by far the largest of Marylandrsquos 24 jurisdictions followed by Prince Georgersquos County
(42000 a 49 increase) Anne Arundel County (29000 a 54 increase) Howard County (28600 a
99 increase) and Baltimore County (24900 a 31 increase)3 The average percentage growth rate of
Montgomery Countyrsquos population was 14 per year between 1990 and 2000 which declined to 11
between 2000 and 2010 but improved to 13 between 2010 and 2015 While the rate is no longer as
1 US Census Bureau Annual Estimates of the Resident Population for Counties April 1 2010 to July 1 2016 (data downloaded from httpswww2censusgovprograms-surveyspopestdatasets2010-2016countiestotals accessed on 4132017) 2 Based on the calculation of the US Census Bureaursquos data (Annual Estimates of the Resident Population for Counties April 1 2010 to July 1 2016 (data downloaded from httpswww2censusgovprograms-surveyspopestdatasets2010-2016countiestotals accessed on 4132017) 3 Based on the calculation of data from Maryland State Data Center Maryland Department of Planning (Table 1A Total Resident Population for Marylands Jurisdictions April 1 2010 thru July 1 2015 (httpplanningmarylandgovmsdcPop_estimateEstimate_15countytable1Apdf accessed on 4102017))
3
large as 27 per year as it was during the 1980s the countyrsquos population is still expected to rise reaching
12 million residents by 2040 (See Figure 1)4
Table 1 Total Resident Population for Marylands Five Largest Jurisdictions 1990 2000 2010 and 2016 Resident Population 1990-2000 2000-2010 2010-2016
1990 2000 2010 2016 Change Change Change Change Change Change
Maryland 4799770 5311034 5788409 6016447 511264 107 477375 90 228038 39 Montgomery 765476 877478 976179 1043863 112002 146 98701 112 67684 69 Prince Georges 725896 803111 875277 908049 77215 106 72166 90 32772 37 Baltimore County 694782 755598 806171 831026 60816 88 50573 67 24855 31 Baltimore City 735632 649086 621180 614664 -86546 -118 -27906 -43 -6516 -10 Anne Arundel 428877 491670 539308 568346 62793 146 47638 97 29038 54
Sources Maryland State Data Center Maryland Department of Planning Table 1A Total Resident Population for Marylands Jurisdictions April 1 2010 thru July 1 2015 (httpplanningmarylandgovmsdcPop_estimateEstimate_15countytable1Apdf accessed on 4102017) US Census QuickFacts (2016 data) (httpswwwcensusgovquickfactstablePST04521600 accessed on 5102017)
Figure 1 Historical and Projected Total Population Montgomery County 1970-2040
Sources Maryland State Data Center Maryland Department of Planning Demographic and Socio-Economic Outlook Montgomery County (Revisions July 2014) (httpplanningmarylandgovmsdcpopprojTotalPopProjpdf accessed on 4072017)
One of the leading forces behind Montgomery Countyrsquos current population growth is the much greater
number of births (on average 13200 births per year between 2000 and 2014) than deaths (on average 5600
per year during the same period)5 resulting in an average net increase of 7700 in the countyrsquos population
A second contributing factor is the influx of new residents on average 3800 individuals per year as a
result of large and positive international migration (on average 9600 individuals per year between 2000 and
4 Maryland State Data Center Maryland Department of Planning Demographic and Socio-Economic Outlook Montgomery County (Revisions July 2014) (httpplanningmarylandgovmsdcpopprojTotalPopProjpdf accessed on 472017) 5 Maryland Department of Planning April 2015 2014 Maryland Statistical Handbook (Table 1J Total Births in Maryland 2000 ndash 2014 and Table 1K H Total Deaths in Maryland 2000 ndash 2014) (httpplanningmarylandgovmsdcmd_statistical_handbookpdf accessed on 4132017)
4
2014) which is reduced by smaller but negative domestic migration (on average 5800 individuals per year
moving out of the county during the same period)6
Impact on the Circuit Court Caseload
Of the case types that Montgomery County Circuit Court hears (civil criminal family juvenile
delinquency and child welfare) family law cases which deal with divorce and other family law-related
matters are more likely to correlate with the countyrsquos population trends than the other case types In
fact the number of family law case filings (original and reopened) steadily increased from 12300 in
FY2000 to 15100 in FY2010 mirroring the countyrsquos population growth7 However the growth of
family law case filings stabilized between FY2011 and FY2016 averaging 14700 filings per year This
stabilization in filings contrasts the continued growth of the countyrsquos population suggesting that court
caseload may also be impacted by additional factors such as shifts in the composition of the population
in terms of age raceHispanic origin and nationality the countyrsquos economic climate and legislative
changes regarding marriage issues
Racial and Ethnic Diversity ndash Majority Shifts in Population Composition8
Along with population growth Montgomery County has been experiencing increased racial and ethnic
diversity in its population Between 2000 and 2010 during which the county population increased by
more than 98000 from 873300 to 9718009 the number of non-Hispanic white residents declined by
45500 from 524300 to 478800 whereas the numbers of non-white residents who largely consist of black
or African American or Asian andor of Hispanic origin increased by 143900 (a 41 increase) from
349100 to 493000 residents accounting for 507 of the county population in 201010 As show in Figure
1 this trend is expected to continue and two thirds of the county residents are expected to be non-White
or Hispanic (alone and two or more races) by 2035
6 Maryland Department of Planning October 2016 2015 Maryland Statistical Handbook (Table 1G International Migration for Marylands Jurisdictions 2000 ndash 2015 Table 1H Domestic Migration for Marylands Jurisdictions 2000 ndash 2015) (httpplanningmarylandgovmsdcmd_statistical_handbookpdf accessed on 4132017) 7 The countyrsquos fiscal year stretches from July 1st to June 30th 8 The analysis in this section uses population data and estimates from the US Census which collects race and Hispanic or Latino origin in two separate questions Accordingly individuals of any race could be of Hispanic origin and those who are of Hispanic origin could be of any race 9 US Census Bureau Profile of General Population and Housing Characteristics 2000 and 2010 Census 2000 and 2010 Summary Files 1 (SF 1) 100-Percent Data (table created through the US Census American FactFinder Advanced Search httpfactfindercensusgovfacesnavjsfpagessearchresultsxhtmlrefresh=t accessed on 2122014 From the FactFinderrsquos Advanced Search menu type lsquoMontgomery County Marylandrsquo in the lsquostate county or placersquo box and hit lsquoGOrdquo then select year as 2000 or 2010 under lsquoTopic yearrsquo from the left side bar menu and select the lsquoProfile of General Demographic Characteristics 2000rsquo table) 10 Maryland State Data Center Maryland Department of Planning Demographic and Socio-Economic Outlook Montgomery County (Revisions January 2014) (httpplanningmarylandgovMSDCCountymontpdf accessed on 1142015)
5
Figure 2 presents the composition of the countyrsquos estimated population in terms of race and Hispanic
origin in 2000 2005 2010 and 2015 as well as that of Maryland for 2015 Also displayed are the county
overall population which increased from 873000 in 2000 to 1040000 in 2015 and White population
(including both Hispanic and non-Hispanic origin) which remained virtually unchanged during the 15-year
period and Non-White population which increased by 55 from 308000 to 476000 during the same
period As a result the percentage of Montgomery County residents who are White declined from 65 in
2000 to 54 in 2015 which is slightly lower than the statewide percentage (57) Equally the percentage
of black or African American residents is substantially lower (18 for the county versus 29 statewide)
though it slightly increased from 15 in 2000 In contrast the percentage of Asian residents in the county
(15) is much greater than the statewide percentage (6) In fact 41 of the statersquos Asian population
resides in Montgomery County Of the countyrsquos 157000 Asian residents over 38000 are Asian Indians
and another 46000 are Chinese Combined these two populations account for 54 of the countyrsquos Asian
population Also over-represented among the countyrsquos population are individuals with some other race
alone or with two or more races (132100 13 in the county compared to 8 statewide) again
underscoring the diversity of Montgomery County residents
Figure 2 Total White and Non-White Populations of Montgomery County (2000-2015) and Population Composition by Race for the County (2000-2015) and Maryland (2015)
Includes other race alone (American Indian and Alaska Native Native Hawaiian and Other Pacific Islander and Some other race) and two or more races Sources Maryland Department of Planning American Community Survey Jurisdictions with a Population over 65000 for Single Year (2005 2010 and 2015) (httpplanningmarylandgovmsdcS7_ACSshtml accessed on 4072017) US Census DP-1 Profile of General Demographic Characteristics 2000
6
Another major driving force behind Montgomery Countyrsquos diversity is the large influx of individuals of
Hispanic or Latino origin Irrespective of race a little over 100000 of Montgomery County residents were
of Hispanic or Latino origin in 2000 As of the 2010 US Census the countyrsquos Hispanic or Latino
residents increased by 66100 to 166700 (a 66 increase) increasing their representation from 12 to
17 since 2000 According to the 2015 Census estimates 197400 (19) of the county residents are of
Hispanic origin accounting for 35 of the statersquos residents of Hispanic origin The countyrsquos Hispanic
population has become the largest minority population exceeding that of black or African American
population (186900 if black or African American alone however 204600 in combination with one or
more other race) surpassing the Asian population (157000 if Asian alone or 175300 in combination with
one or more other race)11
Increase in Foreign-Born Residents
As indicated above one of the major forces behind the countyrsquos population growth is the large influx of
individuals who were born outside the United States Based on the 2015 US Census American
Community Survey estimate 343200 or one third of Montgomery County residents are foreign-born12 As
shown in Table 2 since 2000 the number of foreign-born residents increased by almost 110200 (a 47
increase) while the countyrsquos overall population increased by 19 and the residents born in the United by
9 In fact foreign-born residents account for 66 of the countyrsquos population increase between 2010 and
2015 Compared to the state overall the representation of foreign-born residents in Montgomery County
is much greater (33 versus 15) and nearly 38 of such individuals reside in the county13
In terms of the US citizenship status of foreign-born Montgomery County residents 52 (178600) are
naturalized US citizens and the remaining 48 (164600) are not US citizens in 2015 In terms of the
region of birth among foreign-born residents in 2000 38 of the countyrsquos foreign-born residents were
from Asia and another 36 from Latin America Combined these two groups constituted over 70 of
the countyrsquos foreign-born population Between 2000 and 2015 the number of residents born in both
groups increased However the increase of residents born in Latin America was greater (42800 a 52
increase) than that of residents born in Asia (40100 a 45 increase) As a result in 2015 those born in
11 Maryland Department of Planning 2015 American Community Survey 1-Year Estimates (DP02 SELECTED SOCIAL CHARACTERISTICS (for Montgomery County and Maryland) (httpplanningmarylandgovmsdcAmerican_Community_Survey2015ACSshtml accessed on 1192017) 12 Maryland Department of Planning 2015 American Community Survey 1-Year Estimates (DP02 SELECTED SOCIAL CHARACTERISTICS (for Montgomery County and Maryland) (httpplanningmarylandgovmsdcAmerican_Community_Survey2015ACSshtml accessed on 1192017) 13 Maryland Department of Planning 2015 American Community Survey 1-Year Estimates (DP02 SELECTED SOCIAL CHARACTERISTICS (for Montgomery County and Maryland) (httpplanningmarylandgovmsdcAmerican_Community_Survey2015ACSshtml accessed on 1192017)
7
Latin American or Asia account 84 of the countyrsquos foreign-born residents (38 and 36 respectively)
In terms of the rate of increase the number of residents born in Africa more than doubled (a 112
increase) between 2000 and 2015 from 25800 to 54700 As the last column of the table shows the
countyrsquos foreign-born population is distributed proportionally across those different regions at least 35
of those who reside in Maryland and are originally from one of the five regions of the globe live in
Montgomery County
Table 2 Foreign-Born Population in Montgomery County by World Region of Birth 2000 and 2015
2015 Montgomery County
2000 2000-15 Change Maryland 2015 in
Montgomery Number Number Number Number County
Total Population 1040116 873341 166775 19 6006401 17 Native 696923 67 640345 73 56578 9 5094819 85 14 Foreign Born 343193 33 232996 27 110197 47 911582 15 38
Foreign-Born Population by US Citizen Status US Citizen 178639 52 100658 43 77981 77 447550 49 40 Not a US Citizen 164554 48 132338 57 32216 24 464032 51 35 Foreign-Born Population by Region of Birth
Asia 129191 38 89128 38 40063 45 304707 33 42 Latin America 124731 36 81911 35 42820 52 358701 39 35 Africa 54727 16 25776 11 28951 112 150878 17 36
Europe 29807 9 32352 14 -2545 -8 84527 9 35 Northern America 3697 1 2981 1 716 24 9807 1 38 Oceania 1040 03 848 04 192 23 2962 03 35
Excludes Individuals born at sea Source Maryland Department of Planning 2015 American Community Survey 1-Year Estimates (DP02 SELECTED SOCIAL CHARACTERISTICS (for Montgomery County and Maryland) (httpplanningmarylandgovmsdcAmerican_Community_Survey2015ACSshtml accessed on 1192017)
The diversity of nativity and the increased representation of foreign-born residents among the countyrsquos
population are also reflected in the wide spectrum of languages spoken by its residents As shown in Table
3 according to the 2015 American Community Survey 394300 (41) of the countyrsquos residents who are
five years and older speak a language other than English at home In addition 138300 Montgomery
County residents (14 of the total residents aged 5 and older and 35 of those who reported that they
speak a language other than English at home) reported that they speak English less than lsquovery wellrsquo
However we note that the number of those who reported that they speak English less than lsquovery wellrsquo
actually declined by 2500 from 2014 while the number of those who reported to speak a language other
than English at home increase by 10800 As shown in Table 3 between 2010 and 2015 the county added
nearly 60000 residents aged 5 and older of whom close to 60 (35600) reported to speak a language
other than English at home Interestingly however the number of those who reported to speak less than
lsquovery wellrsquo decreased by 3800 during the same period
8
The percentage of Montgomery County residents who speak languages other than English at home (41)
is twice as high as that of statewide (19) and the US (21) There are also a greater percentage of
county residents who reported speaking English less than lsquovery wellrsquo 14 for Montgomery County
compared to 7 for Maryland and 9 for the US However among those who speak languages other
than English at home the percentage of Montgomery County residents who reported speaking English
less than lsquovery wellrsquo (35) is equivalent to the statewide figure (37) or the US figure (40)14
Table 3 Montgomery County Population Five Years or Older by Language Spoken at Home and English Proficiency 2015
2015 2010 2010-15 Change Maryland 2015 United States 2015
Number Number Number Number Number Population five years and older 972081 912285 59796 7 5639774 301625014
English only 577803 59 553572 61 24231 4 4595216 81 236908935 79Language other than English 394278 41 358713 39 35565 10 1044558 19 64716079 21Speak English less than lsquovery wellrsquo 138262 14 142018 16 -3756 -3 389302 7 25867044 9
Among Language other than English 35 40 37 40
Montgomery County
Source Maryland Department of Planning 2015 American Community Survey 1-Year Estimates (US Census DP02 SELECTED SOCIAL CHARACTERISTICS (for Montgomery County Maryland and United States) (httpplanningmarylandgovmsdcAmerican_Community_Survey2015ACSshtml accessed on 1192017)
The sheer volume of individuals with limited English proficiency among non-English speaking
Montgomery County residents (138300) makes languagecommunication-related issues more critical in
the county than other jurisdictions since close to 40 of individuals with limited English proficiency in the
state reside in the county This is particularly important for the court in its efforts to ensure that all parties
understand court proceedings are able to communicate with judicial officers court staff and individuals
involved in the case and have the assistance available to them such as interpreting services as needed
Impact on the Circuit Court Caseload
Montgomery County Circuit Court has re-examined many aspects of its operations given the increased
diversity in the countyrsquos population to ensure community needs are met as it relates to access to justice
One such area related to access to justice is providing foreign-language interpreting services for hearings
trials and other ancillary programs In recent years the court experienced a substantial increase in the
number of requests for foreign-language interpreting services Figure 3 shows the number of invoices that
14 US Census 2015 2013 American Community Survey 1-Year Estimates Montgomery County Maryland and United States (DP02 Selected Social Characteristics In The United States) (created through the US Census American FactFinder Advanced Search httpfactfindercensusgovfacesnavjsfpagessearchresultsxhtmlrefresh=t accessed on 1142015)
9
the court received for foreign-language interpreter services between FY2000 and FY2016 The courtrsquos
foreign-language interpreter services increased rapidly from slightly over 400 invoices in FY2000 to over
1700 in FY2006-FY2007 followed by an equally steep decline to 1200 in FY2009 While the number of
invoices has been constant between 1200 and 1300 since FY2010 FY2015 and FY2016 witnessed an
upswing in the number reaching 1467 in FY2016
Figure 3 Numbers of Foreign-Language and Spanish Interpreter Service Invoices Submitted FY2000-2016
Note These numbers are based on the invoices submitted by interpreters who provided foreign-language interpreting services Excludes 1772 interpreter services that do not involve foreign-language interpretations (such as American Sign Language Real Time Captioning CART Services Cued Speech and Caption Reporting) and those for which language information is not available (such as interpreter services for co-parenting classes) Since (in most cases) interpreters submit an invoice per day rather than per service the actual number of services is much greater than the number of invoices submitted Also note that part of the FY2008 and FY2009 - FY2015 data do not reflect the services provided by the five Spanish interpreters hired as court employees since they do not submit invoices for the services they provided
In terms of languages the demand for Spanish interpretation has far exceeded any other languages
However in mid-2000 while the number of Spanish interpreter service invoices leveled off the number of
non-Spanish foreign-language invoices continued to rise through FY2008 reaching the same level as that
of Spanish interpreter services In FY2008 the number of invoices for Spanish interpreting services
declined by almost 30 to 649 when the court hired five Spanish interpreters who do not need to submit
invoices for interpreting services they provided As a result the number of invoices for Spanish
interpreting services which accounted for over 50-60 of the interpreter invoices in the years immediately
preceding the hiring of the staff interpreters further declined to 256 in FY2009 and remained around 300
10
in FY2010 and FY2013 However the number of Spanish language service invoices increased by over 100
(39) from 288 to 399 between FY2013 and FY2015 and increased by 87 to 486 in FY2016 during which
the court hired a sixth Spanish interpreter to meet this increasing demand Since the number of invoices
for other foreign languages also increased by 83 the overall increase in FY2016 was 170 It is expected
that in FY2017 the overall number of invoices will reach the level achieved in FY2004 (1550 invoices)
The magnitude of language diversity spoken in Montgomery County can be described using the number of
foreign languages for which the court provided interpreter services The number of languages requested
increased substantially from 15 languages in FY2000-2001 to 38 languages in FY2006 and has remained
fairly constant between 34 and 38 for the past 10 fiscal years Since several languages are grouped into a
single language category (such as Chinese which includes Cantonese Mandarin Fukienese Taishanese
Hainanese and Fuzhou etc) the actual number of foreign languages for which spoken language services
are requested may be even greater
Figure 4 Numbers of Foreign-Language and Spanish Interpreter Service Invoices Submitted Percentage of Submitted for Non-Spanish Languages FY2000-FY2016
and
Note These numbers are based on the invoices submitted by interpreters who provided services Excludes 1772 invoiced interpreter services that do not involve foreign-language interpretations (such as American Sign Language Real Time Captioning CART Services Cued Speech and Caption Reporting) or those for which the specific language information is not available (such as interpreter services for co-parenting classes)
Figure 4 shows the percentage of interpreter invoices for non-Spanish languages as well as the number of
invoices submitted for Spanish and Non-Spanish languages After a steady increase from 32 to 47
between FY2003 and FY2007 the percentage of interpreter invoices for non-Spanish languages jumped
11
to 59 in FY2008 and then to 78 in FY2009 As shown in the figure this sudden increase is the result
of a large decline in the number of invoices for Spanish invoices which coincided with the hiring of five
Spanish staff interpreters The number of Spanish invoices was below 300 until FY2014 when it rose to
386 An additional 100 invoices for Spanish interpreter services occurred in FY2016 Even with the hiring
of the sixth Spanish staff interpreter in FY2016 the percent of invoices for Non-Spanish languages
declined slightly instead of going up due to the continuing increases in invoicing for Spanish interpreter
services
Similar to the past sixteen years the most frequently requested language for interpreter services in terms of
the number of invoices submitted is Spanish in FY2016 which accounted for 33 of all the invoices
followed by Ethiopian (Amharic and Tigrina) (10) Chinese (9) French (9) and KoreanHangul
(6) Combined these five languages account for 70 of all foreign language interpreter invoices
Figure 5 Total and Average Charges for Foreign Language Interpreter Services FY2000-FY2016
Expenditures are based on the invoices submitted by interpreters who provided foreign-language interpreting services Interpreter services that do not involve foreign-language interpretations (such as American Sign Language Real Time Captioning CART Services Cued Speech and Caption Reporting) and those for which language information is not readily available (1772 invoices)
While all the interpreter service expenses are reimbursed by the State Judiciary the costs associated with
interpreter services are worthy of note The line graph in Figure 5 shows the total costs of foreign
language interpreter services based on the invoices submitted The trend generally follows that of the
number of invoices submitted shown in Figure 3 except for FY2004-FY2007 when the total invoice
12
charges continued to rise In particular between FY2006 and FY2007 total invoice charges jumped from
$330000 to $450000 while the number of invoices tapered off between FY2007 and FY2008 Total
charges markedly declined in FY2008 and FY2009 due to the hiring of five Spanish interpreters and have
remained at the FY2004-FY2005 level between FY2010 and FY2014 In recent years however total
charges have risen exceeding $430000 in FY2016 as the number of invoices also increased almost
reaching the FY2007 level despite the hiring of the sixth Spanish staff interpreter
The trend in the average charge shown in the bar graph of the figure explains the sudden FY2006-
FY2007 increase Between the two fiscal years the average charge for foreign language interpreter services
increased by $70 from $190 to $261 while the number of invoices increased only by six (from 1731 to
1737 invoices) In fact the court received four of the 10 most expensive invoices in FY2007 all for rare
African languages The average charge remained between $220 and $230 after FY2007 though it rose to
$250 in FY2015 The average cost continued to rise in FY2016 reaching almost $280 per invoice
exceeding the FY2007 level
In addition to providing foreign language interpreter services Montgomery County Circuit Court offers
Americans Disabilities Act (ADA)-related language services for eligible individuals such as translation
using American Sign Language caption reporting and communication access real-time translation (CART)
services Thus by fully complying with the ADA requirements to make reasonable accommodations for
residentslitigants with disabilities the court ensures equal access to justice
Figure 6 provides the number of invoices submitted to the court and total charges for ADA-related
interpreting services Between FY2000 and FY2016 1772 invoices were processed The trend in total
charges closely follows the number of invoices increasing from $30000 per year in FY2003 to $87000 in
FY2007 declining to $40000 in FY2009 and fluctuating around $40000-$50000 since then However in
the past few fiscal years the total charges substantially increased In FY2015 while the number of
invoices slightly declined to 104 from 108 in FY2014 the total charges increased by almost $8000 from
$55200 to $63000 Furthermore in FY2016 while the number of invoices remained unchanged the total
charges increased by 55 ($34800) to $97700 This large increase was due to the requests from parties
who asked for particular vendors who tend to charge at a higher rate Since then the court identified
13
equally-qualified service providers with more reasonable fee structures and was able to reduce the average
cost to slightly over the FY2015 level15
Figure 6 Total Charges and Number of Invoices for ADA-Related Interpreting Services FY2000-FY2016
Expenditures are based on the invoices submitted by interpreters who provided interpreting services that do not involve foreign-language interpretations such as American Sign Language Real Time Captioning CART Services Cued Speech and Caption Reporting
Maturing County population16
Like many other communities in the nation the population of Montgomery County is maturing with the
aging of the ldquoBaby Boomerrdquo generations (those born between 1946 and 1964) Over the past three
decades the median age of the countyrsquos population increased from 28 in 1970 32 in 1980 34 in 1990 37
in 2000 and 39 (385) in 2010 Since then the median age has been gradually rising reaching 387 in 2014
and 389 in 201517 The countyrsquos median age is expected to increase not only as the dominating post-
15 As of January 31 2017 the court processed 37 ADA-related invoices for FY2017 totaling $2417212 with the average of $653 per invoice compared to $939 in FY2016 and $605 in FY2015 16 All the data described in this section was derived from the US Decimal Census and Census American Community Survey (for 2013) 2015 Profile of General Demographic Characteristics 2000 and 2010 Census 2000 Summary Files (SF 1) 100-Percent Data 2012 and 2013 American Community Survey (httpswwwcensusgovprodwwwdecennialhtml accessed on 1262015) 17 US Census Bureau Population Division Annual Estimates of the Resident Population for Selected Age Groups by Sex for the United States States Counties and Puerto Rico Commonwealth and Municipals April 1 2010 to July 1 2014 (for 2014) 2015 American Community Survey 1-Year Estimates (for 2015)
14
World War II baby boomers age but also because of improving life expectancy of older generations
though the continuing influx of younger individuals to the county will slow that trend
Figure 7 Historical and Projected Montgomery County Population by Age Group 1970 ndash 2040
Source State Data Center Maryland Department of Planning 2014 Total Population Projections for Non-Hispanic White and All Other by Age Sex and Race (7814) (httpwwwmdpstatemdusmsdcS3_Projectionshtml accessed on 472017)
The aging of the countyrsquos population is also evident from an ever-increasing proportion of its segment
aged 65 years and older As shown in Figure 7 this age group represented only 6 (32600) of the
countyrsquos population in 1970 By 2000 the number tripled to 98200 accounting for 11 of the countyrsquos
residents Between 2000 and 2010 the number of residents 65 years and older increased by 20 to
119800 representing 12 of the countyrsquos total population In 2015 according to the American
Community Survey 146200 (14) of the countyrsquos residents are aged 65 years and older18 By 2040 this
portion of the countyrsquos residents is expected to reach 243900 accounting for 23 of the countyrsquos overall
population
Another trend among this segment of the population relates to increased life expectancy at birth 764
years for males and 812 years for females in 2014 compared to 700 and 774 respectively in 198019
Figure 8 provides the population of Montgomery County by age group for 1980 2010 and 2040
18 US Census Bureau Population Division 2015 American Community Survey 1-Year Estimates 19 National Center for Health Statistics 2016 Health United States 2015 With Special Feature on Racial and Ethnic Health Disparities Hyattsville MD (httpswwwcdcgovnchsdatahushus15pdf015 accessed on 4202017)
15
(estimated) on the left and the percent distribution of the population by age group for the same three years
on the right
The chart on the left shows that between 1980 (light green bars) and 2010 (blue bars) the countyrsquos
population growth took place across all age groups but in particular aged 45-54 and 35-44 groups
contributing an increase of 125000 residents Between 2010 and 2040 (red bars) while the countyrsquos
population is expected to grow across all age groups the largest population growth is expected among
individuals aged 65 and older accounting for an increase of over 75000 residents According to the 2014
Census estimates 62100 county residents are 74 years of age or older compared to 57200 in 2010 and
48100 in 2000 Furthermore 22400 are at least 85 years of age in 2014 compared with 19400 in 2010
and 13000 in 200020 Given the improved life expectancy and universal health care coverage for the
nationrsquos elderly population through Medicare this segment of the countyrsquos population is expected to
continue increasing
Figure 8 Montgomery County Population Profiles by Age Group 1980 2010 and 2040
Source State Data Center Maryland Department of Planning 2014 Total Population Projections for Non-Hispanic White and All Other by Age Sex and Race (7814) (httpwwwmdpstatemdusmsdcS3_Projectionshtml accessed on 472017)
Figure 8 which compares the size and profile of the countyrsquos population by 5-year age group intervals for
1980 2010 and 2040 features the distinctive profiles of the county population for each year in part
20 US Census Bureau 2015 2013 American Community Survey DP05 ACS Demographic and Housing Estimates (created through the American FactFinder Advanced Search httpfactfindercensusgovfacesnavjsfpagessearchresultsxhtmlrefresh=t accessed on 1262015)
16
reflecting the aging of the baby-boom generation and the continuing increase in the countyrsquos population
The 1980 population is characterized with a higher proportion of individuals aged 10 to 34 years in
particular those aged 25 and 54 accounting for 17 of the total pupation and a lower proportion of
individuals aged 60 and over compared to the 2010 and 2040 populations A distinctive feature of the
2010 population which added more residents than 1980 across all age groups includes a substantial
increase in the 35-44 and 45-54 age groups in 2010 The number of residents in these age groups nearly
doubled from 150800 in 1908 to 294000 in 2010 accounting for 30 of the countyrsquos 2010 population
Another characteristic of the 2010 population is that the number of those aged 65-74 years is greater than
any of the age groups between 0 to 24 years The profile of the 2040 population is estimated to be similar
to that of 2010 with more residents in each age group However the distinctive feature of the 2040
population is the large increase in the number of those over age 65 which is projected to double from
119800 in 2010 to 244000 in 2014 accounting for 20 of the countyrsquos 2040 population
Impact on the Circuit Court Caseload
One of the issues that the county will face is the increasing number of residents in need of assistance with
disabilities According to the 2015 US Census estimates over 9 of the county residents aged 65 to 74
years and 31 of those aged 75 and over are estimated to have some kind of ambulatory disability
compared with 06 among those aged between 5 and 34 years old and 35 among those between 35
and 64 years21 As the countyrsquos population ages it is likely that the court will experience some shift in its
caseload including an increase in appointment of guardianship cases and elder abuse cases22
Figure 9 presents the number of petitions for Adult Guardianship filed with Montgomery County Circuit
Court between FY2001 and FY2016 The filings which fluctuated between the mid- to high 100s between
FY2001 and FY2007 have been on the rise since FY2009 reaching 244 petitions a year in FY2012 and
304 in FY2015 In FY2016 the number guardianship cases filed with the court jumped to 419 (a 39
increase)
21 US Census 2017 2015 American Community Survey 1-Year Estimates Sex by Age by Ambulatory Difficulty - Universe Civilian noninstitutionalized population 5 years and over (created through the American FactFinder Advanced Search httpfactfindercensusgovfacesnavjsfpagessearchresultsxhtmlrefresh=t accessed on 4202017) 22 Center for Elders and the Courts Elder Abuse Basics (httpwwweldersandcourtsorgElder-AbuseBasicsaspx accessed on 4202017)
17
Figure 9 Number of Adult Guardianship Petitions Filed FY2001 - FY2016
Adult guardianship petitions include those for the wards (individuals under the care and control of their guardians appointed by the court) aged 18 and older Source Montgomery County Circuit Court Data Processing 2016
Crime Statistics
The number of crimes reported by the Montgomery County Police Department has been in decline since
calendar year 2008 (see Figure 10)23 Between calendar year 2001 and 2008 the number of crimes was
fairly constant around 70000 with a slight decline in 2004 and 2005 to 66500 and 67400 respectively
After peaking at 72500 in 2008 the number of crimes declined by 14400 (199) in three years to 58100
in 2011 and remained at that level in 2012 In 2013 the number further declined to 52900 Between 2008
and 2013 the number of reported crimes declined by 27 However the number of reported crimes
increased slightly in the past two years exceeding 52000 in 2015
The figure also provides the breakdown of crimes by crime type (Part I and Part II)24 The reduction in
the number of crimes since 2008 was brought about equally by the reduction of both types of crimes
although the number of Part II crimes slightly increased from 38700 to 39600 between 2011 and 2012
only to decrease in 2013 to 31300 The number of Part I crimes continued to decline from 27000 in 2008
23 Montgomery County Police Crime Statistics -Yearly Crime Stats (httpwwwmontgomerycountymdgovpolcrimestatshtml accessed on 462016) 24 FBIrsquos Uniform Crime Reporting (UCR) Program divides offenses into Part I and Part II crimes See the UCR Offense Definitions (httpwwwfbigovabout-uscjisucrcrime-in-the-us2011crime-in-the-us-2011offense-definitions) for the offenses included under Part I and Part II crimes
18
to 16900 in 2013 In 2014 both Part I and II crimes increased slightly In 2015 Part II crimes continued
to increase reaching 34000 whereas Part I crimes declined from 18500 to 18000
Figure 10 Number of Overall Part I and Part II Crimes Reported in Montgomery County Calendar Year (CY) 2001-2015
Sources Montgomery County Police Crime Statistics -Yearly Crime Stats (httpwwwmontgomerycountymdgovpolcrimestatshtml accessed on 4102017)
Figure 11 presents the trend of reported Part I crimes and its breakdown between violent crimes (murder
rape robbery and aggravated assault) versus property crimes from 2001 to 2015 During the 15-year
period the overall number of Part I crimes declined from close to 30000 in early 2000s to 18000 in the
2010s In particular the number of property crimes which account for over 90 of Part I crimes has
been steadily declining since 2008 In contrast the number of violent crimes has been nearly constant
Between 2001 and 2006 the number increased from 1970 to 2300 followed by a gradual decline to 1740
in 2014 though it increased to 2030 in 2015 Declining Part I property crimes and relatively constant Part
I violent crimes reported make a quite contrast to the countyrsquos substantial population growth and
increased diversity for the past 15 years
19
Figure 11 Number of Reported Part I Violent and Property Crimes Reported in Montgomery
County CY2001-2015
Source Governors Office of Crime Control amp Prevention Violent Crime amp Property Crime by County 1975 to Present (Montgomery County) (httpsdatamarylandgovPublic-SafetyViolent-Crime-Property-Crime-by-County-1975-to-Prejwfa-fdxs accessed on 472017)
Figure 12 shows a trend of reported Part I violent crimes more in detail by crime type (murder rape
robbery and aggravated assault) for 2001 through 2015 the yearly fluctuations that were not presented in
Figure 11 The number of violent crimes slightly increased from 1972 in 2001 to 2304 in 2006 but
declined to fewer than 2000 in 2011 and to its lowest point (1589) in 2011 The number remained at that
level until 2015 when the number increased by 17 from 1738 in 2014 to 2032 in 2015
The figure shows the two main crime types responsible for the overall trend of Part I violent crimes
robbery and aggravated assault which account for over 90 of reported crimes In comparison the
numbers of murder and rape are much smaller than that of robbery or aggravated assaults and have been
in a gradual decline over time except for 2015 Rape crimes reported in the county ranged from 140 to
150 per year in the early 2000s after peaking at 157 in 2005 the number declined to 106 in 2012 and
increased slightly to 130 in 2013 However the number of rape more than doubled from 128 in 2014 to
278 in 2015 This increase combined with that of aggravated assaults resulted in the large increase in the
number of Part I violent crimes in 2015
20
Figure 12 Number of Part I Violent Crimes Reported by Type Reported in Montgomery County CY2001-2015
Source Governors Office of Crime Control amp Prevention Violent Crime amp Property Crime by County 1975 to Present (Montgomery County) (httpsdatamarylandgovPublic-SafetyViolent-Crime-Property-Crime-by-County-1975-to-Prejwfa-fdxs accessed on 472017)
According to the Montgomery County Police Department the observed large increase is due to changes in
the definition of the offense and reporting protocol Thus in 2015 Maryland enacted the new definition
of rape established by the FBI which defines rape more inclusively than the previous one did Also in
2015 the police department modified the reporting on this category to include child abuse cases involving
rape25 Reported murders in Montgomery County which were highest (32) in 2002 fluctuated around 20
per year between 2001 and 2008 and have since declined to no more than 16 in recent years In 2013 the
number of reported murders further declined to nine (9) However in 2014 the number of murder
doubled to 19 and increased by more than 10 (a 58 increase) to 29 in 2015
Table 4 compares the number and rate of occurrences (per 1000 residents) of Part I crimes reported in
2014 by the type of crime (violent versus property) across Marylandrsquos five large jurisdictions (Anne
Arundel County Baltimore City Baltimore County Montgomery County and Prince Georgersquos County)
These crimes when prosecuted are those most likely to be filed with the circuit court While the large
Maryland jurisdictions as a group represent 67 of the statersquos 2015 population they account for 74 of
25 See Montgomery County Police Annual Crime Report 2015 (httpwwwmontgomerycountymdgovpolcrimestatshtml accessed on 462016 pages 4 and 5) According to the report 89 (133) of the increase was attributed to the changes mentioned above Resulting number of rape reported in CY2015 is 145 which is comparable to the early 2000 level
21
the statersquos Part I crimes (80 of Part I violent crimes reported and 73 of Part I property crimes
reported)
Table 4 Number of Part I Crimes Reported for Large Jurisdictions in Maryland CY2015
Number of Crimes and Crime Rates Jurisdiction Population Part I Crimes Violent Crimes Property Crimes
N Rate N Rate N Rate
Montgomery 1017859 18566 182 2032 20 16534 162 Anne Arundel 555280 15109 272 2195 40 12914 233 Baltimore City 622454 41124 661 9680 156 31444 505 Baltimore County 892816 26902 301 4517 51 22385 251 Prince Georgersquos 892816 26386 296 4139 46 22247 249 Large Jurisdictions 3981225 128087 322 22563 57 105524 265 Statewide 5930538 172182 290 28311 48 143871 243 Montgomery 17 11 7 11 Large Jurisdictions 67 74 80 73
Crime rates are calculated per 1000 residents Sources Population(Calendar Year 2015) US Census Bureau Population Division American Community Survey 5-Year Population Estimate (httpsfactfindercensusgovfacesnavjsfpagescommunity_factsxhtml accessed on 492017) Number of Crimes (Calendar Year 2014) Maryland State Police Crime in Maryland ndash Uniform Crime Report ndash Uniform Crime Report Years 2004 2005 2010 2012-2015 (httpmdspmarylandgovPagesDownloadsaspx accessed on 492017)
Despite having the largest population in the state the overall 2015 crime rate of Montgomery County
(182 Part I crimes per 1000 residents 179 in 2014 and 177 in 2013) is much smaller than that of any
other large jurisdiction whose rates range from 272 to 661 with the average of 322 and the statewide
average (290) Thus those crimes are substantially underrepresented in Montgomery County
Specifically while 17 of the state population resides in the county only 11 of Part I crimes overall
(7 among Part I violent crimes and 11 of Part I property crimes) are accounted for by the county
Further Montgomery Countyrsquos crime rates are substantially lower than any of the large jurisdictionsrsquo
averages as well as the average for the state This is particularly noteworthy for violent crimes (murder
rape robbery and aggravated assault) Montgomery Countyrsquos violent crime rate is 20 crimes per 1000
residents half of Anne Arundel Countyrsquos rate (40 crimes per 1000 residents) and less than half of the
statewide average (48)
Impact on the Circuit Court Caseload
Montgomery Countyrsquos lower than average violent crime rate appears to be also reflected in the number of
criminal cases filed with the court During FY2015 6400 criminal cases (original and reopened) were filed
with Montgomery County Circuit Court (See Table 5) The number is slightly lower than the total number
of criminal cases filed with Anne Arundel County Circuit Court (6500 filings) which serves a population
that is 55 of Montgomery Countyrsquos population As a result the countyrsquos per capita criminal case filing
22
rate is also much smaller (62 case filings per 1000 residents) than any of the other large jurisdictions in the
state as well as the statewide average (129) In fact the countyrsquos per capita criminal case filings is the 2nd
lowest after that of Garrett County (59 filings per 1000 residents) tied 3rd with Howard County
Table 5 Number of Criminal Case Filings (FY2015) for Large Jurisdictions in Maryland
Case Filings and Filing Ratedagger
Informations amp District Court District Jury Jurisdiction Population Overall
Indictments Appeals Trial Prayers N Rate N Rate N Rate N Rate
Montgomery Anne Arundel
1040116 564195
6400 6524
62 116
4830 4166
46 74
1329 504
13 09
241 1810
02 32
Baltimore City Baltimore CountyPrince Georgersquos Large Jurisdictions Statewide
621849 831128 909535
3966823 6006401
16903 10775 8440
49042 77590
272 130 93 124 129
7567 5080 3488
25131 37413
122 61 38 63 62
864 780 232
3709 5324
14 09 03 09 09
8375 4793 4529
19748 33926
135 58 50 50 56
Montgomery 17 8 12 24 06 Large Jurisdictions 66 63 67 70 58
Crime rates are calculated per 1000 residents Sources Population(Calendar Year 2015) US Census Bureau Population Division 2015 American Community Survey 1-Year Estimates (httpsfactfindercensusgovfacesnavjsfpagescommunity_factsxhtml accessed on 492017) Criminal Case Filings (FY2015) Maryland Judiciary Maryland Judiciary FY2015 Annual Statistical Abstract (httpwwwcourtsstatemduspublicationsannualreportreports2015fy2015statisticalabstractpdf accessed on 4102017)
Table 5 also shows that Montgomery Countyrsquos substantially lower per capita filings rate is due to an
extremely low number of jury trial prayers from the District Court (241 filings 02 filings per capita) and a
lower than average filing rate of indictments and informations26 (46 filings per capita 7th lowest in the
state) The countyrsquos lower per capita filing rate is somewhat offset by its higher than average filings of
District Court appeals (13 filing per capita 7th highest in the state)
The number of the District Court jury trial prayers filed with Montgomery County Circuit Court in
FY2016 is far smaller than any other jurisdiction in the state (the next smallest is 18 filings per 1000
residents at St Maryrsquos County Circuit Court) This is due to the courtrsquos strict jury trial demand policy to
hold jury trials on the same day as the petition is filed with the court
26 For criminal cases handled in circuit courts in Maryland see httpwwwmontgomerycountymdgovcircuitcourtCourtCriminalDepartmentCriminalDepartmenthtmlCriminal-Cases-Handled--in-Maryland-Circuit-Courts
23
Figure 13 Circuit Court Original Criminal Case Filings by Case Type FY2000-FY2016
Source Montgomery County Circuit Court Data Processing
Figure 13 presents the trends of original criminal case filings at Montgomery County Circuit Court from
FY2000 to FY2016 As indicated above the courtrsquos criminal caseload consists of two types of cases those
filed with the court as indictments or informations and those forwarded from the District Court upon a
demand for a jury trial or an appeal over 80 of which are filed as appeals The number of the courtrsquos
overall original filings declined from 3900 in FY2001 to 2200 in FY2003 when the court implemented its
instant jury trial demand policy As a result the percentage of the courtrsquos original criminal case filings
forwarded from the District Court declined from 74 in FY2001 to 47 in FY2004 and continued to
decline reaching 39 in FY2013 though it slightly increased to 40 in FY2014 and FY2015 Between
FY2003 and FY2011 the number of filings increased from 2200 to 2700 but declined to the FY2003 level
in the following years
The number of criminal cases filed as indictments or informations in the court gradually increased from
around 1090 in FY2003 to 1490 in FY2011 Filings then declined to 1290 in FY2012 and remained
unchanged in FY2013 A slight increase in filings occurred in FY2014 and FY2015 reaching 1340 and
1350 respectively only to decline in FY2016 to 1190 Filings of cases tracked as complex (cases with
serious offenses such as homicide rape first and second degree sex offenses child abuse major fraud
24
arson and DNA cases) have also experienced increases and decreases over time In FY2016 original
indictment and information filings reached 303 which is a 12 decline from FY2015 (343)
Domestic Violence Statistics
Figure 14 presents the number of domestic violence (DV) incidents reported in Montgomery County
between 2000 and 2015 based on the Uniform Crime Report (UCR)27 The number of DV incidents declined
from 2220 in 2000 to 980 in 2010 followed by large increases over the next few years to 1430 in 2013
2203 in 2014 and 3044 in 2015 These large increases are due to the expanded definition of domestic
violence under HB116SB647 that was signed into law (Family Law Article sect4-501) in 2012 to improve
recording and tracking of DV crimes This new definition of DV was first used in the 2013 reporting
Prior to the law change the only reported relationships for consideration as a DV crime were spouses
(husband and wife) and cohabitant Under the new law 10 additional relationships are included 28
In contrast to the trend in the countyrsquos DV incidents which appears to show a declining trend followed by
large increases in recent years the number of original filings of DV petitions for a protective order in
Montgomery County Circuit Court and the District Court (RockvilleSilver Spring locations) shown in
Figure 15 exhibits a gradual increase from 2200 to 2800 between FY2005 and FY2010 For the past five
years the number has been fairly constant between 2700 and 2900 filings per year except for FY2016
when the filings surged by 400 to 3270 Approximately 75 of DV petitions filed in Montgomery County
were filed with the District Court with the remaining 25 filed with Montgomery County Circuit Court
though the ratio has shifted in the last few years In FY2015 and FY2016 less than 20 of DV petitions
were filed with the circuit court29
27 Maryland State Police Crime in Maryland ndash Uniform Crime Report ndash Uniform Crime Report Years 2004 2005 2010 2012-2015 (httpmdspmarylandgovPagesDownloadsaspx accessed on 492017) 28 Maryland State Police Crime in Maryland ndash Uniform Crime Report Year 2015 (httpmdspmarylandgovDocument20DownloadsCrime20in20Maryland20201520Uniform20Crime20Reportpdf accessed on 41017) See pages 51-53 According to the report of the 27785 27242 and 30534 DV incidents reported statewide for 2013 2014 and 2015 respectively 61 (16817) 55 (15055) and 50 (15301) met the previous definition of DV If we apply those rates to the Montgomery Countyrsquos numbers reported for 2013 (1430) 2014 (2203) and 2015 (3044) we obtain 866 1217 and 1525 DV cases that would meet the lsquooldrsquo definition of DV in the past three years 29 According to the Maryland Judiciary (httpwwwcourtsstatemdusdistrictabouthtmlstats) the numbers of DV petitions filed with the District Court (at Rockville and Silver Spring Locations) are 2331 in FY2015 and 2709 in FY2016 whereas those filed with Montgomery County Circuit Court are 493 (17 of the total filed in Montgomery County) in FY2015 and 559 (17) in FY2016
25
Figure 14 Domestic Violence Incidents Reported in Montgomery County 2000-2015
Note the increase in the number of reported incidence since 2013 is in part due to expanding the definition of domestic violence See Maryland State Police Crime in Maryland ndash Uniform Crime Report Year 2015 (page 50) (httpmdspmarylandgovDocument20DownloadsCrime20in20Maryland20201520Uniform20Crime20Reportpdf accessed on 492017) Source Maryland State Police Crime in Maryland ndash Uniform Crime Report ndash Uniform Crime Report Years 2004 2005 2010 2012-2015 (httpmdspmarylandgovPagesDownloadsaspx accessed on 492017)
The number of protective order petitions filed with the circuit court and the District Court and the
number of DV incidents reported to the police do not coincide for several reasons A petition to seek
protection from DV can be filed with or without such incidents Parties involved in a single incident may
file petitions separately to seek protection from one another An individual may file a petition for
protective order more than once over time The same parties may be involved in multiple incidents
reported to the police Furthermore petitions filed in the circuit courts include some that have been
transferred from the District Court due to existing family law cases involving the parties or on appeal by a
party Parties who are victims of DV but are not eligible for protective orders may instead file a petition
for peach order with the District Court to seek protection30 The observed divergence between the
number of incidents and that of petitions might also be an indication of latent domestic violence cases that
are not reported to the police where victims may be proceeding directly to court to obtain protective
orders
30 For additional information regarding protective and peach orders in Maryland see the Peoplersquos Law Library of Maryland at httpswwwpeoples-laworgcomparing-protective-and-peace-orders General information on seeking protection from DV is available from Maryland Judiciary (httpmdcourtsgovlegalhelpdomesticviolencehtml) and the Peoplersquos Law Library of Maryland (httpswwwpeoples-laworgcatdomestic-violence) as well as Montgomery County Sheriffrsquos Office (httpwwwmontgomerycountymdgovsheriffsectionsdomestic-violencehtml)
26
Figure 15 Domestic Violence Case Filings (Original) in Montgomery County Circuit and District Courts FY2005-FY2016
Note Circuit Court DV filings also include those DV cases that were transferred from the District Court by jurisdictional transfer or appeal Sources Circuit Court data Montgomery County Circuit Court Data Processing District Court data District Court of Maryland Statistics FY2005-2015 (httpwwwcourtsstatemdusdistrictabouthtmlstats accessed on 492017)
While Montgomery County Circuit Court and the District Court serve as the primary source of legal
assistance for protection from domestic violence county residents often seek other types of assistance in
addressing these situations For example Montgomery Countyrsquos Family Justice Center (FJC)31 provides
information and services (both legal and non-legal) to residents seeking domestic violence assistance The
FJC also provides assistance to domestic violence victims in completing court paperwork obtaining legal
assistance and serves as a remote site for victim attendance and testimony using video-conference
technology at court hearings on ex-parte temporary protection order petitions conducted by the countyrsquos
Circuit Court and District Court (Rockville location)
31 httpwwwmontgomerycountymdgovfjc (accessed on 5182017)
27
Workload and Case Processing Analysis
One of the goals of Montgomery County Circuit Court is to demonstrate accountability This is achieved
through the courtrsquos continuous reviews of its workload and case processing performance Monitoring of
workload and case processing performance with particular attention to certain metrics such as filings
terminations clearance rate and time to disposition allows the court to address areas in need of
improvement Following the identification of these focus areas research staff performs more in-depth
analyses of the courtrsquos data and presents results to court leadership on a regular basis to facilitate the
development of effective court and case management strategies
Workload Analysis
Key workload metrics that the court reviews include the number of filings terminations hearings and
trials that occur annually in civil criminal family and juvenile32 cases The following figures highlight
information related to these key workload metrics
Figure 16 Number of Cases Filed by Case Type FY2000 - FY2016
Nu
mb
er o
f F
ilin
gs
21000
18000
33 (12563)
32 (12307)
20 (7576)
15 (5628)
Family 42 (14705)15000
12000 Civil 32 (11421)
9000 Criminal6000 19 (6670)
3000 Juvenile
0 7 (2551)
Fiscal Year
Source Montgomery County Circuit Court Data Processing Transfer of the juvenile court from the District Court to Montgomery County Circuit Court occurred in 2002 Data for fiscal years prior to 2003 was obtained from the Maryland Judiciary
Montgomery County Circuit Court case filings (original and reopen) averaged 37325 between FY2000 and
FY2016 ranging from a low of 33200 filings in FY2006 to a high of 44800 filings in FY2010 Figure 16
32 Juvenile cases include juvenile delinquency cases and child welfare cases such as child in need of assistance (CINA) and termination of parental rights (TPR) cases
28
displays the total number of filings by case type between FY2000 and FY2016 Family and criminal filings
have increased over the past 17 years by 19 Civil filings exhibited a substantial increase between
FY2007 and FY2010 from 11806 to 18225 filings mainly due to a large increase in foreclosure filings In
FY2011 civil filings dropped by 33 to 12225 and remained at that level since FY2013 The 66 decline
in juvenile filings between FY2000 and FY2016 is worthy of note Between FY2000 and FY2007 the
number of juvenile filings declined by 48 from 7600 to 3900 with an annual average decline of 521
filings per year Juvenile filings subsequently declined by 47 from FY2010 to FY2015 with an annual
average decline of 437 filings per year A slight increase of 4 occurred in juvenile filings between
FY2015 and FY2016 from 2464 to 2551
Table 6 Filing Percentages by Case Type FY2000 - FY2016
2000 2001 2002 2003 2004 2005 2006 2007 2008 2009 2010 2011 2012 2013 2014 2015 2016
Civil 33 32 32 33 34 33 31 33 37 39 41 31 32 33 35 34 32
Family 32 34 36 38 37 39 40 39 36 35 34 38 40 40 41 41 42
Juvenile 20 16 14 14 14 13 13 11 10 10 10 11 10 10 8 7 7
Criminal 15 18 18 15 15 15 16 17 17 16 15 19 18 17 17 18 19
As shown in Table 6 across case types between FY2000 and FY2016 filings initiated from a family or civil
petitioncomplaint comprised a minimum of 65 to a maximum of 75 of the courtrsquos overall filings
The representation of civil filings among all court case filings increased from 33 in FY2007 to 41 in
FY2010 reflecting the large influx of foreclosure filings during that period As a result of this change in
civil filings between FY2007 and FY2010 the percentage of family filings among all case filings declined
from 39 to slightly over one-third (34) Between FY2012 and FY2016 however family cases
comprised at least 40 of all original and reopened filings Criminal filings have remained relatively
constant over time representing less than 20 of the courtrsquos total case filings Juvenile (including
delinquency and child welfare) cases have been in decline since FY2013 representing 7 of all filings in
FY2015 and FY2016
29
34 (12947)
32 (12062)
19 (7388)
15 (5577)
Figure 17 Number of Cases Terminated by Case Type FY2000 - FY2016 N
um
ber
of
Ter
min
atio
ns
Fiscal Year
21000
18000
15000
12000
9000
6000
3000
0
Family 41 (14941)
Civil 35 (12705)
Criminal 18 (6531)
Juvenile 7 (2492)
Source Montgomery County Circuit Court Data Processing Transfer of the juvenile court from the District Court to Montgomery County Circuit Court occurred in 2002 Data for fiscal years prior to 2003 was obtained from the Maryland Judiciary
Montgomery County Circuit Court case terminations (original and reopen) averaged 37300 between
FY2000 and FY2016 ranging from a low of 33086 filings in FY2007 to a high of 44600 filings in
FY2010 Figure 17 highlights the total number of case terminations by case type between FY2000 and
FY2016 The termination trends are similar to the filing trends displayed in Figure 16 Family and
criminal terminations have increased over the past 17 years by 24 and 17 respectively Juvenile
terminations experienced a 66 decline in terminations between FY2000 and FY2016 comparable to
decline experienced in filings during the same period
30
Table 7 Termination Percentages by Case Type FY2000 - FY2016
2000 2001 2002 2003 2004 2005 2006 2007 2008 2009 2010 2011 2012 2013 2014 2015 2016
Civil 34 32 32 33 35 34 33 31 34 35 40 38 33 31 35 34 35
Family 32 34 35 37 37 38 40 40 38 36 34 34 40 40 40 41 41
Juvenile 19 16 14 14 13 12 12 10 11 11 11 11 10 11 8 6 7
Criminal 15 18 19 16 15 15 16 18 17 17 16 17 18 18 17 18 18
Across case types slightly over two-thirds to three-quarters of case terminations are family or civil matters
(see Table 7) In FY2010 and FY2011 40 and 38 of the total terminations were civil matters
reflecting the courtrsquos efforts to process a large number of foreclosure cases and slightly over one-third
were family matters Similar to the past three fiscal years in FY2015 civil matters represent slightly over a
third of total terminations whereas 41 of the total terminations were family matters Since FY2000 no
more than 20 of the total terminations have been criminal or juvenile (delinquency and child welfare)
case terminations
One of the ways to assess how efficiently courts are processing cases is to monitor the clearance rate
which is calculated by dividing the number of terminations by filings for a given time period A clearance
rate over 100 indicates that a court has more case terminations than filings suggesting higher case
processing efficiency possibly addressing case backlog In contrast a clearance rate of less than 100
indicates that the court was not able to close as many cases as were filed
31
Figure 18 Overall Case Clearance Rate (original and reopened) Overall and by Case Type FY2000-2016
Source Montgomery County Circuit Court Data Processing Transfer of the juvenile court from the District Court to Montgomery County Circuit Court occurred in 2002 Data for fiscal years prior to 2003 was obtained from the Maryland Judiciary
According to the National Center for State Courts (NCSC) CourTool Measure 2 (Clearance Rates)
courts should aspire to clear (ie dispose of) at least as many cases as have been
filedreopenedreactivated in a period by having a clearance rate of 10033 Montgomery County Circuit
Courtrsquos clearance rate analysis includes reactivated cases (ie those cases whose status has returned from
an inactive period as well as those whose status has been reopened from a previous closure) within its
universe of open cases
Figure 18 presents the courtrsquos annual case clearance rates by case type for FY2000 through FY2016 By
the end of FY2016 the courtrsquos overall clearance rate was at 104 ranging from a low of 93 in FY2009
to a high of 113 in FY2011 The minimum and maximum overall clearance rate values were largely
driven by civil filings and terminations For the past 17 years 91 of the case type specific clearance rates
were at 95 or above and 73 were at 99 or above
The civil clearance rate exhibits the most variability ranging from a low of 84 in FY2008 to a high of
138 in FY2011 Despite continued increases in civil filings between FY2009 and FY2010 (approximately
33 Additional information on the National Center for State Courtsrsquo CourTools is available from its website httpwwwcourtoolsorg
32
9) the civil clearance rate improved from 84 to 98 The overall clearance rate improved to 113 in
FY2011 and that improvement was driven primarily by the high civil clearance rate (138) This
improved civil clearance rate was due to the large drop in civil filings combined with only a slight decline
in civil terminations between FY2010 and FY2011
In FY2012 the overall clearance rate was 102 suggesting that the court was able to maintain an efficient
level of case processing across case types In FY2013 however the overall clearance rate declined to 97
which was the result of declines in the civil and family clearance rates The decrease in the civil clearance
rate was primarily driven by the declined clearance rate among original civil cases and Register of Wills
cases The declined clearance rate in family cases was driven by reopened family case terminations relative
to filings
In the past three fiscal years the courtrsquos overall clearance rates reached if not slightly exceeded 100
Between FY2014 and FY2015 all case-type specific clearance rates increased or remained unchanged
except for juvenile which declined from 104 in FY2014 to 93 in FY2015 Between FY2015 and
FY2016 the clearance rates increased for all case types except for criminal which declined by two
percentage points from 100 in FY2015 to 98 in FY2016 The original clearance for circuit court
criminal cases in FY2016 is 99 which is down slightly from 102 in FY201534 The original clearance
rate for cases transferred from the District Court either as a jury trial demand or appeal is 93 in FY2016
down from 98 in FY2015 The clearance rate for their reopened cases also declined to 94 in FY2016
from 103 in FY2015 District Court criminal original and reopened filings increased between FY2015
and FY2016 (by 11 and 18 respectively) providing a possible reason for the declined clearance rates
for these cases in FY2016 In contrast original circuit court criminal filings decreased by 12 (from 1355
to 1195)35
The original clearance rate for juvenile cases remained comparatively low at 94 in FY2015 increasing to
96 in FY2016 When the original juvenile clearance rate is examined by specific case type (delinquency
CINA and TPR) it appears that the delinquency clearance rate has the largest impact on the overall
juvenile clearance rate which declined from 108 in FY2014 to 94 in FY2015 and 96 in FY2016
The CINA clearance rate has also declined to 93 in FY2015 and FY2016 from 117 in FY2014
34 The reopened clearance rate for Circuit Court criminal cases in FY2016 increased from 98 to 100 35 The Circuit Courtrsquos reopened criminal case filings increased between FY2015 and FY2016 from 3549 to 3679 (4)
33
Figure 19 Number of Hearings Set and Held FY2000 - FY2016
Nu
mb
er o
f H
eari
ngs
80000
70000
60000
50000
40000
30000
20000
10000
0
475
62
488
93
504
07 587
27
317
02
324
15
332
73 414
54
Hearings Set
593
11
616
33
621
02
658
10
650
18
645
11
680
67
419
16
425
88
445
02
444
61
439
92
456
81
469
28
Hearings Held
661
84
609
30
605
26
572
79
557
05
579
66
465
64
423
10
418
17
387
28
378
13
395
75
2000 2001 2002 2003 2004 2005 2006 2007 2008 2009 2010 2011 2012 2013 2014 2015 2016
Fiscal Year
Source Montgomery County Circuit Court Data Processing Transfer of the juvenile court from the District Court to Montgomery County Circuit Court occurred in 2002 Juvenile hearing data for fiscal years prior to FY2003 is not reflected due to differences in data collection approaches prior to the transfer
Figure 19 displays the number of hearings set and held between FY2000 and FY2016 Since FY2000 the
number of matters set for hearings increased by 21 and the number of hearings held increased by 24
(when excluding juvenile hearings held in the District Court for FY2000-FY2002) There was a relatively
large increase in hearings set and held (over 8000 hearings) between FY2002 and FY2003 This increase is
related to the transfer of juvenile jurisdiction from the District Court to the Montgomery County Circuit
Court as well as administrative changes made to judgesrsquo calendars in compliance with Maryland Rule 9-
20836 Between FY2003 and FY2016 the court experienced a 1 drop in hearings set and a 5 decrease
in hearings held despite increases up until 2010 Due to how data related to hearings set and held are
entered into the courtrsquos case management system the hearings held may not correlate directly with those
that are set For example some hearings that are ultimately held may not have been originally set as a
hearing but rather as a conference
36 For additional information regarding Maryland Rule 9-208 please access the following link httpwwwlexisnexiscomhottopicsmdcode and access the Maryland Rules
34
Figure 20 Number of Trials Set versus Held FY2000 - FY2016
Nu
mb
er o
f T
rial
s
12000
10000
8000
6000
4000
2000
0
626
8
652
5
615
2
836
6 911
3 977
6
103
85
102
82
103
39
986
2
895
945
858 123
8
124
7
137
8
133
3
127
0
147
7
149
9
Trials Set Trials Held
106
64
884
2
823
7
839
2
784
9
768
4
156
0
163
9
160
7
158
6
155
8
141
5
847
5 1
507
2000 2001 2002 2003 2004 2005 2006 2007 2008 2009 2010 2011 2012 2013 2014 2015 2016
Fiscal Year Source Montgomery County Circuit Court Data Processing Transfer of the juvenile court from the District Court to Montgomery County Circuit Court occurred in 2002 Juvenile adjudicationtrial data for fiscal years prior to FY2003 is not available
Figure 20 depicts the number of trials set and held between FY2000 and FY2016 37 Since FY2000 the
court experienced a 35 increase in the number of matters set for trial and a 68 increase in the number
of trials held As stated above part of the increases in the numbers of trials set and held in particular
those increases between FY2002 and FY2003 are due to the transfer of the jurisdiction over juvenile cases
from the District Court to Montgomery County Circuit Court in FY2003 There was a noticeable decline
in the number of trials set (17) from 10664 in FY2010 to 8842 in FY2011 The decline in trials set
continued into FY2012 however it was less dramatic (7 decline) This drop is likely the result of efforts
implemented as part of the revised criminal differentiated case management (DCM) plan which
established 4-215 hearings aimed at scheduling trials on agreed-upon dates in criminal cases With parties
being actively involved in scheduling their trial dates the need for postponements due to scheduling
conflicts was anticipated to decline The decline in trials set between FY2010 and FY2012 is also due in
part to the implementation of settlement conferences in Track 3 civil cases which allow parties another
opportunity for resolution prior to setting the trial date There was a slight increase in the number of trials
set between FY2012 and FY2013 (2) related to an increase (14) in criminal trial settings Since
37 Depending on when the trial is set and held within the fiscal year the trials held may not be of those set For example if a trial is held at the beginning of one fiscal year it may have been set in the previous fiscal year
35
FY2013 overall trial settings have declined until FY2016 when trial settings increased from 7684 in
FY2015 to 8475 (a 10 increase)
416 (46)
210 (23)
220 (30)
895
125 115
Civil Juvenile
114
Family Criminal
Figure 21 Number and Percentage of Trials Held by Case Type38 FY2000 - FY2016
1800
1600
1400
1200
1000
800
600
400
200
0
1507
946 (63)
262 (17) 216 (14)
83 (6)
2000 2001 2002 2003 2004 2005 2006 2007 2008 2009 2010 2011 2012 2013 2014 2015 2016
Fiscal Year
Nu
mb
er o
f T
rial
s
Source Montgomery County Circuit Court Data Processing Transfer of the juvenile court from the District Court to Montgomery County Circuit Court occurred in 2002 Juvenile adjudicationtrial data for fiscal years prior to FY2003 is not available
Figure 21 displays trials held by case type between FY2000 and FY2016 The greatest increases in the
number of trials held occurred between FY2002 and FY2003 (an increase of 380 trials held (44) from
858 to 1238) FY2004 and FY2005 (an increase of 131 trials held (11) from 1247 to 1378) and FY2007
and FY2008 (an increase of 207 trials held (16) from 1270 to 1477) The increase in trials held between
FY2002 and FY2003 is due to the transfer of the juvenile court but also due to a 79 increase in family
trials held from 333 in FY2002 to 595 in FY2003 due to the aforementioned rule change in family law
The increase in trials held between FY2004 and FY2005 is driven by a 65 increase in the number of
criminal trials held specifically court trials (as opposed to jury trials) which increased from 64 to 174
(172) In FY2005 criminal trials held represent 20 of all trials held The increase in trials held
between FY2007 and FY2008 is driven by increases in civil and juvenile trials held by 33 and 36
respectively The number of trials held across all case types decreased between FY2013 and FY2015
Between FY2015 and FY2016 the number of trials held increased for juvenile and family cases resulting in
an overall trial held increase during that period of 7
38 Register of Wills (ROW) trials are included There were two ROW trials in FY2011 and none in the remaining fiscal years represented
36
The court also performed a preliminary analysis of trial date certainty as defined by the National Center for
State Courts (NCSC) in its CourTool Measure 5 According to the NCSC trial date certainty is the
number of times cases disposed by trial are scheduled for trial One way to examine trial date certainty is
by the proportion of cases that meet a specific performance goal set by the court One possible
benchmark according to NCSC is to have 90 of the courtrsquos cases hold trial in nor more than two trial
settings among cases disposed by trial Using this as a preliminary benchmark Montgomery County
Circuit Court meets that goal for trials overall and for all case-specific trials except criminal trials
specifically Only 795 of criminal trials were held in no more than two settings
Table 8 Number and Percentage of Cases with Trials Held within Two Trial Settings FY201639
Case Type Total Within Two Trial Settings N
Criminal 234 186 795 Family 974 954 979 Juvenile 84 80 952 Civil 263 254 966 Total 1555 1474 948
The question about whether trials are held when initially set has yet to be fully explored It is widely
understood that due to the increased availability of Alternative Dispute Resolution (ADR) as well as the
use of other means to resolve cases prior to trial (eg resolution and settlement conferences) trials serve
as an effective if relatively rarely utilized mechanism for the resolution of cases that cannot be otherwise
disposed By encouraging the earliest appropriate resolution of cases case management allows fewer trials
to be set and when set held with greater certainty
39 Data should be considered preliminary as decisions rules related to the operationalization of cases for the lsquotrial date certaintyrsquo measure are ongoing
37
Case Processing Analysis
As part of its effort to increase the efficiency of case processing operations and maintain cases at an
optimum level Montgomery County Circuit Court established a Differential Court Management (DCM)
plan for each case type (civil criminal family and juvenile) pursuant to the Maryland Rules of Procedure
(Rule 16-202(b)) These plans establish performance guidelines for each case type creating a schedule of
deadlines and hearings related to the complexity of the case and dedicating increasing judicial resources as
case complexity increases
The DCM scheduling guidelines are more detailed than the statewide case processing performance
standards and support the courtrsquos efforts to meet or exceed the statewide performance goals The
statewide performance standards which were developed by the Maryland Judiciary in 2000 are utilized by
all Maryland circuit courts and the District Court to evaluate their case processing performance and case
processing efficiency For circuit courts case processing time standards are available for seven case types
including civil criminal family juvenile delinquency child in need of assistance (CINA) shelter care
CINA non-shelter care and termination of parental rights (TPR) The state case processing time
standards present to the citizens of Montgomery County and Maryland the performance expectations of
the judiciary as to the prompt resolution of cases in the furtherance of justice In addition the standards
establish goals against which courts examine their operations
38
Table 9 Statewide Caseflow Assessment Time Standards and Percent of Cases Closed within Time Standard Statewide Goals Montgomery County Performance and Statewide Average FY2012 ndash FY2016
Montgomery County Circuit Court Performance
FY2012 FY2013 FY2014 FY2015
WST WST WST WST
FY2016
WST
Maryland Caseflow Time Standards
Percentage Goal
Case Time
Maryland Statewide
Percentage (weighted)
FY2016
Civil Non-Foreclosures 98 3618 98 548 95
Civil-Foreclosures 96 2238 98 730 95
Criminal 96 2183 95 2083 94 2094 94 2242 92 2124 98 180 87
Limited Divorce Family Law 99 137 98 287 99 137 94
Other Family Law 94 7892 95 7866 94 8205 98 365 91
Juvenile Delinquency
CINA Shelter
95
74
1006
125
95
72
861
135
92
81
594
139
95
57
628
121
95
77
801
140
98
100
90
30
97
75
CINA Non-Shelter 98 81 66 50 89 56 100 45 92 39 100 60 96
TPR 97 37 96 27 100 20 100 27 100 23 100 180 61
Total (with 18345 17475Foreclosures)dagger
WST Percent of cases closed within the Maryland Caseflow Time Standards
17345
I The number o f civil terminations in FY2012-FY2015 is 6381 5763 6242 and 6106 These termination figures and associated performance percentages are not displayed because prior to FY2016 the Maryland Judiciary had a slightly different time standard for civil cases Please refer to the courtrsquos case processing report for this information httpwwwmontgomerycountymdgovcircuitcourtcourtPublicationsp ublicationshtml dagger The number o f family law terminations in FY2012-FY2013 is 8532 and 8144 These termination figures and associated performance percentages are not displayed because prior to FY2014 the Maryland Judiciary had slightly different time standards for family law cases Please refer to the courtrsquos case processing report for this information httpwwwmontgomerycountymdgovcircuitcourtcourtPublicationsp ublicationshtml Note The underlined WST values indicate those that met the Maryland Judiciaryrsquos time standard performance goal
39
17063 17174
As shown in Table 9 in FY2016 case processing performance was analyzed for a total of 17475 original
terminations civil (5856) criminal (2124) family law (FL) ndash limited divorce (287) FL-other (8205)
juvenile delinquency (801) child in need of assistance (CINA) (179) and termination of parental rights
(TPR) (23) Of the 179 CINA terminations 140 occur in shelter and 39 occur in non-shelter cases
A key measure of the annual case processing analysis is the percentage of cases terminated within the state-
defined time standards Between FY2015 and FY2016 CINA shelter case processing performance
improved Performance remained stable for juvenile delinquency and TPR cases but declined for the
remaining case types criminal family-limited divorce family law-other and CINA non-shelter
Additional analyses were undertaken by the court to better understand the decline in performance and
those results were shared with court leadership and with department managers
According to the Maryland Judiciary Montgomery County Circuit Court along with four other circuit
courts in Anne Arundel County Baltimore City Baltimore County and Prince Georgersquos County are
considered lsquolargersquo in size given their number of presiding judges In FY2016 Montgomery County Circuit
Court ranked or tied for first in the processing of criminal family law-other and TPR cases compared to
the other large jurisdictions (see Table 10) The courtrsquos civil family law-limited divorce and CINA cases
ranked second or third in case processing performance when compared with the other large jurisdictions
The court ranked fourth in the processing of juvenile delinquency cases It is important to note that some
of the differences between jurisdictions are rather minimal and jurisdictions may vary in their case
processing procedures which may ultimately contribute to differences in performance The court will
continue to examine its case processing performance on a quarterly basis engaging in discussions routinely
to minimize any gaps in case processing performance
Table 10 Percentage of Cases Closed within the Time Standard by Case Type Montgomery County vs Four rsquoLargersquo Jurisdictions FY2016
Rank Civil
General Civil
Foreclosures Limited Divorce
Family Law-Other Criminal
(548 days) (730 days) (730 days) (365 days)
1 Anne Arundel (99) Anne Arundel (100) Anne Arundel (100)
Montgomery (94)
Montgomery (92)
2 Montgomery
(98) Baltimore City
(97) Prince Georges
(100) Anne Arundel
(91) Prince Georgersquos
(92)
3 Baltimore City (97)
Montgomery (96)
Montgomery (98)
Prince George (89)
Baltimore County (89)
4 Prince Georges (93)
Prince Georgersquos (93)
Baltimore County (84)
Baltimore County (86)
Anne Arundel (87)
5 Baltimore County (92)
Baltimore County (92)
Baltimore City (79)
Baltimore City (83)
Baltimore City (79)
Table 10 Percentage of Cases Closed within the Time Standard by Case Type Montgomery County vs Four rsquoLargersquo Jurisdictions FY2016 Continued
Rank Juvenile
Delinquency CINA Shelter CINA Non-Shelter TPR
1 Anne Arundel (100)
Anne Arundel (100)
Anne Arundel (100)
Montgomery (100)
2 Prince Georges (99)
Prince Georgersquos (99)
Prince Georges (100)
Anne Arundel (96)
3 Baltimore City (96)
Montgomery (77)
Montgomery (92)
Baltimore County (69)
4 Montgomery
(95) Baltimore City
(71) Baltimore County
(64) Baltimore City
(63)
5 Baltimore County (93)
Baltimore County (58)
Prince Georges (43)
Note Figures are obtained from the Maryland Judiciaryrsquos statewide case assessment report except for Montgomery County Circuit Courtrsquos figures which are based on the performance of their entire complement of terminations for a particular fiscal year as opposed to a random sample of 500 terminations per case type
This document was prepared by
the Montgomery County Circuit
Court If you have any questions
about its content please contact
240‐777‐9100
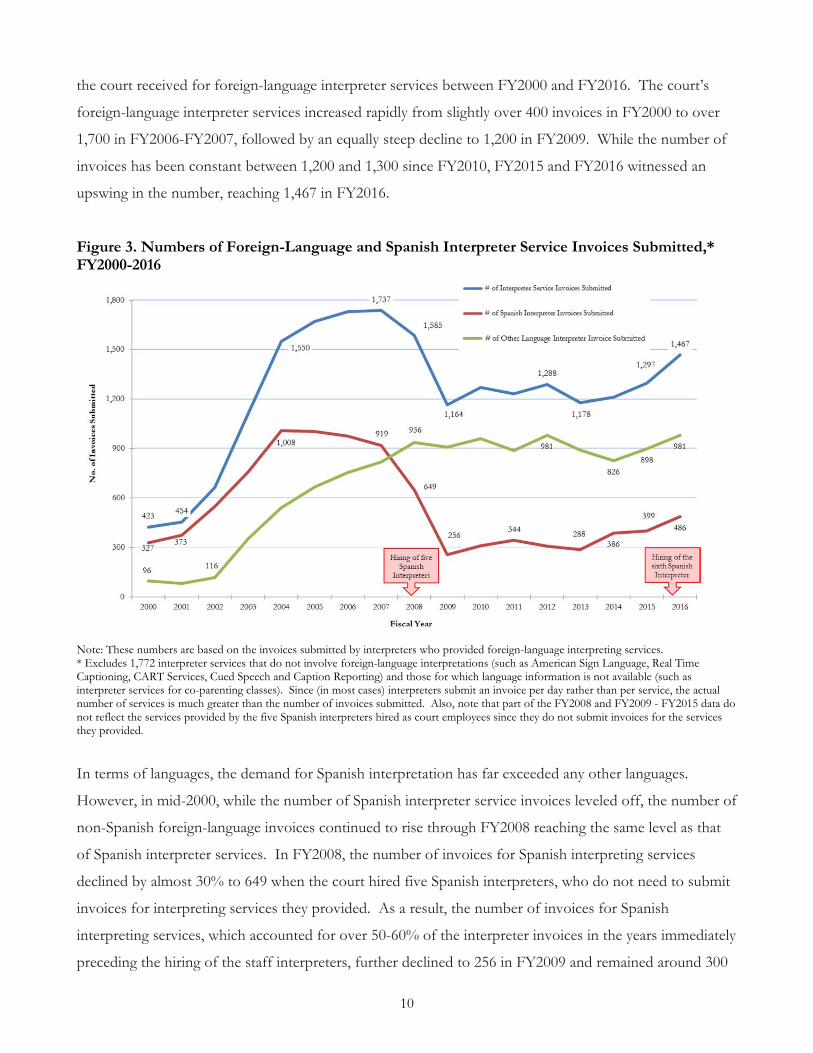
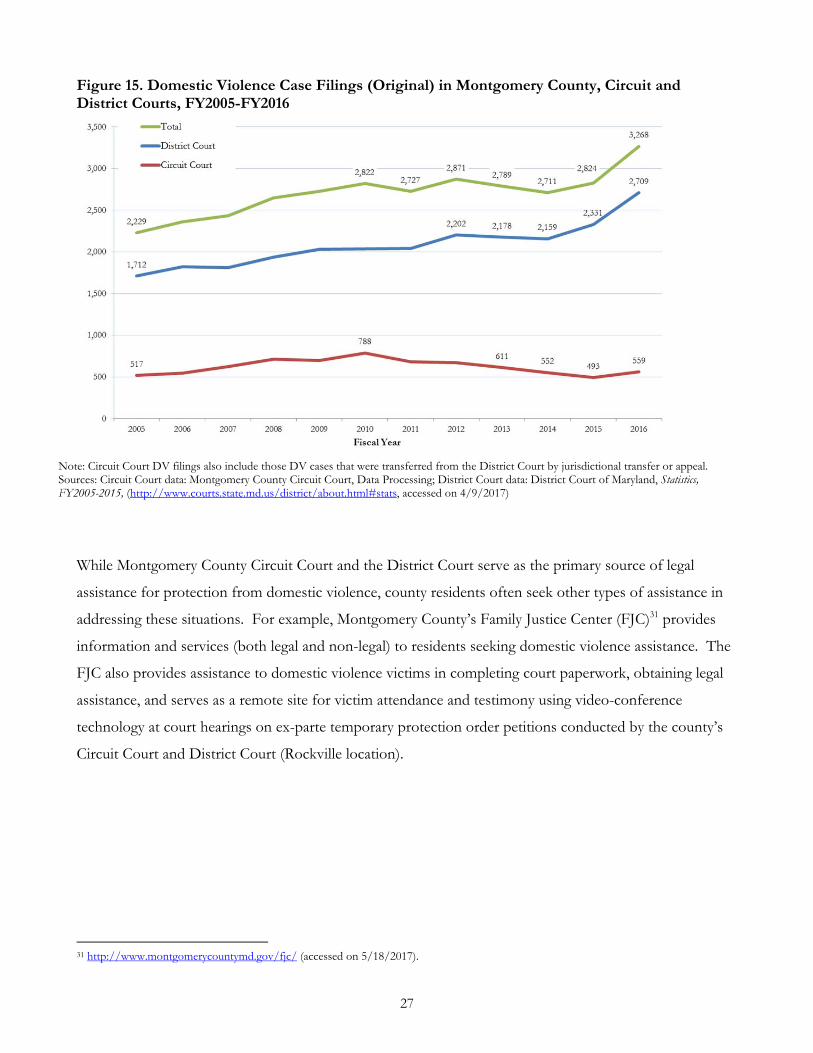
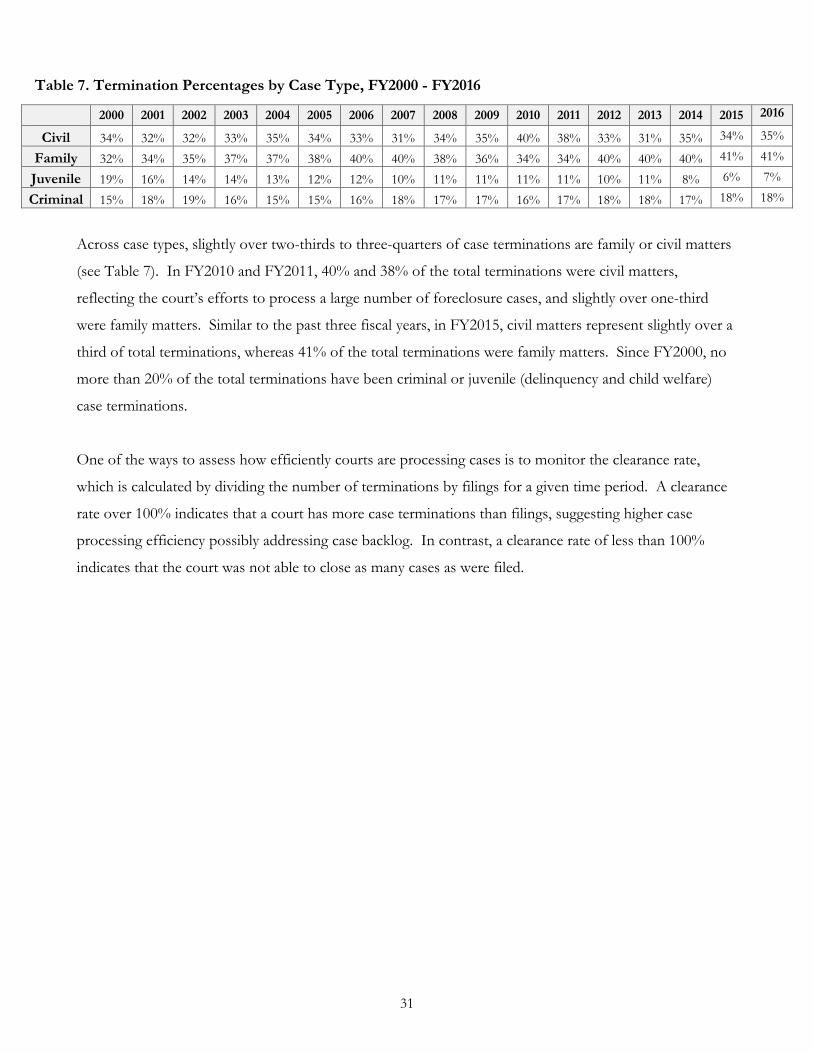

This document was prepared by
the Montgomery County Circuit
Court If you have any questions
about its content please contact
240‐777‐9100