FY2016 F-35 SAR
94
Selected Acquisition Report (SAR) RCS: DD-A&T(Q&A)823-198 F-35 Joint Strike Fighter Aircraft (F-35) As of FY 2016 President's Budget Defense Acquisition Management Information Retrieval (DAMIR) UNCLASSIFIED
-
Upload
dragon029 -
Category
News & Politics
-
view
588 -
download
1
Transcript of FY2016 F-35 SAR
Selected Acquisition Report (SAR)
RCS: DD-A&T(Q&A)823-198
F-35 Joint Strike Fighter Aircraft (F-35)As of FY 2016 President's Budget
Defense Acquisition ManagementInformation Retrieval
(DAMIR)
UNCLASSIFIED

F-35 December 2014 SAR
UNCLASSIFIED 2
Table of Contents Common Acronyms and Abbreviations for MDAP Programs 3
Program Information 5
Responsible Office 5
References 6
Mission and Description 7
Executive Summary 8
Threshold Breaches 11
Schedule 12
Performance 16
Track to Budget 20
Cost and Funding 24
Low Rate Initial Production 65
Foreign Military Sales 66
Nuclear Costs 66
Unit Cost 67
Cost Variance 73
Contracts 80
Deliveries and Expenditures 88
Operating and Support Cost 89
Common Acronyms and Abbreviations for MDAP Programs
Acq O&M - Acquisition-Related Operations and MaintenanceACAT - Acquisition CategoryADM - Acquisition Decision MemorandumAPB - Acquisition Program BaselineAPPN - AppropriationAPUC - Average Procurement Unit Cost$B - Billions of DollarsBA - Budget Authority/Budget ActivityBlk - BlockBY - Base YearCAPE - Cost Assessment and Program EvaluationCARD - Cost Analysis Requirements DescriptionCDD - Capability Development DocumentCLIN - Contract Line Item NumberCPD - Capability Production DocumentCY - Calendar YearDAB - Defense Acquisition BoardDAE - Defense Acquisition ExecutiveDAMIR - Defense Acquisition Management Information RetrievalDoD - Department of DefenseDSN - Defense Switched NetworkEMD - Engineering and Manufacturing DevelopmentEVM - Earned Value ManagementFOC - Full Operational CapabilityFMS - Foreign Military SalesFRP - Full Rate ProductionFY - Fiscal YearFYDP - Future Years Defense ProgramICE - Independent Cost EstimateIOC - Initial Operational CapabilityInc - IncrementJROC - Joint Requirements Oversight Council$K - Thousands of DollarsKPP - Key Performance ParameterLRIP - Low Rate Initial Production$M - Millions of DollarsMDA - Milestone Decision AuthorityMDAP - Major Defense Acquisition ProgramMILCON - Military ConstructionN/A - Not ApplicableO&M - Operations and MaintenanceORD - Operational Requirements DocumentOSD - Office of the Secretary of DefenseO&S - Operating and SupportPAUC - Program Acquisition Unit Cost
F-35 December 2014 SAR
UNCLASSIFIED 3

PB - President’s BudgetPE - Program ElementPEO - Program Executive OfficerPM - Program ManagerPOE - Program Office EstimateRDT&E - Research, Development, Test, and EvaluationSAR - Selected Acquisition ReportSCP - Service Cost PositionTBD - To Be DeterminedTY - Then YearUCR - Unit Cost ReportingU.S. - United StatesUSD(AT&L) - Under Secretary of Defense (Acquisition, Technology and Logistics)
F-35 December 2014 SAR
UNCLASSIFIED 4
Lt Gen Christopher BogdanF-35 Lightning II Program Office200 12th St SouthSuite 600Arlington, VA 22202-5402
Phone: 703-601-5650
Fax: 703-602-7649
DSN Phone: 329-5650
DSN Fax:Date Assigned: December 6, 2012
Program Information
Program Name
F-35 Joint Strike Fighter Aircraft (F-35)
DoD Component
DoD
Joint Participants
United States Navy; United States Air Force; United States Marine Corps; United Kingdom; Italy; The Netherlands; Turkey; Canada; Australia; Denmark; Norway
The F-35 Program is a joint DoD program for which Service Acquisition Executive Authority alternates between the Department of the Navy (DoN) and the Department of the Air Force, and currently resides with the DoN.
Responsible Office
F-35 December 2014 SAR
UNCLASSIFIED 5

References
F-35 Aircraft
SAR Baseline (Development Estimate)
Defense Acquisition Executive (DAE) Approved Acquisition Program Baseline (APB) dated March 26, 2012
Approved APB
Defense Acquisition Executive (DAE) Approved Acquisition Program Baseline (APB) dated June 18, 2014
F-35 Engine
SAR Baseline (Development Estimate)
Defense Acquisition Executive (DAE) Approved Acquisition Program Baseline (APB) dated March 26, 2012
Approved APB
Defense Acquisition Executive (DAE) Approved Acquisition Program Baseline (APB) dated June 18, 2014
F-35 December 2014 SAR
UNCLASSIFIED 6

Mission and Description
The F-35 Joint Strike Fighter Aircraft (F-35) Program will develop and field an affordable, highly common family of next-generation strike aircraft for the U.S. Navy, Air Force, Marine Corps, and allies. The three variants are the F-35A; F-35B; and the F-35C. The F-35A will be a stealthy multi-role aircraft, primarily air-to-ground, for the Air Force to replace the F-16 and A-10 and complement the F-22. The F-35B variant will be a multi-role strike fighter aircraft to replace the AV-8B and F/A-18A/C/D for the Marine Corps. The F-35C will provide the U.S. Navy a multi-role, stealthy strike fighter aircraft to complement the F/A-18E/F. The planned DoD F-35 Fleet will replace the joint services' legacy fleets. The transition from multiple type/model/series to a common platform will result in a smaller total force over time and operational and overall cost efficiencies.
F-35 December 2014 SAR
UNCLASSIFIED 7

Executive Summary
The F-35 remains the DoD largest cooperative acquisition program, with eight International Partners participating with the U.S. under Memorandums of Understanding for System Development and Demonstration and Production, Sustainment and Follow-on Development. Additionally, the program currently has three FMS customers. The F-35 program is executing well across the entire spectrum of acquisition, to include development and design, flight test, production, fielding and base stand-up, sustainment of fielded aircraft, and building a global sustainment enterprise.
The F-35 program continues to make solid and steady progress and is moving forward in a disciplined manner. Since the program re-baseline in 2011 the program has remained fundamentally on cost and on schedule to this new baseline. There were many successes as well as challenges in 2014. Successes include: completion of a very successful initial F-35C ship suitability sea trial aboard the USS NIMITZ logging 124 catapult launches, 124 arrestments and 222 touch-and-go landings; completing Block 2B software development; completing Block 2 Air-to-Surface weapons testing; starting Block 3 flight testing; commencing F-35 operations at Marine Corps Air Station Beaufort; continuing aircraft modification operations at Fleet Readiness Center East and at the Ogden Air Logistics Complex, completing production lot 5 aircraft deliveries including completing F-35A deliveries to Eglin Air Force Base (AFB), starting F-35A deliveries to Luke AFB and assigning regional Maintenance, Repair, Overhaul, and Upgrade (MRO&U) capabilities to Partners and FMS customers in Europe and Asia-Pacific.
In June 2014 an F-35A on take-off roll experienced a failure to the third stage rotor. The root cause of the AF-27 incident was due to excessive heat caused by rubbing between engine fan components, which led to a structural failure of the fan. This led to engine parts breaking free at high speed and damaging the aircraft resulting in the fire. Thankfully, the pilot successfully aborted the take-off and exited the aircraft with no injuries. The entire fleet was grounded on July 3, 2014 but flight operations were restored in a limited capacity on July 14, 2014. Return to flight imposed additional restrictions on flight operations including limiting maneuverability in Mach and amount of g-forces the pilot could demand of the aircraft as well as inspections of the engine after every three flight hours. This additional workload and aircraft limitations slowed the pace of developmental testing and added to the maintenance burden in the operational units. Throughout the summer and into the fall, the Joint Program Office (JPO), Service System Commands and industry worked diligently to analyze the problem, prioritize test assets, and open the flight envelope in a safe, methodical fashion. This enabled the enterprise to continue flight testing in portions of the envelope previously restricted, and to provide some relief to the maintainers in the field. One key change was to increase the inspection interval from three to thirteen flight hours. The program was able to determine root cause, and developed an interim solution, a “pre-trenched” rub material that will be implemented in the field starting later this year. Pratt and Whitney (P&W) has agreed to cover the costs for the repairs to engines in the field and the cut-in of the solution to the production line, while the program office will pay for the design activity as per the development contract. The program continues its work on a long-term fix to the engine and expects to review and select from the design solutions this spring, followed by design and qualification testing, and, finally, incorporating the solution into the production line. This work should be done in 2015.
Another technical risk the program continues to monitor is the Autonomic Logistics Information System (ALIS). Because ALIS is such a critical part of the F-35 Air System, it is now treated as if it were its own “weapons system;” the Program has added new systems engineering processes that include periodic design reviews, a new leadership structure, improved lab infrastructure and testing to include warfighter involvement, and a more structured software delivery plan to include metrics. There is evidence of solid improvements over the past two years with better and faster incremental fixes, including updates made with the fielded versions of the software in 2014. Finally, there is a plan to field additional capability including a deployed version of ALIS in support of U.S. Marine Corps IOC in 2015.
The Program has initiated a rigorous Reliability and Maintainability (R&M) program that will establish R&M performance goals, take specific actions to achieve these goals, analyzing field data to make actionable decisions such as redesigning parts, improving repair times, and streamlining and improving maintenance procedures, accelerating aircraft retrofits and modifications to more rapidly improve readiness and to measure these R&M improvements.
From a business perspective, the Government recently awarded the contract for the 8th Production Lot of 43 airplanes and
F-35 December 2014 SAR
UNCLASSIFIED 8
is preparing to begin negotiations on Lots 9 and 10, which will be negotiated together, similar to Lots 6 and 7. Expectations are that the program will begin negotiations for Lot 11 in 2016. The price of F-35s continues to decline steadily Lot after Lot. For example, the price of a Lot 7 F-35A was 4.3% less than a Lot 6 F-35A aircraft and a Lot 8 F-35A aircraft was 3.6% less than a Lot 7 F-35A, including the engine and profit for both contractors. Reductions are expected to continue into the future and, by 2019, the expected price of an F-35A model, with an engine, and including profit, to cost between $80M and $85M, in 2019 dollars, close to the cost of many fourth generation fighters.
The Program continues to address the establishment of the Global Sustainment posture across Europe, Asia-Pacific, and North America. In 2014, the program began the process for assigning the repair capabilities to our Partner and FMS customers across these three regions. The first of these assignments were announced at the end of 2014 and included the regional MRO&U capabilities for airframes and engines for both the European and Pacific Regions. These initial MRO&U assignments will support near-term F-35 airframe and engine overseas operations and maintenance and will be reviewed and updated in approximately five years. In the European region, F-35 initial airframe MRO&U capability will be provided by Italy by 2018. Should additional airframe MRO&U capability be required, the United Kingdom would be assigned to supplement the existing capability. In the European region, engine heavy maintenance will initially be provided by Turkey, also in 2018, with The Netherlands and Norway providing additional capability approximately two to three years after Turkey’s initial capability. In the Pacific region, F-35 airframe MRO&U capability will be provided by Japan for the Northern Pacific and Australia for the Southern Pacific, with both capabilities required by early 2018. For F-35 engine heavy maintenance in the Pacific, the initial capability will be provided by Australia by early 2018, with Japan providing additional capability three to five years later.
On the international front, the program made significant progress with our International Participants, which includes FMS countries. The program is also building two Final Assembly and Checkout Facilities (FACOs) – one in Italy and one in Japan. Today there are aircraft being built on the production line at the FACO in Italy and, sometime in 2015, the Japanese will begin building their own F-35s at their FACO in Japan. No problems are anticipated with either facility at this time. Continuing on this international theme, the nation of South Korea signed a commitment to purchase 40 F-35A aircraft starting in Lot 10 and Israel added 14 more F-35As to their original 19-aircraft order last year, with a future additional purchase in two to three years. There are ongoing discussions with a number of other nations, to include Singapore and Spain, concerning FMS. Additionally, Canada has decided to wait until after its national elections this spring before deciding on its selection of a fighter replacement, although it remains a full Partner on the F-35 program. Finally, expectations are that Denmark will make its final fighter replacement selection sometime in the summer of 2015.
Affordability remains our number one priority. The program must finish development within the time and money the program has, must continue to drive the cost of producing F-35s down, and must continue to attack the long term life cycle costs of the F-35 weapon system. The program has engaged in a multi-pronged approach to reduce costs across production, and O&S. First, the program has an agreement with our contractor partners Lockheed Martin, Northrup Grumman and BAE Systems on reducing aircraft production costs through an effort the program has termed the “Blueprint for Affordability” and reducing cost on the F135 engine through Pratt & Whitney’s (P&W) current ‘War on Cost” efforts and future planned Blueprint for Affordability activities. The goal of which is to reduce the flyaway cost of the F-35A to between $80M and $85M by 2019. The effort involves the contractors investing funds upfront on cost reduction initiatives mutually agreed upon by the government and the contractor. The combination of Blueprint for Affordability, the Cost War Room efforts and the reliability and maintainability program have provided a viable path to reducing both the production cost of the aircraft and the long-term operations and sustainment costs of the F-35 weapon system. Overall, the SAR cost estimates are trending in the right direction. In aggregate, comparing SAR 13 to SAR 14, at the total cost summary level, the SAR 14 estimate reflects downward cost at approximately -$7.5B. This reflects Aircraft subprogram down approximately -$5.8B and Engine subprogram down approximately -$1.6B. In addition the PAUC and APUC were reduced. Finally, CAPE’s O&S cost estimate remains the same, but the JPO O&S estimate is down approximately -$57.8B.
In March 2012, in conjunction with the Milestone B decision, certification was made pursuant to section 2366b of title 10, United States Code (U.S.C.). However, at that time, the MDA waived provision (3)(c), which certifies that the JROC has accomplished its duties pursuant to section 181(b) of title 10, U.S.C., including an analysis of the operational requirements for the program. The JROC accomplished the bulk of its duties under section 181(b); however, because the IOC dates remained "TBD" by the Services, a waiver has been in place. In June 2013, the Services sent a joint report to the U.S. Congress detailing their IOC requirements and dates; however, until the USD(AT&L) certifies that this provision has been satisfied, the waiver remains in place. The Department will continue to review the F-35 program at least annually until the
F-35 December 2014 SAR
UNCLASSIFIED 9

certification requirement for this provision is satisfied.
Software development and integration continue to be the highest risks the program faces as it completes development. Failure of an engine component that led to an aircraft fire and aborted take-off at Eglin AFB in June 2014 placed additional burdens on the program. Other areas that are of high interest and have warranted specific management attention include ALIS, overall R&M, and beyond first-life durability testing. These are typical challenges faced during a development program and progress has been made against each of these in 2014.
In summary, the F-35 program is showing steady progress in all areas – including development, flight test, production, maintenance, and stand-up of the global sustainment enterprise. The program is currently on the right track and will continue to deliver on the commitments that have been made to the F-35 Enterprise. As with any big, complex development program, there will be challenges and obstacles. However, we have the ability to overcome any current and future issues, and the superb capabilities of the F-35 are well within reach for all of us.
F-35 December 2014 SAR
UNCLASSIFIED 10

APB Breaches
Schedule Performance Cost RDT&E
Procurement MILCON Acq O&M
O&S CostUnit Cost PAUC
APUC
Nunn-McCurdy Breaches
Current UCR Baseline PAUC NoneAPUC None
Original UCR Baseline PAUC NoneAPUC None
APB Breaches
Schedule Performance Cost RDT&E
Procurement MILCON Acq O&M
O&S CostUnit Cost PAUC
APUC
Nunn-McCurdy Breaches
Current UCR Baseline PAUC NoneAPUC None
Original UCR Baseline PAUC NoneAPUC None
Threshold Breaches
F-35 Aircraft
F-35 Engine
F-35 December 2014 SAR
UNCLASSIFIED 11

Schedule
F-35 December 2014 SAR
UNCLASSIFIED 12

F-35 Aircraft
Schedule Events
EventsSAR BaselineDevelopment
Estimate
Current APBDevelopment
Objective/Threshold
CurrentEstimate
Concept Demonstration Contract Award Nov 1996 Nov 1996 Nov 1996 Nov 1996
Milestone B Oct 2001 Oct 2001 Apr 2002 Oct 2001
EMD Contract Award Oct 2001 Oct 2001 Oct 2001 Oct 2001
Preliminary Design Review Apr 2003 Mar 2003 Mar 2003 Mar 2003 (Ch-1)
CDR
CDR (CTOL&Common) Feb 2006 Feb 2006 Feb 2006 Feb 2006
CDR (STOVL&Common) Feb 2006 Feb 2006 Feb 2006 Feb 2006
CDR (CV&Common) Jun 2007 Jun 2007 Jun 2007 Jun 2007
DAE (IPR 1) Mar 2006 Mar 2006 Mar 2006 Mar 2006
1st Flt CTOL Dec 2006 Dec 2006 Dec 2006 Dec 2006
DAE (IPR 2) Apr 2007 Apr 2007 Apr 2007 Apr 2007
1st Flt STOVL Jun 2008 Jun 2008 Jun 2008 Jun 2008
1st Flt CV Jun 2010 May 2010 May 2010 May 2010 (Ch-1)
1st Production Aircraft Delivered May 2011 May 2011 May 2011 May 2011
Milestone B Re-approval Mar 2012 Nov 2011 May 2012 Mar 2012
Block 2B Fleet Release Mar 2015 Mar 2015 Sep 2015 Jun 2015
USMC IOC TBD Jul 2015 Dec 2015 Jul 2015
USAF IOC TBD Aug 2016 Dec 2016 Aug 2016
Block 3F Fleet Release Aug 2017 Aug 2017 Feb 2018 Aug 2017
USN IOC TBD Aug 2018 Feb 2019 Aug 2018
Completed IOT&E Feb 2019 Feb 2019 Aug 2019 Feb 2019
Full Rate Production Decision Apr 2019 Apr 2019 Oct 2019 Apr 2019
DAB Milestone C Apr 2019 Apr 2019 Oct 2019 Apr 2019
Change Explanations
(Ch-1) The current estimate for the Preliminary Design Review has changed from April 2003 to March 2003 to reflect actual dates. The current estimate for the 1st Flight CV has changed from June 2010 to May 2010 to reflect actual dates.
F-35 December 2014 SAR
UNCLASSIFIED 13
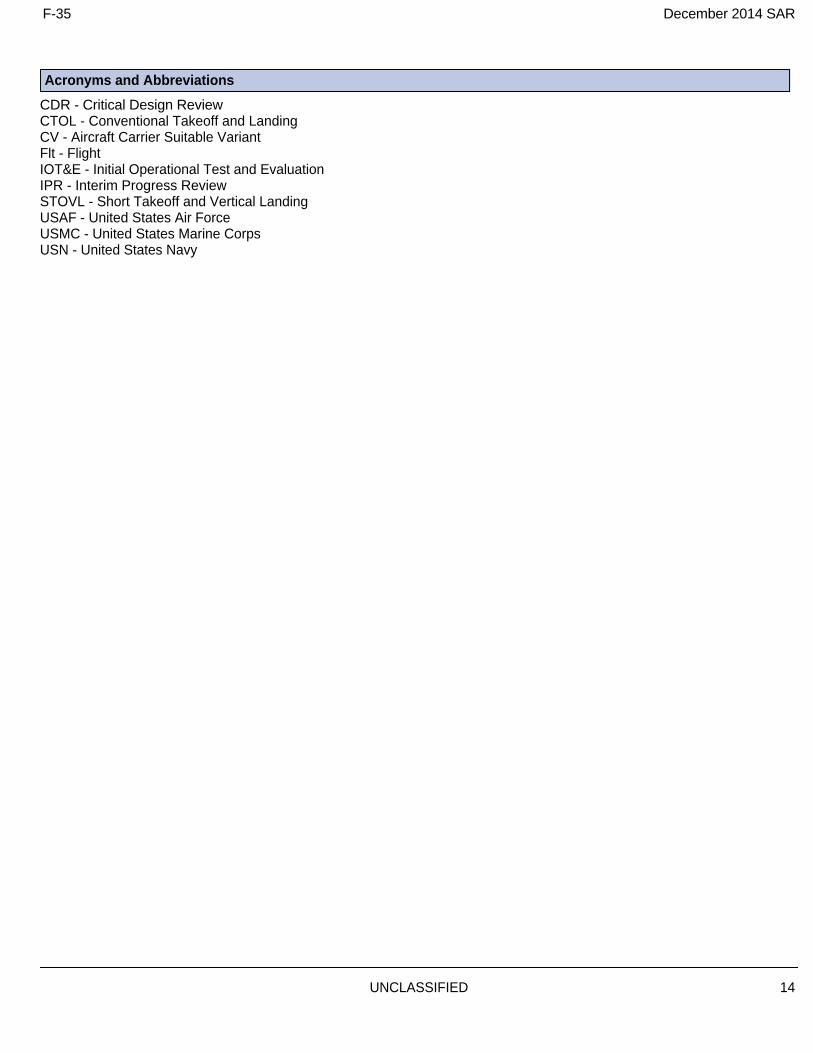
Acronyms and Abbreviations
CDR - Critical Design ReviewCTOL - Conventional Takeoff and LandingCV - Aircraft Carrier Suitable VariantFlt - FlightIOT&E - Initial Operational Test and EvaluationIPR - Interim Progress ReviewSTOVL - Short Takeoff and Vertical LandingUSAF - United States Air ForceUSMC - United States Marine CorpsUSN - United States Navy
F-35 December 2014 SAR
UNCLASSIFIED 14
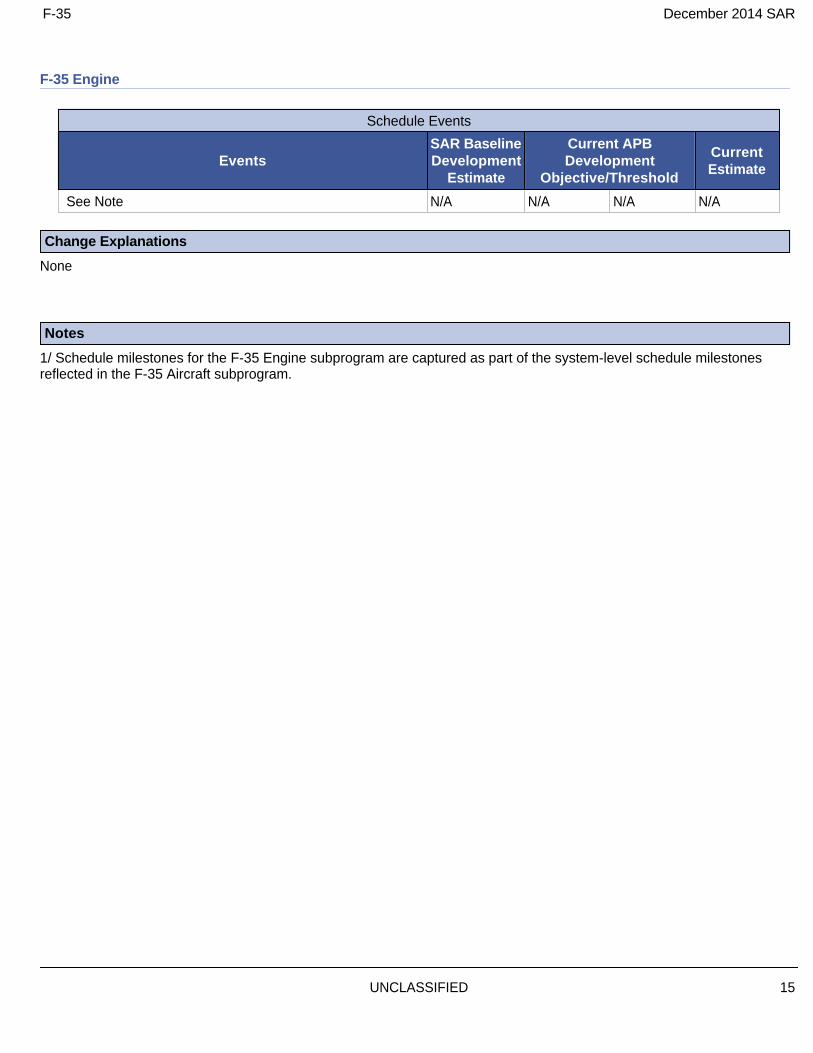
F-35 Engine
Schedule Events
EventsSAR BaselineDevelopment
Estimate
Current APBDevelopment
Objective/Threshold
CurrentEstimate
See Note N/A N/A N/A N/A
Change Explanations
None
Notes
1/ Schedule milestones for the F-35 Engine subprogram are captured as part of the system-level schedule milestones reflected in the F-35 Aircraft subprogram.
F-35 December 2014 SAR
UNCLASSIFIED 15

Performance
F-35 Aircraft
Performance Characteristics
SAR BaselineDevelopment
Estimate
Current APBDevelopment
Objective/Threshold
DemonstratedPerformance
CurrentEstimate
STOVL Mission Performance - STO Distance Flat Deck
With four 1000# JDAMs and two internal AIM-120s, full expendables, execute a 600 foot (450 UK STOVL) STO from LHA, LHD, and aircraft carriers (sea level, tropical day, 10 kts operational WOD) and with a combat radius of 550 nm (STOVL profile). Also must perform STOVL vertical landing with two 1000# JDAMs and two internal AIM-120s, full expendables, and fuel to fly the STOVL Recovery profile.
With four 1000# JDAMs and two internal AIM-120s, full expendables, execute a 600 foot (450 UK STOVL) STO from LHA, LHD, and aircraft carriers (sea level, tropical day, 10 kts operational WOD) and with a combat radius of 550 nm (STOVL profile). Also must perform STOVL vertical landing with two 1000# JDAMs and two internal AIM-120s, full expendables, and fuel to fly the STOVL Recovery profile.
With two 1000# JDAMs and two internal AIM-120s, full expendables, execute a 600 foot (450 UK STOVL) STO from LHA, LHD, and aircraft carriers (sea level, tropical day, 10 kts operational WOD) and with a combat radius of 450 nm (STOVL profile). Also must perform STOVL vertical landing with two 1000# JDAMs and two internal AIM-120s, full expendables, and fuel to fly the STOVL Recovery profile.
TBD Execute 569 ft. STO with 2 JDAM (internal), 2 AIM-120 (internal), fuel to fly 456nm
(Ch-1)
Combat Radius NM -CTOL Variant
690 690 590 TBD 614 (Ch-1)
Combat Radius NM -STOVL Variant
550 550 450 TBD 456
Combat Radius NM -CV Variant
730 730 600 TBD 610
Mission Reliability - CTOL Variant
98% 98% 93% TBD 97%
Mission Reliability - CV Variant
98% 98% 95% TBD 98%
Mission Reliability - STOVL Variant
98% 98% 95% TBD 98%
Logistics Footprint - CTOL Variant
Less than or equal to 6 C-17 equivalents
Less than or equal to 6 C-17 equivalents
Less than or equal to 8 C-17 equivalent loads
TBD Less than or equal to 6 C-17 equivalents
F-35 December 2014 SAR
UNCLASSIFIED 16
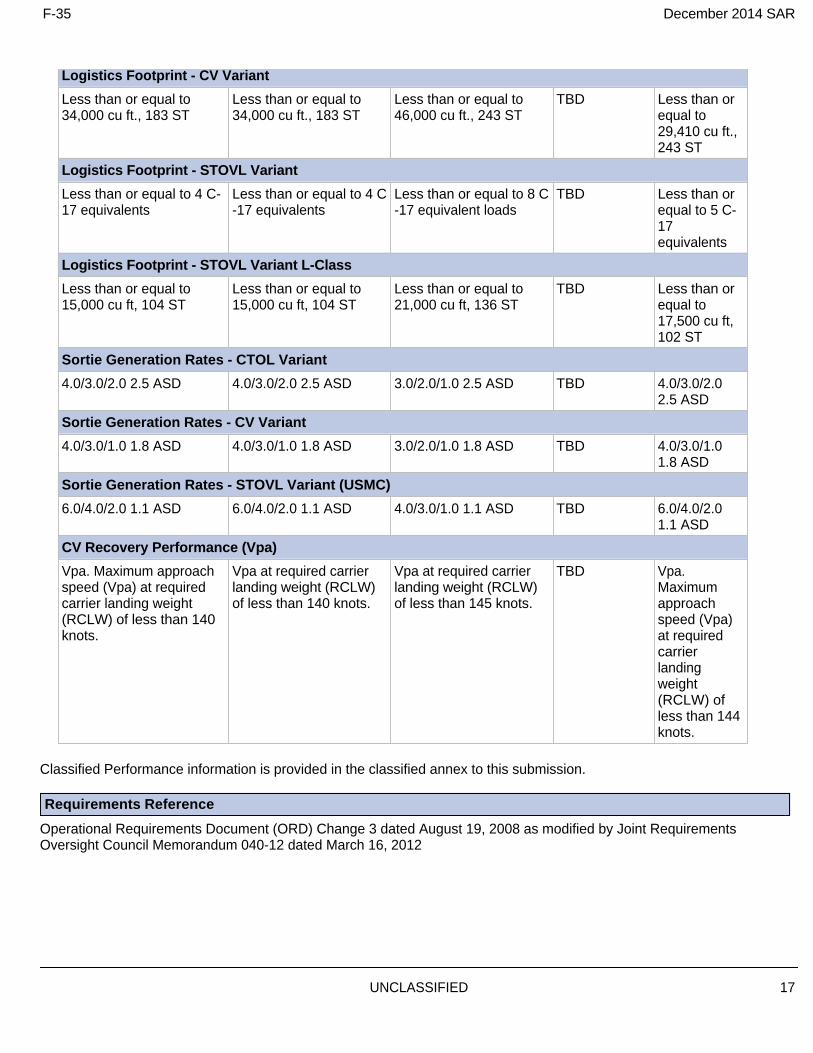
Logistics Footprint - CV Variant
Less than or equal to 34,000 cu ft., 183 ST
Less than or equal to 34,000 cu ft., 183 ST
Less than or equal to 46,000 cu ft., 243 ST
TBD Less than or equal to 29,410 cu ft., 243 ST
Logistics Footprint - STOVL Variant
Less than or equal to 4 C-17 equivalents
Less than or equal to 4 C-17 equivalents
Less than or equal to 8 C-17 equivalent loads
TBD Less than or equal to 5 C-17 equivalents
Logistics Footprint - STOVL Variant L-Class
Less than or equal to 15,000 cu ft, 104 ST
Less than or equal to 15,000 cu ft, 104 ST
Less than or equal to 21,000 cu ft, 136 ST
TBD Less than or equal to 17,500 cu ft, 102 ST
Sortie Generation Rates - CTOL Variant
4.0/3.0/2.0 2.5 ASD 4.0/3.0/2.0 2.5 ASD 3.0/2.0/1.0 2.5 ASD TBD 4.0/3.0/2.0 2.5 ASD
Sortie Generation Rates - CV Variant
4.0/3.0/1.0 1.8 ASD 4.0/3.0/1.0 1.8 ASD 3.0/2.0/1.0 1.8 ASD TBD 4.0/3.0/1.0 1.8 ASD
Sortie Generation Rates - STOVL Variant (USMC)
6.0/4.0/2.0 1.1 ASD 6.0/4.0/2.0 1.1 ASD 4.0/3.0/1.0 1.1 ASD TBD 6.0/4.0/2.0 1.1 ASD
CV Recovery Performance (Vpa)
Vpa. Maximum approach speed (Vpa) at required carrier landing weight (RCLW) of less than 140 knots.
Vpa at required carrier landing weight (RCLW) of less than 140 knots.
Vpa at required carrier landing weight (RCLW) of less than 145 knots.
TBD Vpa. Maximum approach speed (Vpa) at required carrier landing weight (RCLW) of less than 144 knots.
Classified Performance information is provided in the classified annex to this submission.
Requirements Reference
Operational Requirements Document (ORD) Change 3 dated August 19, 2008 as modified by Joint Requirements Oversight Council Memorandum 040-12 dated March 16, 2012
F-35 December 2014 SAR
UNCLASSIFIED 17
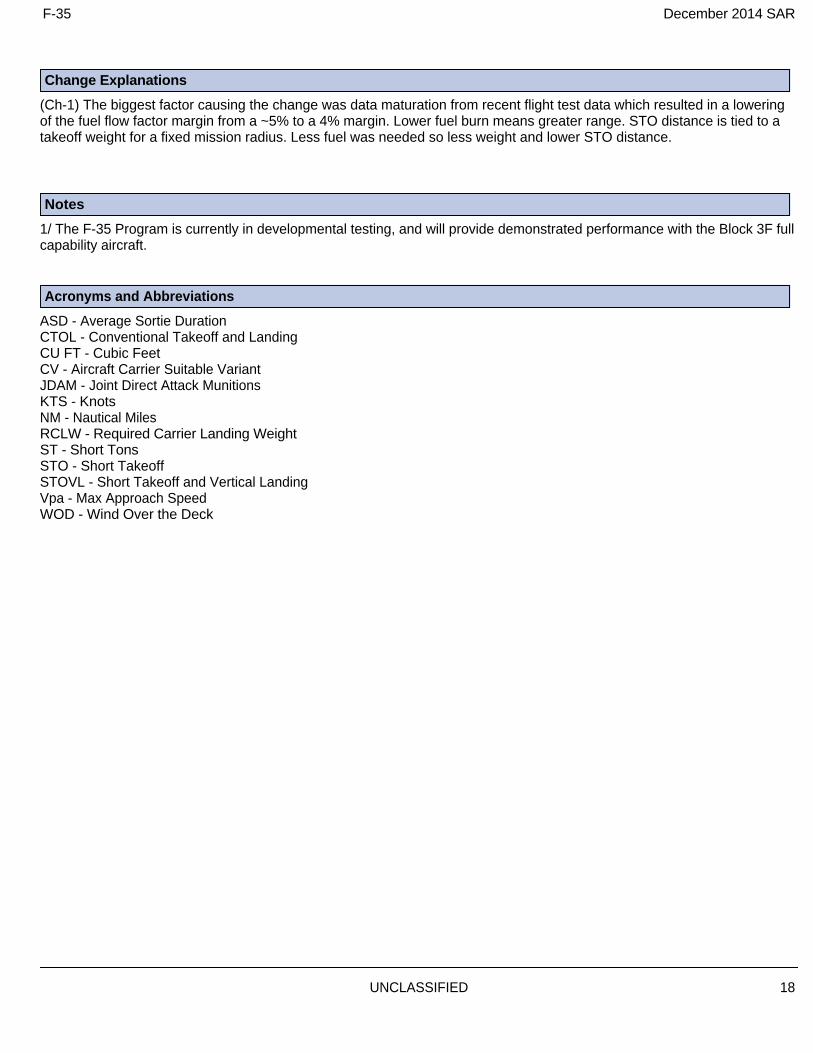
Change Explanations
(Ch-1) The biggest factor causing the change was data maturation from recent flight test data which resulted in a lowering of the fuel flow factor margin from a ~5% to a 4% margin. Lower fuel burn means greater range. STO distance is tied to a takeoff weight for a fixed mission radius. Less fuel was needed so less weight and lower STO distance.
Notes
1/ The F-35 Program is currently in developmental testing, and will provide demonstrated performance with the Block 3F full capability aircraft.
Acronyms and Abbreviations
ASD - Average Sortie DurationCTOL - Conventional Takeoff and LandingCU FT - Cubic FeetCV - Aircraft Carrier Suitable VariantJDAM - Joint Direct Attack MunitionsKTS - KnotsNM - Nautical MilesRCLW - Required Carrier Landing WeightST - Short TonsSTO - Short TakeoffSTOVL - Short Takeoff and Vertical LandingVpa - Max Approach SpeedWOD - Wind Over the Deck
F-35 December 2014 SAR
UNCLASSIFIED 18

F-35 Engine
Performance Characteristics
SAR BaselineDevelopment
Estimate
Current APBDevelopment
Objective/Threshold
DemonstratedPerformance
CurrentEstimate
See Note
N/A N/A N/A TBD N/A
Requirements Reference
Operational Requirements Document (ORD) Change 3 dated August 19, 2008 as modified by Joint Requirements Oversight Council Memorandum 040-12 dated March 16, 2012
Change Explanations
None
Notes
1/ Performance characteristics for the F-35 Engine subprogram are captured as part of the system-level performance characteristics reflected in the F-35 Aircraft subprogram.
F-35 December 2014 SAR
UNCLASSIFIED 19
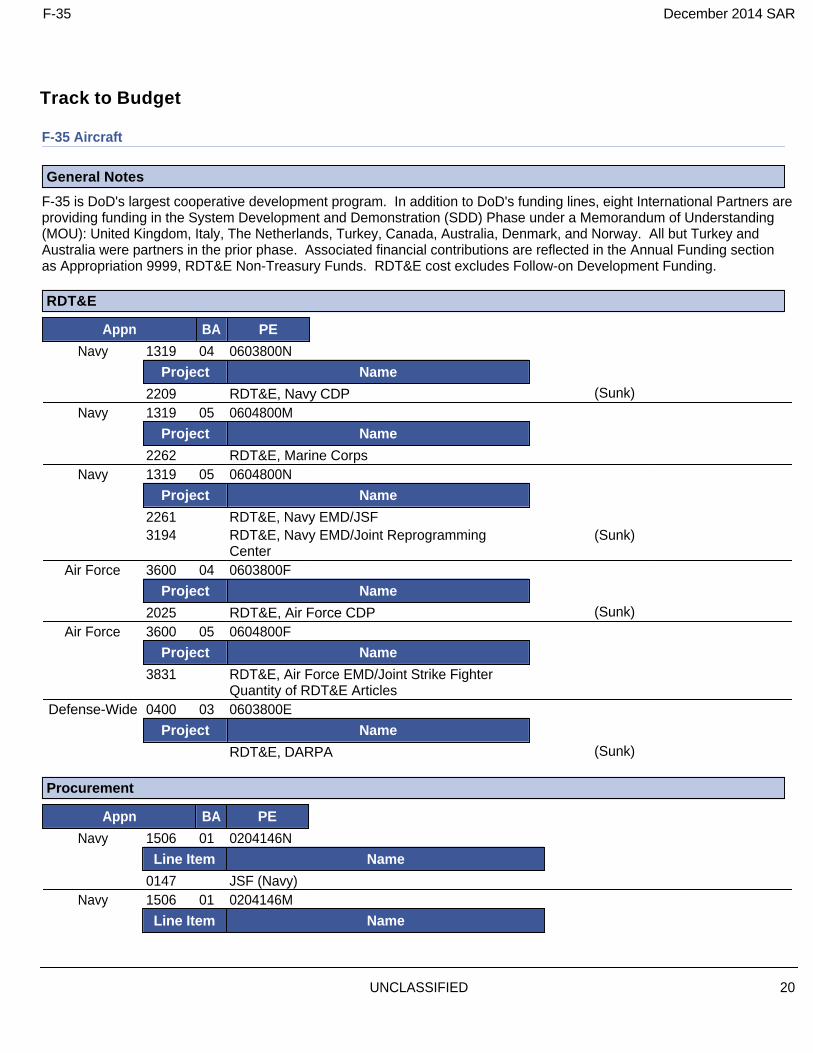
Track to Budget
F-35 Aircraft
General Notes
F-35 is DoD's largest cooperative development program. In addition to DoD's funding lines, eight International Partners are providing funding in the System Development and Demonstration (SDD) Phase under a Memorandum of Understanding (MOU): United Kingdom, Italy, The Netherlands, Turkey, Canada, Australia, Denmark, and Norway. All but Turkey and Australia were partners in the prior phase. Associated financial contributions are reflected in the Annual Funding section as Appropriation 9999, RDT&E Non-Treasury Funds. RDT&E cost excludes Follow-on Development Funding.
RDT&E
Appn BA PE
Navy 1319 04 0603800N Project Name
2209 RDT&E, Navy CDP (Sunk) Navy 1319 05 0604800M
Project Name
2262 RDT&E, Marine Corps Navy 1319 05 0604800N
Project Name
2261 RDT&E, Navy EMD/JSF 3194 RDT&E, Navy EMD/Joint Reprogramming
Center (Sunk)
Air Force 3600 04 0603800F Project Name
2025 RDT&E, Air Force CDP (Sunk) Air Force 3600 05 0604800F
Project Name
3831 RDT&E, Air Force EMD/Joint Strike Fighter Quantity of RDT&E Articles
Defense-Wide 0400 03 0603800E Project Name
RDT&E, DARPA (Sunk)
Procurement
Appn BA PE
Navy 1506 01 0204146N Line Item Name
0147 JSF (Navy) Navy 1506 01 0204146M
Line Item Name
F-35 December 2014 SAR
UNCLASSIFIED 20

0152 JSF (Marine Corps) Navy 1506 05 0204146M
Line Item Name
0592 F-35 STOVL Mods Navy 1506 05 0204146N
Line Item Name
0593 F-35 CV Mods Navy 1506 06 0204146M
Line Item Name
0605 Initial Spares (Marine Corps) (Shared) Navy 1506 06 0204146N
Line Item Name
0605 Initial Spares (Navy) (Shared) Air Force 3010 06 0207142F
Line Item Name
000999 Initial Spares (Air Force) (Shared) Air Force 3010 01 0207142F
Line Item Name
ATA000 JSF (Air Force) Air Force 3010 05 0207142F
Line Item Name
F03500 Mods (Air Force)
MILCON
Appn BA PE
Navy 1205 01 0212576N Project Name
MILCON, USN (Shared) (Sunk) Navy 1205 01 0216496M
Project Name
MILCON, USN (Shared) Navy 1205 01 0816376N
Project Name
MILCON, USN (Shared) Air Force 3300 01 0207142F
Project Name
MILCON, AF (Shared) Air Force 3300 01 0207597F
Project Name
MILCON, AF (Shared) Notes: PE 0207597F is a new PE
F-35 Engine
F-35 December 2014 SAR
UNCLASSIFIED 21

General Notes
F-35 is DoD's largest cooperative development program. In addition to DoD's funding lines, eight International Partners are providing funding in the System Development and Demonstration (SDD) Phase under a Memorandum of Understanding (MOU): United Kingdom, Italy, The Netherlands, Turkey, Canada, Australia, Denmark, and Norway. All but Turkey and Australia were partners in the prior phase. Associated financial contributions are reflected in the Annual Funding section as Appropriation 9999, RDT&E Non-Treasury Funds. RDT&E cost excludes Follow-on Development Funding.
RDT&E
Appn BA PE
Navy 1319 04 0603800N Project Name
2209 RDT&E, Navy CDP (Sunk) Navy 1319 05 0604800M
Project Name
2262 RDT&E, Marine Corps Navy 1319 05 0604800N
Project Name
2261 RDT&E, Navy EMD/JSF 3194 RDT&E, Navy EMD/Joint Reprogramming
Center (Sunk)
9999 RDT&E, Navy EMD/Congressional Adds (Sunk) Air Force 3600 04 0603800F
Project Name
2025 RDT&E, Air Force CDP (Sunk) Air Force 3600 05 0604800F
Project Name
3831 RDT&E, Air Force EMD/Joint Strike Fighter Quantity of RDT&E Articles
Defense-Wide 0400 03 0603800E Project Name
RDT&E, DARPA (Sunk)
Procurement
Appn BA PE
Navy 1506 01 0204146N Line Item Name
0147 JSF (Navy) Navy 1506 01 0204146M
Line Item Name
0152 JSF (Marine Corps) Navy 1506 06 0204146M
Line Item Name
0605 Initial Spares (Marine Corps) (Shared)
F-35 December 2014 SAR
UNCLASSIFIED 22

Navy 1506 06 0204146N Line Item Name
0605 Initial Spares (Navy) (Shared) Air Force 3010 06 0207142F
Line Item Name
000999 Initial Spares (Air Force) (Shared) Air Force 3010 01 0207142F
Line Item Name
ATA000 JSF (Air Force) Air Force 3010 05 0207142F
Line Item Name
F03500 Mods (Air Force)
F-35 December 2014 SAR
UNCLASSIFIED 23
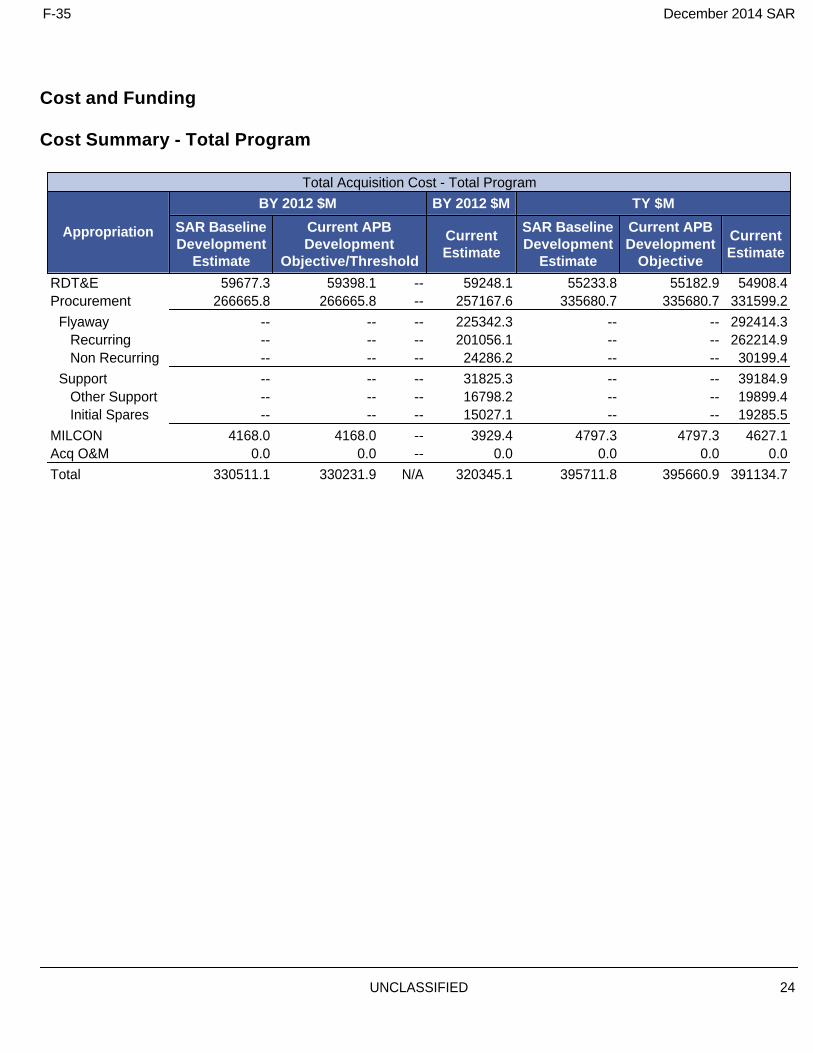
Cost and Funding
Cost Summary - Total Program
Total Acquisition Cost - Total Program
Appropriation
BY 2012 $M BY 2012 $M TY $M
SAR BaselineDevelopment
Estimate
Current APBDevelopment
Objective/Threshold
CurrentEstimate
SAR BaselineDevelopment
Estimate
Current APBDevelopment
Objective
CurrentEstimate
RDT&E 59677.3 59398.1 -- 59248.1 55233.8 55182.9 54908.4Procurement 266665.8 266665.8 -- 257167.6 335680.7 335680.7 331599.2
Flyaway -- -- -- 225342.3 -- -- 292414.3Recurring -- -- -- 201056.1 -- -- 262214.9Non Recurring -- -- -- 24286.2 -- -- 30199.4
Support -- -- -- 31825.3 -- -- 39184.9Other Support -- -- -- 16798.2 -- -- 19899.4Initial Spares -- -- -- 15027.1 -- -- 19285.5
MILCON 4168.0 4168.0 -- 3929.4 4797.3 4797.3 4627.1Acq O&M 0.0 0.0 -- 0.0 0.0 0.0 0.0
Total 330511.1 330231.9 N/A 320345.1 395711.8 395660.9 391134.7
F-35 December 2014 SAR
UNCLASSIFIED 24

Cost and Funding
Cost Summary - F-35 Aircraft
Total Acquisition Cost - F-35 Aircraft
Appropriation
BY 2012 $M BY 2012 $M TY $M
SAR BaselineDevelopment
Estimate
Current APBDevelopment
Objective/Threshold
CurrentEstimate
SAR BaselineDevelopment
Estimate
Current APBDevelopment
Objective
CurrentEstimate
RDT&E 47982.1 46457.5 51103.3 46112.1 44410.1 43360.7 42926.8Procurement 224332.9 224332.9 246766.2 214712.4 282647.8 282647.8 276567.4
Flyaway -- -- -- 189124.1 -- -- 245249.4Recurring -- -- -- 167271.2 -- -- 218018.6Non Recurring -- -- -- 21852.9 -- -- 27230.8
Support -- -- -- 25588.3 -- -- 31318.0Other Support -- -- -- 15022.8 -- -- 17802.8Initial Spares -- -- -- 10565.5 -- -- 13515.2
MILCON 4168.0 4168.0 4584.8 3929.4 4797.3 4797.3 4627.1Acq O&M 0.0 0.0 0.0 0.0 0.0 0.0 0.0
Total 276483.0 274958.4 N/A 264753.9 331855.2 330805.8 324121.3
Current APB Cost Estimate Reference
Cost Assessment and Program Evaluation (CAPE) Independent Cost Estimate (ICE) dated March 09, 2012
Confidence Level
Confidence Level of cost estimate for current APB: 50%
This estimate, like all previous Cost Analysis Improvement Group (CAIG) and Cost Assessment and Program Evaluation (CAPE) estimates, is built upon a product-oriented work breakdown structure; is based on historical actual cost information to the maximum extent possible; and, most importantly, is based on conservative assumptions that are consistent with actual demonstrated contractor and government performance for a series of acquisition programs in which the Department has been successful.
It is difficult to calculate mathematically the precise confidence levels associated with life-cycle cost estimates prepared for Major Defense Acquisition program (MDAPs). Based on the rigor in methods used in building estimates, the strong adherence to the collection and use of historical cost information, and the review of applied assumptions, we project that it is about equally likely that the estimates will prove too low or too high for execution of the program described.
F-35 December 2014 SAR
UNCLASSIFIED 25

Total Quantity - F-35 Aircraft
QuantitySAR BaselineDevelopment
Estimate
Current APBDevelopment
Current Estimate
RDT&E 14 14 14Procurement 2443 2443 2443
Total 2457 2457 2457
F-35 December 2014 SAR
UNCLASSIFIED 26

Cost Summary - F-35 Engine
Total Acquisition Cost - F-35 Engine
Appropriation
BY 2012 $M BY 2012 $M TY $M
SAR BaselineDevelopment
Estimate
Current APBDevelopment
Objective/Threshold
CurrentEstimate
SAR BaselineDevelopment
Estimate
Current APBDevelopment
Objective
CurrentEstimate
RDT&E 11695.2 12940.6 14234.7 13136.0 10823.7 11822.2 11981.6Procurement 42332.9 42332.9 46566.2 42455.2 53032.9 53032.9 55031.8
Flyaway -- -- -- 36218.2 -- -- 47164.9Recurring -- -- -- 33784.9 -- -- 44196.3Non Recurring -- -- -- 2433.3 -- -- 2968.6
Support -- -- -- 6237.0 -- -- 7866.9Other Support -- -- -- 1775.4 -- -- 2096.6Initial Spares -- -- -- 4461.6 -- -- 5770.3
MILCON 0.0 0.0 0.0 0.0 0.0 0.0 0.0Acq O&M 0.0 0.0 0.0 0.0 0.0 0.0 0.0
Total 54028.1 55273.5 N/A 55591.2 63856.6 64855.1 67013.4
Current APB Cost Estimate Reference
Cost Assessment and Program Evaluation (CAPE) Independent Cost Estimate (ICE) dated March 09, 2012
Confidence Level
Confidence Level of cost estimate for current APB: 50%
This estimate, like all previous Cost Analysis Improvement Group (CAIG) and Cost Assessment and Program Evaluation (CAPE) estimates, is built upon a product-oriented work breakdown structure; is based on historical actual cost information to the maximum extent possible; and, most importantly, is based on conservative assumptions that are consistent with actual demonstrated contractor and government performance for a series of acquisition programs in which the Department has been successful.
It is difficult to calculate mathematically the precise confidence levels associated with life-cycle cost estimates prepared for Major Defense Acquisition program (MDAPs). Based on the rigor in methods used in building estimates, the strong adherence to the collection and use of historical cost information, and the review of applied assumptions, we project that it is about equally likely that the estimates will prove too low or too high for execution of the program described.
Total Quantity - F-35 Engine
QuantitySAR BaselineDevelopment
Estimate
Current APBDevelopment
Current Estimate
RDT&E 14 14 14Procurement 2443 2443 2443
Total 2457 2457 2457
F-35 December 2014 SAR
UNCLASSIFIED 27

Cost and Funding
Funding Summary - Total Program
Appropriation Summary
FY 2016 President's Budget / December 2014 SAR (TY$ M)
Appropriation Prior FY 2015 FY 2016 FY 2017 FY 2018 FY 2019 FY 2020To
CompleteTotal
RDT&E 50386.4 1522.6 1508.7 1187.6 274.7 13.9 14.5 0.0 54908.4Procurement 39192.2 6942.1 9158.1 10010.2 11730.7 11877.7 11638.0 231050.2 331599.2MILCON 1291.0 198.6 292.7 388.9 88.1 143.0 254.4 1970.4 4627.1Acq O&M 0.0 0.0 0.0 0.0 0.0 0.0 0.0 0.0 0.0
PB 2016 Total 90869.6 8663.3 10959.5 11586.7 12093.5 12034.6 11906.9 233020.6 391134.7PB 2015 Total 90885.9 8394.3 10537.6 11649.0 12589.7 12858.2 13079.0 238590.9 398584.6
Delta -16.3 269.0 421.9 -62.3 -496.2 -823.6 -1172.1 -5570.3 -7449.9
F-35 December 2014 SAR
UNCLASSIFIED 28

Cost and Funding
Funding Summary - F-35 Aircraft
Appropriation Summary
FY 2016 President's Budget / December 2014 SAR (TY$ M)
Appropriation Prior FY 2015 FY 2016 FY 2017 FY 2018 FY 2019 FY 2020To
CompleteTotal
RDT&E 38898.4 1285.5 1308.7 1131.6 274.2 13.9 14.5 0.0 42926.8Procurement 33298.0 6068.6 7907.2 8551.9 9943.1 9919.8 9624.1 191254.7 276567.4MILCON 1291.0 198.6 292.7 388.9 88.1 143.0 254.4 1970.4 4627.1Acq O&M 0.0 0.0 0.0 0.0 0.0 0.0 0.0 0.0 0.0
PB 2016 Total 73487.4 7552.7 9508.6 10072.4 10305.4 10076.7 9893.0 193225.1 324121.3PB 2015 Total 73383.2 7310.8 9099.8 10086.5 10693.1 10736.3 10869.0 197785.4 329964.1
Delta 104.2 241.9 408.8 -14.1 -387.7 -659.6 -976.0 -4560.3 -5842.8
Quantity Summary
FY 2016 President's Budget / December 2014 SAR (TY$ M)
Quantity Undistributed PriorFY
2015FY
2016FY
2017FY
2018FY
2019FY
2020To
CompleteTotal
Development 14 0 0 0 0 0 0 0 0 14Production 0 179 38 57 66 88 90 92 1833 2443
PB 2016 Total 14 179 38 57 66 88 90 92 1833 2457PB 2015 Total 14 179 34 55 68 90 96 100 1821 2457
Delta 0 0 4 2 -2 -2 -6 -8 12 0
F-35 December 2014 SAR
UNCLASSIFIED 29

Funding Summary - F-35 Engine
Appropriation Summary
FY 2016 President's Budget / December 2014 SAR (TY$ M)
Appropriation Prior FY 2015 FY 2016 FY 2017 FY 2018 FY 2019 FY 2020To
CompleteTotal
RDT&E 11488.0 237.1 200.0 56.0 0.5 0.0 0.0 0.0 11981.6Procurement 5894.2 873.5 1250.9 1458.3 1787.6 1957.9 2013.9 39795.5 55031.8MILCON 0.0 0.0 0.0 0.0 0.0 0.0 0.0 0.0 0.0Acq O&M 0.0 0.0 0.0 0.0 0.0 0.0 0.0 0.0 0.0
PB 2016 Total 17382.2 1110.6 1450.9 1514.3 1788.1 1957.9 2013.9 39795.5 67013.4PB 2015 Total 17502.7 1083.5 1437.8 1562.5 1896.6 2121.9 2210.0 40805.5 68620.5
Delta -120.5 27.1 13.1 -48.2 -108.5 -164.0 -196.1 -1010.0 -1607.1
Quantity Summary
FY 2016 President's Budget / December 2014 SAR (TY$ M)
Quantity Undistributed PriorFY
2015FY
2016FY
2017FY
2018FY
2019FY
2020To
CompleteTotal
Development 14 0 0 0 0 0 0 0 0 14Production 0 179 38 57 66 88 90 92 1833 2443
PB 2016 Total 14 179 38 57 66 88 90 92 1833 2457PB 2015 Total 14 179 34 55 68 90 96 100 1821 2457
Delta 0 0 4 2 -2 -2 -6 -8 12 0
F-35 December 2014 SAR
UNCLASSIFIED 30

Cost and Funding
Annual Funding By Appropriation - F-35 Aircraft
Annual Funding - F-35 Aircraft0400 | RDT&E | Research, Development, Test, and Evaluation, Defense-Wide
FiscalYear
Quantity
TY $M
End ItemRecurring
Flyaway
Non EndItem
RecurringFlyaway
NonRecurring
Flyaway
TotalFlyaway
TotalSupport
TotalProgram
1996 -- -- -- -- -- -- 23.21997 -- -- -- -- -- -- 54.81998 -- -- -- -- -- -- 16.9
Subtotal -- -- -- -- -- -- 94.9
F-35 December 2014 SAR
UNCLASSIFIED 31

Annual Funding - F-35 Aircraft0400 | RDT&E | Research, Development, Test, and Evaluation, Defense-Wide
FiscalYear
Quantity
BY 2012 $M
End ItemRecurring
Flyaway
Non EndItem
RecurringFlyaway
NonRecurring
Flyaway
TotalFlyaway
TotalSupport
TotalProgram
1996 -- -- -- -- -- -- 30.11997 -- -- -- -- -- -- 70.21998 -- -- -- -- -- -- 21.5
Subtotal -- -- -- -- -- -- 121.8
F-35 December 2014 SAR
UNCLASSIFIED 32

Annual Funding - F-35 Aircraft3600 | RDT&E | Research, Development, Test, and Evaluation, Air Force
FiscalYear
Quantity
TY $M
End ItemRecurring
Flyaway
Non EndItem
RecurringFlyaway
NonRecurring
Flyaway
TotalFlyaway
TotalSupport
TotalProgram
1995 -- -- -- -- -- -- 67.51996 -- -- -- -- -- -- 65.41997 -- -- -- -- -- -- 202.31998 -- -- -- -- -- -- 357.21999 -- -- -- -- -- -- 366.52000 -- -- -- -- -- -- 200.32001 -- -- -- -- -- -- 274.32002 -- -- -- -- -- -- 302.62003 -- -- -- -- -- -- 1210.12004 -- -- -- -- -- -- 1584.12005 -- -- -- -- -- -- 1465.82006 -- -- -- -- -- -- 1678.62007 -- -- -- -- -- -- 1632.42008 -- -- -- -- -- -- 1359.02009 -- -- -- -- -- -- 1197.52010 -- -- -- -- -- -- 1567.42011 -- -- -- -- -- -- 715.42012 -- -- -- -- -- -- 1262.22013 -- -- -- -- -- -- 958.22014 -- -- -- -- -- -- 546.22015 -- -- -- -- -- -- 451.52016 -- -- -- -- -- -- 440.72017 -- -- -- -- -- -- 308.82018 -- -- -- -- -- -- 114.42019 -- -- -- -- -- -- 5.32020 -- -- -- -- -- -- 5.4
Subtotal 5 -- -- -- -- -- 18339.1
F-35 December 2014 SAR
UNCLASSIFIED 33

Annual Funding - F-35 Aircraft3600 | RDT&E | Research, Development, Test, and Evaluation, Air Force
FiscalYear
Quantity
BY 2012 $M
End ItemRecurring
Flyaway
Non EndItem
RecurringFlyaway
NonRecurring
Flyaway
TotalFlyaway
TotalSupport
TotalProgram
1995 -- -- -- -- -- -- 89.11996 -- -- -- -- -- -- 84.91997 -- -- -- -- -- -- 259.51998 -- -- -- -- -- -- 454.51999 -- -- -- -- -- -- 460.92000 -- -- -- -- -- -- 248.32001 -- -- -- -- -- -- 335.42002 -- -- -- -- -- -- 366.32003 -- -- -- -- -- -- 1443.62004 -- -- -- -- -- -- 1838.42005 -- -- -- -- -- -- 1657.52006 -- -- -- -- -- -- 1840.82007 -- -- -- -- -- -- 1747.32008 -- -- -- -- -- -- 1428.62009 -- -- -- -- -- -- 1242.92010 -- -- -- -- -- -- 1602.82011 -- -- -- -- -- -- 714.32012 -- -- -- -- -- -- 1239.22013 -- -- -- -- -- -- 926.62014 -- -- -- -- -- -- 523.02015 -- -- -- -- -- -- 425.62016 -- -- -- -- -- -- 408.32017 -- -- -- -- -- -- 280.82018 -- -- -- -- -- -- 102.02019 -- -- -- -- -- -- 4.62020 -- -- -- -- -- -- 4.6
Subtotal 5 -- -- -- -- -- 19729.8
F-35 December 2014 SAR
UNCLASSIFIED 34

Annual Funding - F-35 Aircraft1319 | RDT&E | Research, Development, Test, and Evaluation, Navy
FiscalYear
Quantity
TY $M
End ItemRecurring
Flyaway
Non EndItem
RecurringFlyaway
NonRecurring
Flyaway
TotalFlyaway
TotalSupport
TotalProgram
1994 -- -- -- -- -- -- 23.71995 -- -- -- -- -- -- 78.71996 -- -- -- -- -- -- 64.61997 -- -- -- -- -- -- 195.61998 -- -- -- -- -- -- 360.41999 -- -- -- -- -- -- 378.92000 -- -- -- -- -- -- 191.72001 -- -- -- -- -- -- 274.32002 -- -- -- -- -- -- 370.12003 -- -- -- -- -- -- 1089.52004 -- -- -- -- -- -- 1548.22005 -- -- -- -- -- -- 1510.32006 -- -- -- -- -- -- 1657.32007 -- -- -- -- -- -- 1470.72008 -- -- -- -- -- -- 1285.02009 -- -- -- -- -- -- 1271.22010 -- -- -- -- -- -- 1440.52011 -- -- -- -- -- -- 989.92012 -- -- -- -- -- -- 960.12013 -- -- -- -- -- -- 1081.92014 -- -- -- -- -- -- 692.32015 -- -- -- -- -- -- 819.02016 -- -- -- -- -- -- 851.02017 -- -- -- -- -- -- 800.82018 -- -- -- -- -- -- 132.32019 -- -- -- -- -- -- 8.62020 -- -- -- -- -- -- 9.1
Subtotal 9 -- -- -- -- -- 19555.7
F-35 December 2014 SAR
UNCLASSIFIED 35

Annual Funding - F-35 Aircraft1319 | RDT&E | Research, Development, Test, and Evaluation, Navy
FiscalYear
Quantity
BY 2012 $M
End ItemRecurring
Flyaway
Non EndItem
RecurringFlyaway
NonRecurring
Flyaway
TotalFlyaway
TotalSupport
TotalProgram
1994 -- -- -- -- -- -- 31.91995 -- -- -- -- -- -- 103.91996 -- -- -- -- -- -- 83.91997 -- -- -- -- -- -- 250.91998 -- -- -- -- -- -- 458.61999 -- -- -- -- -- -- 476.52000 -- -- -- -- -- -- 237.62001 -- -- -- -- -- -- 335.42002 -- -- -- -- -- -- 448.02003 -- -- -- -- -- -- 1299.72004 -- -- -- -- -- -- 1796.82005 -- -- -- -- -- -- 1707.82006 -- -- -- -- -- -- 1817.42007 -- -- -- -- -- -- 1574.32008 -- -- -- -- -- -- 1350.82009 -- -- -- -- -- -- 1319.42010 -- -- -- -- -- -- 1473.02011 -- -- -- -- -- -- 988.42012 -- -- -- -- -- -- 942.62013 -- -- -- -- -- -- 1046.22014 -- -- -- -- -- -- 662.82015 -- -- -- -- -- -- 772.02016 -- -- -- -- -- -- 788.42017 -- -- -- -- -- -- 728.22018 -- -- -- -- -- -- 118.02019 -- -- -- -- -- -- 7.52020 -- -- -- -- -- -- 7.8
Subtotal 9 -- -- -- -- -- 20827.8
F-35 December 2014 SAR
UNCLASSIFIED 36

Annual Funding - F-35 Aircraft9999 | RDT&E | Non Treasury Funds
FiscalYear
Quantity
TY $M
End ItemRecurring
Flyaway
Non EndItem
RecurringFlyaway
NonRecurring
Flyaway
TotalFlyaway
TotalSupport
TotalProgram
1996 -- -- -- -- -- -- 11.31997 -- -- -- -- -- -- 67.11998 -- -- -- -- -- -- 72.11999 -- -- -- -- -- -- 49.02000 -- -- -- -- -- -- 25.22001 -- -- -- -- -- -- 9.52002 -- -- -- -- -- -- 255.82003 -- -- -- -- -- -- 298.72004 -- -- -- -- -- -- 484.22005 -- -- -- -- -- -- 734.32006 -- -- -- -- -- -- 801.32007 -- -- -- -- -- -- 635.32008 -- -- -- -- -- -- 574.02009 -- -- -- -- -- -- 236.02010 -- -- -- -- -- -- 133.22011 -- -- -- -- -- -- 171.32012 -- -- -- -- -- -- 126.92013 -- -- -- -- -- -- 148.52014 -- -- -- -- -- -- 21.92015 -- -- -- -- -- -- 15.02016 -- -- -- -- -- -- 17.02017 -- -- -- -- -- -- 22.02018 -- -- -- -- -- -- 27.5
Subtotal -- -- -- -- -- -- 4937.1
F-35 December 2014 SAR
UNCLASSIFIED 37

Annual Funding - F-35 Aircraft9999 | RDT&E | Non Treasury Funds
FiscalYear
Quantity
BY 2012 $M
End ItemRecurring
Flyaway
Non EndItem
RecurringFlyaway
NonRecurring
Flyaway
TotalFlyaway
TotalSupport
TotalProgram
1996 -- -- -- -- -- -- 14.71997 -- -- -- -- -- -- 86.11998 -- -- -- -- -- -- 91.71999 -- -- -- -- -- -- 61.62000 -- -- -- -- -- -- 31.22001 -- -- -- -- -- -- 11.62002 -- -- -- -- -- -- 309.62003 -- -- -- -- -- -- 356.32004 -- -- -- -- -- -- 561.92005 -- -- -- -- -- -- 830.32006 -- -- -- -- -- -- 878.72007 -- -- -- -- -- -- 680.02008 -- -- -- -- -- -- 603.42009 -- -- -- -- -- -- 244.92010 -- -- -- -- -- -- 136.22011 -- -- -- -- -- -- 171.02012 -- -- -- -- -- -- 124.62013 -- -- -- -- -- -- 143.62014 -- -- -- -- -- -- 21.02015 -- -- -- -- -- -- 14.12016 -- -- -- -- -- -- 15.72017 -- -- -- -- -- -- 20.02018 -- -- -- -- -- -- 24.5
Subtotal -- -- -- -- -- -- 5432.7
F-35 December 2014 SAR
UNCLASSIFIED 38

Annual Funding - F-35 Aircraft3010 | Procurement | Aircraft Procurement, Air Force
FiscalYear
Quantity
TY $M
End ItemRecurring
Flyaway
Non EndItem
RecurringFlyaway
NonRecurring
Flyaway
TotalFlyaway
TotalSupport
TotalProgram
2006 -- 107.2 -- -- 107.2 -- 107.22007 2 428.5 -- 80.5 509.0 91.1 600.12008 6 983.1 -- 171.9 1155.0 131.5 1286.52009 7 1009.2 -- 276.8 1286.0 175.8 1461.82010 10 1471.2 -- 355.7 1826.9 277.7 2104.62011 22 2751.2 -- 551.9 3303.1 679.6 3982.72012 18 2041.5 -- 369.3 2410.8 793.0 3203.82013 19 2074.6 -- 98.3 2172.9 532.6 2705.52014 19 2034.6 -- 616.7 2651.3 430.0 3081.32015 28 2715.8 -- 635.7 3351.5 537.2 3888.72016 44 4076.0 -- 571.1 4647.1 626.3 5273.42017 48 4053.7 -- 919.5 4973.2 643.4 5616.62018 60 4725.6 -- 884.1 5609.7 670.7 6280.42019 60 4631.6 -- 900.9 5532.5 629.0 6161.52020 60 4421.4 -- 509.3 4930.7 740.2 5670.92021 60 4504.4 -- 488.1 4992.5 670.8 5663.32022 80 5791.1 -- 594.1 6385.2 971.7 7356.92023 80 5882.6 -- 598.1 6480.7 774.1 7254.82024 80 5945.2 -- 605.9 6551.1 794.7 7345.82025 80 6178.9 -- 623.8 6802.7 853.5 7656.22026 80 6294.2 -- 634.2 6928.4 845.9 7774.32027 80 6387.5 -- 644.0 7031.5 886.8 7918.32028 80 6478.6 -- 651.0 7129.6 689.6 7819.22029 80 6553.0 -- 638.8 7191.8 756.1 7947.92030 80 6703.9 -- 652.9 7356.8 864.9 8221.72031 80 6943.3 -- 674.0 7617.3 913.9 8531.22032 80 7124.6 -- 683.3 7807.9 693.7 8501.62033 80 7357.6 -- 700.2 8057.8 579.8 8637.62034 80 7598.3 -- 717.9 8316.2 383.0 8699.22035 80 7884.6 -- 741.3 8625.9 393.4 9019.32036 80 8093.1 -- 738.3 8831.4 344.3 9175.72037 80 7658.6 -- 693.8 8352.4 356.3 8708.72038 20 2428.7 -- 232.3 2661.0 215.4 2876.4
Subtotal 1763 153333.4 -- 18253.7 171587.1 18946.0 190533.1
F-35 December 2014 SAR
UNCLASSIFIED 39

Annual Funding - F-35 Aircraft3010 | Procurement | Aircraft Procurement, Air Force
FiscalYear
Quantity
BY 2012 $M
End ItemRecurring
Flyaway
Non EndItem
RecurringFlyaway
NonRecurring
Flyaway
TotalFlyaway
TotalSupport
TotalProgram
2006 -- 115.9 -- -- 115.9 -- 115.92007 2 452.5 -- 85.1 537.6 96.2 633.82008 6 1022.9 -- 178.9 1201.8 136.8 1338.62009 7 1035.6 -- 284.1 1319.7 180.4 1500.12010 10 1478.6 -- 357.5 1836.1 279.1 2115.22011 22 2709.4 -- 543.6 3253.0 669.3 3922.32012 18 1980.7 -- 358.3 2339.0 769.4 3108.42013 19 1989.9 -- 94.3 2084.2 510.8 2595.02014 19 1921.4 -- 582.3 2503.7 406.1 2909.82015 28 2521.8 -- 590.3 3112.1 498.8 3610.92016 44 3716.5 -- 520.8 4237.3 571.0 4808.32017 48 3626.0 -- 822.5 4448.5 575.5 5024.02018 60 4144.7 -- 775.4 4920.1 588.3 5508.42019 60 3982.6 -- 774.7 4757.3 540.9 5298.22020 60 3727.3 -- 429.4 4156.7 624.0 4780.72021 60 3722.8 -- 403.5 4126.3 554.4 4680.72022 80 4692.4 -- 481.4 5173.8 787.4 5961.22023 80 4673.1 -- 475.2 5148.3 614.9 5763.22024 80 4630.2 -- 472.0 5102.2 618.9 5721.12025 80 4717.9 -- 476.3 5194.2 651.7 5845.92026 80 4711.7 -- 474.8 5186.5 633.2 5819.72027 80 4687.8 -- 472.6 5160.4 650.8 5811.22028 80 4661.4 -- 468.4 5129.8 496.2 5626.02029 80 4622.5 -- 450.6 5073.1 533.4 5606.52030 80 4636.2 -- 451.6 5087.8 598.1 5685.92031 80 4707.6 -- 457.0 5164.6 619.6 5784.22032 80 4735.8 -- 454.2 5190.0 461.1 5651.12033 80 4794.8 -- 456.4 5251.2 377.8 5629.02034 80 4854.6 -- 458.7 5313.3 244.7 5558.02035 80 4938.7 -- 464.4 5403.1 246.4 5649.52036 80 4969.9 -- 453.3 5423.2 211.5 5634.72037 80 4610.9 -- 417.7 5028.6 214.5 5243.12038 20 1433.5 -- 137.1 1570.6 127.2 1697.8
Subtotal 1763 115227.6 -- 14322.4 129550.0 15088.4 144638.4
F-35 December 2014 SAR
UNCLASSIFIED 40

Cost Quantity Information - F-35 Aircraft3010 | Procurement | Aircraft Procurement, Air Force
FiscalYear
Quantity
End ItemRecurring
Flyaway(Aligned With
Quantity)BY 2012 $M
2006 -- --2007 2 452.52008 6 1022.92009 7 1035.62010 10 1478.62011 22 2709.42012 18 1980.72013 19 1989.92014 19 1921.42015 28 2521.82016 44 3716.52017 48 3626.02018 60 4144.72019 60 3982.62020 60 3727.32021 60 3722.82022 80 4692.42023 80 4673.12024 80 4630.22025 80 4717.92026 80 4711.72027 80 4687.82028 80 4661.42029 80 4622.52030 80 4636.22031 80 4707.62032 80 4735.82033 80 4794.82034 80 4854.62035 80 4938.72036 80 5008.52037 80 4649.52038 20 1472.2
Subtotal 1763 115227.6
F-35 December 2014 SAR
UNCLASSIFIED 41

Annual Funding - F-35 Aircraft1506 | Procurement | Aircraft Procurement, Navy
FiscalYear
Quantity
TY $M
End ItemRecurring
Flyaway
Non EndItem
RecurringFlyaway
NonRecurring
Flyaway
TotalFlyaway
TotalSupport
TotalProgram
2007 -- 96.9 -- -- 96.9 -- 96.92008 6 923.2 -- 38.6 961.8 10.7 972.52009 7 1062.0 -- 181.9 1243.9 206.2 1450.12010 20 2681.2 -- 304.4 2985.6 560.9 3546.52011 10 1494.8 -- 251.6 1746.4 431.9 2178.32012 13 1477.7 -- 333.1 1810.8 746.7 2557.52013 10 1107.3 -- 51.1 1158.4 557.3 1715.72014 10 1205.5 -- 465.8 1671.3 575.7 2247.02015 10 1115.0 -- 650.8 1765.8 414.1 2179.92016 13 1402.0 -- 601.9 2003.9 629.9 2633.82017 18 1786.4 -- 599.3 2385.7 549.6 2935.32018 28 2512.7 -- 593.5 3106.2 556.5 3662.72019 30 2717.2 -- 434.3 3151.5 606.8 3758.32020 32 2795.0 -- 405.9 3200.9 752.3 3953.22021 40 3341.3 -- 342.6 3683.9 686.9 4370.82022 40 3356.6 -- 330.4 3687.0 804.0 4491.02023 40 3357.7 -- 331.9 3689.6 609.3 4298.92024 40 3407.9 -- 324.5 3732.4 652.7 4385.12025 40 3479.8 -- 334.5 3814.3 588.6 4402.92026 40 3553.0 -- 337.2 3890.2 521.0 4411.22027 40 3581.6 -- 358.0 3939.6 445.7 4385.32028 40 3630.1 -- 366.5 3996.6 351.0 4347.62029 40 3691.3 -- 341.7 4033.0 318.6 4351.62030 40 3535.8 -- 346.3 3882.1 277.9 4160.02031 21 2112.3 -- 195.9 2308.2 201.7 2509.92032 20 2077.0 -- 165.7 2242.7 121.1 2363.82033 20 2029.9 -- 174.1 2204.0 119.8 2323.82034 12 1154.0 -- 115.6 1269.6 75.1 1344.7
Subtotal 680 64685.2 -- 8977.1 73662.3 12372.0 86034.3
F-35 December 2014 SAR
UNCLASSIFIED 42

Annual Funding - F-35 Aircraft1506 | Procurement | Aircraft Procurement, Navy
FiscalYear
Quantity
BY 2012 $M
End ItemRecurring
Flyaway
Non EndItem
RecurringFlyaway
NonRecurring
Flyaway
TotalFlyaway
TotalSupport
TotalProgram
2007 -- 102.3 -- -- 102.3 -- 102.32008 6 960.6 -- 40.2 1000.8 11.1 1011.92009 7 1089.8 -- 186.7 1276.5 211.6 1488.12010 20 2694.6 -- 305.9 3000.5 563.8 3564.32011 10 1472.1 -- 247.8 1719.9 425.3 2145.22012 13 1433.7 -- 323.2 1756.9 724.5 2481.42013 10 1062.1 -- 49.0 1111.1 534.6 1645.72014 10 1138.4 -- 439.9 1578.3 543.7 2122.02015 10 1035.4 -- 604.3 1639.7 384.5 2024.22016 13 1278.3 -- 548.9 1827.2 574.3 2401.52017 18 1597.9 -- 536.1 2134.0 491.6 2625.62018 28 2203.8 -- 520.6 2724.4 488.1 3212.52019 30 2336.5 -- 373.4 2709.9 521.8 3231.72020 32 2356.2 -- 342.2 2698.4 634.2 3332.62021 40 2761.6 -- 283.2 3044.8 567.6 3612.42022 40 2719.8 -- 267.7 2987.5 651.5 3639.02023 40 2667.3 -- 263.7 2931.0 484.0 3415.02024 40 2654.1 -- 252.7 2906.8 508.4 3415.22025 40 2657.0 -- 255.4 2912.4 449.4 3361.82026 40 2659.7 -- 252.3 2912.0 390.1 3302.12027 40 2628.5 -- 262.8 2891.3 327.1 3218.42028 40 2611.9 -- 263.7 2875.6 252.5 3128.12029 40 2603.8 -- 241.0 2844.8 224.8 3069.62030 40 2445.3 -- 239.5 2684.8 192.1 2876.92031 21 1432.2 -- 132.7 1564.9 136.8 1701.72032 20 1380.6 -- 110.2 1490.8 80.5 1571.32033 20 1322.8 -- 113.6 1436.4 78.0 1514.42034 12 737.3 -- 73.8 811.1 48.0 859.1
Subtotal 680 52043.6 -- 7530.5 59574.1 10499.9 70074.0
F-35 December 2014 SAR
UNCLASSIFIED 43
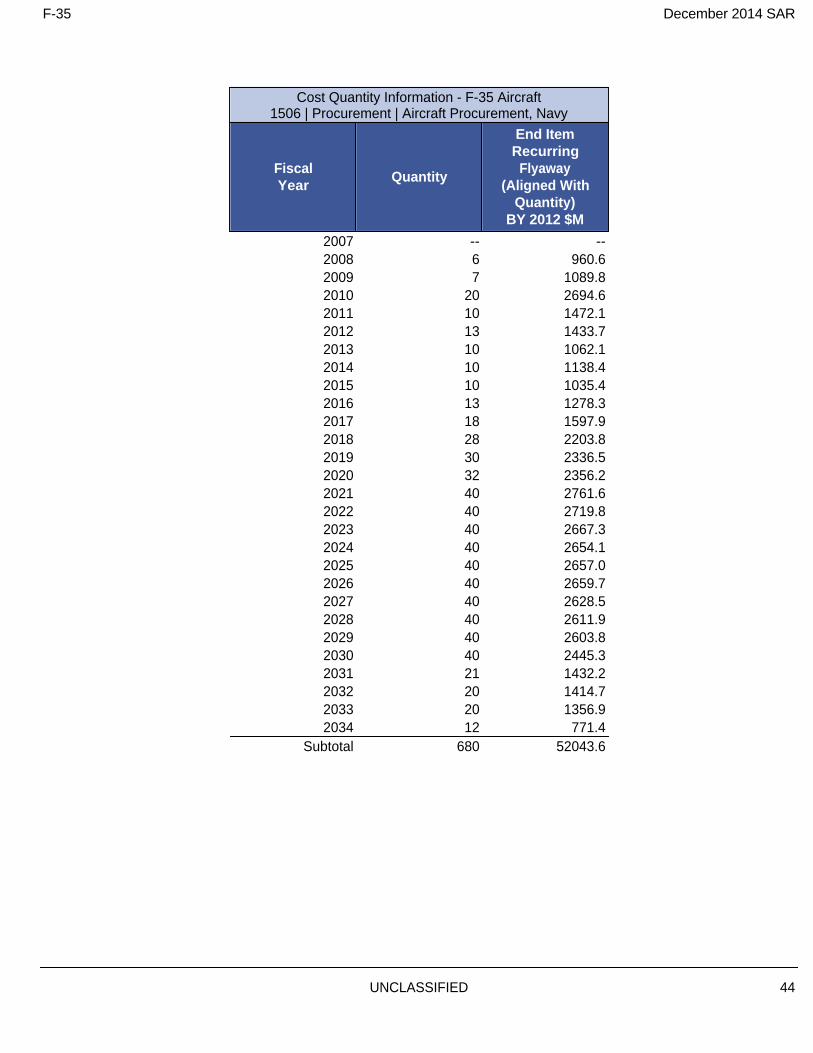
Cost Quantity Information - F-35 Aircraft1506 | Procurement | Aircraft Procurement, Navy
FiscalYear
Quantity
End ItemRecurring
Flyaway(Aligned With
Quantity)BY 2012 $M
2007 -- --2008 6 960.62009 7 1089.82010 20 2694.62011 10 1472.12012 13 1433.72013 10 1062.12014 10 1138.42015 10 1035.42016 13 1278.32017 18 1597.92018 28 2203.82019 30 2336.52020 32 2356.22021 40 2761.62022 40 2719.82023 40 2667.32024 40 2654.12025 40 2657.02026 40 2659.72027 40 2628.52028 40 2611.92029 40 2603.82030 40 2445.32031 21 1432.22032 20 1414.72033 20 1356.92034 12 771.4
Subtotal 680 52043.6
F-35 December 2014 SAR
UNCLASSIFIED 44

Annual Funding - F-35 Aircraft1205 | MILCON | Military Construction, Navy and Marine
Corps
FiscalYear
TY $M
TotalProgram
2004 24.42005 --2006 0.12007 --2008 0.22009 0.72010 34.12011 377.92012 172.22013 94.92014 --2015 131.92016 94.42017 230.92018 64.72019 122.02020 119.82021 116.22022 75.92023 101.32024 145.02025 --2026 61.92027 75.02028 65.12029 2.0
Subtotal 2110.6
F-35 December 2014 SAR
UNCLASSIFIED 45

Annual Funding - F-35 Aircraft1205 | MILCON | Military Construction, Navy and Marine
Corps
FiscalYear
BY 2012 $M
TotalProgram
2004 27.82005 --2006 0.12007 --2008 0.22009 0.72010 34.12011 368.92012 165.52013 89.82014 --2015 120.72016 84.72017 203.32018 55.82019 103.22020 99.42021 94.52022 60.52023 79.22024 111.12025 --2026 45.62027 54.22028 46.12029 1.4
Subtotal 1846.8
F-35 December 2014 SAR
UNCLASSIFIED 46

All DoN MILCON funding is reflected in the Aircraft subprogram.
F-35 December 2014 SAR
UNCLASSIFIED 47

Annual Funding - F-35 Aircraft3300 | MILCON | Military Construction, Air Force
FiscalYear
TY $M
TotalProgram
2004 1.72005 10.02006 --2007 --2008 100.32009 116.02010 125.12011 139.62012 24.32013 13.52014 56.02015 66.72016 198.32017 158.02018 23.42019 21.02020 134.62021 66.62022 73.12023 167.02024 142.32025 122.12026 118.42027 129.92028 101.82029 102.72030 94.62031 71.72032 71.22033 37.52034 24.82035 4.3
Subtotal 2516.5
F-35 December 2014 SAR
UNCLASSIFIED 48

Annual Funding - F-35 Aircraft3300 | MILCON | Military Construction, Air Force
FiscalYear
BY 2012 $M
TotalProgram
2004 1.92005 11.12006 --2007 --2008 104.12009 118.82010 125.02011 136.32012 23.42013 12.82014 52.12015 61.02016 178.02017 139.12018 20.22019 17.82020 111.72021 54.22022 58.32023 130.52024 109.12025 91.72026 87.22027 93.82028 72.12029 71.32030 64.42031 47.82032 46.62033 24.02034 15.62035 2.7
Subtotal 2082.6
F-35 December 2014 SAR
UNCLASSIFIED 49

All Air Force F-35 MILCON funding is reflected in the Aircraft subprogram.
F-35 December 2014 SAR
UNCLASSIFIED 50

Annual Funding By Appropriation - F-35 Engine
Annual Funding - F-35 Engine3600 | RDT&E | Research, Development, Test, and Evaluation, Air Force
FiscalYear
Quantity
TY $M
End ItemRecurring
Flyaway
Non EndItem
RecurringFlyaway
NonRecurring
Flyaway
TotalFlyaway
TotalSupport
TotalProgram
1995 -- -- -- -- -- -- 16.41996 -- -- -- -- -- -- 15.91997 -- -- -- -- -- -- 49.31998 -- -- -- -- -- -- 87.11999 -- -- -- -- -- -- 89.42000 -- -- -- -- -- -- 48.82001 -- -- -- -- -- -- 66.92002 -- -- -- -- -- -- 409.82003 -- -- -- -- -- -- 400.52004 -- -- -- -- -- -- 435.82005 -- -- -- -- -- -- 614.32006 -- -- -- -- -- -- 586.32007 -- -- -- -- -- -- 441.62008 -- -- -- -- -- -- 596.02009 -- -- -- -- -- -- 544.62010 -- -- -- -- -- -- 466.12011 -- -- -- -- -- -- 216.22012 -- -- -- -- -- -- 101.82013 -- -- -- -- -- -- 157.52014 -- -- -- -- -- -- 54.22015 -- -- -- -- -- -- 83.82016 -- -- -- -- -- -- 77.32017 -- -- -- -- -- -- 14.62018 -- -- -- -- -- -- 0.2
Subtotal 5 -- -- -- -- -- 5574.4
F-35 December 2014 SAR
UNCLASSIFIED 51

Annual Funding - F-35 Engine3600 | RDT&E | Research, Development, Test, and Evaluation, Air Force
FiscalYear
Quantity
BY 2012 $M
End ItemRecurring
Flyaway
Non EndItem
RecurringFlyaway
NonRecurring
Flyaway
TotalFlyaway
TotalSupport
TotalProgram
1995 -- -- -- -- -- -- 21.71996 -- -- -- -- -- -- 20.61997 -- -- -- -- -- -- 63.21998 -- -- -- -- -- -- 110.81999 -- -- -- -- -- -- 112.42000 -- -- -- -- -- -- 60.52001 -- -- -- -- -- -- 81.82002 -- -- -- -- -- -- 496.02003 -- -- -- -- -- -- 477.82004 -- -- -- -- -- -- 505.82005 -- -- -- -- -- -- 694.72006 -- -- -- -- -- -- 643.02007 -- -- -- -- -- -- 472.72008 -- -- -- -- -- -- 626.52009 -- -- -- -- -- -- 565.22010 -- -- -- -- -- -- 476.62011 -- -- -- -- -- -- 215.92012 -- -- -- -- -- -- 99.92013 -- -- -- -- -- -- 152.32014 -- -- -- -- -- -- 51.92015 -- -- -- -- -- -- 79.02016 -- -- -- -- -- -- 71.62017 -- -- -- -- -- -- 13.32018 -- -- -- -- -- -- 0.2
Subtotal 5 -- -- -- -- -- 6113.4
F-35 December 2014 SAR
UNCLASSIFIED 52

Annual Funding - F-35 Engine1319 | RDT&E | Research, Development, Test, and Evaluation, Navy
FiscalYear
Quantity
TY $M
End ItemRecurring
Flyaway
Non EndItem
RecurringFlyaway
NonRecurring
Flyaway
TotalFlyaway
TotalSupport
TotalProgram
1994 -- -- -- -- -- -- 5.81995 -- -- -- -- -- -- 19.31996 -- -- -- -- -- -- 15.81997 -- -- -- -- -- -- 47.71998 -- -- -- -- -- -- 87.81999 -- -- -- -- -- -- 92.42000 -- -- -- -- -- -- 46.72001 -- -- -- -- -- -- 66.92002 -- -- -- -- -- -- 350.42003 -- -- -- -- -- -- 550.82004 -- -- -- -- -- -- 533.22005 -- -- -- -- -- -- 573.52006 -- -- -- -- -- -- 528.12007 -- -- -- -- -- -- 639.12008 -- -- -- -- -- -- 563.92009 -- -- -- -- -- -- 433.12010 -- -- -- -- -- -- 445.72011 -- -- -- -- -- -- 250.92012 -- -- -- -- -- -- 187.62013 -- -- -- -- -- -- 199.32014 -- -- -- -- -- -- 111.42015 -- -- -- -- -- -- 153.32016 -- -- -- -- -- -- 122.72017 -- -- -- -- -- -- 41.42018 -- -- -- -- -- -- 0.3
Subtotal 9 -- -- -- -- -- 6067.1
F-35 December 2014 SAR
UNCLASSIFIED 53

Annual Funding - F-35 Engine1319 | RDT&E | Research, Development, Test, and Evaluation, Navy
FiscalYear
Quantity
BY 2012 $M
End ItemRecurring
Flyaway
Non EndItem
RecurringFlyaway
NonRecurring
Flyaway
TotalFlyaway
TotalSupport
TotalProgram
1994 -- -- -- -- -- -- 7.81995 -- -- -- -- -- -- 25.51996 -- -- -- -- -- -- 20.51997 -- -- -- -- -- -- 61.21998 -- -- -- -- -- -- 111.71999 -- -- -- -- -- -- 116.22000 -- -- -- -- -- -- 57.92001 -- -- -- -- -- -- 81.82002 -- -- -- -- -- -- 424.12003 -- -- -- -- -- -- 657.12004 -- -- -- -- -- -- 618.82005 -- -- -- -- -- -- 648.52006 -- -- -- -- -- -- 579.12007 -- -- -- -- -- -- 684.12008 -- -- -- -- -- -- 592.82009 -- -- -- -- -- -- 449.52010 -- -- -- -- -- -- 455.82011 -- -- -- -- -- -- 250.52012 -- -- -- -- -- -- 184.22013 -- -- -- -- -- -- 192.72014 -- -- -- -- -- -- 106.72015 -- -- -- -- -- -- 144.52016 -- -- -- -- -- -- 113.72017 -- -- -- -- -- -- 37.62018 -- -- -- -- -- -- 0.3
Subtotal 9 -- -- -- -- -- 6622.6
F-35 December 2014 SAR
UNCLASSIFIED 54

Annual Funding - F-35 Engine0400 | RDT&E | Research, Development, Test, and Evaluation, Defense-Wide
FiscalYear
Quantity
TY $M
End ItemRecurring
Flyaway
Non EndItem
RecurringFlyaway
NonRecurring
Flyaway
TotalFlyaway
TotalSupport
TotalProgram
1994 -- -- -- -- -- -- 5.71995 -- -- -- -- -- -- 13.41996 -- -- -- -- -- -- 4.0
Subtotal -- -- -- -- -- -- 23.1
F-35 December 2014 SAR
UNCLASSIFIED 55

Annual Funding - F-35 Engine0400 | RDT&E | Research, Development, Test, and Evaluation, Defense-Wide
FiscalYear
Quantity
BY 2012 $M
End ItemRecurring
Flyaway
Non EndItem
RecurringFlyaway
NonRecurring
Flyaway
TotalFlyaway
TotalSupport
TotalProgram
1994 -- -- -- -- -- -- 7.71995 -- -- -- -- -- -- 17.71996 -- -- -- -- -- -- 5.2
Subtotal -- -- -- -- -- -- 30.6
F-35 December 2014 SAR
UNCLASSIFIED 56

Annual Funding - F-35 Engine9999 | RDT&E | Non Treasury Funds
FiscalYear
Quantity
TY $M
End ItemRecurring
Flyaway
Non EndItem
RecurringFlyaway
NonRecurring
Flyaway
TotalFlyaway
TotalSupport
TotalProgram
1996 -- -- -- -- -- -- 2.71997 -- -- -- -- -- -- 3.91998 -- -- -- -- -- -- 5.11999 -- -- -- -- -- -- 5.72000 -- -- -- -- -- -- 1.82001 -- -- -- -- -- -- 0.52002 -- -- -- -- -- -- 43.32003 -- -- -- -- -- -- 124.32004 -- -- -- -- -- -- 54.12005 -- -- -- -- -- -- 0.32006 -- -- -- -- -- -- --2007 -- -- -- -- -- -- 75.02008 -- -- -- -- -- -- --2009 -- -- -- -- -- -- --2010 -- -- -- -- -- -- --2011 -- -- -- -- -- -- --2012 -- -- -- -- -- -- --2013 -- -- -- -- -- -- 0.3
Subtotal -- -- -- -- -- -- 317.0
F-35 December 2014 SAR
UNCLASSIFIED 57

Annual Funding - F-35 Engine9999 | RDT&E | Non Treasury Funds
FiscalYear
Quantity
BY 2012 $M
End ItemRecurring
Flyaway
Non EndItem
RecurringFlyaway
NonRecurring
Flyaway
TotalFlyaway
TotalSupport
TotalProgram
1996 -- -- -- -- -- -- 3.51997 -- -- -- -- -- -- 5.01998 -- -- -- -- -- -- 6.51999 -- -- -- -- -- -- 7.22000 -- -- -- -- -- -- 2.22001 -- -- -- -- -- -- 0.62002 -- -- -- -- -- -- 52.42003 -- -- -- -- -- -- 148.32004 -- -- -- -- -- -- 62.82005 -- -- -- -- -- -- 0.32006 -- -- -- -- -- -- --2007 -- -- -- -- -- -- 80.32008 -- -- -- -- -- -- --2009 -- -- -- -- -- -- --2010 -- -- -- -- -- -- --2011 -- -- -- -- -- -- --2012 -- -- -- -- -- -- --2013 -- -- -- -- -- -- 0.3
Subtotal -- -- -- -- -- -- 369.4
F-35 December 2014 SAR
UNCLASSIFIED 58

Annual Funding - F-35 Engine3010 | Procurement | Aircraft Procurement, Air Force
FiscalYear
Quantity
TY $M
End ItemRecurring
Flyaway
Non EndItem
RecurringFlyaway
NonRecurring
Flyaway
TotalFlyaway
TotalSupport
TotalProgram
2006 -- 9.8 -- -- 9.8 -- 9.82007 2 47.5 -- 6.9 54.4 27.7 82.12008 6 123.6 -- 35.0 158.6 30.9 189.52009 7 127.0 -- 63.9 190.9 33.3 224.22010 10 176.7 -- 72.6 249.3 59.1 308.42011 22 353.2 -- 91.6 444.8 136.6 581.42012 18 275.3 -- 66.0 341.3 123.0 464.32013 19 262.5 -- 11.9 274.4 89.6 364.02014 19 282.1 -- 31.2 313.3 47.5 360.82015 28 386.7 -- 15.5 402.2 116.2 518.42016 44 606.1 -- 23.2 629.3 126.7 756.02017 48 635.6 -- 58.3 693.9 130.4 824.32018 60 766.1 -- 53.7 819.8 152.6 972.42019 60 773.3 -- 57.7 831.0 157.7 988.72020 60 787.5 -- 35.5 823.0 171.1 994.12021 60 814.3 -- 35.3 849.6 180.0 1029.62022 80 1059.6 -- 42.5 1102.1 249.5 1351.62023 80 1081.6 -- 43.2 1124.8 229.7 1354.52024 80 1105.5 -- 43.2 1148.7 233.2 1381.92025 80 1140.1 -- 44.2 1184.3 245.8 1430.12026 80 1169.2 -- 45.4 1214.6 248.0 1462.62027 80 1195.9 -- 45.0 1240.9 263.2 1504.12028 80 1228.7 -- 45.4 1274.1 201.9 1476.02029 80 1263.6 -- 47.7 1311.3 234.9 1546.22030 80 1297.6 -- 48.5 1346.1 265.9 1612.02031 80 1345.0 -- 50.5 1395.5 278.6 1674.12032 80 1381.9 -- 49.4 1431.3 194.1 1625.42033 80 1428.8 -- 50.5 1479.3 184.8 1664.12034 80 1478.1 -- 50.9 1529.0 166.5 1695.52035 80 1532.9 -- 52.9 1585.8 173.1 1758.92036 80 1577.3 -- 52.2 1629.5 150.1 1779.62037 80 1473.7 -- 49.3 1523.0 158.3 1681.32038 20 401.8 -- 18.7 420.5 96.5 517.0
Subtotal 1763 27588.6 -- 1437.8 29026.4 5156.5 34182.9
F-35 December 2014 SAR
UNCLASSIFIED 59

Annual Funding - F-35 Engine3010 | Procurement | Aircraft Procurement, Air Force
FiscalYear
Quantity
BY 2012 $M
End ItemRecurring
Flyaway
Non EndItem
RecurringFlyaway
NonRecurring
Flyaway
TotalFlyaway
TotalSupport
TotalProgram
2006 -- 10.6 -- -- 10.6 -- 10.62007 2 50.2 -- 7.3 57.5 29.2 86.72008 6 128.6 -- 36.4 165.0 32.2 197.22009 7 130.3 -- 65.6 195.9 34.2 230.12010 10 177.6 -- 72.9 250.5 59.4 309.92011 22 347.8 -- 90.2 438.0 134.6 572.62012 18 267.1 -- 64.0 331.1 119.4 450.52013 19 251.8 -- 11.4 263.2 85.9 349.12014 19 266.4 -- 29.4 295.8 44.9 340.72015 28 359.1 -- 14.4 373.5 107.9 481.42016 44 552.6 -- 21.2 573.8 115.5 689.32017 48 568.5 -- 52.1 620.6 116.7 737.32018 60 671.9 -- 47.1 719.0 133.9 852.92019 60 664.9 -- 49.6 714.5 135.7 850.22020 60 663.9 -- 29.9 693.8 144.2 838.02021 60 673.0 -- 29.2 702.2 148.8 851.02022 80 858.6 -- 34.4 893.0 202.2 1095.22023 80 859.2 -- 34.3 893.5 182.5 1076.02024 80 861.0 -- 33.6 894.6 181.7 1076.32025 80 870.5 -- 33.7 904.2 187.8 1092.02026 80 875.2 -- 34.0 909.2 185.7 1094.92027 80 877.7 -- 33.0 910.7 193.2 1103.92028 80 884.1 -- 32.7 916.8 145.2 1062.02029 80 891.3 -- 33.6 924.9 165.8 1090.72030 80 897.4 -- 33.5 930.9 183.9 1114.82031 80 911.9 -- 34.2 946.1 189.0 1135.12032 80 918.6 -- 32.8 951.4 129.0 1080.42033 80 931.1 -- 32.9 964.0 120.5 1084.52034 80 944.4 -- 32.5 976.9 106.4 1083.32035 80 960.2 -- 33.1 993.3 108.4 1101.72036 80 968.6 -- 32.1 1000.7 92.1 1092.82037 80 887.2 -- 29.7 916.9 95.3 1012.22038 20 237.2 -- 11.0 248.2 57.0 305.2
Subtotal 1763 20418.5 -- 1161.8 21580.3 3968.2 25548.5
F-35 December 2014 SAR
UNCLASSIFIED 60

Cost Quantity Information - F-35 Engine3010 | Procurement | Aircraft Procurement, Air Force
FiscalYear
Quantity
End ItemRecurring
Flyaway(Aligned With
Quantity)BY 2012 $M
2006 -- --2007 2 50.22008 6 128.62009 7 130.32010 10 177.62011 22 347.82012 18 267.12013 19 251.82014 19 266.42015 28 359.12016 44 552.62017 48 568.52018 60 671.92019 60 664.92020 60 663.92021 60 673.02022 80 858.62023 80 859.22024 80 861.02025 80 870.52026 80 875.22027 80 877.72028 80 884.12029 80 891.32030 80 897.42031 80 911.92032 80 918.62033 80 931.12034 80 944.42035 80 960.22036 80 972.12037 80 890.72038 20 240.8
Subtotal 1763 20418.5
F-35 December 2014 SAR
UNCLASSIFIED 61

Annual Funding - F-35 Engine1506 | Procurement | Aircraft Procurement, Navy
FiscalYear
Quantity
TY $M
End ItemRecurring
Flyaway
Non EndItem
RecurringFlyaway
NonRecurring
Flyaway
TotalFlyaway
TotalSupport
TotalProgram
2007 -- 27.4 -- -- 27.4 -- 27.42008 6 246.1 -- 1.3 247.4 1.2 248.62009 7 298.0 -- 54.3 352.3 65.6 417.92010 20 599.0 -- 118.5 717.5 127.6 845.12011 10 400.5 -- 112.5 513.0 122.3 635.32012 13 191.4 -- 57.7 249.1 61.9 311.02013 10 236.9 -- 26.6 263.5 169.8 433.32014 10 227.1 -- 21.6 248.7 142.4 391.12015 10 259.5 -- 27.6 287.1 68.0 355.12016 13 362.7 -- 22.3 385.0 109.9 494.92017 18 513.0 -- 28.1 541.1 92.9 634.02018 28 705.6 -- 29.3 734.9 80.3 815.22019 30 763.7 -- 105.9 869.6 99.6 969.22020 32 801.2 -- 93.6 894.8 125.0 1019.82021 40 894.6 -- 68.4 963.0 149.1 1112.12022 40 910.4 -- 68.2 978.6 163.3 1141.92023 40 917.8 -- 66.8 984.6 141.2 1125.82024 40 942.4 -- 78.9 1021.3 147.0 1168.32025 40 966.8 -- 75.6 1042.4 141.1 1183.52026 40 989.4 -- 79.1 1068.5 134.9 1203.42027 40 1010.0 -- 61.4 1071.4 108.8 1180.22028 40 1034.7 -- 57.8 1092.5 97.6 1190.12029 40 1060.0 -- 58.2 1118.2 94.9 1213.12030 40 1000.9 -- 51.5 1052.4 91.3 1143.72031 21 372.2 -- 43.2 415.4 55.3 470.72032 20 345.4 -- 44.5 389.9 45.0 434.92033 20 338.5 -- 46.8 385.3 45.9 431.22034 12 192.5 -- 31.1 223.6 28.5 252.1
Subtotal 680 16607.7 -- 1530.8 18138.5 2710.4 20848.9
F-35 December 2014 SAR
UNCLASSIFIED 62

Annual Funding - F-35 Engine1506 | Procurement | Aircraft Procurement, Navy
FiscalYear
Quantity
BY 2012 $M
End ItemRecurring
Flyaway
Non EndItem
RecurringFlyaway
NonRecurring
Flyaway
TotalFlyaway
TotalSupport
TotalProgram
2007 -- 28.9 -- -- 28.9 -- 28.92008 6 256.1 -- 1.4 257.5 1.2 258.72009 7 305.8 -- 55.8 361.6 67.3 428.92010 20 602.0 -- 119.1 721.1 128.2 849.32011 10 394.4 -- 110.8 505.2 120.5 625.72012 13 185.7 -- 55.9 241.6 60.1 301.72013 10 227.2 -- 25.5 252.7 162.9 415.62014 10 214.5 -- 20.4 234.9 134.4 369.32015 10 241.0 -- 25.6 266.6 63.1 329.72016 13 330.7 -- 20.3 351.0 100.3 451.32017 18 458.9 -- 25.1 484.0 83.1 567.12018 28 618.9 -- 25.7 644.6 70.4 715.02019 30 656.7 -- 91.1 747.8 85.6 833.42020 32 675.4 -- 78.9 754.3 105.4 859.72021 40 739.4 -- 56.5 795.9 123.2 919.12022 40 737.7 -- 55.3 793.0 132.3 925.32023 40 729.1 -- 53.1 782.2 112.1 894.32024 40 734.0 -- 61.4 795.4 114.5 909.92025 40 738.2 -- 57.7 795.9 107.8 903.72026 40 740.6 -- 59.2 799.8 101.0 900.82027 40 741.2 -- 45.1 786.3 79.8 866.12028 40 744.5 -- 41.6 786.1 70.2 856.32029 40 747.7 -- 41.1 788.8 66.9 855.72030 40 692.2 -- 35.6 727.8 63.1 790.92031 21 252.4 -- 29.3 281.7 37.4 319.12032 20 229.6 -- 29.6 259.2 29.9 289.12033 20 220.6 -- 30.5 251.1 29.9 281.02034 12 123.0 -- 19.9 142.9 18.2 161.1
Subtotal 680 13366.4 -- 1271.5 14637.9 2268.8 16906.7
F-35 December 2014 SAR
UNCLASSIFIED 63
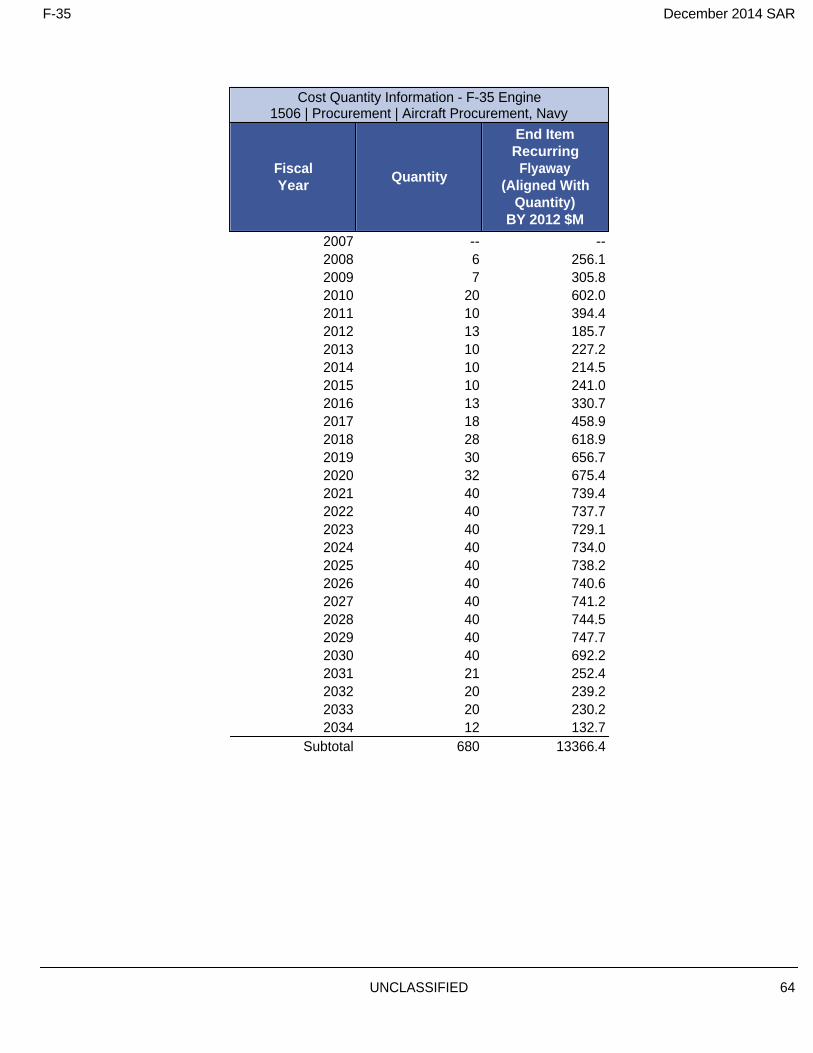
Cost Quantity Information - F-35 Engine1506 | Procurement | Aircraft Procurement, Navy
FiscalYear
Quantity
End ItemRecurring
Flyaway(Aligned With
Quantity)BY 2012 $M
2007 -- --2008 6 256.12009 7 305.82010 20 602.02011 10 394.42012 13 185.72013 10 227.22014 10 214.52015 10 241.02016 13 330.72017 18 458.92018 28 618.92019 30 656.72020 32 675.42021 40 739.42022 40 737.72023 40 729.12024 40 734.02025 40 738.22026 40 740.62027 40 741.22028 40 744.52029 40 747.72030 40 692.22031 21 252.42032 20 239.22033 20 230.22034 12 132.7
Subtotal 680 13366.4
F-35 December 2014 SAR
UNCLASSIFIED 64

Low Rate Initial Production
F-35 Aircraft
Item Initial LRIP Decision Current Total LRIP
Approval Date 10/26/2001 3/28/2012
Approved Quantity 465 340
Reference Milestone B ADM Milestone B Re-approval ADM
Start Year 2006 2006
End Year 2015 2018
The Current Total LRIP Quantity is more than 10% of the total production quantity due to the necessity to prevent a break in production and to ramp up to FRP.
The USD(AT&L) approved the LRIP quantity of 465 (in six LRIP lots) in the original MS B ADM dated October 26, 2001. The LRIP quantity has been revised to 340 (in eleven LRIP lots) based on the FY 2016 PB.
F-35 Engine
Item Initial LRIP Decision Current Total LRIP
Approval Date 10/26/2001 3/28/2012
Approved Quantity 465 340
Reference Milestone B ADM Milestone B Re-approval ADM
Start Year 2006 2006
End Year 2015 2018
The Current Total LRIP Quantity is more than 10% of the total production quantity due to the necessity to prevent a break in production and to ramp up to FRP.
The USD(AT&L) approved the LRIP quantity of 465 (in six LRIP lots) in the original MS B ADM dated October 26, 2001. The LRIP quantity has been revised to 340 (in eleven LRIP lots) based on the FY 2016 PB.
F-35 December 2014 SAR
UNCLASSIFIED 65

Foreign Military Sales
F-35 Aircraft
CountryDate of
SaleQuantity
TotalCost $M
Description
Korea 9/14/2014 40 6277.0 All 40 aircraft will be the F-35A aircraft.Japan 5/23/2014 10 2263.4 Japan signed an amendment to add four F-35A's
delivered from a Japan F-35 Final Assembly and Checkout facility in 2018. There is an option to purchase 32 additional F-35A aircraft.
Israel 9/30/2010 19 2623.3 All 19 aircraft will be the F-35A aircraft.
Notes
F-35 Engine
Notes
FMS information for the F-35 Engine subprogram are reflected in the F-35 Aircraft subprogram.
Nuclear Costs
F-35 Aircraft
None
F-35 Engine
None
F-35 December 2014 SAR
UNCLASSIFIED 66

Unit Cost
F-35 Aircraft
Unit Cost Report
Item
BY 2012 $M BY 2012 $M
% ChangeCurrent UCRBaseline
(Jun 2014 APB)
Current Estimate(Dec 2014 SAR)
Program Acquisition Unit CostCost 274958.4 264753.9 Quantity 2457 2457 Item 111.908 107.755 -3.71
Average Procurement Unit CostCost 224332.9 214712.4 Quantity 2443 2443 Unit Cost 91.827 87.889 -4.29
Item
BY 2012 $M BY 2012 $M
% ChangeRevised
Original UCRBaseline
(Mar 2012 APB)
Current Estimate(Dec 2014 SAR)
Program Acquisition Unit Cost Cost 276482.2 264753.9 Quantity 2458 2457 Unit Cost 112.483 107.755 -4.20
Average Procurement Unit CostCost 224333.7 214712.4 Quantity 2443 2443 Unit Cost 91.827 87.889 -4.29
The DoD average F-35 Aircraft Unit Recurring Flyaway (URF) Cost consists of the Hardware (Airframe, Vehicle Systems, Mission Systems, and Engineering Change Order) costs over the life of the program. The URF assumes the planned quantity benefits of 101 FMS aircraft and 612 International Partner aircraft.
F-35A (Conventional Take Off and Landing) URF - $65.2 M (BY 2012) F-35B (Short Takeoff and Vertical Landing) URF - $76.8M (BY 2012) F-35C (Carrier Variant) URF - $77.7 M (BY 2012)
F-35 December 2014 SAR
UNCLASSIFIED 67

F-35 Aircraft
Unit Cost History
Item DateBY 2012 $M TY $M
PAUC APUC PAUC APUC
Original APB Oct 2001 74.567 60.632 81.298 68.934APB as of January 2006 Mar 2004 94.837 73.845 100.407 81.826Revised Original APB Mar 2012 112.529 91.827 135.065 115.697Prior APB Mar 2012 112.529 91.827 135.065 115.697Current APB Jun 2014 111.908 91.827 134.638 115.697Prior Annual SAR Dec 2013 108.694 89.009 134.296 115.747Current Estimate Dec 2014 107.755 87.889 131.918 113.208
SAR Unit Cost History
Current SAR Baseline to Current Estimate (TY $M)
Initial PAUCDevelopment
Estimate
Changes PAUCCurrentEstimateEcon Qty Sch Eng Est Oth Spt Total
135.065 1.197 0.000 1.394 0.000 -3.685 0.000 -2.053 -3.147 131.918
F-35 December 2014 SAR
UNCLASSIFIED 68

Current SAR Baseline to Current Estimate (TY $M)
Initial APUCDevelopment
Estimate
Changes APUCCurrentEstimate Econ Qty Sch Eng Est Oth Spt Total
115.697 1.181 0.000 1.402 0.000 -3.008 0.000 -2.065 -2.490 113.208
SAR Baseline History
ItemSAR
PlanningEstimate
SARDevelopment
Estimate
SARProduction
Estimate
CurrentEstimate
Milestone I N/A Nov 1996 N/A Nov 1996Milestone B Mar 2001 Mar 2012 N/A Mar 2012Milestone C TBD Apr 2019 N/A Apr 2019IOC TBD TBD N/A Jul 2015Total Cost (TY $M) 24800.0 331855.2 N/A 324121.3Total Quantity N/A 2457 N/A 2457PAUC N/A 135.065 N/A 131.918
The Service IOC reflected in the above table is the U.S. Marine Corps Objective date. In addition, the U.S. Air Force IOC objective date is August 2016, and the U.S. Navy IOC objective date is August 2018.
F-35 December 2014 SAR
UNCLASSIFIED 69

F-35 Engine
Unit Cost Report
Item
BY 2012 $M BY 2012 $M
% ChangeCurrent UCRBaseline
(Jun 2014 APB)
Current Estimate(Dec 2014 SAR)
Program Acquisition Unit CostCost 55273.5 55591.2 Quantity 2457 2457 Item 22.496 22.626 +0.58
Average Procurement Unit CostCost 42332.9 42455.2 Quantity 2443 2443 Unit Cost 17.328 17.378 +0.29
Item
BY 2012 $M BY 2012 $M
% ChangeOriginal UCRBaseline
(Mar 2012 APB)
Current Estimate(Dec 2014 SAR)
Program Acquisition Unit Cost Cost 53916.4 55591.2 Quantity 2458 2457 Unit Cost 21.935 22.626 +3.15
Average Procurement Unit CostCost 42332.9 42455.2 Quantity 2443 2443 Unit Cost 17.328 17.378 +0.29
The DoD average F-35 Engine Unit Recurring Flyaway (URF) Cost consists of the Hardware (Propulsion and Engineering Change Order) costs over the life of the program. The URF assumes the planned quantity benefits of 101 FMS engines and 612 International Partner engines.
F-35A (Conventional Take Off and Landing) URF - $11.6 M (BY 2012) F-35B (Short Takeoff and Vertical Landing) URF - $28.3 M (BY 2012) F-35C (Carrier Variant) URF - $11.4 M (BY 2012)
F-35 December 2014 SAR
UNCLASSIFIED 70

F-35 Engine
Unit Cost History
Item DateBY 2012 $M TY $M
PAUC APUC PAUC APUC
Original APB Mar 2012 21.989 17.328 25.990 21.708APB as of January 2006 N/A N/A N/A N/A N/ARevised Original APB N/A N/A N/A N/A N/APrior APB Mar 2012 21.989 17.328 25.990 21.708Current APB Jun 2014 22.496 17.328 26.396 21.708Prior Annual SAR Dec 2013 22.968 17.670 27.929 23.125Current Estimate Dec 2014 22.626 17.378 27.274 22.526
SAR Unit Cost History
Current SAR Baseline to Current Estimate (TY $M)
Initial PAUCDevelopment
Estimate
Changes PAUCCurrentEstimateEcon Qty Sch Eng Est Oth Spt Total
25.990 0.208 0.000 0.263 0.000 1.152 0.000 -0.339 1.284 27.274
F-35 December 2014 SAR
UNCLASSIFIED 71

Current SAR Baseline to Current Estimate (TY $M)
Initial APUCDevelopment
Estimate
Changes APUCCurrentEstimate Econ Qty Sch Eng Est Oth Spt Total
21.708 0.200 0.000 0.264 0.000 0.694 0.000 -0.340 0.818 22.526
SAR Baseline History
ItemSAR
PlanningEstimate
SARDevelopment
Estimate
SARProduction
Estimate
CurrentEstimate
Milestone A N/A N/A N/A N/AMilestone B N/A N/A N/A N/AMilestone C N/A N/A N/A N/AIOC N/A N/A N/A N/ATotal Cost (TY $M) N/A 63856.6 N/A 67013.4Total Quantity N/A 2457 N/A 2457PAUC N/A 25.990 N/A 27.274
F-35 December 2014 SAR
UNCLASSIFIED 72

Cost Variance
F-35 Aircraft
Summary TY $M
Item RDT&E Procurement MILCON Total
SAR Baseline (Development Estimate)
44410.1 282647.8 4797.3 331855.2
Previous ChangesEconomic +90.0 +6303.8 +99.9 +6493.7Quantity -- -- -- --Schedule -- +2525.7 -- +2525.7Engineering -- -- -- --Estimating -1727.5 -6218.6 -476.2 -8422.3Other -- -- -- --Support -- -2488.2 -- -2488.2
Subtotal -1637.5 +122.7 -376.3 -1891.1Current Changes
Economic -65.4 -3417.6 -70.4 -3553.4Quantity -- -- -- --Schedule -- +899.8 -- +899.8Engineering -- -- -- --Estimating +219.6 -1129.8 +276.5 -633.7Other -- -- -- --Support -- -2555.5 -- -2555.5
Subtotal +154.2 -6203.1 +206.1 -5842.8Total Changes -1483.3 -6080.4 -170.2 -7733.9
Current Estimate 42926.8 276567.4 4627.1 324121.3
F-35 December 2014 SAR
UNCLASSIFIED 73

Summary BY 2012 $M
Item RDT&E Procurement MILCON Total
SAR Baseline (Development Estimate)
47982.1 224332.9 4168.0 276483.0
Previous ChangesEconomic -- -- -- --Quantity -- -- -- --Schedule -- -- -- --Engineering -- -- -- --Estimating -2073.4 -4426.6 -466.1 -6966.1Other -- -- -- --Support -- -2456.3 -- -2456.3
Subtotal -2073.4 -6882.9 -466.1 -9422.4Current Changes
Economic -- -- -- --Quantity -- -- -- --Schedule -- -- -- --Engineering -- -- -- --Estimating +203.4 -691.0 +227.5 -260.1Other -- -- -- --Support -- -2046.6 -- -2046.6
Subtotal +203.4 -2737.6 +227.5 -2306.7Total Changes -1870.0 -9620.5 -238.6 -11729.1
Current Estimate 46112.1 214712.4 3929.4 264753.9
Previous Estimate: December 2013
F-35 December 2014 SAR
UNCLASSIFIED 74

RDT&E $M
Current Change ExplanationsBase Year
Then Year
Revised escalation indices. (Economic) N/A -65.4Adjustment for current and prior escalation. (Estimating) +26.9 +28.1Increase due to additional scope to Initial Operational Test and Evaluation International
Program. (Estimating)+45.0 +50.9
Realignment of costs between Aircraft subprogram and Engine subprogram. (Air Force) (Estimating)
+18.0 +18.5
Realignment of costs between Aircraft subprogram and Engine subprogram. (Navy) (Estimating)
+119.4 +124.9
Decrease due to realignment of program funding, Congressional reductions, and actual funding investment. (Air Force) (Estimating)
-4.2 -3.6
Increase due to realignment of program funding and actual funding investment. (Navy) (Estimating)
-1.7 +0.8
RDT&E Subtotal +203.4 +154.2
Procurement $M
Current Change ExplanationsBase Year
Then Year
Revised escalation indices. (Economic) N/A -3417.6Increase for revised DoD procurement profile (i.e. lower near-term ramp rate) and extended
Department of the Navy program from FY 2033 to FY 2034. (Air Force) (Schedule)0.0 +548.1
Increase for revised DoD procurement profile (i.e. lower near-term ramp rate) and extended Department of the Navy program from FY 2033 to FY 2034. (Navy) (Schedule)
0.0 +351.7
Adjustment for current and prior escalation. (Estimating) +120.1 +127.5Decrease due to revised International procurement quantity profile. (Air Force) (Estimating) -123.7 -167.8Decrease due to revised International procurement quantity profile. (Navy) (Estimating) -83.7 -96.2Revised estimate of subcontractor cost due to the incorporation of the latest actuals from
early LRIP lots. (Air Force) (Estimating)-501.5 -715.2
Revised estimate of subcontractor cost due to the incorporation of the latest actuals from early LRIP lots. (Navy) (Estimating)
+197.8 +238.2
Revised estimate of Airframe cost due to the incorporation of the latest actuals from early LRIP lots. (Air Force) (Estimating)
+2701.6 +3526.0
Revised estimate of Airframe cost due to the incorporation of the latest actuals from early LRIP lots. (Navy) (Estimating)
+333.3 +395.2
Revised estimate of Airframe cost due to the incorporation of the latest Prime and subcontractor Labor/Exchange Rates. (Air Force) (Estimating)
-2531.9 -3455.5
Revised estimate of Airframe cost due to the incorporation of the latest Prime and subcontractor Labor/Exchange Rates. (Navy) (Estimating)
-803.0 -982.0
Adjustment for current and prior escalation. (Support) +29.6 +31.1Decrease in Other Support due to maturation of technical baseline, definition of customer
requirements, and further definition of Service beddown plans. (Air Force) (Support)-713.0 -959.5
Decrease in Other Support due to maturation of technical baseline, definition of customer requirements, and further definition of Service beddown plans. (Navy) (Support)
-414.9 -527.0
Decrease in Initial Spares due to maturation of technical baseline, definition of customer requirements, and further definition of Service beddown plans. (Air Force) (Support)
-61.1 -32.1
F-35 December 2014 SAR
UNCLASSIFIED 75

Decrease in Initial Spares due to maturation of technical baseline, definition of customer requirements, and further definition of Service beddown plans. (Navy) (Support)
-887.2 -1068.0
Procurement Subtotal -2737.6 -6203.1
MILCON $M
Current Change ExplanationsBase Year
Then Year
Revised escalation indices. (Economic) N/A -70.4Adjustment for current and prior escalation. (Estimating) +3.1 +3.2Increase due to revised estimate of MILCON requirements. (Air Force) (Estimating) +150.0 +165.3Increase due to revised estimate of MILCON requirements. (Navy) (Estimating) +74.4 +108.0
MILCON Subtotal +227.5 +206.1
F-35 December 2014 SAR
UNCLASSIFIED 76

Cost Variance
F-35 Engine
Summary TY $M
Item RDT&E Procurement MILCON Total
SAR Baseline (Development Estimate)
10823.7 53032.9 -- 63856.6
Previous ChangesEconomic +30.7 +1179.1 -- +1209.8Quantity -- -- -- --Schedule -- +467.4 -- +467.4Engineering -- -- -- --Estimating +1270.6 +2013.5 -- +3284.1Other -- -- -- --Support -- -197.4 -- -197.4
Subtotal +1301.3 +3462.6 -- +4763.9Current Changes
Economic -9.5 -689.8 -- -699.3Quantity -- -- -- --Schedule -- +178.2 -- +178.2Engineering -- -- -- --Estimating -133.9 -317.8 -- -451.7Other -- -- -- --Support -- -634.3 -- -634.3
Subtotal -143.4 -1463.7 -- -1607.1Total Changes +1157.9 +1998.9 -- +3156.8
Current Estimate 11981.6 55031.8 -- 67013.4
F-35 December 2014 SAR
UNCLASSIFIED 77

Summary BY 2012 $M
Item RDT&E Procurement MILCON Total
SAR Baseline (Development Estimate)
11695.2 42332.9 -- 54028.1
Previous ChangesEconomic -- -- -- --Quantity -- -- -- --Schedule -- -- -- --Engineering -- -- -- --Estimating +1569.0 +1071.4 -- +2640.4Other -- -- -- --Support -- -235.6 -- -235.6
Subtotal +1569.0 +835.8 -- +2404.8Current Changes
Economic -- -- -- --Quantity -- -- -- --Schedule -- -- -- --Engineering -- -- -- --Estimating -128.2 -182.8 -- -311.0Other -- -- -- --Support -- -530.7 -- -530.7
Subtotal -128.2 -713.5 -- -841.7Total Changes +1440.8 +122.3 -- +1563.1
Current Estimate 13136.0 42455.2 -- 55591.2
Previous Estimate: December 2013
F-35 December 2014 SAR
UNCLASSIFIED 78
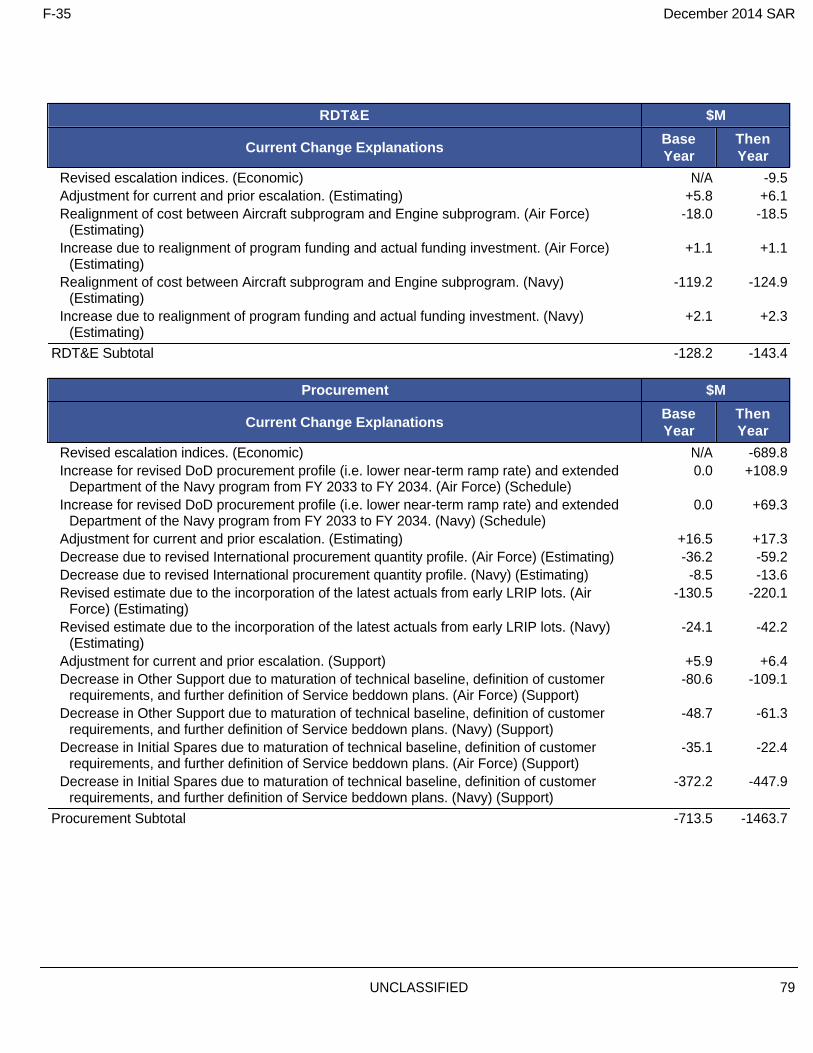
RDT&E $M
Current Change ExplanationsBase Year
Then Year
Revised escalation indices. (Economic) N/A -9.5Adjustment for current and prior escalation. (Estimating) +5.8 +6.1Realignment of cost between Aircraft subprogram and Engine subprogram. (Air Force)
(Estimating)-18.0 -18.5
Increase due to realignment of program funding and actual funding investment. (Air Force) (Estimating)
+1.1 +1.1
Realignment of cost between Aircraft subprogram and Engine subprogram. (Navy) (Estimating)
-119.2 -124.9
Increase due to realignment of program funding and actual funding investment. (Navy) (Estimating)
+2.1 +2.3
RDT&E Subtotal -128.2 -143.4
Procurement $M
Current Change ExplanationsBase Year
Then Year
Revised escalation indices. (Economic) N/A -689.8Increase for revised DoD procurement profile (i.e. lower near-term ramp rate) and extended
Department of the Navy program from FY 2033 to FY 2034. (Air Force) (Schedule)0.0 +108.9
Increase for revised DoD procurement profile (i.e. lower near-term ramp rate) and extended Department of the Navy program from FY 2033 to FY 2034. (Navy) (Schedule)
0.0 +69.3
Adjustment for current and prior escalation. (Estimating) +16.5 +17.3Decrease due to revised International procurement quantity profile. (Air Force) (Estimating) -36.2 -59.2Decrease due to revised International procurement quantity profile. (Navy) (Estimating) -8.5 -13.6Revised estimate due to the incorporation of the latest actuals from early LRIP lots. (Air
Force) (Estimating)-130.5 -220.1
Revised estimate due to the incorporation of the latest actuals from early LRIP lots. (Navy) (Estimating)
-24.1 -42.2
Adjustment for current and prior escalation. (Support) +5.9 +6.4Decrease in Other Support due to maturation of technical baseline, definition of customer
requirements, and further definition of Service beddown plans. (Air Force) (Support)-80.6 -109.1
Decrease in Other Support due to maturation of technical baseline, definition of customer requirements, and further definition of Service beddown plans. (Navy) (Support)
-48.7 -61.3
Decrease in Initial Spares due to maturation of technical baseline, definition of customer requirements, and further definition of Service beddown plans. (Air Force) (Support)
-35.1 -22.4
Decrease in Initial Spares due to maturation of technical baseline, definition of customer requirements, and further definition of Service beddown plans. (Navy) (Support)
-372.2 -447.9
Procurement Subtotal -713.5 -1463.7
F-35 December 2014 SAR
UNCLASSIFIED 79

Contracts
Contract Identification
Appropriation: Procurement
Contract Name: F-35 LRIP 5
Contractor: Lockheed Martin
Contractor Location: 1 Lockheed BoulevardFt Worth, TX 76108
Contract Number: N00019-10-C-0002
Contract Type: Fixed Price Incentive(Firm Target) (FPIF)
Award Date: July 06, 2010
Definitization Date: December 14, 2012
Contract Price
Initial Contract Price ($M) Current Contract Price ($M) Estimated Price At Completion ($M)
Target Ceiling Qty Target Ceiling Qty Contractor Program Manager
3949.6 N/A 32 4955.6 N/A 32 4986.0 5041.4
Target Price Change Explanation
The difference between the Initial Contract Price Target and the Current Contract Price Target is due to delta driven by definitization of Production Non-recurring, Annualized Sustainment and Spares scope.
Contract Variance
Item Cost Variance Schedule Variance
Cumulative Variances To Date (12/31/2014) -179.0 -91.0 Previous Cumulative Variances -130.5 -185.9 Net Change -48.5 +94.9
Cost and Schedule Variance Explanations
The unfavorable net change in the cost variance is due to Final Assembly and Flight Line labor due to material shortages, Scrap Rework Repair volume, and System Check-Out Procedures failures driving labor inefficiencies and Out of Station work, as well as due to incorporation of non-standard tasks primarily associated with Mission System troubleshooting and reliability issues. In addition, general material costs degraded due to supplier settlements, inventory and higher than expected scrap. Finally, cost degradation in Tech Assist was due to unfavorable settlement between BAE, Lockheed Martin and Magellan for production of F-35A Horizontal Tails and parts.
The favorable net change in the schedule variance is due to completion of behind-schedule assembly labor. All aircraft have delivered as of December 2014.
F-35 December 2014 SAR
UNCLASSIFIED 80

Notes
As a whole, the CLIN consist of multiple contract types including Fixed Price Incentive Fee as well as Cost Plus Incentive Fee and Cost Plus Fixed-Fee. For this reason, the overall contract type is mixed and there is not a true contract ceiling.
This contract is more than 90% complete; therefore, this is the final report for this contract.
F-35 December 2014 SAR
UNCLASSIFIED 81

Contract Identification
Appropriation: Procurement
Contract Name: F-35 LRIP 6
Contractor: Lockheed Martin
Contractor Location: 1 Lockheed BoulevardFt. Worth, TX 76108
Contract Number: N00019-11-C-0083
Contract Type: Fixed Price Incentive(Firm Target) (FPIF), Cost Plus Incentive Fee (CPIF)
Award Date: December 28, 2012
Definitization Date: September 27, 2013
Contract Price
Initial Contract Price ($M) Current Contract Price ($M) Estimated Price At Completion ($M)
Target Ceiling Qty Target Ceiling Qty Contractor Program Manager
4392.1 N/A 36 7209.8 N/A 36 7139.2 7209.8
Target Price Change Explanation
The difference between the Initial Contract Price Target and the Current Contract Price Target is due to definitization of Production Non Recurring, Annualized Sustainment, Non-Annualized Sustainment, Depot, and Spares scope.
Contract Variance
Item Cost Variance Schedule Variance
Cumulative Variances To Date (12/31/2014) -183.0 -193.0 Previous Cumulative Variances -- -- Net Change -183.0 -193.0
Cost and Schedule Variance Explanations
The unfavorable cumulative cost variance is due to Mate and Final Assembly labor due to part shortages, supplier non-conformance, re-work associated with the Rotary Geared Actuator Hinge Tool, seam validation non-conformance, and internal part failures. Engineering changes for Carrier Variant Retract actuator also created delays, rework, and out of sequence activity. Flight Line performance was driven by incorporation of unplanned tasks, non-conformance issues, Government Furnished Equipment/Propulsion, Vehicle & Missions Systems troubleshooting and reliability, and availability/ maturity of 3iR software. Also, Landside Final Finishes failed to reach required learning curves and realize affordability improvements assumed at time of baseline.
The unfavorable cumulative schedule variance is due to the production build which remains behind schedule with aircraft DD250s averaging approximately 3.5 months late to contract.
Notes
As a whole, the CLIN consist of multiple contract types including Fixed Price Incentive Fee as well as Cost Plus Incentive Fee and Cost Plus Fixed-Fee. For this reason, the overall contract type is mixed and there is not a true contract ceiling.
F-35 December 2014 SAR
UNCLASSIFIED 82

Contract Identification
Appropriation: Procurement
Contract Name: F135 LRIP 6
Contractor: Pratt & Whitney
Contractor Location: 400 Aircraft RoadMiddletown, CT 06457
Contract Number: N00019-12-C-0090
Contract Type: Fixed Price Incentive(Firm Target) (FPIF), Cost Plus Incentive Fee (CPIF)
Award Date: January 06, 2012
Definitization Date: February 15, 2013
Contract Price
Initial Contract Price ($M) Current Contract Price ($M) Estimated Price At Completion ($M)
Target Ceiling Qty Target Ceiling Qty Contractor Program Manager
1122.0 N/A 38 1131.9 N/A 38 1090.9 1131.9
Target Price Change Explanation
The difference between the Initial Contract Price Target and the Current Contract Price Target is due to additional support equipment added to the contract and extending CLIN 12 period of performance for service specific Sustainment work.
Contract Variance
Item Cost Variance Schedule Variance
Cumulative Variances To Date (12/31/2014) -8.6 -31.0 Previous Cumulative Variances -- -- Net Change -8.6 -31.0
Cost and Schedule Variance Explanations
The unfavorable cumulative cost variance is due to the contract transitioning from an Advance Acquisition Contract (AAC) to a full funding production contract. During the AAC period, the contractor was incurring actual costs to preserve the engine delivery schedule but did not have any associated performance claimed because the performance measurement baseline was not in place. The unfavorable cost variance improved once the baseline was established and performance was claimed.
The unfavorable cumulative schedule variance is due to work scope in the Sustainment area that is late to baseline plan for tooling, initial spare and support equipment.
F-35 December 2014 SAR
UNCLASSIFIED 83

Notes
As a whole, the CLIN consist of multiple contract types including Fixed Price Incentive Fee as well as Cost Plus Incentive Fee and Cost Plus Fixed-Fee. For this reason, the overall contract type is mixed and there is not a true contract ceiling.
This contract includes both engines and Sustainment work scope. All engines have been delivered and the remaining work is for tooling, support equipment, spare parts and Sustainment support tasks.
Current Contract Ceiling Price is estimated based on the FPIF and CPIF CLINs.
Total Quantity includes aircraft engines and spare engines = 36 installs and 2 whole spares.
The earned value completion date and Contractor Performance Report reporting will be determined as the contract nears completion.
Pratt & Whitney’s Earned Value Management System (EVMS) was decertified on September 30, 2013 due to sixteen significant deficiencies that affect four of the 32 EVMS Guidelines. In accordance with Defense Federal Acquisition Regulation Supplement, 2% of each request for payment is being withheld until all significant deficiencies have been corrected.
F-35 December 2014 SAR
UNCLASSIFIED 84

Contract Identification
Appropriation: Procurement
Contract Name: F-35 LRIP 7
Contractor: Lockheed Martin
Contractor Location: 1 Lockheed BoulevardFt. Worth, TX 76108
Contract Number: N00019-12-C-0004
Contract Type: Fixed Price Incentive(Firm Target) (FPIF), Cost Plus Incentive Fee (CPIF)
Award Date: September 27, 2013
Definitization Date: September 27, 2013
Contract Price
Initial Contract Price ($M) Current Contract Price ($M) Estimated Price At Completion ($M)
Target Ceiling Qty Target Ceiling Qty Contractor Program Manager
4447.1 N/A 35 5481.2 N/A 35 5668.6 5481.2
Target Price Change Explanation
The difference between the Initial Contract Price Target and the Current Contract Price Target is due to definitization of Tech Assist, Non-Annualized Sustainment and Depot scope.
Contract Variance
Item Cost Variance Schedule Variance
Cumulative Variances To Date (12/31/2014) -10.0 -46.0 Previous Cumulative Variances -- -- Net Change -10.0 -46.0
Cost and Schedule Variance Explanations
The unfavorable cumulative cost variance is due to the Marietta Wing bracket mislocation containment effort and disruption due to late units received from Alenia as well as Fort Worth Wing disruption costs created by line of balance issues due to late parts deliveries and supply chain issues.
The unfavorable cumulative schedule variance is due to assembly labor due to ongoing part shortages.
Notes
As a whole, the CLIN consist of multiple contract types including Fixed Price Incentive Fee as well as Cost Plus Incentive Fee and Cost Plus Fixed-Fee. For this reason, the overall contract type is mixed and there is not a true contract ceiling.
F-35 December 2014 SAR
UNCLASSIFIED 85

Contract Identification
Appropriation: Procurement
Contract Name: F135 LRIP 7
Contractor: Pratt & Whitney
Contractor Location: 400 Aircraft RoadMiddletown, CT 06457
Contract Number: N00019-12-C-0060
Contract Type: Fixed Price Incentive(Firm Target) (FPIF), Cost Plus Incentive Fee (CPIF)
Award Date: September 27, 2012
Definitization Date: October 15, 2014
Contract Price
Initial Contract Price ($M) Current Contract Price ($M) Estimated Price At Completion ($M)
Target Ceiling Qty Target Ceiling Qty Contractor Program Manager
679.7 N/A 36 679.7 N/A 36 679.7 679.7
Contract Variance
Item Cost Variance Schedule Variance
Cumulative Variances To Date (12/31/2014) -372.8 -1.5 Previous Cumulative Variances -- -- Net Change -372.8 -1.5
Cost and Schedule Variance Explanations
The unfavorable cumulative cost variance is due to the contract transitioning from an Advance Acquisition Contract (AAC) to a full funding production contract and the hardware actual costs are higher than what was negotiated for the engines.
The Performance Measurement Baseline is currently being developed and the unfavorable cumulative cost variance is due to the contractor incurring actual costs during the AAC period of performance to preserve engine delivery that did not have any associated performance claimed.
The unfavorable cumulative schedule variance is due to the favorable net change in the schedule variance engine hardware delivering ahead of baseline plan in the Turbine Exhaust Case, Fan and Nozzle components.
Notes
As a whole, the CLIN consist of multiple contract types including Fixed Price Incentive Fee as well as Cost Plus Incentive Fee and Cost Plus Fixed-Fee. For this reason, the overall contract type is mixed and there is not a true contract ceiling.
The full funding contract modification was awarded on October 14, 2014. The unfavorable variance will improve once the baseline is in place and performance is claimed.
Pratt & Whitney’s Earned Value Management System (EVMS) was decertified on September 30, 2013 due to sixteen significant deficiencies that affect four of the 32 EVMS Guidelines. In accordance with Defense Federal Acquisition Regulation Supplement, 2% of each request for payment is being withheld until all significant deficiencies have been corrected.
F-35 December 2014 SAR
UNCLASSIFIED 86

Contract Identification
Appropriation: RDT&E
Contract Name: Israel System Development & Demonstration (ISDD)
Contractor: Lockheed Martin
Contractor Location: 1 Lockheed BoulevardFt. Worth, TX 76108
Contract Number: N00019-12-C-0070
Contract Type: Cost Plus Incentive Fee (CPIF)
Award Date: February 01, 2012
Definitization Date: February 01, 2012
Contract Price
Initial Contract Price ($M) Current Contract Price ($M) Estimated Price At Completion ($M)
Target Ceiling Qty Target Ceiling Qty Contractor Program Manager
211.5 N/A N/A 432.2 N/A N/A 354.3 369.9
Target Price Change Explanation
The difference between the Initial Contract Price Target and the Current Contract Price Target is due to budget incorporated for the Israel System Development and Demonstration Phase 1 Increment 2 Contract Authorized in October 2014.
Contract Variance
Item Cost Variance Schedule Variance
Cumulative Variances To Date (12/31/2014) +25.0 0.0 Previous Cumulative Variances -- -- Net Change +25.0 +0.0
Cost and Schedule Variance Explanations
The favorable cumulative cost variance is due to overhead underruns and Program Office staffing efficiencies.
Notes
As a whole, the CLIN consist of multiple contract types including Fixed Price Incentive Fee as well as Cost Plus Incentive Fee and Cost Plus Fixed-Fee. For this reason, the overall contract type is mixed and there is not a true contract ceiling.
F-35 December 2014 SAR
UNCLASSIFIED 87

324121.360580.818.69%
45
Total Acquisition CostExpended to DatePercent ExpendedTotal Funding Years
2248.89%81040.125.00%
Years AppropriatedPercent Years AppropriatedAppropriated to DatePercent Appropriated
67013.415602.623.28%
45
Total Acquisition CostExpended to DatePercent ExpendedTotal Funding Years
2248.89%18492.827.60%
Years AppropriatedPercent Years AppropriatedAppropriated to DatePercent Appropriated
Deliveries and Expenditures
F-35 Aircraft
Deliveries
Delivered to Date Planned to Date Actual to Date Total QuantityPercent
Delivered
Development 14 14 14 100.00%Production 112 106 2443 4.34%Total Program Quantity Delivered 126 120 2457 4.88%
Expended and Appropriated (TY $M)
The above data is current as of January 30, 2015.
Totals reflect U.S. aircraft only-no International Partner aircraft
F-35 Engine
Deliveries
Delivered to Date Planned to Date Actual to Date Total QuantityPercent
Delivered
Development 14 14 14 100.00%Production 112 106 2443 4.34%Total Program Quantity Delivered 126 120 2457 4.88%
Expended and Appropriated (TY $M)
The above data is current as of January 27, 2015.
Engines planned and actual to date only include production installs.
F-35 December 2014 SAR
UNCLASSIFIED 88

Operating and Support Cost
F-35 Aircraft
Cost Estimate Details
Date of Estimate: December 31, 2013Source of Estimate: CAPE ICEQuantity to Sustain: 2443Unit of Measure: Flying HourService Life per Unit: 30.00 YearsFiscal Years in Service: FY 2011 - FY 2064
Quantity to Sustain 2443 does not include 14 development aircraft.
Sustainment Strategy
The F-35 Product Support Manager (PSM) has developed and is executing a Sustainment Strategy that is consistent with warfighter requirements, technical specifications, extant contracts, government policies, and best practices. The F-35 Sustainment Strategy expressly states that the F-35 Program will:
- Design, develop, deliver and sustain a single, integrated, and global system of sustainment products, processes, and business practices. These actions will enable the F-35 Air System to achieve a high degree of effectiveness at an affordable cost.
- Tailor the global system to meet warfighter-defined and PSM-supported readiness and cost objectives. This action will ensure that the global system is responsive and flexible as operational needs vary over time.
- Maintain life-cycle focus, including the reduction of costs. This action will provide critical affordability benefits and further supports a high degree of effectiveness as Air System maturity grows.
- Create a mutually-beneficial enterprise that – with relevant metrics and incentives – operates, manages, and supports the global system. This action further improves responsiveness and enhances affordability.
- Leverage the global resource base – government and commercial – to take advantage of stakeholder capabilities, human capital, best practices, and similar critical contributions. This action increases robustness and scalability as the F-35 fleet grows and matures.
Antecedent Information
The F-35 family of aircraft variants will replace the following current aircraft: F-16C/D, A-10, F/A-18C/D, and AV-8B. The F-35 O&S estimate is based on legacy fleet history only when F-35 specific data is not available.
Comparing the costs of the 5th Generation F-35 to legacy aircraft is challenging. The average annual O&S cost table compares an adjusted F-16C/D Cost per Flying Hour (CPFH) to a forecast of the CPFH for the F-35A variant. The F-35A CPFH figure is based on the Conventional Takeoff and Landing (CTOL) variant only. The F-35A CTOL variant will make up the majority of the DoD F-35 aircraft procurement, accounting for 1,763 of 2,443 total aircraft currently planned for U.S. forces.
The F-16C/D CPFH figures were developed in a joint effort between CAPE and the Air Force Cost Analysis Agency. The
F-35 December 2014 SAR
UNCLASSIFIED 89
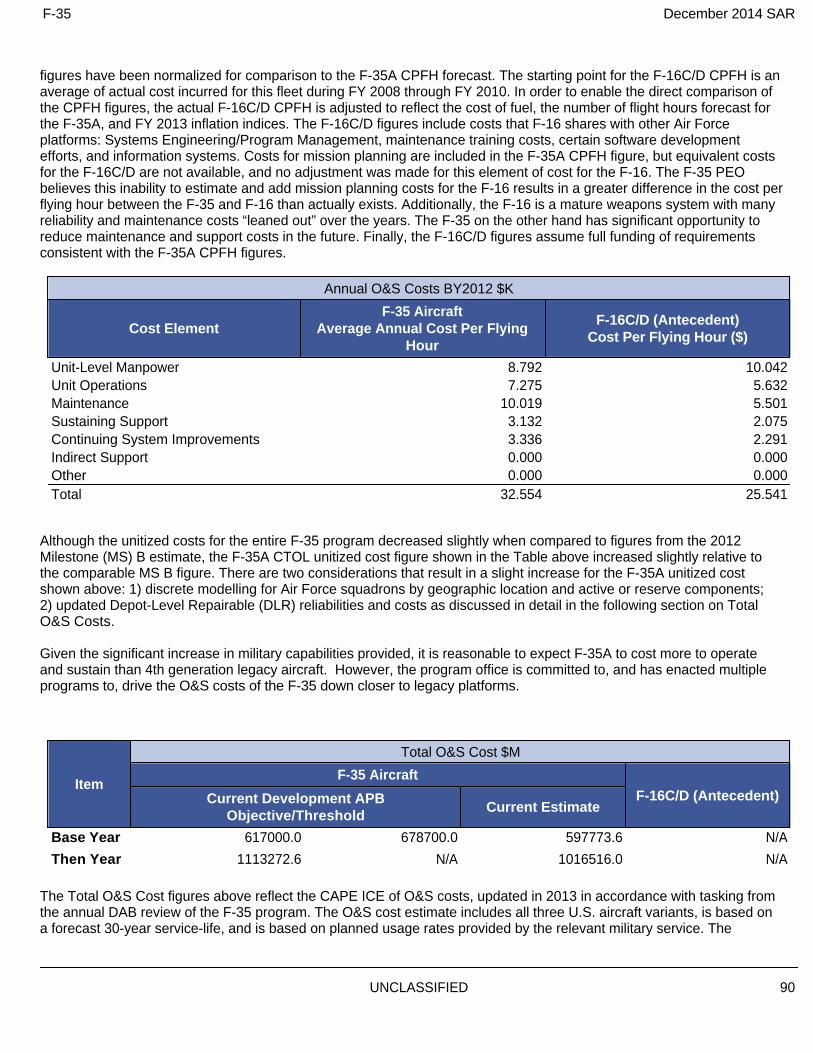
figures have been normalized for comparison to the F-35A CPFH forecast. The starting point for the F-16C/D CPFH is an average of actual cost incurred for this fleet during FY 2008 through FY 2010. In order to enable the direct comparison of the CPFH figures, the actual F-16C/D CPFH is adjusted to reflect the cost of fuel, the number of flight hours forecast for the F-35A, and FY 2013 inflation indices. The F-16C/D figures include costs that F-16 shares with other Air Force platforms: Systems Engineering/Program Management, maintenance training costs, certain software development efforts, and information systems. Costs for mission planning are included in the F-35A CPFH figure, but equivalent costs for the F-16C/D are not available, and no adjustment was made for this element of cost for the F-16. The F-35 PEO believes this inability to estimate and add mission planning costs for the F-16 results in a greater difference in the cost per flying hour between the F-35 and F-16 than actually exists. Additionally, the F-16 is a mature weapons system with many reliability and maintenance costs “leaned out” over the years. The F-35 on the other hand has significant opportunity to reduce maintenance and support costs in the future. Finally, the F-16C/D figures assume full funding of requirements consistent with the F-35A CPFH figures.
Annual O&S Costs BY2012 $K
Cost ElementF-35 Aircraft
Average Annual Cost Per Flying Hour
F-16C/D (Antecedent)Cost Per Flying Hour ($)
Unit-Level Manpower 8.792 10.042Unit Operations 7.275 5.632Maintenance 10.019 5.501Sustaining Support 3.132 2.075Continuing System Improvements 3.336 2.291Indirect Support 0.000 0.000Other 0.000 0.000Total 32.554 25.541
Although the unitized costs for the entire F-35 program decreased slightly when compared to figures from the 2012 Milestone (MS) B estimate, the F-35A CTOL unitized cost figure shown in the Table above increased slightly relative to the comparable MS B figure. There are two considerations that result in a slight increase for the F-35A unitized cost shown above: 1) discrete modelling for Air Force squadrons by geographic location and active or reserve components; 2) updated Depot-Level Repairable (DLR) reliabilities and costs as discussed in detail in the following section on Total O&S Costs.
Given the significant increase in military capabilities provided, it is reasonable to expect F-35A to cost more to operate and sustain than 4th generation legacy aircraft. However, the program office is committed to, and has enacted multiple programs to, drive the O&S costs of the F-35 down closer to legacy platforms.
Item
Total O&S Cost $M
F-35 AircraftF-16C/D (Antecedent)Current Development APB
Objective/ThresholdCurrent Estimate
Base Year 617000.0 678700.0 597773.6 N/A
Then Year 1113272.6 N/A 1016516.0 N/A
The Total O&S Cost figures above reflect the CAPE ICE of O&S costs, updated in 2013 in accordance with tasking from the annual DAB review of the F-35 program. The O&S cost estimate includes all three U.S. aircraft variants, is based on a forecast 30-year service-life, and is based on planned usage rates provided by the relevant military service. The
F-35 December 2014 SAR
UNCLASSIFIED 90

planned F-35 usage rates, in terms of aircraft flight hours per year, are as follows: F-35A CTOL @ 250 hrs./yr.; F-35B Short Takeoff and Vertical Landing @ 302 hrs./yr.; and F-35C Carrier Variant @ 316 hrs./yr. The total life-cycle cost estimate is not a simple extrapolation of the F-35A flying hour cost shown in the unitized O&S cost table above. Total O&S costs are updated using FY 2013 inflation indices, and include updated forecasts of labor escalation rates for military, civilian, and contractor personnel. A comparable total cost figure for the antecedent system (i.e., F-16C/D) is not available. The 2013 CAPE estimate of F-35 total life-cycle O&S costs incorporates updated information regarding several key cost elements relative to the CAPE O&S cost estimate prepared for the MS B review in early 2012. This includes updated fuel burn rates for the F-35B and F-35C variants, use of historical escalation rates for government personnel, discrete modeling for Air Force squadrons by geographic location and active or reserve components, and updated DLR costs. The updated information results in increased cost forecasts for certain cost elements, and decreased cost forecasts for other elements. The 2013 CAPE total O&S estimate is approximately three percent lower (in BY 2012 dollars) and nine percent lower (in TY dollars) than the total O&S cost estimate prepared for the 2012 MS B re-approval DAB review.
For the first time, in 2013, the CAPE O&S cost estimate incorporates actual information on component reliabilities obtained from the ongoing F-35 flight operations, including flight test and field operations. This program information is provided from the DoD test community, through the Director, Operational Test and Evaluation, and includes actual reliability information on many F-35 components based on data collected during approximately 8,500 hours of flight operations. The data include the F-35A and F-35B variants, and flight operations through October 2013. The reliability information has been compared to expected reliabilities for this stage of the program, for the A and B variants, based on reliability growth curves. The 2013 CAPE O&S estimate includes an increase of $15B (BY 2012$) in DLR costs, relative to the 2012 MS B estimate, because component reliability information obtained from actual flight operations data is not consistent with expectations. The program office believes this reliability data (based on an older configuration of aircraft and representing only 3% of the hours required to reach Reliability and Maintainability (R&M) maturity) is not fully representative of the current (currently at 9% of the hours and on a wider fleet of LRIP aircraft) or projected reliability of the F-35 fleet. CAPE will continue to work with the DoD operational test community to improve the processes and methods used to incorporate actual data and information on component reliabilities and removal rates, obtained from ongoing flight operations, into the CAPE life-cycle O&S cost estimate for the F-35 program. This information will be used, together with reliability improvement forecasts, to update the life cycle O&S cost estimates as the program proceeds to and beyond IOC.
Affordability remains the F-35 program office number one priority. As such, the F-35 program team is focused on reducing sustainment costs across the program. The December 2012 SAR identified a few disciplined initiatives designed to reduce sustainment cost. Among those were a sustainment Business Case Analysis (BCA) to identify cost reduction areas, an Industry day to foster competition in selected areas of the program, R&M improvements to optimize maintenance approach and a Targeted Affordability Program, which resulted in the standup of the Cost War Room (CWR) in September 2013 to identify and implement cost reduction projects for sustainment costs across the program. The F-35 Joint Program Office (JPO) has made significant progress in these areas since the last SAR and continues to focus on life-cycle affordability as one of its key focus areas.
The program office has implemented a fully funded R&M improvement program which includes diagnostics and analysis of select initiatives as candidate improvements. These candidates are identified from readiness cell inputs that have the highest impact or potential for redesign to maximize air system availability and control O&S costs. The R&M Improvement Program successfully directed the implementation of the Top 20 engineering retrofit candidates in 50 percent of the LRIP 2, 3 and 4 aircraft by the end of 2014. Additionally, the R&M Improvement program identified six R&M Improvement projects that were approved for funding implementation. The program is on schedule to award contracts on the six projects by the second quarter of FY 2015.
The CWR, led by the F-35 program office with support from Lockheed Martin and Pratt and Whitney, has achieved an additional $5B (BY 2012$) DoD life-cycle cost avoidance on top of the $15B (BY 2012$) identified in the 2013 SAR, with an additional $20B (BY 2012$) in the implementation and execution phase that is expected to be incorporated in 2015. The program continues to refine the support concept based on inputs from the BCA, as well as the Future Support Construct effort, in order to achieve the best value solution for its stakeholders. Phase II of the BCA was completed in April 2014 and Phase III will be initiated in November 2015 to expand on the Phase II analysis of support approach options
F-35 December 2014 SAR
UNCLASSIFIED 91

for key areas of sustainment.
The 2013 SAR identified four key areas where CAPE and POE differed: reliability, depot overhaul, government/contractor manpower, and F-35A fuel consumption. The 2014 POE of $535.7B BY 2012$ ($859.0B TY$) has been updated to reflect the latest technical baseline for the program and incorporates revised stakeholder requirements. Of particular relevance to the JPO-CAPE differences from the previous SAR, the fuel consumption rates for all variants have been updated based on Service recommendations informed by actual performance to-date. Additionally, the 2015 Office of Management and Budget inflation indices have had a significant downward influence on the POE TY$ value, creating a much more substantial reduction than when compared in a BY 2012$ basis. The 2014 POE incorporates updated inputs for reliability, depot overhaul, and government/contractor manpower but those remain areas of difference between the two estimates. The program office believes that the reliability data used in the CAPE estimate (based on an older configuration of aircraft and representing only 3% of the hours required to reach R&M maturity) is not fully representative of the current (currently at 9% of the hours and on a wider fleet of LRIP aircraft) or projected reliability of the F-35 fleet.
The F-35 PEO believes that the inherent differences between the F-35 and the F-16 estimates, such as mission planning costs being included in F-35 but not F-16 and the fact that the F-16 is a mature weapons system with many reliability and maintenance costs “leaned out” over the years, result in an overstating of the differences in cost per flying hour between the two. Regardless of the difference, the F-35 program office is committed to, and has enacted multiple programs to drive the O&S costs of the F-35 down.
Equation to Translate Annual Cost to Total Cost
The F-35 steady state cost per flying hour reflected in the annual O&S cost section does not easily translate to the Total O&S value for the program because the total O&S costs reflect costs for all three variants of the F-35 for the U.S. Air Force, U.S. Marince Corps, and U.S. Navy, whereas the CPFH reflects the U.S. Air Force F-35A only.
O&S Cost Variance
Category BY 2012
$MChange Explanations
Prior SAR Total O&S Estimates - Dec 2014 SAR
597773.6
Programmatic/Planning Factors 0.0Cost Estimating Methodology 0.0Cost Data Update 0.0Labor Rate 0.0Energy Rate 0.0Technical Input 0.0Other 0.0Total Changes 0.0Current Estimate 597773.6
Disposal Estimate Details
Date of Estimate: Source of Estimate: Disposal/Demilitarization Total Cost (BY 2012 $M):
Program maturity is not at a point where disposal costs can be estimated within an acceptable margin of error.
F-35 December 2014 SAR
UNCLASSIFIED 92

F-35 Engine
Cost Estimate Details
Date of Estimate: Source of Estimate: Quantity to Sustain: Unit of Measure: Service Life per Unit: Fiscal Years in Service:
O&S costs for the engine subprogram are included in the overall program costs that are shown in the F-35 Aircraft subprogram.
Sustainment Strategy
.
Antecedent Information
.
Annual O&S Costs BY2012 $K
Cost Element F-35 Engine No Antecedent (Antecedent)
Unit-Level Manpower 0.000 0.000Unit Operations 0.000 0.000Maintenance 0.000 0.000Sustaining Support 0.000 0.000Continuing System Improvements 0.000 0.000Indirect Support 0.000 0.000Other 0.000 0.000Total -- --
Item
Total O&S Cost $M
F-35 EngineNo Antecedent (Antecedent)Current Development APB
Objective/ThresholdCurrent Estimate
Base Year N/A N/A N/A N/A
Then Year N/A N/A N/A N/A
O&S Cost Variance
Category BY 2012
$MChange Explanations
Prior SAR Total O&S Estimates - Dec 2014 SAR
0.0
F-35 December 2014 SAR
UNCLASSIFIED 93

Programmatic/Planning Factors 0.0Cost Estimating Methodology 0.0Cost Data Update 0.0Labor Rate 0.0Energy Rate 0.0Technical Input 0.0Other 0.0Total Changes 0.0Current Estimate 0.0
Disposal Estimate Details
Date of Estimate: Source of Estimate: Disposal/Demilitarization Total Cost (BY 2012 $M):
F-35 December 2014 SAR
UNCLASSIFIED 94