FY2015 Financial Result Presentation - Fujitec...FY2016 FY2015 Change Capital Investment 5 700 4 316...
36
Fiscal Year Ended March 31, 2016 (FY2015) Financial Result Presentation Fujitec Co., Ltd. Fujitec Co., Ltd. May 26, 2016 May 26, 2016 TOKYU PLAZA GINZA (Tokyo)
Transcript of FY2015 Financial Result Presentation - Fujitec...FY2016 FY2015 Change Capital Investment 5 700 4 316...

Fiscal Year Ended March 31, 2016 (FY2015) Financial Result Presentation
Fujitec Co., Ltd.Fujitec Co., Ltd.May 26, 2016May 26, 2016
TOKYU PLAZA GINZA (Tokyo)

Contents
1. Fiscal Year 2015 Financial Results
2. Fiscal Year 2016 Forecasts2. Fiscal Year 2016 Forecasts
3 A i f N Mid M Pl3. Actions for New Mid-term Management Plan
2

1. Fiscal Year 2015 Financial Results1. Fiscal Year 2015 Financial Results
3

1-1. Fiscal Year 2015 Summary
Record figures were reported for the past four fiscal years, surpassing the corresponding figure from each previous year
(Millions of yen)
FY2015 Percentage(Margin) FY2014 Percentage
(Margin)Change
in % Initial Plan
Orders 191 282 100 0% 178 823 100 0% + 7 0% -
( y )
Received 191,282 100.0% 178,823 100.0% + 7.0% -
Domestic 68,003 35.6% 68,520 38.3% - 0.8% -Overseas 123,279 64.4% 110,303 61.7% + 11.8% -123,279 64.4% 110,303 61.7% 11.8%
Net Sales 177,128 100.0% 165,297 100.0% + 7.2% 175,000Domestic 60,381 34.1% 61,508 37.2% - 1.8% -Overseas 116,747 65.9% 103,789 62.8% + 12.5% -
Operating Income 14,449 8.2% 13,488 8.2% + 7.1% 15,000
OrdinaryIncome 15,162 8.6% 14,826 9.0% + 2.3% 16,000
Profit Attributable to Owners of Parent 8,807 5.0% 8,356 5.1% + 5.4% 9,000Owners of Parent , , ,
EPS ¥109.36 - ¥90.84 - + ¥18.52 ¥111.814Average Exchange Rate : FY2015 1US$=¥121, FY2014 1US$=¥105
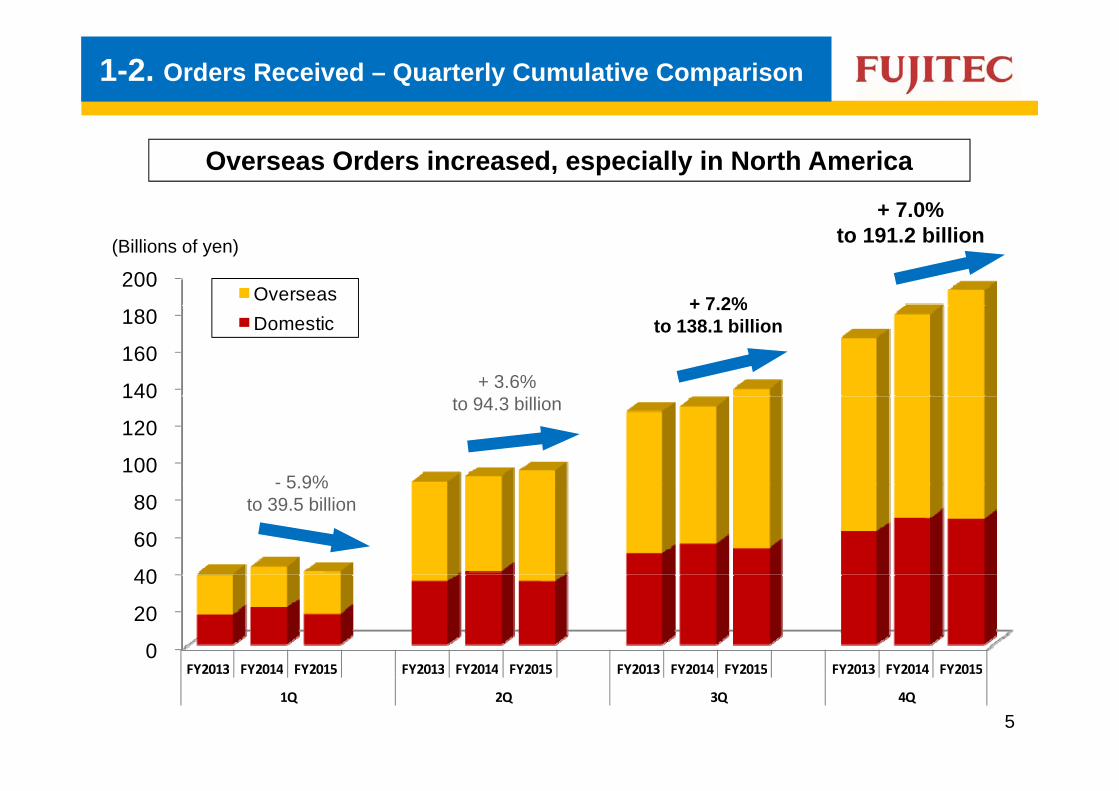
1-2. Orders Received – Quarterly Cumulative Comparison
Overseas Orders increased, especially in North America
+ 7.0%
200 Overseas
(Billions of yen)
7.0%to 191.2 billion
+ 7 2%
140
160
180 Domestic+ 7.2%
to 138.1 billion
+ 3.6%
100
120
140
- 5 9%
to 94.3 billion
40
60
80 5.9%
to 39.5 billion
0
20
40
FY2013 FY2014 FY2015 FY2013 FY2014 FY2015 FY2013 FY2014 FY2015 FY2013 FY2014 FY2015FY2013 FY2014 FY2015 FY2013 FY2014 FY2015 FY2013 FY2014 FY2015 FY2013 FY2014 FY2015
1Q 2Q 3Q 4Q
5

1-3. Net Sales – Quarterly Cumulative Comparison
Overseas Net Sales increased, mainly in North America and South Asia
+ 7.2%
180 Overseas
(Billions of yen)to 177.1 billion
+ 9.5%t 129 3 billi
120
140
160 Domesticto 129.3 billion
+ 13.2%
80
100
120
+ 11.5%
83.7 billion
40
60 to 38.4 billion
0
20
FY2013 FY2014 FY2015 FY2013 FY2014 FY2015 FY2013 FY2014 FY2015 FY2013 FY2014 FY2015
1Q 2Q 3Q 4Q
6

1-4. Operating Income – Quarterly Cumulative Comparison
Operating Income improved significantly in North America
16Overseas
(Billions of yen)+ 7.1%
to 14.4 billion
+ 13 7%
12
14OverseasDomestic
+ 13.7%to 10.9 billion
8
10
+ 19.6%
+ 27.4%to 6.7 billion
4
6 to 3.2 billion
0
2
FY2013 FY2014 FY2015 FY2013 FY2014 FY2015 FY2013 FY2014 FY2015 FY2013 FY2014 FY2015
-2FY2013 FY2014 FY2015 FY2013 FY2014 FY2015 FY2013 FY2014 FY2015 FY2013 FY2014 FY2015
1Q 2Q 3Q 4Q
71Q 2Q 3Q 4Q

1-5. Net Sales by Business and Segment
Net Sales further increased in East Asia
Net Sales by Business Net Sales by SegmentEurope 0.3%
South Asia 9 6%
Europe 0.3%
North America 12 6%
After-market Business
New Installation Business
9.6% 12.6%
East Asia43.4%
(Previous year: 56.7%) (Previous year: 42.1%)
44.6% 55.4%Japan 34.1%
8

1-6. Net Sales & Operating Income by Segment
Net Sales and Operating Income increased in East Asia, North America and South Asia
(Milli f )
Net Sales Operating Income
Change
(Millions of yen)
FY2015 FY2014 Changein % FY2015 FY2014 Change
Japan 65,001 65,514 - 0.8% 5,199 5,149 + 50
East Asia 84,606 76,240 + 11.0% 7,500 7,328 + 172
North America 22,360 17,735 + 26.1% 137 - 582 + 719
South Asia 17,075 15,499 + 10.2% 1,626 1,558 + 68
Europe 508 601 - 15.5% - 43 - 1 - 41
Total 189,552 175,591 + 8.0% 14,421 13,453 + 968
Reconciliations - 12,423 - 10,294 - 28 35 - 6
Consolidated 177,128 165,297 + 7.2% 14,449 13,488 + 961
9Average Exchange Rate : FY2015 1US$=¥121, FY2014 1US$=¥105

1-7. Operating Environment - Japan
Net Sales and Operating Income remained essentially the same as in the previous year
Photo Kenichi Komeiji
p y
New Installation Business
・Market was sluggish due to rising constructioncosts
・Rising labor costs were offset by cost savingsBusiness ・Rising labor costs were offset by cost savings
TOKYU PLAZA GINZA (Tokyo)
After-・Driven by Maintenance, Net Sales robustly
increased
TOKYU PLAZA GINZA (Tokyo)
market Business
increased・Modernization decreased due to lessened
demand
EXPOCITY (Osaka)
10

1-8. Operating Environment - East Asia
Net Sales and Operating Income increased due to depreciation of the Yenp
China
・Competition intensified in a shrinking market・Increase of Net Sales for Elevators continued
thanks to launching of a new model・Margin decreased due to competitive prices
DAMG International Shopping
Hong Kong
pp gCenter (China)
Taiwan Korea
・Operating activity remained robust
LOTTE MALL EunpyeongNew Town (Korea)
11

1-9. Operating Environment - South Asia
Net Sales increased but Margin decreased due to a deteriorating external environment g
・After-market Business remained robust
Singapore
After market Business remained robust・Net Sales decreased due to the sluggish New
Installation Business・Operating Income maintained by steadyOperating Income maintained by steady
Maintenance
Raffles Hospital
ASEAN R i
・Costs rose due to currency depreciation
Raffles Hospital (Singapore)
Region
India・Net Sales increased and Operating Income
improved in India
D’SALA SENTRAL (Malaysia)
12

1-10. Operating Environment - North America & Europe
Net Sales increased and Operating Income improved in North America
・Net Sales increased in the New Installation
North America
Business and the After-market Business・Operating Income improved in the New Installation
Business and ModernizationBusiness and Modernization ・Margin increased in Maintenance
Europe ・Operating activity remained sluggish
CHOP Schuylkill Avenue Project (USA)
13

1-11. Consolidated Balance Sheet
Mar. 31, 2016 Mar. 31, 2015 Change Remarks
Current Assets 123,304 132,134 - 8,829
(Millions of yen)
Cash and Cash Equivalents 43,698 51,674 - 7,975 Decreased in Japan and East Asia
Trade Notes and AccountsReceivable
52,502 53,184 - 682
Inventories 21,075 20,554 + 521
Others 6,028 6,721 - 693
Fixed Assets 48,567 47,722 + 845
Property, Plant and Equipment 33,828 32,885 + 942 Capital investment:+4,138, Depreciation:-2,513, Foreign exchange, etc.:-683
Intangible Assets 4,063 4,311 - 248
Investments and Other Assets 10,674 10,524 + 150, ,
Total Assets 171,872 179,856 - 7,984
Current Liabilities 66,981 71,406 - 4,425 Electronically recorded obligations-operating:-1,311, Advances from customers: -1,948
Net defined benefit liability:+1 893Non-current Liabilities 4,484 3,829 + 654 Net defined benefit liability:+1,893, Deferred tax liabilities:-796
Net Assets 100,406 104,620 - 4,214Retained earnings:+6,583, Treasury Stock: -7,531,Foreign currency translation adjustments:-1,823,Remeasurements of defined benefit plans:-1,367
Shareholders’ Equity Ratio 51.6% 51.9% -
BPS ¥1,102.66 ¥1,074.82 + ¥27.84
14

1-12. Cash Flows
Free Cash Flows decreased(Millions of yen)
FY2015 FY2014 Change
(Millions of yen)
Cash and Cash Equivalents at Beginning of the Year 30,602 20,903 + 9,699
Cash Flows from Operating Activities 8 932 10 753 1 820
1万5 000台
2万5,000台Cash Flows from Operating Activities 8,932 10,753 - 1,820
Cash Flows from Investing Activities - 5,319 - 619 - 4,7001万5,000台
Free Cash Flows 3,612 10,134 - 6,521
Cash Flows from Financing Activities - 11 532 - 3 225 - 8 306Cash Flows from Financing Activities 11,532 3,225 8,306
Cash and Cash Equivalents at End of the Year 21,833 30,602 - 8,768
15
2 Fiscal Year 2016 Forecasts2. Fiscal Year 2016 Forecasts
16

2-1. Forecasts for Fiscal Year 2016
Although Net Sales will increase, Operating Income is estimated to decrease
FY2015 FY2016
Net Operating Income Net Operating Income(100 millions of yen) (100 millions of yen)
Net Sales
Operating Income(Margin)
Japan 650 51 8.0%
Net Sales
Operating Income(Margin)
Japan 660 52 7.9%
1万5 000台
2万5,000台East Asia 846 75 8.9%
North America 223 1 0.6%
East Asia 800 52 6.5%
North America 210 3 1.4%
1万5,000台South Asia 170 16 9.5%
Europe 5 - 0 - 8.5%
South Asia 150 14 9.3%
Europe 5 0 -
Total 1,895 144 7.6%
Reconciliations - 124 0 -
Total 1,825 121 6.6%
Reconciliations - 125 - 1 -
Consolidated 1,771 144 8.2%
17
Consolidated 1,700 120 7.1%Average Exchange Rate: 1US$=¥121 Average Exchange Rate: 1US$=¥110

2-2. Forecasts for FY2016 by Segment
Japan: Net Sales increases and Operating Income remains almostthe same as in the previous year
FY2016 FY2015 Change in %(Millions of yen)
Net Sales 66,000 65,001 + 1.5%
Operating Income 5,200 5,199 + 0.0%
2万5,000台Margin 7.9% 8.0% - 0.1P
・Net Sales in the New Installation Business increase and the After-marketB i i fl tBusiness remains flat
・Promote cost reductions・Operating Income remains almost the same as in the previous yearp g p y
18

2-2. Forecasts for FY2016 by Segment
East Asia: Although Net Sales increase, Operating Income is projected to decrease
FY2016 FY2015 Change in %(Millions of yen)
Net Sales 80,000 84,606 - 5.4%
Operating Income 5,200 7,500 - 30.7%
Margin 6.5% 8.9% - 2.4PAverage Exchange Rate: 1RMB=¥17
・China aims for an increase of Net Sales but Margin decreases・China aims for an increase of Net Sales but Margin decreases ・Hong Kong, Taiwan and Korea are estimated to develop steadily
19

2-2. Forecasts for FY2016 by Segment
South Asia: Although Net Sales increase, Operating Incomeremains almost the same as in the previous year
FY2016 FY2015 Change in %(Millions of yen)
Net Sales 15,000 17,075 - 12.2%
Operating Income 1,400 1,626 - 13.9%
Margin 9.3% 9.5% - 0.2PAverage Exchange Rate: 1S$=¥79
・Construction demand in Singapore is estimated to remain sluggish・Operating Income in Indonesia and Malaysia recovers・Net Sales increase and Operating Income is projected to improve in India
20

2-2. Forecasts for FY2016 by Segment
North America: Net Sales and Operating Income increaseEurope: Break-even
(Milli f )
North America FY2016 FY2015 Change in %
Net Sales 21 000 22 360 - 6 1%
(Millions of yen)
Net Sales 21,000 22,360 - 6.1%
Operating Income 300 137 + 118.3%
Margin 1 4% 0 6% + 0 8PMargin 1.4% 0.6% + 0.8P
Europe FY2016 FY2015 Change in %
Net Sales 500 508 1 6%Net Sales 500 508 - 1.6%
Operating Income 0 - 43 -
Margin 8 5%
・Net Sales and Operating Income increase due to strong economy in North
Margin - - 8.5% -Average Exchange Rate: 1US$=¥110, 1EURO=¥121
・Net Sales and Operating Income increase due to strong economy in NorthAmerica and Margin improves
21

2-3. Others
Capital Investment, Depreciation, R&D Expenses and Dividends
FY2016 FY2015 ChangeCapital Investment 5 700 4 316 + 1 384
(Millions of yen)
Capital Investment 5,700 4,316 + 1,384
Domestic 3,500 1,499 + 2,001
Overseas 2,200 2,816 - 6162万5,000台Depreciation 2,900 2,748 + 152
R&D Expenses 3,000 2,179 + 821
FY2016 FY2015 ChangeDividends 30 30
(Yen)
Dividends 30 30 -Interim 15 15 -
Year-end 15 15 -
22

3 Actions for New Mid-term Management Plan3. Actions for New Mid term Management Plan
23
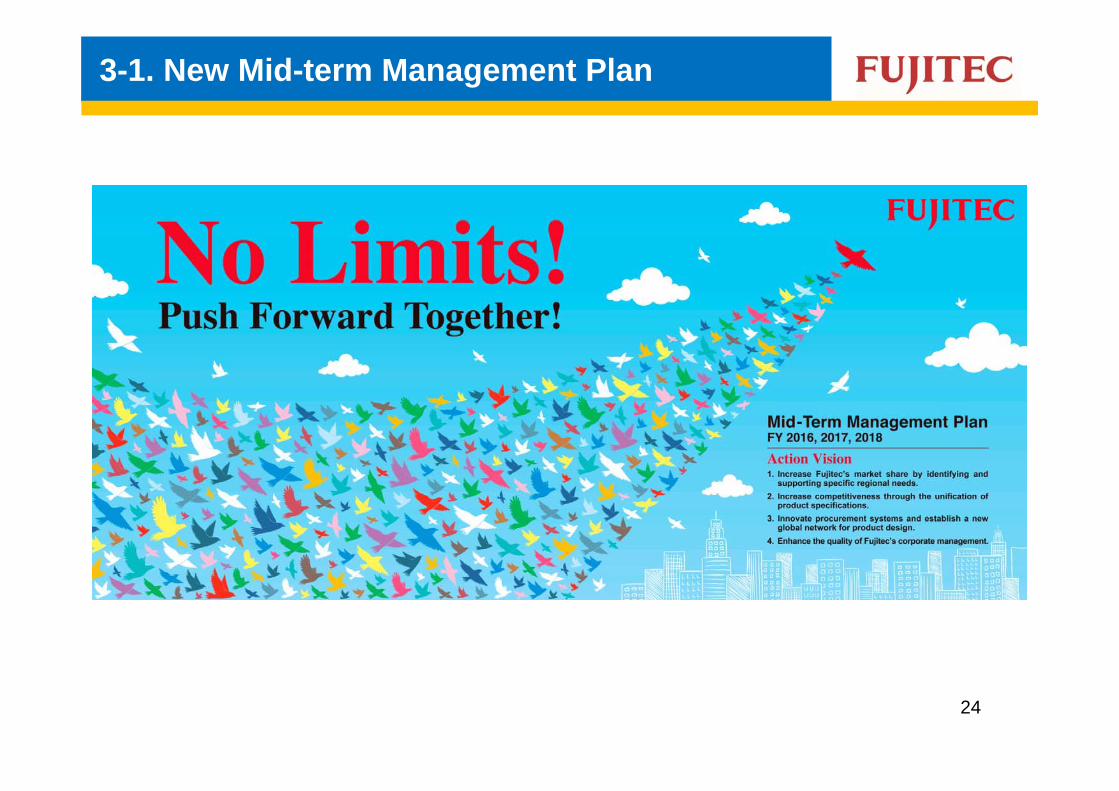
3-1. New Mid-term Management Plan
24

3-1. New Mid-term Management Plan
FY2018Net Sales: 200 billionOperating Income: 16 billionMargin: 8.0%
FY2015FY2015Net Sales: 177.1 billionOperating Income: 14.4 billionp gMargin: 8.2%
25

3-2. Plan for Final Year by Segment
Net Sales and Operating Income increase in all segments
FY2015 FY2018FY2015 FY2018
Net Operating Income Net Operating Income
(100 millions of yen) (100 millions of yen)
Sales (Margin)
Japan 650 51 8.0%
846 75 8 9%
Salesg
(Margin)
Japan 700 58 8.3%
%
1万5 000台
2万5,000台East Asia 846 75 8.9%
North America 223 1 0.6%
S th A i 170 16 9 5%
East Asia 1,000 78 7.8%
North America 240 7 2.9%
S h A i 200 19 9 5%1万5,000台South Asia 170 16 9.5%
Europe 5 - 0 - 8.5%
T t l 1 895 144 7 6%
South Asia 200 19 9.5%
Europe 8 0 -
T t l 2 148 162 7 5%Total 1,895 144 7.6%
Reconciliations - 124 0 -
C lid t d 1 771 144 8 2%
Total 2,148 162 7.5%
Reconciliations - 148 - 2 -
C lid t d 2 000 160 8 0%Consolidated 1,771 144 8.2%
26
Consolidated 2,000 160 8.0%Average Exchange Rate: 1US$=¥121 Average Exchange Rate: 1US$=¥110

3-3. Action Vision for Mid-term Management Plan
Regional Strategy1 Regional StrategyIncrease Fujitec’s market share by identifying and supporting specific regional needs1Product & Technology StrategyIncrease competitiveness through the unification of product specifications2Operation StrategyInnovate procurement systems and establish a new global network for product design3Corporate StrategyEnhance the quality of Fujitec’s corporate management4
27

3-4. Regional Strategy
China■SalesEnhance sales network and cost competitiveness■Production
Standard Elevator “ZEXIA”
Huasheng Fujitec
■ProductionSupply standard elevators & escalators to the global market
Hong Kong, Taiwan and KoreaFocus on the Modernization Business
■TaiwanSupply modernization products to the globalmarket
Fujitec Taiwan
■KoreaSupply customized elevators to the global market
28
Fujitec Koreaa e

3-4. Regional Strategy
North America・Increase orders activity in large cities for the New Installation・Increase orders activity in large cities for the New InstallationBusiness
・Focus on expanding the After-market Business
South Asia・Invest management resources in the India and the ASEAN regions・Enhance production capabilities in India
・Increase revenue and market share of the New Installation Business
Japan・Increase revenue and market share of the New Installation Business・Focus on the Modernization Business
29

3-5. Product & Technology Strategy
Conceptp
Enhance market competiveness by launching a global product model
・Unify product specifications at global production sites
Product Strategy
・Unify product specifications at global production sites(Elevators, Escalators and Modernization)
・Development of core technologies for product modelsE d l h d d l
Technology Strategy
・Expand long-term research and development
30

3-6. Operation Strategy
Integrated operation of the Escalator Business
Promoting procurement through global purchasing of lump quantities
Shanghai HuashengFujitec
Big Step
Constructing a global design network
Promotion of a global Modernization Business
31

3-7. Corporate Strategy
Strengthening corporate governance Strengthening infrastructure through IT
Enhancing development of global human resources Enhancing safety and quality
32

33
Reference Information
34

Corporate Profile (as of March 31, 2016)
Corporate Name Fujitec Co., Ltd.
Established Feb 1948(Listed Feb 1974 on TSE1)
Head Office Hikone, Shiga (Big Wing)Head Office Hikone, Shiga (Big Wing)
Business R&D, manufacturing, marketing, installation and maintenance of elevators and escalators
Paid-in Capital 12,533 million yen (shares issued: 93,767,317)
President & CEO, Takakazu Uchiyama
Directors
, y7 directors (including 3 outside directors)4 audit & supervisory board members(including 2 outside audit & supervisory board members)
Employees Consolidated 9,486 (non-consolidated 2,824)
G 34 companies (including 19 consolidated subsidiaries)Group companies
34 companies (including 19 consolidated subsidiaries) (North and South America, East and South Asia, Europe/Middle East)
35
This presentation was prepared to provide information on the company’s Fiscal Year Ended March 31 2016 results and medium-term businessFiscal Year Ended March 31, 2016 results and medium term business plan. The purpose of these materials is not to solicit investments in the company’s stock or other securities. All information in this presentation is b d d l il bl f M 26 2016 Thbased on data currently available as of May 26, 2016. The company makes no guarantees regarding the accuracy or completeness of this information and retains the right to revise this information at any time with g yno prior notification.
Ma 26 2016May 26, 2016
Fiscal Year Ended March 31, 2016 Fi i l R lt P t ti
36
Financial Results Presentation