FY2012 Annual Report on Food, Agriculture and … FY2012 Annual Report on food, agriculture and...
44
FY2012 Annual Report on Food, Agriculture and Rural Areas in Japan Summary Ministry of Agriculture, Forestry and Fisheries Japan, 2013
Transcript of FY2012 Annual Report on Food, Agriculture and … FY2012 Annual Report on food, agriculture and...

FY2012 Annual Report on Food, Agriculture and Rural Areas in Japan
Summary
Ministry of Agriculture, Forestry and Fisheries Japan, 2013

The FY2012 Annual Report on food, agriculture and rural areas in Japan is based on Items 1 and 2 of Article 14 of the Food, Agriculture and Rural Areas Basic Act (Law No. 106 for 1999).

Contents
○FY2012 Annual Report on Food, Agriculture and Rural Areas in Japan
Foreword ··············································································· 1
Chapter 1: Reconstruction from the Great East Japan Earthquake ············· 2
Chapter 2: Efforts for securing stable food supply ······························· 5
Chapter 3: Efforts for sustainable development of agriculture ··············· 13
Chapter 4: Utilizing local resources to promote and invigorate rural areas · 26
○Summary of FY2013 Measures for Food, Agriculture and Rural Areas ···· 31
Definitions ··········································································· 32

Acronyms and abbreviations
CAA Consumer Affairs Agency EU European Union GCC Cooperation Council for the Arab States of the Gulf ILO International Labour Organization JA Japan Agricultural Cooperatives JAS Japan Agricultural Standards JFC Japan Finance Corporation MAFF Ministry of Agriculture, Forestry and Fisheries METI Ministry of Economy, Trade and Industry MHLW Ministry of Health, Labour and Welfare MIC Ministry of Internal Affairs and Communications MOD Ministry of Defense MOF Ministry of Finance Japan US The United States
Symbols
ha Hectare kl Kilolitre a Are kg Kilogram t tons

Foreword
Two years have passed since the Great East Japan Earthquake that occurred in March 2011. Restoration and reconstruction from the Great East Japan Earthquake has become one of the government's top priorities. Relevant parties are going ahead with various efforts to reconstruct the Tohoku Region as Japan's food supply base. Therefore, this report includes a chapter on "Reconstruction from the Great East Japan Earthquake -- Reconstruction steps" to widely cover farmland restoration and other agricultural restoration and reconstruction measures in disaster-affected areas, measures for securing farm and livestock product safety and reconstruction support measures including sales of products from disaster-affected areas. In describing these measures, we detailed disaster-affected farm households' steps toward resuming farming as much as possible and tried to directly convey their firsthand opinions to readers. As well, this report specifies production trends, business management conditions and challenges for each of the major farm and livestock products including rice, wheat, soybeans, vegetables, fruits, flowers, sugar beets, sugar canes, tea, livestock products and feed and forage crops, while giving considerations to the balance between these products. In addition to their production trends, this report uses various statistical data to analyze and explain structural changes and characteristics of their consumption under the aging population and women's advance into society. This report also presents future food consumption prospects. This report also discusses global food supply and demand, Japan’s food self-sufficiency ratio, negotiations on EPA/FTA and the proposed TPP agreement, food industry trends, efforts for ensuring food safety and consumer confidence, and Shokuiku (food education) promotion measures from the viewpoint of securing stable food supply. From the viewpoint of sustainable development of agriculture, this report describes the promotion of structural agriculture reforms, measures for solving problems between farmers and farmlands, agricultural production infrastructure development and conservation, measures for raising value added for agriculture and promoting exports of agricultural, forest and fishery products, the latest research and technological development, agricultural production giving priority to environmental conservation, and agricultural organizations’ efforts. Furthermore, from the viewpoint of promoting and revitalizing rural areas, this report discusses the present conditions of rural areas, measures for eliminating abandoned cultivated lands, the present conditions of and measures against damage by wild animals, measures for demonstrating multifunctional roles of agriculture and rural areas, measures for harmonious coexistence and interactions between urban and rural areas, measures for agriculture’s cooperation with education, welfare and tourism, measures for utilizing renewable energy, and urban agriculture conservation and promotion measures. While this report covers a wide range of topics, we have tried to avoid any disproportionate emphasis on data analysis and comments and introduce various efforts taken throughout Japan as much as possible for specifying frontline conditions to make this report approachable and easy to understand. We hope that this report will help citizens deepen their interests in and understanding of Japan’s food, agriculture and rural areas.
1

Sendai city
Natori city
Program implementation area Enlarged farmland partitions
Orderly land utilization
Crop diversion area
Sendai Higashi District (Miyagi Prefecture) Farmland consolidation implementation area (draft)
A farmland filed after consolidation
A farmland filed before consolidation
Upstream HazamagawaRiver and Aratozawa Dam
Upstream Hazamagawa RiverSendai Higashi
Watari Yamamoto
Shirakawayabuki(Hatori Dam)
Upstream AbukumagawaRiver (Saigo Dam)
Haga Plateau
Miyagi Prefecture
Fukushima Prefecture
Tochigi Prefecture
Natorigawa River
Jokawa River
Watari Yamamoto Coastal Farmland
Kanan
Legend
Areas for implementing national specific disaster restoration programs (tsunami-affected areas)
Areas for implementing national specific disaster restoration programs
Areas for implementing national disaster restoration programs for coastal conservation facilities (deputize)
Minamisoma
Item
Farmlands
Tsunami-damaged farmlands in six prefectures→21,480 hectares
Area available for farming resumption under the Basic Guidelines
FarmsTsunami-damaged farms in six prefectures→10,100 farms
0 40 80 100(%)
5,070 farmsResumed farming 50%
20 60
FY2012 FY2013 FY2014 Others8,310 hectares 5,610 hectares 4,990 hectares 2,570 hectares
8,190 hectares Available for resuming farming 38%
5,280 hectares Restoration ongoing 63%
Overview of farmland compartment enlargement in Sendai Higashi District
Chapter 1 Reconstruction from the Great East Japan Earthquake – Reconstruction steps 1 Earthquake and tsunami damage and restoration/reconstruction efforts
The Great East Japan Earthquake inflicted damage worth 2,384.1 billion yen on the agriculture-forestry-fisheries sector (including 904.9 billion yen for agriculture sector).
As for the tsunami-affected farmlands totaling 21,480 hectares, restoration and salt removal have been being implemented to allow farming to be resumed in three years or by FY2014 under the Basic Guidelines for Reconstruction of Agriculture and Rural Communities.
By the FY2012 planting season, farming was allowed to resume for 8,190 hectares (38% of the tsunami-affected farmlands), almost attaining the target under the Basic Guidelines. In addition, restoration is going on for 5,280 hectares for farming resumption in FY2013.
MAFF launched its national specific disaster restoration programs for farmlands and farming facilities in FY2011. In FY2012, MAFF kicked off its national specific restoration program of farming facilities in Minamisoma city of Fukushima Prefecture.
In efforts to secure reconstruction after restoration, it is implemented to enlarge partitions for farmlands totaling 9,400 hectares in Iwate, Miyagi and Fukushima prefectures, using the Great East Japan Earthquake Reconstruction Grants and the like (including those still under planning for readjustment) (as of March 2013).
Source: MAFF
Districts for implementing MAFF’s national specific disaster restoration programs
Agriculture restoration conditions after the Great East Japan Earthquake (As of March 2013)
Source: MAFF Notes: 1) The six prefectures are Aomori, Iwate, Miyagi, Fukushima, Ibaraki and Chiba.
2) The 5,070 farms that resumed farming include those that resumed agricultural production operations or their preparations.
Source: MAFF
2

Rice farming technology
Vegetable and fruit horticulture technology
Livestock farming technology
Demonstration Area for Agricultural Research
Open laboratory
Disaster reduction and business diagnosis
technology
Greenhouse horticulture technology
(Strawberry, tomato)
Government Building research groups and cooperation arrangementsProduction corporations or
fisheries cooperatives
Prefectural and other public experimental laboratories in disaster-affected areas
Incorporated administrative agencies, universities and private enterprises
Contracting
Combination and optimization of highly advanced technologies
Demonstration of technologies
Promotion of technology extension
and commercialization
Number ofreportedsamples
Number ofsamples above the
maximum limit
Above themaximum limit
(%)
The items from which radioactive cesiumabove the maximum limit was detected
Rice 10.32 million 84 0.0008 Rice 2.2Wheat 1,818 0 0 4.8Beans 4,398 25 0.6 Soybean, Azuki bean 2.3
Vegetables 18,570 5 0.03Spinach*2, Angelica keiskei (Ashitaba),Lotus roots, Three leaf arrowhead, Japanesemustard spinach (Komatsuna)*2
3.0
Fruits 4,478 13 0.3Japanese apricot (Ume), Blueberry,Chestnut, Citrus fruit (Yuzu), Satsumamandarin
7.7
Tea infusion 867 13 1.5 Tea 8.6Other cultivated plants 3,094 14 0.5 Buckwheat 3.2Raw milk 2,421 0 0 0.4Meat and eggs(excluding wildlife meat)
154,866 4 0.003 Beef, Pork, Horse meat 1.3
Category
April 1, 2012, to March 31, 2013 Above the maximumlimit before FY2011-
end*1
(%)
A case for large-scale demonstration research on highly advanced agricultural technology
MAFF has implemented a large-scale research and demonstration project in the south coast area of Miyagi prefecture through industry-academia-government collaboration. This project applies and combines various highly advanced agriculture and fisheries technologies in the field of production and processing of rice farming, greenhouse horticulture, and fruit horticulture.
For example, in Yamamoto town, Miyagi Prefecture, a sunlight-using experimental plant for strawberry production was built in FY2011, and advanced technologies, such as optimizing the local temperature for strawberry growing points were demonstrated in FY2012, for faster growth while reducing total heating costs.
Strawberry shelves
To ensure distribution of safe foods, measures to reduce radioactive cesium and inspections of concentration of radioactive cesium in agricultural products have been implemented. As for rice safety, restriction on planting in certain areas, measures to prevent rice plants from absorbing radioactive cesium in planting paddies, and inspections of radioactive cesium before shipment are implemented. In Fukushima Prefecture, all rice bags are inspected. As for livestock products, it is important to promote measures for preventing grass from absorbing radioactive cesium. Such measures were completed by the end of FY2012 for 17,000 hectares out of the 38,000 hectares in grassland subjected to these measures. As a result of these measures, the frequency of exceeding the maximum limit of radio nuclides in farm and livestock products in FY2012 declined substantially from FY2011.
Source: Prepared by MAFF based on materials from MHLW and local public entities *1: The frequency of exceeding the maximum limit which was enforced in April 2012: 100 Bq/kg for general food products, 10 Bq/kg for
tea infusion and 50 Bq/kg for raw milk. 500 Bq/kg for crude or processed tea, which is equivalent to 10 Bq/kg for tea infusion, is used as the maximum limit for this calculation.
*2: Inappropriate storage and use of covering materials should cause these violations.
2 Impacts of the accident at the Fukushima Daiichi Nuclear Power Plant of the Tokyo Electric Power Company and restoration/reconstruction efforts
Image of large-scale demonstration research on highly advanced agricultural technology
Source: MAFF
Technology for optimizing temperatures at
strawberries’ growing point
Results of the inspections on radioactive cesium levels in farm and livestock products (17 prefectures)
3

Radioactive cesium levels inplow layers
Air dose rates at a height of1 meter above surface
Topsoil removal Reduce about 80-90% Reduce about 60-80%Inverting plowing Reduce about 60% Reduce about 30%
Results of farmland decontamination demonstration projects
Source: MAFF
MAFF published a farmland decontamination technical book (in August 2012) that compiled demonstrative farmland decontamination projects demonstrated at the local farmlands, which indicated notes on construction and construction management methods of farmland decontamination. Radioactive cesium levels in rice and vegetables that were test-cropped on decontaminated farmlands were reduced below the minimum radiation detection limit.
Under the catch-phrase “Eating for support” for disaster-affected areas, the government has promoted sales fairs for food products from disaster-affected areas and the proactive use of these products at companies’ in-house restaurants and used and sold these products at restaurants and shops at each government agency.
Many foreign countries and regions toughened import controls on Japanese agricultural, forest and fishery products including food due to the nuclear power plant accident. As the government has been united to ask foreign countries to ease such controls, 10 foreign countries including Canada lifted extra controls. Generally, foreign countries have been easing or lifting such controls.
With the needs for safety certificates being expected to grow in the future, the government developed its certificate issuance arrangements.
In order to recover exports, the government has supported disaster-affected areas’ export promotion efforts and send messages abroad about the attractiveness of Japanese food products.
Latest exports are recovering from the impact of the nuclear power plant accident.
Results of test-cropping on farmlands decontaminated under farmland decontamination demonstration projects
Test cropping Farmland decontamination (topsoil removal)
“Eating for support” campaign
MAFF restaurant and shop
METI restaurant MOD restaurant
Products from disaster-affected areas were promoted at the Hong Kong international Wine & Spirits fair.
Opening a foreign-language website
Easing import controls of major export destination
Sending messages abroad about attractiveness of Japanese food products
Demonstrative farmland decontamination project
Source: MAFF
2011 and 2012 exports (in value) comparing exports before and after the disaster
Source: Prepared by MAFF, based on MOF, “Trade Statistics”
(April-December)
Before the disaster After the disaster
In hundred millions of yen
In hundred millions of yen
Fishery products
Forest products
Agriculturalproducts
(January-March)
Municipality Crop acreage(Unit: a = 0.01 hectare)
Crop Results
57 Rice (Hitomebore, Akitakomachi,Maihime)
10 Vegetables (cucumbers, cabbages, etc.)Kawamata
town64 Rice (Akitakomachi, Hitomebore)
Iitatevillage
Belowminimumdetection
limit
Country /region Date Summary of easing import control
Thailand April 4, 2012Requirement for radioactive material test results9 prefectures 8 prefectures (excludingTokyo)
Vietnam July 2, 2012 Lifting controls on processed food productsApril 2 and October 30,
2012Easing controls on liquor imports
May 2013
Requirement for radioactive material testcertificates for all products from 9 prefectures
Limiting requirements to some specificproducts
Singapore April 8, 2013
Suspension of some specific exports from eightprefectures Exports allowed with requirementfor radioactive material test certificates (sevenprefectures)
EU
4

Country Product Weather conditions
U.S. Corn,soybeans
High temperatures and droughtfrom June 2012 in the corn belt
Russia,Ukraine,Kazakhstan
Wheat, etc.
Freezing damage in January-February 2012, and hightemperatures and drought fromspring
Wheat
Rainfall shortages and freezingdamage in January-February2012 in Germany and Spain,rainfall excess from August2012 in the United Kingdom
Corn Drought from July 2012 in theSoutheastern EU
Australia Wheat, etc.Low temperatures and droughtfrom July 2012 in WesternAustralia
EU
0
200
400
600
800
1,000
0
5
10
15
20
1819 20
2008
21200
9
22201
0
23201
1
24201
2
25201
3
Rice (right scale)
Soybeans
Corn
Wheat
2006 2007 2008 2009 2010 2011 2012 2013
dollars per bushel dollars per ton
53
86
88
93
98
47
14
12
7
2
0 20 40 60 80 100
FY2012
FY2011
FY2010
FY2009
FY2008
%
U.S. Others (South America, Eastern Europe, etc.)
1 Global food supply/demand and establishment of comprehensive food security (1) Global food supply/demand trends
Due to high temperatures and drought in the United States from June 2012, corn and soybean prices rose above their respective past record levels reached in 2008.
Wheat prices also rose along with corn prices but fell short of reaching the record level in 2008 because of wheat stocks in 2012 that exceeded those in 2008. Rice prices leveled off in 2012 as demand shifted to cheaper Indian rice on India’s resumption of rice exports after rice price hikes attributable to Thailand’s reintroduction of the government rice buyback system.
As feed grain (corn and others) buyers shifted rapidly from the United States to South America in response to U.S. corn price hikes from the summer of 2012, new risks emerged, including transportation delays arising from vulnerable infrastructure in South America.
Chapter 2 Efforts for securing stable food supply
Changes in International prices of grains and soybeans
Weather conditions affecting grain and soybean supply/demand (FY2012-2013)
Source: MAFF
Rice: $596 per ton
Record high: $1,038 per ton on May 21, 2008
Soybean: $14.6 per bushel Record high: $17.7 per bushel on September 4, 2012
Wheat: $7.1 per bushel Record high: $12.8 per bushel on February 27, 2008
Corn: $7.2 per bushel Record high: $8.3 per bushel on August 21, 2012
As of April 1, 2013
Sources: Prepared by MAFF based on data from the Chicago Board of Trade and the Rice Committee, Board of Trade of Thailand
Note: One bushel is equivalent to 27.2155 kg of soybeans and wheat, and 25.4012 kg of corn.
Feed corn procurement breakdown trends (in volume)
Source: Prepared by MAFF based on MOF, “Trade Statistics” Note: FY2012 data include preliminary data for March 2013.
5

Rice10.1 (34%)
Pork4.6 (15%)Beef
3.6 (12%)
Milk and milk products2.9 (10%)
Fisheries products2.5 (8%)
Sugar1.5 (5%)
Hen eggs1.1 (4%)
Forestry products0.5 (2%)
Chicken1.0 (3%)
Wheat0.8 (3%)
Other agricultural products1.1 (4%)
(Unit: 100 billion yen)
Und
er n
egot
iatio
n
: Negotiations : Signed : Effectuation : Revision protocols signed : Revision protocols effectuation
(Oct.)
EPA
/FTA
sign
ed
(Sep.)
2002 2003 2004 2005 2006 2007 2008 2009
Entire ASEANBrunei
Philippines
VietnamSwiss
IndonesiaThailand
ChileMalaysiaMexico
Singapore
South KoreaGCC
India
Australia
(from Nov. )
(from Jan.)
(from Feb.)
(from Feb.)
(from Jul. )
(from Jun.)
(from Apr.)
(from Feb.)
(form May)
(from Dec.)
(from Sep.)
(from Jan.)
(from Apr.)
(Sep.)
(Dec.)(Mar.)
(Apr.)
(Aug.)
(Jun.)
(Apr.)
(Sep.)
(Feb.)
(Sep.)
(Apr.)
(Nov.)(Jan.)
(Jul.)
(Nov.)
(Jul.)
(Jul.)
(Dec.)
(Dec.)
(from Jan.) (Dec.)
2010
Peru (from May)
2011
(Feb.)
(May)
2012
(Aug.)
(Mar.)
Mongolia (from Jun.)
Canada (from Nov.)
Colombia (from Dec.)
2013
Japan-China-South Korea
(from Mar.)
(Mar.)
(Sep.)(Sep.)
(Apr.)
Estimationtarget
Economic effects
Consumption + 0.61% (+ 3.0 trillion yen)
Exports + 0.55% (+ 2.6 trillion yen)
Investment + 0.09% (+ 0.5 trillion yen)
Imports - 0.60% (- 2.9 trillion yen)
Source: Cabinet Secretariat Notes: 3) The estimation shows the impacts on the Japanese economy and agriculture-forestry-fisheries production when Japan joins the TPP (11 countries). 4) Assumptions : <1> The estimation includes the impacts of tariff elimination, but not those of reduction of non-tariff barriers and liberalization of services and investment. <2> All tariffs are assumed to be eliminated upon entry into force. <3>The effects of additional domestic support measures are not taken into account. 5) MAFF estimated the output decrease in agriculture-forestry-fisheries considering details of each product such as production and distribution systems, and potential export capacities of exporting countries. The government incorporated MAFF’s estimate into the GTAP (Global Trade Analysis Project) model and estimated the impacts on the Japanese economy. Assumptions: <1> All domestic products are divided into two groups, “competing with imports” or “not competing with imports”, from the view point of price differentials, quality gaps and potential export capacities. <2> Competing goods are replaced by low price imports. <3> Prices of non-competing goods fall as low price imports spread among people.
(2) Trends in agriculture trade negotiations
Progress in Japan’s EPA/FTA negotiations
Source: MAFF Notes: 1) The Japan-ASEAN EPA took effect for Singapore, Laos, Vietnam and Myanmar in December 2008, for Brunei in January
2009, for Malaysia in February 2009, for Thailand in June 2009, for Cambodia in December 2009 and for the Philippines in July 2010.
2) On signed EPAs or FTAs, renegotiations have been conducted since their effectuation according to the respective agreements.
Economic effects (estimated) of tariff elimination under the TPP Effects on the entire Japanese economy (real GDP)
+ 0.66% (+ 3.2 trillion yen) Agriculture-forestry-fisheries output
decline: 3.0 trillion yen
By April 2013, Japan has signed economic partnership agreements with 12 countries and one region. Japan’s EPA negotiations are ongoing with Australia, Mongolia, Canada, Colombia, South Korea (negotiations suspended) and the GCC (negotiations delayed). In order to realize the Free Trade Area of the Asia-Pacific (FTAAP), Japan in November 2012 declared launching negotiations on the RCEP (Regional Comprehensive Economic Partnership: an EPA between ASEAN and six other countries – Japan, China, South Korea, India, Australia and New Zealand) and the Japan-China-South Korea free trade agreement. In March 2013, Japan announced its participation in the TPP (Trans-Pacific Partnership) negotiations. According to the government’s estimate, the impact of tariff elimination under the TPP on the Japanese economy is a 0.66% (3.2 trillion yen) increase in real GDP, while the TPP reduces domestic agriculture-forestry-fisheries output by approximately 3 trillion yen. (Since the government’s estimate is calculated under the assumptions given in Notes 4 and 5, the actual impacts on agriculture-forestry-fisheries output could be severer in the regions that depend more heavily on the agriculture-forestry-fisheries sector.)
6

4843 40 40 39 39
75 74 71 69 7066
0102030405060708090
FY1990 FY1995 FY2000 FY2005 FY2011
% Food self-sufficiency ratio(Production value basis)
Food self-sufficiency ratio(Calorie supply basis)
FY2010 FY2011
Food supply capacity
Domestic production capacity
Import capacity
Reserves
Food self-sufficiency potential
Farmlands, farming water and other agricultural resources
Farmers (business farmers)
Agricultural technologies
(Unit: 10,000 tons)
FY2008 FY2011FY2020targets
Rice 881 837 855Rice for flour 0.1 4.0 50.0Rice for feed 0.9 18.3 70.0Wheat 88 75 180Sweet potatoes 101 89 103Potatoes 274 239 290Soybeans 26 22 60Vegetables 1,265 1,182 1,308Fruits 341 297 340Raw milk 795 753 800Beef 52 51 52Pork 126 128 126Chicken 138 138 138Hen eggs 255 248 245Sugar beet 425 355 380Sugar canes 160 100 161Feed crops 435 408 527
Rice 100%
Wheat15%
Sugar 32%
Seafood 72%
Others28%Fruits
58%Soybeans25%
Vegetables90%
Livestock products
21% 56%
Per capita daily calorie supply: 2,640 kcal
48%2,436kcal
39%
FY2011
Others23%
Fruits33%Soybeans25%Vegetables76%
Seafood 64%
Sugar 26%
Wheat11%
Oils/fats 3%
16% 48%
Rice 97%
FY1990
562kcal
396kcal
341kcal
330kcal
198kcal109kcal
683kcal
366kcal
360kcal
320kcal
229kcal
143kcal
Imported-feed portion of production
Oils/fats16%
Japan’s food self-sufficiency ratio trends
Source: MAFF, “Food Balance Sheet”
2 Japan’s food self-sufficiency ratio trends The food self-sufficiency ratio on calorie supply basis in FY 2011 remained unchanged from 39% in the previous year as a wheat production recovery was coupled with a decline in rice demand following a temporary demand rise just after the Great East Japan Earthquake. (The feed self-sufficiency ratio rose by 1 percentage point to 26% on a TDN* basis.)
The food self-sufficiency ratio on production value basis in FY2011 fell by 4 percentage points to 66% as domestic production value decreased due to beef and vegetable price drops under the impact of the Great East Japan Earthquake.
* TDN stands for total digestible nutrients for livestock.
Trends of product-by-product food self-sufficiency ratios (on calorie supply basis)
Source: MAFF, “Food Balance Sheet”
The Basic Plan for Food, Agriculture and Rural Areas sets the food self-sufficiency ratio target for FY2020 at 50% on calorie supply basis and 70% on production value basis setting production targets for major products. At present, some increases have been seen in rice output for flour and feed. But wheat and soybean production has fallen on unfavorable weather conditions and a decline in their crop acreage. In addition to increase in the food self-sufficiency ratio, Japan should maintain and improve its food self-sufficiency potential that indicates domestic agricultural production’s potential food supply capacity covering farmlands, farming water and other agricultural resources, farmers (business farmers) and agricultural technologies.
Source: MAFF
Source: MAFF
Production targets and present conditions
Concept of food self-sufficiency potential
7
0
1,000
2,000
3,000
4,000
5,000
Ric
e
Bre
ad
Noo
dles
Fish
and
she
llfi
sh
Mea
t
Dai
ry p
rodu
cts/
eggs
Veg
etab
les/
seaw
eeds
Frui
ts
Oil
s/fa
ts/c
ondi
men
ts
Coo
ked
food
wit
h ri
ce, b
read
, no
odle
s
Oth
er c
ooke
d fo
od
Oth
er fo
od
Eat
ing
out
Yen/monthHouseholds including elderly people aged 65 or more
Households including no elderly people aged 65 or more
67.5
69.3
73.4
78.0
11.7
10.5
7.7
5.6
10.9
10.5
10.7
8.2
9.9
9.7
8.2
8.2
0 20 40 60 80 100
2010
2000
1990
1980
%
Fresh and processed food products
Cooked foodEating out
Alcoholic and other beverages
94.5
92.9
84.2
70
80
90
100
110
1990 1995 2000 2005 2012
Consumption expenditure level index (general) Real wage index
Consumption expenditure level index (food)
Indexes 29.0
23.7
23.5
10
15
20
25
30
05
101520253035
1980 1990 1995 2000 2005 2012
10,000 yen/month %Household consumption spending
Engel’s coefficient (right scale)Food expense
0
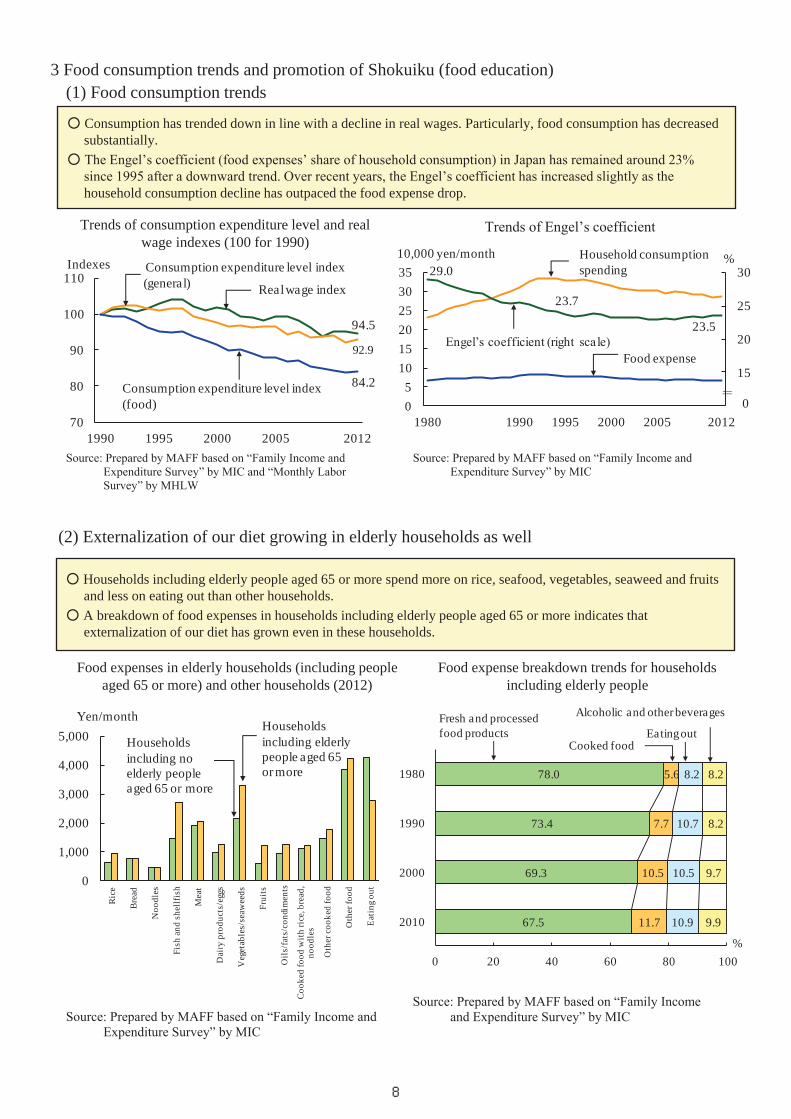
3 Food consumption trends and promotion of Shokuiku (food education) (1) Food consumption trends
Consumption has trended down in line with a decline in real wages. Particularly, food consumption has decreased substantially. The Engel’s coefficient (food expenses’ share of household consumption) in Japan has remained around 23% since 1995 after a downward trend. Over recent years, the Engel’s coefficient has increased slightly as the household consumption decline has outpaced the food expense drop.
Source: Prepared by MAFF based on “Family Income and Expenditure Survey” by MIC and “Monthly Labor Survey” by MHLW
Trends of Engel’s coefficient
Source: Prepared by MAFF based on “Family Income and Expenditure Survey” by MIC
Trends of consumption expenditure level and real wage indexes (100 for 1990)
(2) Externalization of our diet growing in elderly households as well
Households including elderly people aged 65 or more spend more on rice, seafood, vegetables, seaweed and fruits and less on eating out than other households.
A breakdown of food expenses in households including elderly people aged 65 or more indicates that externalization of our diet has grown even in these households.
Food expenses in elderly households (including people aged 65 or more) and other households (2012)
Food expense breakdown trends for households including elderly people
Source: Prepared by MAFF based on “Family Income and Expenditure Survey” by MIC
Source: Prepared by MAFF based on “Family Income and Expenditure Survey” by MIC
8

7.9
8.2
8.6
8.9
9.7
7.2
8.0
9.4
10.2
11.7
6.2
6.7
7.5
8.3
9.5
3.9
4.1
4.5
4.7
4.2
10.1
10.5
11.1
11.5
11.7
3.0
3.4
3.8
4.0
4.5
4.5
4.3
4.0
3.7
3.1
7.4
7.3
6.7
6.3
6.7
16.6
14.7
12.0
10.9
8.3
7.7
6.9
5.6
4.6
3.8
4.8
4.7
4.8
4.8
4.8
20.8
21.2
22.1
22.1
21.9
0 20 40 60 80 100
2025
2015
2005
2000
1990
%
Cereals Fish and shellfish Eating outMeat
Dairy products/eggs
Vegetables/seaweedsFruits
Oils/fats/condiments
Alcoholic beveragesBeverages
Cooked food
Cakes/candies
813 1,073
1,504 1,934
22.7 26.4
32.2 37.3
0
10
20
30
40
0
1,000
2,000
3,000
1980 1990 2000 2010
%10,000 households
Percentage share for households including elderly people aged 65 or more (right scale)
Number of households including elderly people aged 65 or more
0
1
2
3
20 30 40 50 60 70
1,000 yen
Rea
l spe
ndin
g on
coo
ked
food
1,000 yenReal income for spouses
19.8
32.437.2
12.5
19.821.2
42.1
27.9 23.3
5.7 8.711.4
19.9
11.1
6.90
10
20
30
40
50
1980 1990 2000 2010 2020 2035
Couple-and-child households Single-member households
Couple-only households
Others (including three-generation households)
Single-parent households
Two-
mem
ber o
r lar
ger h
ouse
hold
s
%
42.6 43.8
61.968.6
75.7
76.4
87.8 88.7
0
20
40
60
80
100
Aged 15-19
Aged 20-24
Aged 25-29
Aged 30-34
Aged 35-39
Aged 40-44
Aged 45-49
Aged 50-54
Aged 55-59
Aged 60-64
Aged 65 or more
Japan (1975)
Japan (2012)
Germany
Sweden
U.S.
%
Percentage shares have tended to increase for single-member households, couple-only households and households including elderly people aged 65 or more. Particularly, the percentage share for single-member households has been rising faster than for couple-only households. This tendency is expected to continue in the future.
The share of overall food expenditure has declined for meat and vegetables while increasing for cooked food and oils/fats/condiments. As the tendency is expected to continue, externalization of our diet is projected to further grow.
(4) Structural food consumption changes
Changes in shares for household categories Changes in the number of and percentage share for households including elderly peopled aged 65 or more
Sources: MIC, “Population Census,” the National Institute of Population and Social Security Research, “Household Projections for Japan”
Source: “Outlook on household food expenditure under the falling birthrate and aging population” (August 2010) by the MAFF Policy Research Institute Note: Data through 2005 are from “Family Income and Expenditure Survey,” “Consumption Survey” and others by MIC. Data in and after 2015 are estimates.
Changes in and projections of food categories’ shares of food expenditure
Source: MIC, “Population Census”
(3) Changes in women’s labor situation and their impacts on demand for cooked food Women’s labor participation rate by age group in Japan indicates a moderate M-shaped curve reflecting improvements in work conditions. Meanwhile, these rates in Western countries including Sweden, Germany and the United States indicate parabolic curves. In line with an increase in real income for spouses in workers’ households, real spending per household member on cooked food has trended upward. If women’s participation in society in Japan reaches the levels in Western countries, demand for cooked food will increase in line with income growth.
Women’s labor participation rate by age group (international comparison)
Source: Prepared by MAFF based on “Labor Force Survey” by MIC and “LABORSTA” by the ILO
Source: Prepared by MAFF based on “Family Income and Expenditure Survey” and “Consumer Price Index” by MIC
Real income for spouses of householders and real spending per household member on cooked food
9

78.9
94.2
78.62.3
5.8
01234567
60
70
80
90
100
1990 1995 2000 2005
Trillion yenHome-meal replacement industry
(right scale)
Food industry
Trillion yen
02010 2011
0
5,000
10,000
15,000
20,000
25,000
30,000
35,000
2007 2008 2009 2010 Estimate
2011 Projection
2015 Projection
100 million yen
16,382
19,225
22,70324,265
26,156
31,752
Confectionery
Seasoned food
Seasoning
Beverages and articles of tasteDry food
Chilled beverages and milk productsProcessed livestock products
Japanese and dry meals for daily delivery
Others
Frozen food products
Alcoholic beverages
(5) Promotion of Shokuiku (food education) The promotion of Shokuiku (food education) is important for fostering people who have knowledge about food and select foods to practice healthy eating habits.
MAFF has expanded advanced wide-area and region-specific Shokuiku activities to promote the implementation of Japanese eating habits.
[Specific cases] National Food Koshien Contest in Yamagata 2012 (Yamagata city, Yamagata Prefecture)
The association for delicious Yamagata food and culture, the Yamagata Shokuiku network, the prefectural federation of agricultural cooperatives and the Yamagata Prefecture government have sponsored the contest through cooperation between the public and private sectors to foster senior high school students’ consciousness about Shokuiku and promote the succession of local food cultures. Senior high school students who won regional preliminary contests raced to present new cooking ideas taking advantage of local food cultures and rich food materials as learned from local farmers and cooks.
Efforts using a Shokuiku and Hanaiku (flower education) center (Niigata city, Niigata Prefecture)
The Niigata municipal government launched a Shokuiku and Hanaiku center in FY2011as a Shokuiku promotion base to implement cooking practices using local food materials and elementary school students’ trial participation in farming. In the future, it plans to open agricultural parks including trial farming fields, livestock barns and accommodation facilities in a bid to allow all elementary school students in the city to experience trial farming. Retailer’s health promotion efforts (Sakado and Tsurugashima cities, Saitama Prefecture)
Under a partnership between Yaoko Co. and the Kagawa Education Institute of Nutrition, Saitama Prefecture has promoted campaigns at supermarket stores to increase vegetable intake under the slogan “Vegetables for health and longevity.” In efforts to increase the vegetable intake of the people in Saitama Prefecture, the prefecture calls for one additional vegetable dish everyday through posters and holds tasting events for broccoli produced in the prefecture.
4 Food industry trends
The domestic production value of the food industry has been falling due to food price drops since a peak was posted in the second half of the1990s.
Even amid the trend, the home-meal replacement market has been expanding due to structural family changes and the growth of externalization of our diet, indicating it is important for food companies to explore domestic markets from the viewpoint of consumers.
Regarding product planning and development, the private brand products market expanded from 1.6 trillion yen in 2007 to 2.4 trillion yen in 2010 and is projected to exceed 3 trillion yen in 2015.
Trends of domestic production value of the food industry and the home-meal replacement market
Source: MAFF, “Agriculture/Food Industry Economic Accounting,” Foodservice Industry Research Institute survey
Notes: 1) The home-meal replacement industry market represents delicatessen stores (excluding catering lunch boxes).
2) The food industry covers combined production in value by the food manufacturing industry, restaurants and relevant distributors.
Trends of the private brand products market
Source: Fuji Keizai Co., “PB Food Market Fact-finding Survey 2011”
Note: On a retail base
10

0
5,000
10,000
15,000
20,000
FY2006 FY2007 FY2008 FY2009 FY2010Estimate
FY2011Projection
FY2015Projection
100 million yen
14,35415,262 15,735 16,166 16,806 17,260
19,021
Home natural food delivery service
Home meal delivery
Home prepared-food
Home pizza delivery
Home sushi delivery
Home delivery by restaurant and fast food chains
Milk delivery
Coop delivery service
Home delivery by convenience stores and Internet supermarkets
329 327 357 379 387 404 401
41 48 46 53 57 62 68163 179 174 156 168 187 198
0
100
200
300
400
500
600
700
2005 2006 2007 2008 2009 2010 2011
Companies RestaurantsFood manufacturing
533 554653
577 588 612667
Distribution/trade (including logistics)
8
In food distribution, the food delivery service market expanded from 1.4 trillion yen in FY2006 to 1.7 trillion yen in FY2010 and is projected to increase to 1.9 trillion in FY2015.
Food companies operating in Asia account for 667 firms or two-thirds of Japanese food firms that have expanded into overseas markets, indicating these companies’ accelerating efforts to grab Asian and other overseas demand expected to increase in the future.
[Japanese restaurants opened as a symbol of Japanese culture in Thailand]
The Japanese restaurant chain Ootoya Co. has opened Japanese restaurants in Bangkok. It exports udon wheat noodles and soba buckwheat noodles as well as shoyu soy sauce and miso fermented soybean paste that determine the taste of Japanese food, while procuring pork, chicken and other food materials in Thailand. As Japanese restaurants have been expanded to spread Japan’s food culture in Bangkok, Japanese department stores in Bangkok have increased sales of shoyu and miso exported from Japan.
Changes in the number of Japanese food firms operating in Asia
Source: Prepared by MAFF based on “List of Overseas Operating Enterprises 2012” by Toyo Keizai, Inc.
Notes: 1) The total number of companies operating overseas was 977. 2) Data are for 2011. 3) Asian markets covered by the figure are China, Hong Kong,
Singapore, Taiwan, South Korea, Thailand, Malaysia, the Philippines, Indonesia, Vietnam and India.
Source: Yano Research Institute Ltd. ,“Food Delivery Market Survey 2011” Notes: 1) On a corporate sales basis
2) Effects of the March 2011 Great East Japan Earthquake are not taken into account.
Food delivery market value and breakdown trends
Ensuring food safety and consumer confidence (1) Efforts for improving food safety
MAFF implements the risk management process based on scientific principles to improve food safety. In FY2012, MAFF compiled a databook of analytical results from MAFF surveillance studies on hazardous
chemicals in agricultural, livestock, fishery and other food products conducted from FY2003 until FY2010 (a total of about 344,000 data) and distributed it widely to interested parties.
Using outcomes from MAFF surveillance studies on foodborne pathogens, MAFF published a handbook for egg farms, following the handbooks for beef and chicken farms issued in the previous year, that provided measures to prevent food poisoning bacteria from invading into or spreading in farms.
The number of data and the use of outcomes from MAFF surveillance studies shown in the databook
Source: MAFF
MAFF investigated the occurrence of contaminants (e.g. mycotoxins and heavy metals) and pesticide residues in fifty-four agricultural products, six livestock products, thirty fishery products and thirty-eight processed food products that Japanese people consumed abundantly, or that had contained previously or potentially contained those chemicals at high levels (the total number of data: approx. 344,000).
The studies confirmed that the safety of most agricultural, livestock, fishery and processed food products produced in Japan is highly ensured.
The data are used as a basis for domestic and international risk assessments and for evaluation of risk management measures.
11

Food labeling surveillance council (local level)
Relevant prefectural organizations Local branches of central government agencies
Local MAFFbranchLocal MHLWbranchLocal JFTC (Japan Fair Trade Commission) branchetc.
Division in charge of the Act against Unjustifiable
Premiums and Misleading Representations
Division in charge of the Food Sanitation
Act
Division in charge of the Act on Standardization and Proper
Quality Labeling of Agricultural and Forestry Products
Consumer center, etc.
Division in charge of the Rice Traceability Act
Prefectural police department
Punishing business operators as necessary
Relevant organizations share information and exchange opinions
Information on inappropriate food labeling
(2) Animal and plant epidemic prevention measures
Cases for thorough sanitary control to prevent infectious livestock diseases from breaking out
Source: MAFF
Putting up barricades to separate a sanitary control area
An orderly locker room for visitors
Cases for border measures for passengers at international airports
Shoe sole disinfection using a disinfection mat A baggage inspection with a quarantine detector dog
An animal quarantine questionnaire
Prepared in Japanese,
English, Korean, Chinese
(simplified and traditional) and
Russian
Source: MAFF
MAFF implements animal and plant epidemic prevention measures to prevent infectious livestock diseases and plant pests from entering Japan from abroad and breaking out or flourishing in Japan.
In order to prevent infectious livestock diseases from entering Japan at the border, MAFF implements shoe sole disinfection for all travelers entering Japan and baggage inspections with quarantine detector dogs at airports and seaports, and announcement-based questions to passengers on all direct flights from countries or regions where foot-and-mouth diseases and the like were reported, and questionnaire surveys on some of such flights.
MAFF conducts on-the-spot inspections under the Act on Standardization and Proper Quality Labeling of Agricultural and Forestry Products and the Law for Keeping Transaction Record and Relaying Place of Origin Information of Rice and Rice Products, and gives instructions on and publishes inappropriate product labeling and provide guidance against inappropriate information about the origins of rice and processed rice products. Local food labeling surveillance councils share information and exchange opinions on inappropriate food labeling.
The CAA has submitted to the Diet a food labeling bill to unify food labeling provisions in the three food labeling laws (the Food Sanitation Act, the Act on Standardization and Proper Quality Labeling of Agricultural and Forestry Products, and the Health Promotion Act) (On April 5, 2013, the bill was decided on by the Cabinet and submitted to the Diet).
(3) Efforts to secure consumers confidence
Cooperation between agencies involved in food labeling
Source: MAFF
12

2,9024,986 5,272
8,700
14,100
0.4 1.5 1.62.5
6.2
0
2
4
6
8
10
0
5,000
10,000
15,000
20,000
1990 1995 2000 2005 2012
Corporation farms %Corporation farms’ share of total farmlands (right scale)
Number of corporation farms
65 79 119
16
21
32
05101520253035
0
100
200
300
400
500
1990 2000 2010
398 380 368
10,000 hectares %
Area cultivated by farms having 20 hectares or more in farmland
Percentage share of land area cultivated by farms having 20 hectares or more in farmland(right scale)
Area cultivatedby farms havingless than 20hectares infarmland
0
2
4
6
8
10
12
14
1970 1975 1993 2005 2010
Lease hold rights transfers
Ownership transfers
Creation of the agricultural land use promotion project
Creation of the super L loan system for certified farmers
Creation of farm management stabilization programs
10,000 hectaresCreation of the certified farmer system
Less than20
hectares
20hectaresor more
Total
9,706 2,805 12,511
78% 22% 100%
3.8 15.4 19.2
20% 80% 100%
Number ofcorporation
farms
Farmland size(10,000 ha)
2831
3540
45
21 2326
3035
2226
0
10
20
30
40
50
1990 1995 2000 2005 2010
%
5 hectares or more
10 hectares or more20 hectares or more
Source: MAFF
Source: MAFF
Changes in farmland concentration rates by size of cultivated land under management
(family farms )
Number of corporation farms by size of cultivated land under
management and farmland size (2010)
Source: MAFF
Changes in the number of corporation farms
While the number of family farms has declined, family farms scales have expanded. Family farms cultivating 5 hectares or more in farmlands now account for 45% of overall farmlands held by family farms.
The number of corporation farms has increased and their share of overall farmlands has expanded. In 2010, corporation farms cultivating 20 hectares or more in farmlands accounted for 22% of the total number of
corporation farms and 80% of their farmlands.
Chapter 3 Efforts for sustainable development of agriculture 1 Promoting structural agriculture reforms (1) Agricultural structure changes
Percentage of land area cultivated for land-extensive farming by farms having 20 hectares or more in farmland
Changes in farmland size for rights transfers
Sources: Estimated based on MAFF’s “Census of Agriculture and Forestry” and “Statistics on Cultivated Area and Planted Area”
Source: MAFF Note: “Super L loan” is a low-interest loan for certified farmers.
Since the creation of the agricultural land use promotion project in 1975, MAFF has promoted the mobility of farmland using mainly the leasehold rights. The creation of the certified farmer system in 1993 and that of the super L loan system for certified farmers in 1994 have helped accelerate the mobilization.
As a result, the percentage share of land area cultivated for land-extensive farming by farms having 20 hectares or more in farmland rose to 32% in 2010.
13

9,417
11,539 12,311 12,14911,717
0
4,000
8,000
12,000
16,000
2005 2010 2011 2012 2013 (Estimate)
Community-based farm cooperatives
Corporations participating in
agriculture(1,071
corporations)
Vegetables: 492 corporations (46%)
Rice, wheat, barley, etc.: 183 corporations
(17%)
Mixed production: 199 corporations
(19%)
Fruits: 92 corporations (8%)
Industrial crops: 42 corporations (4%)
Flowers: 30 corporations (3%)
Livestock (including feed crop production): 25 corporations (2%)
Others: 8 corporations (1%)
235 435
671(63%)63
108
145
66
134
255(24%)
0
200
400
600
800
1,000
1,200
2010 2011 2012
Corporations
Stock corporations
Special limited liability companies
NPO corporations
677
364
1,071
(14%)
Voluntary organization Corporation organizationCorporate status Absent Present
Decision-makingsystem
Cooperative members'agreements, based on no law
Directors make decisionsbased on law
Internal reserves cannot beaccumulated
Internal reserves can beaccumulated
Loans to or investment in avoluntary organization cannotbe accepted
Loans to and investment in acorporation organization canbe accepted
Securingemployment
Difficult Possible
Securinginvestmentresources
(Unit: %)
Securing stablematerial supply
Reducingmaterialprocurementcosts
Securingtraceability
Increasing valueadded for anddifferentiatingmainstayproducts
Upgradingcorporate image
Diversifyingbusinessoperations
Securing profitContributing tolocaldevelopment
Promotingemploymentmeasures(effectiveutilization ofhuman resources)
Foodmanufacturers 51 22 37 59 45 31 29 57 41
Food wholesalers 67 28 28 56 39 44 39 50 22
Constructioncompanies 12 12 8 12 28 80 32 60 72
14
In three years after the Agricultural Land Act was revised in 2009, 1,071 corporations launched agricultural production. Stock corporations accounted for the largest share at 63% of the total, followed by 24% for NPO (nonprofit organization) corporations and 14% for special limited liability companies.
Of these corporations, the largest portion at 46% produce vegetables, followed by 19% for mixed production and 17% for rice, wheat, barley, etc.
More than 50% of food manufacturers and wholesalers have participated in agriculture for the purpose of securing stable material supply or increasing value added for and differentiating their mainstay products. More than 70% of construction companies have participated in agriculture for the purpose of business diversification and employment measures (effective utilization of human resources).
Differences between voluntary community-based farm cooperatives and corporation organizations
Trends of general corporations’ entry into agriculture (Increases after Agricultural Land Act revision)
Changes in the number of community-based farm cooperatives (voluntary organizations)
Source: MAFF surveys Source: MAFF, “Survey on Community-Based Farm Cooperatives”
Community-based farm cooperatives (voluntary organizations) have been in transition to corporation farms. Some new cooperatives have been created while some existing cooperatives have been transformed into corporation farms. As a result, the number of community-based farm cooperatives has remained around 12,000 over recent years.
For further stabilization of their management community-based farm cooperatives, if they are voluntary organizations, they should be encouraged to become corporation organizations.
Corporation farms by product (at the end of December 2012)
Purposes for participation in agriculture by type of industry (multiple answers allowed)
Source: MAFF Note: At the end of December for each year
Source: MAFF Note: “Mixed production” indicates producers of multiple products.
Source: JFC, “Survey on Enterprises’ Entry into Agriculture” (published in January 2012)
14

Conscious of being farm manager46.5%Not conscious of
being farm manager
No opinion
No response6.6%
15.3%
31.7% 41 74 84 91 91 89
59 26 16 9 9 11
0 20 40 60 80
100
Less than 3 m. yen
3-5 m. yen
5-10 m. yen
10-50 m. yen
50-100 m. yen
100 m. yen or more
With women%
Without women
55.1
41.5
28.2
20.8
11.3
11.0
0 10 20 30 40 50 60
Improving women's ambitions and consciousness
Other family members' understanding
Improving women's capabilities
Women's networks
Providing information and opportunities
Local communities' understanding %
23.0
9.4
0 10 20 30
With women directors or managers
Without women directors or managers
%
Gap of 13.6 percentage points
Engaged69.9%
Not engaged
No opinion
No response1.3%
15.8%
12.9%
Women farmers play a key role in agriculture and regional activities. Of women farmers, 70% are engaged in preparing farm management policies and 47% are recognized as farm managers.
Business operations with women directors or managers tend to feature higher sales and profitability than those without them.
Farms with core women farmers tend to feature higher sales than those without them. Required for allowing women farmers to work proactively are their improvement of ambitions and capabilities, other
family members’ understanding, women’s networks, and the provision of information and opportunities. In October 2012, a nationwide network (nicknamed “Hime Collabo (princess collaboration)” was launched for women
farmers to have links with non-agriculture industries.
Engaged in preparing farm management policies (women farmers)
Comparison of sales growth rates for cases with and without women directors or managers
Conscious of being farm manager (women farmers)
Source: MAFF, “Questionnaire Survey on Women’s Engagement in Agriculture” (conducted in January 2013)
Percentage shares for farming families with and without core women farmers by farm product sales size
Source: MAFF Note: Prepared based on MAFF’s “2010 World Agriculture-Forestry
Census” (custom-ordered tabulation)
Source: JFC, “Survey on Women’s Performance in Farm Management” (published in January 2013)
Launching a “nationwide network linking with women agriculture-forestry-fisheries workers”
(nicknamed “Hime Collabo”)
In October 2012, a nationwide network (nicknamed “Hime Collabo”) linking with women agriculture-forestry-fisheries workers was launched to form a network for women agriculture-forestry-fisheries workers, deepen their links with different industries and private enterprises, develop business partnerships and step up information and other exchanges and collaboration to further promote business operations of women agriculture-forestry-fisheries workers.
An exhibition booth at “Agriculture Frontier 2012”
A national seminar
Measures required for allowing women farmers to work proactively (multiple answers allowed)
Source: MAFF, “Questionnaire Survey on Women’s Engagement in Agriculture” (conducted in January 2013)
15
0.1 2.5 5.99.8
25.552.5
81.5
0 1 3 614
30
46
0
10
20
30
40
50
60
0
20
40
60
80
100
120
Aged 15-19
Aged 20-29
Aged 30-39
Aged 40-49
Aged 50-59
Aged 60-69
Aged 70 or more
10,000 persons %Number of core persons mainly
engaged in farming
Percentage shares of all core persons mainly engaged in farming (right scale)
Total number of core persons mainly engaged in farming at
1.78 million
1.06 million people aged 65 or more (60%)
180,000 persons aged less than 50 (10%)
0.7 0.6 0.6 0.6 0.6 0.8
10.3 9.68.3
9.37.7 7.6
3.7 4.15.5 5.1 4.9
5.9
02468
1012
2006 2007 2008 2009 2010 2011
1,000 persons New self-employed farmersNew employed farmers
New entries
72.464.4
49.657.4
44.847.1
6.5 7.3 8.4 7.6 8.0 8.9
0
20
40
60
801,000 persons New self-
employed farmers
New employed farmers
New entries
5 1 6 10 5 17 7 14 5 7 6 2 8 12 7 15
8 11 7 8 15
9 17
23 17
29 19
28 17 19 13
13 13
14 14
13
13 15
14 14
61 74 56 40 58 26
53 31
58 52
0 20 40 60 80
100
Tota
l
Ric
e fa
rmin
g
Out
door
veg
etab
le fa
rmin
g
Faci
lity
-bas
ed v
eget
able
fa
rmin
g
Orc
hard
farm
ing
Dai
ry fa
rmin
g
Cat
tle
farm
ing
Hog
farm
ing
Sem
i-m
ulti
ple
farm
ing
Mul
tipl
e fa
rmin
g
39 or less40-4950-59
60-64
65 or more
%
Single farming
(66) (70) (65) (60) (66) (55) (63) (57) (65) (63) Average age
81.073.5
60.066.8
54.6 58.166.3 59.1 45.6
51.8 41.4 43.9
14.7 14.3 14.4 15.0 13.2 14.2
0102030405060708090
2006 2007 2008 2009 2010 2011
1,000 personsNew farmers (Total)
New farmers (40 year-old or older)
New farmers (39-year-old or younger)
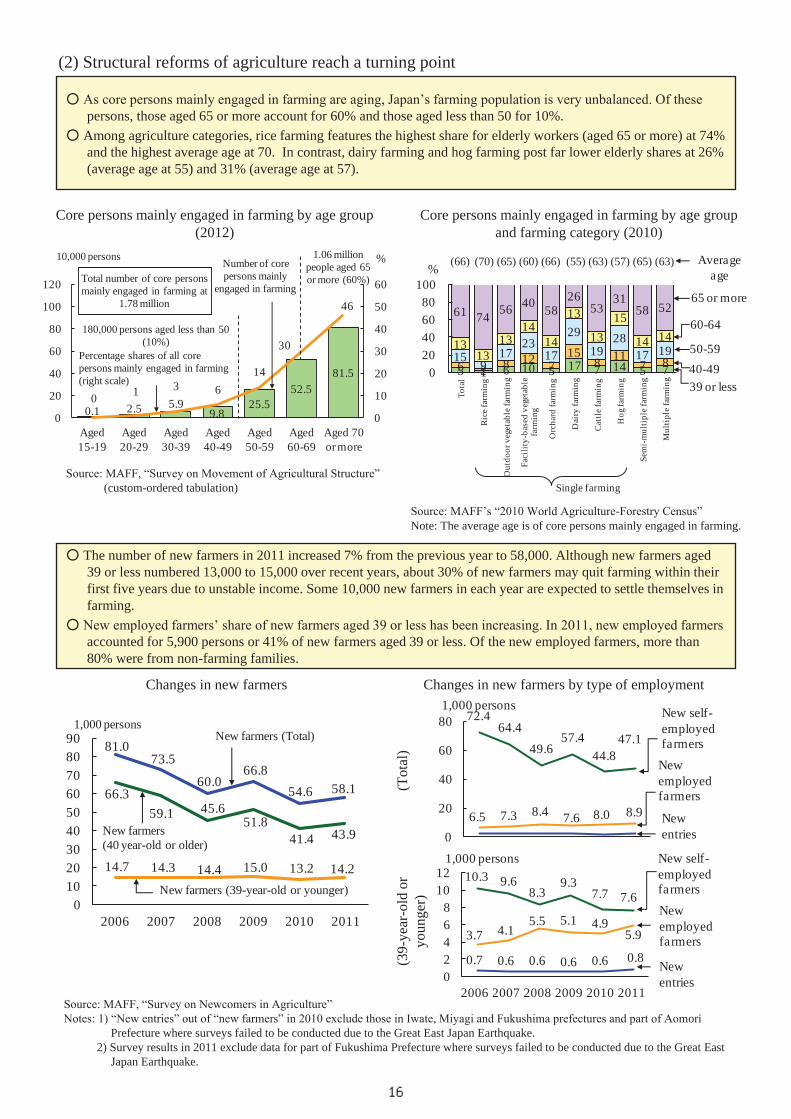
(2) Structural reforms of agriculture reach a turning point
Source: MAFF, “Survey on Movement of Agricultural Structure” (custom-ordered tabulation)
Core persons mainly engaged in farming by age group (2012)
Source: MAFF’s “2010 World Agriculture-Forestry Census” Note: The average age is of core persons mainly engaged in farming.
Core persons mainly engaged in farming by age group and farming category (2010)
As core persons mainly engaged in farming are aging, Japan’s farming population is very unbalanced. Of these persons, those aged 65 or more account for 60% and those aged less than 50 for 10%.
Among agriculture categories, rice farming features the highest share for elderly workers (aged 65 or more) at 74% and the highest average age at 70. In contrast, dairy farming and hog farming post far lower elderly shares at 26% (average age at 55) and 31% (average age at 57).
Source: MAFF, “Survey on Newcomers in Agriculture” Notes: 1) “New entries” out of “new farmers” in 2010 exclude those in Iwate, Miyagi and Fukushima prefectures and part of Aomori
Prefecture where surveys failed to be conducted due to the Great East Japan Earthquake. 2) Survey results in 2011 exclude data for part of Fukushima Prefecture where surveys failed to be conducted due to the Great East
Japan Earthquake.
The number of new farmers in 2011 increased 7% from the previous year to 58,000. Although new farmers aged 39 or less numbered 13,000 to 15,000 over recent years, about 30% of new farmers may quit farming within their first five years due to unstable income. Some 10,000 new farmers in each year are expected to settle themselves in farming.
New employed farmers’ share of new farmers aged 39 or less has been increasing. In 2011, new employed farmers accounted for 5,900 persons or 41% of new farmers aged 39 or less. Of the new employed farmers, more than 80% were from non-farming families.
Changes in new farmers Changes in new farmers by type of employment
(39-
year
-old
or
youn
ger)
(T
otal
)
16

3.2 3.1 3.8 6.6 8.3 13.3 16.2 18.2 9.9 9.2 9.7
1.3 2.0
5.4
14.412.4
0
5
10
15
20
25
30
35
40
1975 1980 1985 1990 1995 2000 2005 2010
10,000 hectares
Owned by land tenure non-farm households
Owned by noncommercial farm households
Owned by commercial farm households
3.84.1
5.6
7.99.0
39.638.6
34.3
24.421.7
13.512.313.1
Total owned by farm households
1.37 million households in 2010
900,000 households in 2010
1.63 million households in 2010
524483 461 459 456
535456 424 423 419
102.0
94.5 92.1 92.2 91.9
50
60
70
80
90
100
110
300
400
500
600
700
1990 2000 2009 2010 2011
%
Aggregate planted area of crop
Utilization rate of cultivated land (right scale)
00
Cultivated land area
10,000 hectares
0.4
1.2 0.9 0.8 0.7 0.7
1.01.0 0.8 0.8 0.7
-4
-3
-2
-1
0
1
2008 2009 2010 2011 2012
Damaged by natural disaster
Abandonment of cultivation
Transformation of farmlands into industrial or residential lands
Development for cultivation
Others
Recovery
1.71.7
0.60.2
10,000 hectaresExpansion
Reduction 3.3
462.8 460.9 459.3 456.1 454.9
440 450 460 470
10,000 hectares
Cultivated land area0
Japan’s cultivated land area has trended down due to the transformation of some farmlands into industrial lands and elimination through abandonment of cultivation. In 2011, the cultivated area declined by 17,000 hectares due primarily to the tsunami waves caused by the Great East Japan Earthquake. In 2012, however, farmlands totaling 4,000 hectares were recovered.
The utilization rate of cultivated land has remained around 92% over recent years. The rate in 2011 fell by 0.3 percentage point from the previous year as the rice planted area decreased in locations affected by the Great East Japan Earthquake and the Tokyo Electric Power Co. Fukushima Daiichi Nuclear Power Plant accident, despite an increase in the area for feed crop planting at paddy fields.
Source: MAFF, “Statistics on Cultivated Area and Planted Area” Note: Utilization rate of cultivated land: Total planted area/
cultivated land area x 100
Changes in utilization rate of cultivated land
The abandoned cultivated land area has increased rapidly due to elderly farmers’ retirement. Particularly, abandoned cultivated land lots owned by land tenure non-farm households have expanded rapidly,
accounting for half of the total.
Changes in abandoned cultivated land area by farm household category
Source: MAFF, “Census of Agriculture and Forestry” Notes: 1) Numbers in parentheses at the right end represent total numbers of farm households including those that have no
abandoned cultivated land. 2) In and before 1985, farm households had not been divided into commercial and noncommercial farm households.
Changes in cultivated land area and breakdown by cultivated land reduction or expansion factor
Source: MAFF, “Statistics on Cultivated Area and Planted Area”
17

18
Source: MAFF Notes:1)* These municipalities have communities that have already prepared “Farmers and Farmland Plans.”
2) In parentheses are the four categories’ percentage shares of the total number of municipalities about to prepare “Farmers and Farmland Plans.”
In order to solve regional problems between farmers and farmlands, “Farmers and Farmland Plans” have been being prepared since FY2012 to specify how to integrate farmlands for future leading farms and how to develop regional farming through thorough discussions among local and regional farmers.
As of March 2013, municipalities that had already prepared such plans had accounted for 84% (7,573 communities) of those willing to create such plans.
Progress in preparation of “Farmers and Farmland Plans” (at the end of March 2013)
2 Measures for solving problems between farmers and farmlands
3 Developing and conserving agricultural production infrastructure Agricultural irrigation facilities have been deteriorating on a nationwide basis. About 20% of major irrigation
facilities have already exceeded their respective standard durable years. In order to make the national land more resilient, Japan should promote measures to lengthen service lives and enhance resistance against earthquakes for deteriorated irrigation facilities and measures against torrential rains.
Of paddy fields totaling 2.5 million hectares in Japan, about 60% have been integrated into 30-ares or larger partitions. Only about 10% have been integrated into large (approximately 1-hectare or larger) partitions. About one-third of integrated paddy fields have unfavorable drainage conditions. Japan should promote the integration and improvement of paddy fields to accelerate farmland integration for business farmers and increase value added for agriculture.
Facilities that have already exceeded the standard
durable years: 3.1 trillion yen (17% of total)
Adding those that will exceed the
standard durable years in the next
decade to the above: 5.6 trillion yen (31% of total)
State of paddy fields improvement (2011)
Sources: MAFF, “Statistics on Cultivated Area and Planted Area” and “Basic Survey on Agriculture Infrastructure Information”
Notes: 1) Integration-completed paddy fields mean those that have been integrated into 30-ares or larger partitions (large-scale partitions are 1 hectare or larger).
2) Favorable drainage conditions represent a groundwater level of 70 centimeters depth or deeper and the removal of flooding within four hours.
State of outdated major irrigation facilities (2009)
Source: MAFF, “Basic Survey on Agriculture Infrastructure Information”
*: An asset value of major irrigation facilities (agricultural irrigation facilities benefitting from 100 hectares or more) (on a reconstruction cost basis)
[Resident participatory management] Farmers expand paddy partitions by removing ridges and conduct underdrainage construction on their own to expeditiously improve infrastructure at lower cost.
Expanding a paddy partitions by
removing ridges
Underdrainage construction
Favorable water drainage conditions
1.06 million hectares
Unfavorable drainage conditions
490,000 hectares
Paddy fields totaling 2.47 million hectares
Multipurpose paddy fields
Before-integration paddy fields: 920,000 hectares (37%)
Integration-completed paddy fields: 1.55 million hectares (63%)
Large-scale partitions:
210,000 hectares (8%)
State-run facilities
0.8 Prefecture-run and other
facilities 2.3
Prefecture-run and other
facilities 1.7
State-run facilities
0.8Total at
17.9 trillion yen*
(Unit: trillion yen)
(Unit: municipalities)
Hokkaido 171 167 (98%) 161 (94%) 158 (92%) 158 (92%)Tohoku 210 208 (99%) 185 (88%) 173 (82%) 173 (82%)Kanto 376 358 (95%) 302 (80%) 291 (77%) 289 (77%)Hokuriku 79 79 (100%) 77 (97%) 77 (97%) 77 (97%)Tokai 117 114 (97%) 103 (88%) 90 (77%) 89 (76%)Kinki 152 143 (94%) 125 (82%) 115 (76%) 113 (74%)Chugoku/Shikoku 195 195 (100%) 178 (91%) 171 (88%) 170 (87%)Kyushu/Okinawa 260 260 (100%) 250 (96%) 243 (93%) 243 (93%)Total for entire Japan 1,560 1,524 (98%) 1,381 (89%) 1,318 (84%) 1,312 (84%)Number of communities 17,481 communities 7,573 communities
Number of municipalitieswilling to create "Farmers
and Farmland Plans"
Progress in preparation
Number of municipalitiesthat have almost
completed explanationsto local communities
Number of municipalitieswhere farmers in local
communities havestarted talks
Number of municipalitiesthat have opened meetings to
consider "Farmers andFarmland Plans"
Number ofmunicipalities that haveprepared "Farmers and
Farmland Plans"*
18

0
2
4
6
8
10
12
1984 1990 2000 20082010
2011
1.8 (22%)
Vegetables
Fruits
Livestock products
Others
Rice
2.1 (26%)
0.7 (9%)
2.6 (31%)
1.0 (12%)
11.5
8.2
11.7Trillion yen
8.1
3.9(34%)
2.0(17%)
0.9(8%)
3.3(28%)
1.6(14%) 9.1 8.5
566
13,041
27,796
40,311
34,521
0
10,000
20,000
30,000
40,000
50,000
2008 crop
2009 2010 2011 2012
tons
122 113 97
116
22 11 5
6 5 3 127
119 123 130
108 105 103 104
19 14 20 26 0
20
40
60
80
100
120
140
2008 2009 2010 2011
1,000 yen/10 ares
Sales income, etc.Mutual relief indemnity, subsidies, etc.
(excluding income support direct payments)Income support direct paymentsAgricultural
expenditure
Agricultural income
Agr
icul
tura
l gro
ss in
com
e
(Unit: 10,000 yen)2009 2010 2011
Total 104 122 120Rice farming 35 48 51Upland fieldfarming
217 217 231
Outdoor vegetablefarming
177 195 177
Facility-basedvegetable farming
382 441 413
Orchard farming 145 172 171Dairy farming 768 720 656Cattle farming 122 206 168Hog farming 396 658 629
Japan’s total agricultural output has trended down since 1984, standing at 8.2 trillion yen in 2011. Rice’s share of the total output has trended down, while the shares for livestock products and vegetables have followed an upward trend.
Agricultural income of farms (individual farms) in 2011 decreased by 2% from the previous year to 1.2 million yen. Among farm categories, rice farming farms boosted income by 6% thanks to rice price hikes. Meanwhile, dairy farming farms saw an income decline due to feed and fuel cost hikes.
Changes in agricultural income by farming category (individual farms)
Source: MAFF, “Statistical Survey on Farm Management – Statistics by Farming Category (individual farms)”
Changes in total agricultural output
Source: MAFF, “Agricultural Production Income Statistics”
4 Agricultural output and income trends
5 Production trends for major farm and livestock products (1) Rice
Changes in planned rice production for flour
In 2012, the rice crop condition index stood at 102 (the index was as high as 107 for Hokkaido and 103 for Tohoku while being as low as 97 in Kyushu due to sunlight shortages in June and damage inflicted by Typhoon No. 16).
The rice farming division’s agricultural gross income in 2011 increased by 7,000 yen per 10 ares or 6% from the previous year due primarily to rice price hikes. In line with this rise, agricultural income expanded by 6,000 yen per 10 ares or 30%.
Rice production for flour increased to 40,000 tons in 2011 before falling 14% from the previous year to 35,000 tons in 2012 due to slower growth in demand for rice flour products.
Changes in rice farming division’s agricultural gross income and agricultural income
Source: MAFF, “Statistical Survey on Farm Management – Statistics by Farming Category”
Source: MAFF, “Certification of Plans for New-use Rice”
19

(Unit: hectares)
2009 crops 2012 Change( )
Entire Japan 145,400 131,100 -14,300 49,949Hokkaido 24,500 27,200 2,700 1,221Mie 3,360 4,120 760 664Shiga 5,430 5,700 270 825Gifu 2,690 2,780 90 684Hyogo 2,670 2,700 30 484Akita 10,100 7,620 -2,480 2,000Miyagi 11,500 9,040 -2,460 2,497Tochigi 4,830 2,710 -2,120 4,884Yamagata 7,250 5,640 -1,610 2,266Niigata 7,140 5,630 -1,510 3,753
Planted area for soybeans
Upp
erLo
wer
Change inplanted areafor rice for newuses(2009-2012)
548 1,128
463
933
300
538
331
457
1,441
2,930
0
500
1,000
1,500
2,000
2,500
3,000
FY2007 FY2009 FY2011
hectares
Other fruitsOther citrus fruits
Apples
"Satsuma" mandarins
(Units: hectares, %)2008crops
2009 2010 2011 2012
Planted area 208,800 208,300 206,900 211,500 209,200115,700 116,300 116,300 119,200 119,200
Hokushin 103,756 96,373 72,901 545 21Kitahonami - 6,888 29,636 106,948 104,628
16,882 17,726 20,210 21,550 25,949
(8.1) (8.5) (9.8) (10.2) (12.4)
Yumechikara - - 56 159 1,214Haruyokoi 6,760 6,500 7,098 7,774 9,539Yumekaori - 4 43 251 416Chikushi W2-go - 149 566 767 880
Hokkaido
Wheat for bread andChinese noodles(share)
(3) Vegetables, fruits
Trends of accumulated area for switching to higher-quality fruit species or varieties
Source: MAFF Note: The area for switching means the area for plans approved under
the orchard management support project.
As for outdoor vegetable farming, the development and diffusion of new agricultural machines have been promoted to save costs and labor according to demand for vegetables being used for processing and commercial uses. Recently, integrated mechanized systems have been developed and commercialized progressively for spinaches, cabbages and other vegetables.
In orchard farming, it is important to enhance local fruit producers’ competitiveness and profitability through production and supply of high-quality fruits. To this end, producers have been switching to excellent species or varieties according to consumer needs. In FY2011, the accumulated area for such switching came to 2,930 hectares.
Machine commercialized for harvesting spinaches for processing in 2011
The machine harvests only the above-ground part separated from roots that are not necessary for processing. Harvesting time has been reduced to one-tenth.
Machine to be commercialized for harvesting cabbages for processing and commercial uses in 2013 The machine uses a precision system to harvest, select and adjust massive
cabbages for direct accommodation into large containers, reducing adjustment and shipment labor.
Excellent brand case (Shiranuhi (Dekopon))
(2) Wheat, soybeans Japan’s wheat-planted area in 2012 came to 209,000 hectares, of which Hokkaido accounted for 60% (119,000
hectares). The main brand in Hokkaido has shifted from Hokushin to Kitahonami, a high-quality, high-yielding variety.
Wheat for bread and Chinese noodles increased to 26,000 hectares or 12% of the total wheat-planted area. As the soybean-planted area has followed a downward trend since 2009, prefectures posting large declines have
tended to increase the planted area for rice for new uses. Meanwhile, the planted area for soybeans has increased in prefectures like Mie where local communities have been united to promote organized aggregative farming of paddy fields.
Changes in planted area for wheat
Sources: MAFF, “Crop Statistics” and MAFF surveys
Changes in planted area for soybeans since 2009
Sources: MAFF, “Crop Statistics” and MAFF surveys
20

425
353 308
269 257 249 243 257
227 219 177 110
51 42 38
0 50
100 150 200 250 300 350 400 450
2004 2006 2008 2010 2011
1,000 yen/10 ares Agricultural expenditure
Agricultural income
Agricultural gross income
4.5 5.2
7.4
11.2 11.9
0
2
4
6
8
10
12
14
2003 crops 2005 2007 2009 2011
%
(Units: hectares, %)1999 2005 2007 2009 2011
Total harvest area 13,485 12,485 12,659 12,747 12,289Mechanized harvesting area 4,091 4,392 5,146 5,553 5,999
Harvesters 3,901 4,219 4,973 5,353 5,764Other machines 191 173 173 200 235
Mechanized harvesting rate 30.3 35.2 40.7 43.6 48.8
(Units: hectares, %)1999 2005 2007 2009 2011
Total harvest area 9,327 8,749 9,378 10,283 10,326Mechanized harvesting area 4,958 5,548 7,300 8,449 9,142
Harvesters 3,274 4,959 6,366 7,879 8,647Other machines 1,684 589 934 570 495
Mechanized harvesting rate 53.2 63.4 77.8 82.2 88.5
Changes in direct seeding’s share of beet-planted area
Source: Hokkaido Prefecture, “Survey on Sugar Beet and Beet Sugar Production”
(4) Sugarcane, beet
Japan’s sugarcane crop in 2011 was poor due to typhoons, drought and pest. MAFF has implemented support for recovering production and improving productivity in accordance with regional weather conditions.
The development of integrated mechanized systems including harvesters for harvesting sugarcane has been promoted. The mechanized harvesting area’s share of the total sugarcane harvest area has increased to 89% in Kagoshima Prefecture and 49% in Okinawa Prefecture.
The introduction of direct seeding to save labor for beet production has been promoted. Direct seeding’s share of the beet-planted area has risen to 12%.
Changes in mechanized sugarcane harvest area
Source: Kagoshima and Okinawa prefectures, “Sugarcane and Raw Sugar Production results”
(Kagoshima Prefecture)
(Okinawa Prefecture)
Changes in tea farming division’s agricultural gross income and agricultural income (Tokai Region)
Source: MAFF, “Statistical Survey on Farm Management – Statistics by Farming Category”
(5) Tea, flowers Agricultural gross income for the tea farming division (Tokai Region) of the upland field farming sector in 2011
declined by 170,000 yen per 10 ares (40%) from 2004 due primarily to tea price drops. The division’s agricultural income also decreased by 140,000 yen per 10 ares (79%).
Challenges for expanding tea consumption include promoting branding of tea products, proposing new ways to enjoy tea, and backing up the promotion of research, development and diffusion of new tea uses for health food and cosmetics.
In order to expand flower consumption, MAFF has promoted measures to lengthen the lives of cut flowers through appropriate controls at production, distribution and retail stages, as well as “hanaiku” flower education to use flowers for schooling and other regional activities.
Venlo International Horticultural Exhibition 2012 (Floriade 2012) opened
From April 5 to October 7 in 2012, the “Floriade 2012” exhibition took place in Venlo, the Netherlands, under the theme of “Be a part of the theatre in nature; get closer to the quality of life.” At the exhibition, the Japanese government booth won the gold prize and a Japanese flower was commended as the most beautiful flower at Floriade 2012.
Exhibition of Japanese flowers The Shinno cymbidium won the highest score at the contest
21

455 442 421 398 360 370
385 386 379 393 388 394
840 829 801 791 747 763
91 83 74
66 62
100 96
90 85 82 79
0
200
400
600
800
1,000
1,200
1,400
0 10 20 30 40 50 60 70 80 90
100
2003 2005 2007 2009 2011 2012
Hokkaido 10,000 tons
Prefectures other than Hokkaido
Raw
milk
pro
duct
ion
(rig
ht s
cale
)
Number of livestock farm householdsIndex
3,693 3,721 3,575 3,571 3,514 3,401
91 90 90 91 93 93
0 500 1,000 1,500 2,000 2,500 3,000 3,500 4,000 4,500 5,000
80
85
90
95
100
105
110
2005 2008 2009 2010 2011 2012
10,000 hectaresPlanted (growing) area Production (right scale)
1,000 TDN tons
0
33.2 35.1 45.2 63.5 8.3
32.8 21.0 13.0 50.1
12.1 14.3 2.9
8.4 20.0 19.5 20.6
0102030405060708090
100
Fattening castrated
young cattle
Calf cattle Milk Fattening pig
Feed costs
%
Labor costs
Feeder and other livestock depreciation costs
Others
874,503 Yen per head
529,868 Yen per head
759,890 Yen per head
31,792 Yen per head
(6) Livestock products While milk and milk product consumption has firmed over recent years, raw milk production has followed a
downward trend. As beef, pork, chicken and hen egg consumption has firmed over recent years, production has leveled off.
As for dairy farming, weakening production infrastructure under a fall in the number of livestock farm households has become a matter of concern in all prefectures other than Hokkaido. It is important for regional communities to keep dairy farming operations and maintain and secure production infrastructure.
Livestock farming is structurally vulnerable to feed price hikes as feed costs account for as much as 30-60% of total production costs. Therefore, MAFF will expand the domestic production and utilization of feed and promote farming business stabilization programs meeting the characteristics of livestock categories.
Source: MAFF, “Livestock Production Costs”
Feed costs’ share of total livestock farming costs (FY2011)
Sources: MAFF, “Livestock Farming Statistics” and “Milk and Milk Products Statistics”
Note: The number of livestock farm households is represented by the index (100 for 2003).
Changes in the number of milk cow farm households and raw milk production
FY2005 FY2012
437 605
FY2005 FY2012
49 109
The planted area for feed and forage crops has increased to 930,000 hectares thanks to the development of grassland infrastructure, the introduction of excellent varieties and the effective utilization of paddy fields.
Production in 2012 declined to 3.4 million TDN* tons due to a yield fall caused by weather factors and the abandonment of some crops triggered by the nuclear power station accident. *TDN means total digestible nutrients for livestock.
Given grain price hikes, MAFF has supported the fostering of feed and forage crop production organizations (including contractors) and the development of TMR (total mixed rations) centers in order to expand domestic roughage production, and improve the efficiency and reduce costs for feed crop production and adjustment. The number of contractors has increased to 605 and that of TMR centers to 109.
(7) Feed and forage crops, etc.
Changes in the planted (growing) area and production for feed and forages crops
Changes in the numbers of contractors and TMR centers
(Number of TMR centers)
(Number of contractors)
Source: MAFF Note: Contractors are organizations that produce feed and forage crops under
contract. The TMR center is a facility that mixes roughage and concentrated feed in a well-balanced manner for supply to farming households. Source: MAFF, “Statistics on Cultivated Area and Planted Area”
and MAFF surveys
22

73.2
70.6
11.1
12.0
12.8
13.4
3.0
1.7
2.2
0 20 40 60 80 100
FY2006
FY2011
Less than 50 m. yen100-300 m. yen
300-500 m. yen
More than 500 m. yen
%
50-100 m. yenMore than 300 m. yen
Farm restaurants: 26.3 b. yen (1.6%)
Farm stands: 102.9 b. yen (6.3%)
Tourist farms: 37.6 b. yen (2.3%)
Farms: 437.0 b. yen (26.7%)
Total annual sales:
1,636.8 b. yen
Agricultural processing places: 270.2 b. yen (16.5%)
Farm stands (agricultural
cooperatives, etc.): 689.9 b. yen (42.1%)
Processing of agricultural products
(agricultural cooperatives, etc.): 510 b. yen (31.2%)
(Units: 100 m. yen, %)
2011 2012 Change
4,511 4,497 -0.3
2,652 2,680 1.1Processed food products 1,253 1,305 4.1Livestock products 309 295 -4.4Grains, etc. 187 196 4.8Vegetables, fruits, etc. 155 133 -13.8Others 748 751 0.3
123 118 -3.91,736 1,698 -2.2
Fisheries products (excludingprepared products) 1,210 1,196 -1.1
Prepared fisheries products 526 502 -4.7
Forestry products
Fisheries products
Agricultural products
Agriculture-forestry-fisheriesproducts
2,038 2,168 2,359 2,678 2,883 2,637 2,865 2,652 2,680
88 92 90 104 118
93 106 123 118 1,482 1,748
2,040 2,378 2,077
1,724 1,950
1,736 1,698
0
1,000
2,000
3,000
4,000
5,000
6,000
2004 2005 2006 2007 2008 2009 2010 2011 2012
Agricultural products
Forestry products Fishery products100 million yen
3,6094,008
4,4905,160 5,078
4,4544,920
4,511 4,497
6 Promoting greater value added for agriculture
[Brand Strategy of “TSUYAHIME”] In 2011, “Tsuyahime” was registered as a plant variety for protection. A trademark for the Tsuyahime package design was also registered. In China, Hong Kong and Taiwan as well, “ “ and “TSUYAHIME” brands and their symbol marks were registered as trademarks . Certified producers produce “Tsuyahime” according to the fixed cultivation standards. Only output meeting shipment standards can be shipped. Private seed production is banned.
Total sales at businesses related to agricultural production in FY2011 came to 1,636.8 billion yen, of which agricultural products sales and processing by agricultural cooperatives and the like accounted for 1,199.8 billion yen or 73%.
Farm stands with sales at 100 million yen or more in FY2011 accounted for 17% of overall farm stands. Moves to protect intellectual property rights for agricultural products under long-term brand strategies are seen,
including the integrated management of plant breeders’ rights, trademarks and quality.
Annual sales at businesses related to agricultural production (FY2011)
Source: MAFF, “Comprehensive Survey on Turning Farming and Rural Areas into a Sixth Industry”
Trends of farm stand sales by annual sales size
(1) Efforts for increased value added for agriculture
Source: MAFF, “Fact-finding Survey on Local Consumption of Local Agricultural Produce” (custom-ordered tabulation)
Note: Farm stands are permanent shops operated by farms or agricultural cooperatives on a full-year basis.
Exports had followed an upward trend for some years before falling substantially due to the yen’s appreciation and the March 2011 nuclear power station accident.
In 2012, exports decreased slightly from the previous year to 449.7 billion yen. Overall agricultural products exports increased slightly despite falls in vegetable, fruit and livestock products exports.
(2) Trends of agriculture-forestry-fisheries and food products exports
Trends of exports by product category
Source: Prepared by MAFF, based on MOF, “Trade Statistics”
Trends of agriculture-forestry-fisheries and food products exports
Source: Prepared by MAFF, based on MOF, “Trade Statistics”
23

Expectations on the development of rice varieties invulnerable to global warming
Suppression of alpha-amylase genes can reduce chalky rice grain emerging under high temperatures in the ripening period.
(Mechanism for chalky rice grain emerging under high temperatures)Normal temperatures
Sound grainStarch-synthesizing enzyme
Nutrient source (sugar)
Sound starch accumulation
Leaf photosynthesis
High temperatures
Starch-synthesizing enzyme ↓
Leaf photosynthesis
Nutrient source (sugar)
Short starch accumulation
Alpha-amylase enzyme resolves starch ↑
0.1
757
1,964 2,116 2,163
0
500
1,000
1,500
2,000
2,500
2000 2005 2010 2011 2012
Hokkaido
Tohoku
Kanto
Hokuriku
TokaiKinkiChugoku/ShikokuKyushu
Okinawa
Unit: 100 cases (Unit: hectares)
PaddiesUplandfields
Others
2009 8,506 2,902 5,596 9 4,628
2010 9,084 2,998 6,076 10 4,609
2011 9,401 3,214 6,169 17 4,593
2012 9,495 3,148 6,331 16 4,561
Total Domesticcultivated land
area (1,000hectares)
8 Promoting agricultural production giving priority to environmental conservation
The number of people certified in 2012 as eco-farmers who try to reduce chemical fertilizer and agrichemical consumption increased by 5,000 from the previous year to 216,000.
The certified field area under the Certification system for the Organic JAS standards increased in 2012 despite a decline in the domestic cultivated land area.
Source: MAFF Note: Numbers given for the end of March in each year
Trends of the certified field area under the Certification system for the Organic JAS standards
Source: MAFF, “Statistics on Cultivated Area and Planted Area” and MAFF surveys
Note: The certified field area under the Certification system for Organic JAS standards is for April 1 each year. The domestic cultivated land area is for July 15 in the previous year of each year. “Others” include mushroom production fields.
Trends of certified eco-farmers (by region)
7 Promoting research and technology development
The mechanism where chalky rice grain emerges under high temperatures in the ripening period has been figured out. In the future, development of rice varieties that resist qualitative deterioration even under high temperatures is expected.
It has been found out that women with high beta-cryptoxanthin content in their blood* have less osteoporosis risks than those with low content. Satsuma mandarins are rich with beta-cryptoxanthin. *Women after menopause.
Source: Prepared by MAFF based on data from the National Agriculture and Food Research Organization
Research for developing rice varieties invulnerable to high temperatures
Relations between beta-cryptoxanthin content in blood and osteoporosis risks
Source: Prepared by MAFF based on data from the National Agriculture and Food Research Organization
Note: The graph indicates osteoporosis risks for women after menopause. The vertical line in the graph represents a scope where osteoporosis risks emerge with a probability of 95%.
The osteoporosis risk for a group with high beta-cryptoxanthin content levels in blood is 0.08 against 1.0 for a group with low levels, meaning the risk for the high beta-cryptoxanthin content group is 92% lower.
Chalky rice grain
0.0
1.0
2.0
3.0
Low Middle High3 or fewer fruits per
week
1 to 3 fruits
per day
4 or more fruits per
day
*
Beta-cryptoxanthin content levels in blood and Satsuma mandarin intake frequency
Ost
eopo
rosi
s ris
ks
24

741 725 723
9,579 9,694 9,834
4.2 4.2 4.2
2.1 2.0 2.1
Number ofcooperatives
Number ofcooperativemembers
Sales
Production materialturnover
(Units: cooperatives, 1,000 persons, 1 trillion yen)
FY2009 FY2010 FY2011
Changes in (general) agricultural cooperatives
Source: MAFF, “Comprehensive Agricultural Cooperative Statistics”
Notes: 1) The number of cooperatives is the aggregate number of cooperatives in “Comprehensive Agricultural Cooperative Statistics.”
2) Sales and production material turnover represent a total for all general agricultural cooperatives.
Agricultural cooperatives’ largest mission is to increase agricultural income through appropriate sales of agricultural products and provision of production materials.
Some agricultural cooperatives have proactively tackled economic projects and achieved greater income for farm households.
9 Agriculture-related organizations supporting agriculture
Cases for agricultural cooperatives’ efforts to increase farm income
(1) Developing beverage products in cooperation with industrial and academic sectors and purchase beverage materials at high prices
The JA Himi agricultural cooperative in Toyama Prefecture has founded a subsidiary that purchases, roasts and processes Hatomugi barley as a crop on diverted land from farms. It has commercialized the processed barley as Hatomugi Tea with value added. The subsidiary has also commercialized a beauty drink made mainly from the Hatomugi extract that it has developed (obtained a patent on) in cooperation with Kanazawa University. Through these efforts, the subsidiary can purchase Hatomugi barley from farmers at prices that are two times higher than market levels.
(2) Comprehensive mandarin orange sales strategy The JA Mikkabi agricultural cooperative in Shizuoka Prefecture processes substandard mandarin oranges into paste and syrup as materials for products of Suntory Holdings Ltd. and Yamazaki Baking Co., LTD to publicize the Mikkabi brand and secure income for orange farmers. It also highly processes substandard mandarin oranges into paste and syrup to secure income for their producers, boosting value added by four to seven times from the level for simple processing (into juice).
25

(Unit: %)1995 2000 2005 20106.9 10.3 12.7 13.73.3 4.6 5.4 6.07.5 10.7 12.9 14.18.4 12.4 14.6 15.8Mountainous farming areas
Flat farming areasUrban areas
Hilly farming areas
(Unit: 10,000 hectares)1995 2000 2005 2010
24.4 34.3 38.6 39.6Area of abandonedcultivated land
(Unit: %)
TotalAgriculture-
forestry -fisheries
Construction Manufacturing Services
Urban areas -3 -23 -27 -21 3Flat farming areas -8 -25 -30 -18 8Hilly farming areas -13 -27 -35 -21 2Mountainous farming areas -20 -27 -42 -29 -6
(Unit: %)
TotalAgriculture-
forestry -fisheries
Construction Manufacturing Services Others
Urban areas 100 1.4 7.1 15.4 44.5 31.6Flat farming areas 100 13.2 8.4 19.9 35.5 22.9Hilly farming areas 100 12.8 9.0 18.2 38.4 21.6Mountainous farming areas 100 14.7 10.1 16.6 38.7 19.9
(Units: 10,000 persons, %)2000 Change (%)
Urban areas 9,759 10,077 (78.7) 318 ( 3.3 )Flat farming areas 1,306 1,260 (9.8) -46 ( -3.5 )Hilly farming areas 1,177 1,086 (8.5) -91 ( -7.7 )Mountainous farming areas 451 384 (3.0) -67 ( -14.9 )
Total 12,693 12,806 (100.0) 113 ( 0.9 )
2010
Chapter 4 Utilizing local resources to promote and invigorate rural areas
The abandoned cultivated land area stood at 396,000 hectares. Over recent years, the expansion has slowed down (the expansion by farming area category has shown a similar trend).
Abandoned cultivated land’s share of total cultivated land in 2010 was as high as 15.8% for mountainous farming areas, 14.1% for hilly farming areas and 13.7% for urban areas.
As central and local governments were united to reduce abandoned cultivated land, 12,000 hectares in abandoned cultivated land was revitalized for utilization in 2011.
Source: MAFF, “Census of Agriculture and Forestry” (custom-ordered tabulation) Note: Abandoned cultivated land area share = Abandoned cultivated land
area / (Cultivated land area under management + Abandoned cultivated land area) x 100
Major measures for eliminating abandoned cultivated land
Support for revitalizing and utilizing devastated farmlands
Measures against idle farmlands under the revised Agricultural Land Act
Subsidies for emergency measures for revitalizing and utilizing abandoned cultivated land support efforts for revitalizing and utilizing devastated farmlands and developing necessary facilities.
The agricultural committee annually surveys farmland utilization conditions and instructs owners of idle farmlands to cultivate these farmlands on their own or lease them to others.
Source: MAFF
(2) Present conditions of abandoned cultivated land and efforts to eliminate such land
Changes in area of abandoned cultivated land
Source: MAFF, “Census of Agriculture and Forestry”
Changes in abandoned cultivated land’s shares by farming area category
1 Present rural area situation and challenges facing rural areas (1) Present rural area conditions
In 2010, 80% of Japan’s population was concentrated in urban areas. Urban population in 2010 increased by 3% from 2000. In contrast, population declined by 4% in flat farming areas, by 8% in hilly farming areas and by 15% in mountainous faming areas.
Rural areas feature higher working population shares for agriculture-forestry-fisheries, construction and manufacturing industries than urban regions. These industries occupy key positions in rural economies and employment.
Changes in employed persons from 2000 to 2010 indicate that agriculture-forestry-fisheries workers in hilly and mountainous farming areas declined along with their part-time work opportunities (in construction and manufacturing industries).
Source: Prepared by MAFF based on “Population Census” by MIC
Source: Prepared by MAFF based on “Population Census” by MIC
Changes in employed person by farming area category from 2000 to 2010
Source: Prepared by MAFF based on “Population Census” by MIC Note: The services industry includes wholesale, retail and real estate sectors.
Employed person shares by farming area category (2010)
Changes in population by farming area category
(Unit: hectares)2010 2011
Area for agricultural committeeinstructions
6,443 21,620
(Unit: hectares)FY2009 FY2010 FY2011
Eliminated through subsidies 1,040 1,136 1,180
(Unit: hectares)FY2009 FY2010 FY2011
Eliminated area 6,111 9,685 12,153
26

0
50
100
150
200
250
FY2007 FY2008 FY2009 FY2010 FY2011
199
Unit: 100 million
226
185213
239Other birds
Other beastsCrows
Monkeys
Deer
Wild boars
Birds
Beasts
40
724
933
1,1281,195
0 33 58 87
418 521
0
200
400
600
800
1,000
1,200
April 2008
April 2009
March 2010
April 2011
April 2012
October 2012
Municipalities
Number of municipalities having prepared damage
prevention plans
Number of municipalities
having established teams for
implementing measures to
prevent damage by wild animals
Agriculture and rural areas have various roles including not only food supply but also national land conservation, water recharging, biodiversity conservation, good landscape formation and cultural succession. The entire people including local residents have benefitted from these roles.
Various efforts have been taken to demonstrate agriculture’s multifunctional roles such as the prevention of flooding, the conservation of biodiversity, the formation of good landscapes and the promotion of health and rest through the utilization of paddy fields and upland fields.
2 Demonstrating multifunctional roles of agriculture (1) Multifunctional roles of agriculture and rural areas
[Specific cases] Utilizing paddy fields’ water storage function to help prevent flooding Niigata Prefecture has implemented a project to utilize paddy fields’ water storage function to reduce flooding (paddy dam). Specifically, drainage adjustors are installed at drain outlets of paddy fields to store rainfall at paddy fields upon torrential rain to moderate water flow into channels and prevent a rapid rise in water levels in downstream areas.
Recycling resources to contribute to local environmental conservation Takayama village of Nagano Prefecture has promoted a resources-recycling agriculture project to turn local garbage, sawn wood at mushroom producers and livestock manure into compost for local farmlands including orchards. The project has solved the garbage treatment problem that had grown more serious due to an increase in non-farm households, improved soil drainage and water storage capacity, and maintained and raised soil capabilities with angleworms and other living things increasing. The village has also taken advantage of apple farming giving considerations to environmental conservation to promote its brand. Managing plum tree gardens to help form good landscapes Nanaore-Ume Kumiai, a cooperative corporation of agricultural producers, in Ehime Prefecture has leased abandoned cultivated land to grow ornamental Japanese plum trees and develop walking paths in order to reduce abandoned cultivated land and create a beautiful village. It has also opened the Japanese plum tree garden for festivals, contributing to creating a good landscape.
Effects of paddy dam
(3) Present conditions of and measures against damage by wild animals
Changes in crop damage by wild animals
Crop damage by wild animals in FY2011 declined by 1.3 billion yen from the previous year to 22.6 billion yen. But damage by deer increased by 500 million yen from the previous year to 8.3 billion yen.
The number of municipalities tackling the prevention of damage by wild animals has steadily increased. The number of municipalities having prepared damage prevention plans under the “Act on special measures for the prevention of damage due to wildlife” has increased to 1,195. But the number of those having established teams for implementing measures to prevent damage by wild animals is limited to 521, indicating that damage prevention efforts should be enhanced further.
Comprehensive, efficient regional measures under damage prevention plans have been promoted, including the capture of wild animals, the installation of invasion-preventing fences and the establishment of buffer zones.
Preparation of damage prevention plans and establishment of damage prevention measure implementation teams
Source: MAFF
Source: MAFF
Time
A water flow peakcan be lowered
Water flowCase for absence of
paddy dam
Case for presence of paddy dam
A water flow peak can be delayed
27

777 795 813844 848
745
886
1,492
2,006
1,300
1,500
1,700
1,900
2,100
600
700
800
900
FY2005 FY2006 FY2007 FY2008 FY2009 FY2010 FY2011
Number of farms running guest houses (right scale)
10,000 persons Farms
Number of guests
0 0
28,708 28,757 28,765
26,93727,570
66.5 66.4 66.4 66.2 67.8
40
60
80
100
20,000
22,000
24,000
26,000
28,000
30,000
FY2007 FY2008 FY2009 FY2010 FY2011
Agreements
Number of agreements
0
Total area covered by the direct payment (right scale)
10,000 hectares
0
17,122
18,97319,514 19,658 19,677
116.0
136.1142.5 143.3 143.0
100
110
120
130
140
150
160
15,000
16,000
17,000
18,000
19,000
20,000
FY2007 FY2008 FY2009 FY2010 FY2011
10,000 hectaresOrganizations
0 0
Number of community-based organizations
Total targeted area of community-based organizations (right scale)
Farming areacategory
Organization Location Outline of specific measures
Flat farming areasFarm stand"Hotaru-no-Sato"
Ogi city,Saga Pref.
The organization has opened farm stands as the core for village building efforts. It hasalso opened temporary sales shops for events and promoted food and agricultureeducation for children and their parents. It has established farm guest houses and farmrestaurants as well.
Hilly farmingareas
AgriculturalcorporationAkitsuno
Tanabecity,
WakayamaPref.
Local farmers and other people invested to found the agricultural corporation Akitsunothat runs a farm restaurant, accommodation facilities and citizen farms with some 30local women. The corporation also provides mandarin orange orchard ownership, andfarming and processing experiences.
Mountainousfarming areas
Minami ShinshuKanko Kosha
Iida city,NaganoPref.
The company has attracted school trips to Iida city, commercializing farmingexperiences as a tourism service. Farm guest houses under its program have no unifiedmenus and provide their own vegetable products, allowing tourists to enjoy real farmingfamily experiences.
For green tourism (where tourists stay in rural areas for leisure activities), various imaginative efforts have been implemented in line with local conditions.
The number of farms running guest houses increased from 1,492 in 2005 to 2,006 in 2010. The number of tourists lodging at farm guest houses has been increasing, standing at 8.86 million in FY2011.
3 Utilizing local resources to promote rural areas (1) Harmonious coexistence and interactions between urban and rural areas
Changes in the numbers of guest staying at green tourism facilities and farms running guest houses
Source: MAFF, “Census of Agriculture and Forestry” and MAFF surveys
Notes: 1) The number of guests in FY2010 excludes those in Iwate, Miyagi and Fukushima prefectures.
2) The number of farms running guest houses is as of February 1 for each year.
Green tourism cases
Payment for conserving farmland and water has been provided to conserve and manage farmlands and farming water resources and improve the rural environment (community-collaborative support) and to encourage local communities to implement repair and renewal operations to lengthen the service lives of terminal irrigation canals and farm roads (improvement support). Over recent years, some 20,000 organizations have implemented community-collaborative support on a total area of 1.43 million hectares.
The direct payment to farmers in the hilly and mountainous areas has been introduced for various measures such as slope management and planting of landscape-improving crops to maintain agricultural production and secure multifunctional roles mainly in hilly and mountainous areas. The system was expanded in FY2011 to cover flat farming areas of isolated islands and other disadvantaged areas, boosting the number of relevant agreements and the system-covered area.
(2) Conserving local resources and environment and enhancing local communities
Source: MAFF
Implementation of the payment for conserving farmland and water (community-collaborative support )
Source: MAFF
Changes in the number of agreements and the total area covered by the direct payment to farmers in the hilly
and mountainous areas
28
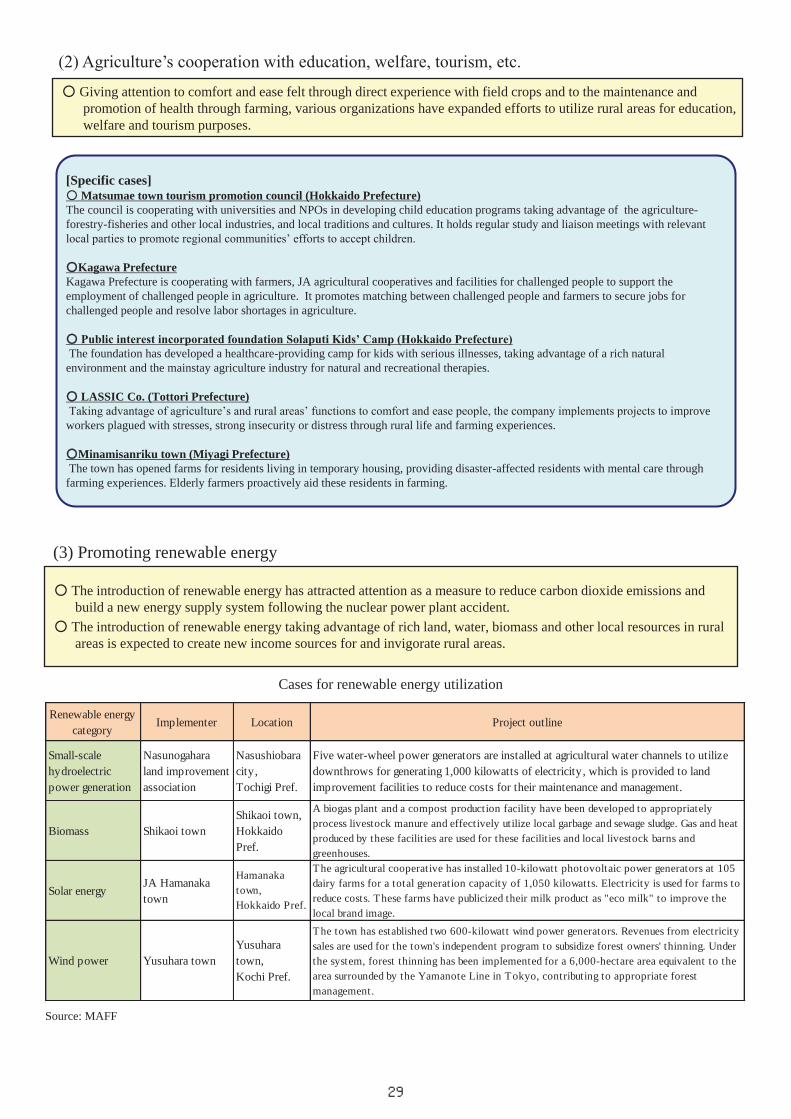
Renewable energycategory
Implementer Location Project outline
Small-scalehydroelectricpower generation
Nasunogaharaland improvementassociation
Nasushiobaracity,Tochigi Pref.
Five water-wheel power generators are installed at agricultural water channels to utilizedownthrows for generating 1,000 kilowatts of electricity, which is provided to landimprovement facilities to reduce costs for their maintenance and management.
Biomass Shikaoi townShikaoi town,HokkaidoPref.
A biogas plant and a compost production facility have been developed to appropriatelyprocess livestock manure and effectively utilize local garbage and sewage sludge. Gas and heatproduced by these facilities are used for these facilities and local livestock barns andgreenhouses.
Solar energyJA Hamanakatown
Hamanakatown,Hokkaido Pref.
The agricultural cooperative has installed 10-kilowatt photovoltaic power generators at 105dairy farms for a total generation capacity of 1,050 kilowatts. Electricity is used for farms toreduce costs. These farms have publicized their milk product as "eco milk" to improve thelocal brand image.
Wind power Yusuhara townYusuharatown,Kochi Pref.
The town has established two 600-kilowatt wind power generators. Revenues from electricitysales are used for the town's independent program to subsidize forest owners' thinning. Underthe system, forest thinning has been implemented for a 6,000-hectare area equivalent to thearea surrounded by the Yamanote Line in Tokyo, contributing to appropriate forestmanagement.
(2) Agriculture’s cooperation with education, welfare, tourism, etc.
Giving attention to comfort and ease felt through direct experience with field crops and to the maintenance and promotion of health through farming, various organizations have expanded efforts to utilize rural areas for education, welfare and tourism purposes.
[Specific cases] Matsumae town tourism promotion council (Hokkaido Prefecture)
The council is cooperating with universities and NPOs in developing child education programs taking advantage of the agriculture-forestry-fisheries and other local industries, and local traditions and cultures. It holds regular study and liaison meetings with relevant local parties to promote regional communities’ efforts to accept children.
Kagawa Prefecture Kagawa Prefecture is cooperating with farmers, JA agricultural cooperatives and facilities for challenged people to support the employment of challenged people in agriculture. It promotes matching between challenged people and farmers to secure jobs for challenged people and resolve labor shortages in agriculture.
Public interest incorporated foundation Solaputi Kids’ Camp (Hokkaido Prefecture)
The foundation has developed a healthcare-providing camp for kids with serious illnesses, taking advantage of a rich natural environment and the mainstay agriculture industry for natural and recreational therapies.
LASSIC Co. (Tottori Prefecture)
Taking advantage of agriculture’s and rural areas’ functions to comfort and ease people, the company implements projects to improve workers plagued with stresses, strong insecurity or distress through rural life and farming experiences.
Minamisanriku town (Miyagi Prefecture)
The town has opened farms for residents living in temporary housing, providing disaster-affected residents with mental care through farming experiences. Elderly farmers proactively aid these residents in farming.
The introduction of renewable energy has attracted attention as a measure to reduce carbon dioxide emissions and build a new energy supply system following the nuclear power plant accident.
The introduction of renewable energy taking advantage of rich land, water, biomass and other local resources in rural areas is expected to create new income sources for and invigorate rural areas.
Cases for renewable energy utilization
(3) Promoting renewable energy
Source: MAFF
29

3,968
2,676 2,9043,124 3,273
3,596
0
1,000
2,000
3,000
4,000
FY2001 FY2003 FY2005 FY2007 FY2009 FY2011
Locations Urban areasNon-urban areas
The number of allotment gardens in Japan has increased mainly in urban areas over recent years, expanding about by 1.5-fold from 2,676 in FY2001 to 3,968 in FY2011.
Urban residents are growingly willing to enjoy farming-based lives. Calls are growing for maintaining and utilizing urban farmlands for the purpose of reducing damage from natural disasters including earthquakes and floods. Under the circumstances, relevant parties in urban and suburban areas are trying to develop farming-based lives.
4 Conserving and promoting urban agriculture
Changes in the number of allotment gardens
Source: MAFF Note: The number at the end of each fiscal year of allotment gardens established
under the Act on Special Provision of the Farmland Act, etc. in Relation to Lease of Specified Farmland and the Act on the Promotion for Development of Private Farmland for Community Use.
Conserving paddy fields with excellent flood control functions
Promoting Shokuiku food education through pupils’ farming experiences
A farm for elderly welfare
A school farm using existing facilities
Developing allotment gardens for citizens’ farming and employment of challenged people
Developing a well for water supply and disaster reduction purposes
Efforts to develop farming-based lives
30

Summary Policy background, policy priorities, fiscal measures, legislative actions, tax measures, monetary measures, policy assessment I The Great East Japan Earthquake measures
• Measures for full-scale reconstruction of agriculture and rural areas • Restoration and development of farmlands and other production infrastructure • Continuation and reconstruction of farming • Restoration of production means using subsidies for agricultural production measures in response to
the Great East Japan Earthquake • Introduction of renewable energy • Measures for rural areas • Measures for the Accidents of the Fukushima Daiichi Nuclear Plant of Tokyo Electric Power
Company • Reconstruction Grant in response to the Great East Japan Earthquake
II Measures to increase the food self-sufficiency ratio
• Efforts to increase the food self-sufficiency ratio • Measures to achieve the target volumes for individual major products
III Measures to achieve stable supply of food
• Ensuring food safety and consumer confidence • Promoting Shokuiku (food education), local consumption of local produce, etc. • Sustainable development of food industry • Establishing comprehensive food security • Tackling international negotiations
IV Measures for sustainable development of agriculture
• Aggressive agriculture development • Developing and conserving agricultural production infrastructure, etc. to enhance competiveness and
national infrastructure resilience • Implementing comprehensive measures for business farmers and farmlands • Securing fine farmland and promoting its effective use • Promoting measures to increase value added for agriculture • Implementing farming income stabilization measures • Implementing production promotion measures • Compensating for damage from agricultural disasters • Promoting farming safety measures • Promoting efforts to support sustainable agricultural production
V Measures to support rural areas
• Measures to maintain and improve agriculture’s multifunctional roles • Expanding the introduction of renewable energy utilizing local resources • Harmonious coexistence and interaction between urban and rural areas • Conserving and promoting urban agriculture • Conservation of rural community functions, local environments and resources
VI Measures applying comprehensively to food, agriculture and rural areas VII Measures for the reorganization of relevant organizations VIII Items necessary to comprehensively and methodically promote policies related to food, agriculture
and rural areas
Summary of FY2013 Measures for Food, Agriculture and Rural Areas
31

[Definitions] 1. Basic statistical terminology
(1) Classification of farm households (definitions used since the 1990 World Census of Agriculture and Forestry) Terminology Definition Farm household Household engaged in farming and managing cultivated land of 10 ares or more, or earning
more than 150,000 yen per year from sales of agricultural products. Commercial farm
household Farm household managing cultivated land of 30 ares or more, or earning more than 500,000 yen per year from sales of agricultural products.
Business farm household
Farm household whose main source of income (50% or more) is farming, and which possess at least one family member under the age of 65 who is engaged in self-employed farming for more than 60 days a year.
Semi-business farm household
Farm household whose main income (50% or more) is from sources other than agriculture and which possess at least one family member under the age of 65 who is engaged in self-employed farming for more than 60 days a year.
Side-business farm household
Farm household without any members under the age of 65 engaged in self-employed farming for more than 60 days a year (farm households other than business and semi-business farm households).
Non-commercial farm household
A farm household managing cultivated land of less than 30 ares, and earning less than 500,000 yen per year from sales of agricultural products
Agricultural holding other than farm household
A holding other than farm household managing cultivated land of 10 ares or more, or earning 150,000 yen or more per year from sales of agricultural products.
Agricultural service enterprise
An enterprise conducting farm work on contract (including enterprise other than agricultural holding, specializing in production and sale of seedlings).
Land tenure non-farm households
A household other than a farm household possessing 5 ares or more in cultivated land and abandoned cultivated land.
(2) Classification of agriculture management entities (definitions used since the 2005 Census of Agriculture and Forestry) Terminology Definition Agriculture management entities*
An establishment that either performs agricultural production directly or on contract and fulfills one of the following conditions: (1) manages 30 ares or more cultivated land, (2) possesses a planted area or cultivated area or a number of livestock being raised or delivered that is equal to or greater than a predetermined standard (e.g. 15 ares for outdoor grown vegetables, 350 square meters for vegetables grown in facilities, one cow), (3) accepts farm work on contract. (Censuses from 1990 to 2000 regard agriculture management entities as the combination of commercial farm households, agricultural holdings other than a farm household, and agricultural service enterprises.)
Family management entities
Individual management entities (farm household) or a single-household corporation (a farm household that is incorporated).
Individual management entities
Agriculture management entities that operates as a household. This category excludes single-household corporations.
Corporation management entities
Agriculture management entities that has been incorporated. This category includes single-household corporations.
*“Agriculture management entities” is described as “Farms” in this annual report.
32

(3) Farm household economics Terminology Definition Total income Agricultural income + Income from agriculture-related production + Nonagricultural income +
Income from pensions, etc. Agriculture income Gross agricultural income (total income from farming) – Agricultural expenditures (all
expenses necessary for farming) Income from agriculture-related production
Earnings from agriculture-related production (earnings from businesses such as agricultural processing, country inns, restaurants and tourist farms, which are related to agriculture and managed by individuals engaged in farming) - Expenditures from agriculture-related production (expenditures such as labor and material costs required for the aforementioned businesses)
Non-agriculture income
Non-agriculture earnings (e.g. earnings from independent part-time nonagricultural businesses, salaries and wages) - Non-agriculture expenses (e.g. expenses for independent part-time non-agricultural businesses, transportation expenses for commuting)
Production cost The production cost is the total cost (combining property and labor costs) for production of farm products minus by-product values
Material cost The material cost combines liquid goods costs (seeding, fertilizers, agricultural chemicals, heating, lighting, power and other materials costs) and depreciation costs for fixed goods (depreciable assets including buildings, automobiles, agricultural machines and production management equipment).
Land rent The land rent for a crop subject to the survey is calculated by multiplying the actually paid farm rent by the contribution rate for the relevant crop.
Interest payment Interest payments are classified by use of underlying loans and multiplied by a contribution rate for a crop subject to the survey to calculate the borrowed capital interest to be shouldered by the crop.
Family labor cost The family labor cost is calculated by multiplying family working hours by an average hourly wage for men and women (paid actually irrespective of sex in a relevant region) as computed based on wage data for business establishments with 5 to 29 workers in construction, manufacturing and transportation/postal industries in the Monthly Labor Survey Report (by the Ministry of Health, Labor and Welfare).
Employed labor cost The employed labor cost represents wages paid to workers employed on an annual, seasonal or daily basis for producing farm products. Boarding and material compensations are assessed based on market prices. The cost includes rewards paid separately from wages.
Equity capital interest
The equity capital interest is calculated by multiplying equity capital – gross capital minus debt capital – by an annual interest rate of 4%.
Rent for owned land The rent for owned land is based on a rent for similar farmlands (having capabilities similar to the farmland for a crop subject to the survey) within the same region.
33

Relationship between agricultural expenditures and production cost
The Statistics on Management by Type of Farming
Family labor cost
Employed labor cost
The Statistics on Production Cost
Farming management
cost
Rent for owned land Equity capital interest
Labo
r cos
t
Payment interest Land rent
Material cost
Self-supporting
Prod
uctio
n co
st c
ount
ed in
pa
ymen
t int
eres
t/lan
d re
nt
Shipment cost, Packaging/packing cost and Administration and management cost, etc.
Farming management cost
Prod
uctio
n co
st
Prod
uctio
n co
st c
ount
ed in
ca
pita
l int
eres
t/lan
d re
nt
Note: Actually, by-product values are deducted from “production cost,” “production cost counted in payment interest /land rent” and “production cost counted in capital interest/land rent.”
34

(4) Agricultural labor by farm household members Labor status Household member
Engaged only in
self-employed farming
Engaged in both self-employed farming
and other work
Engaged in other
work only
Not engaged in any work
As a rule, people who live and earn a living together
(1) Core persons engaged mainly in farming
Among household members involved in self-employed farming (population engaged mainly in farming), those who are working mainly in agriculture during regular hours.
(2) Population mainly engaged in farming Persons engaged only in self-employed farming, or persons who are also engaged in work other than farming but spend more time engaged in farming on a yearly basis.
(3) Household engaged in own farming Household members 15 years old and over who are engaged in self-employed farming for more than one day per year.
- Full-time farmers Among persons engaged mainly in farming, those who are engaged in self-employed farming for more than 150 days per year.
Mainly self-employed
farming
Mainly other work
Stat
us d
urin
g re
gula
r hou
rs
Enga
ged
mai
nly
in w
ork
Enga
ged
mai
nly
in h
ouse
wor
k an
d ch
ild re
arin
g O
ther
(5) New farmers (definition used in the survey on Newcomers in Agriculture) Type of involvement in farming New farmers
Defined as individuals who fulfill one of the following conditions: (1) New self-employed farmers
Members of farm households whose living status has changed anytime within a year of the survey date from “student” or “employed in other work” to “new graduate who has become a farmer” or “a new farmer who changed occupations”.
(2) New employed farmers Persons engaged in farming who have been hired by corporations anytime within a year of the survey date and work for their employers for 7 months a year or more.
(3) New entries Persons who have started farming anytime within a year of the survey date by securing land and funds on their own.
- Entrants to farming soon after graduation from school
Self-employed farmers who have changed their status from “student” to “engaged mainly in farming”, as well as employed farmers who were recently students.
Self-employed farming
Employed fulltime by corporations, etc.
Just entering farming
Stat
us b
efor
e fa
rmin
g
Stud
ent
Empl
oyed
in o
ther
wor
k
New self-employed
farmers
New employed farmers
New entries
Entrants to farming soon after graduation from school
(1) (2) (3)
Core persons engaged mainly in
farming
Population mainly engaged in farming
Hou
seho
ld e
ngag
ed in
ow
n fa
rmin
g (1)
(2) (3)
35

(6) Classification of agriculture area Terminology Definition Classification of agriculture area
Classification of former cities, wards, towns, and villages (hereinafter referred to as “municipalities”) based on fundamental conditions (e.g. the rate of cultivated land or forest land and grazing land area, gradient of farmland) that define the structure of agriculture area.
Category Standard index (fulfills one of the following conditions) Urban area - Former municipalities where the rate of DID is 5% or more of habitable land, and which have
either a population density of 500 or more or have a DID population of 20,000 or more. - Former municipalities where the rate of residential area is 60% or more of habitable land, and
which have a population density of 500 or more. Regions where the rate of forest land and grazing land are 80% or more of the total area are excluded.
Flat farming area - Former municipalities where the rate of cultivated land accounts for 20% or more of the total area and the rate of forest land and grazing land account for less than 50% of the total area. However, areas where the total area of all paddy fields with gradients of 1/20 or more and upland fields with gradients of 8° or more account for 90% or more of the total area are excluded.
- Former municipalities where the rate of cultivated land accounts for 20% or more of the total area and the rate of forest land and grazing land account for 50% or more of the total area, and where the total area of all paddy fields with gradients of 1/20 or more and upland fields with gradients of 8° or more account for less than 10% of the total area.
Hilly farming area - Former municipalities other than urban and flat farming area where the rate of cultivated land is less than 20% of the total area.
- Former municipalities other than urban and flat farming area where the rate of cultivated land is 20% or more of the total area.
Mountainous farming area
- Former municipalities where the rate of forest land and grazing land is 80% or more and the rate of cultivated land is less than 10% of the total area.
Notes: 1) Order of priority: Urban area → Mountainous farming area →Flat and hilly farming area 2) As a rule, DID (Densely Inhabited Districts) are defined as areas where basic district units, as defined by the national
census, with populations densities of 4,000 per km2 or more are adjacent to each other and the total population of these conjoined districts is 5,000 or more.
3) Gradient refers not to the gradient of cultivated land per parcel, but to the main topographical gradient as grouped land. 4) The combination of the hilly and mountainous farming area categories is referred to as hilly and mountainous area. 5) Former municipalities are those that were classified as of February 1, 1950. 6) Classification of agricultural area for aggregate calculation were revised in September 1995 for 1995 data, in November
2001 for 2000 data and in June 2008 for 2005 and 2010 data.
36

(7) Agricultural regions nationwide Agricultural region Prefecture Agricultural region Prefecture Hokkaido Hokkaido Kinki Shiga, Kyoto, Osaka, Hyogo,
Nara, Wakayama Tohoku Aomori, Iwate, Miyagi, Akita,
Yamagata, Fukushima Chugoku
Sanin Sanyo
Tottori, Shimane Okayama, Hiroshima, Yamaguchi
Hokuriku Niigata, Toyama, Ishikawa, Fukui Shikoku Tokushima, Kagawa, Ehime, Kochi
Kanto/Tosan Northern Kanto Southern Kanto Tosan
Ibaraki, Tochigi, Gunma Saitama, Chiba, Tokyo, Kanagawa Yamanashi, Nagano
Kyushu Northern Kyushu Southern Kyushu
Fukuoka, Saga, Nagasaki, Kumamoto, Oita Miyazaki, Kagoshima
Tokai Gifu, Shizuoka, Aichi, Mie Okinawa Okinawa (8) Food self-sufficiency ratio Terminology Definition Food self-sufficiency ratio
This index indicates how much food for domestic consumption is being supplied by domestic sources. - Self-sufficiency ratio for individual items:
The following equation is used to calculate the self-sufficiency ratio on a weight basis for individual items.
Self-sufficiency ratio =Domestic production volume
Supply for domestic consumption
=Domestic production volume
Domestic production volume + Import volume − Export volume ± fluctuations in inventory
- Total food self-sufficiency ratio: This ratio is an index for the total volume of food, and is expressed in both calorie basis and production value basis. Products made from domestic livestock raised with imported feed are not included in calculations.
- Total food self-sufficiency ratio on calorie supply basis: Weight values for each item are converted to calories using the Standard Tables of Food Composition in Japan (2010), after which the calories of all items are totaled. This is equivalent to the ratio calculated by dividing the value for the sum of the domestic calorie supply per person per day by the value for the calorie supply per person per day.
- Total food self-sufficiency ratio on production value basis: Weight values are converted to production values using farm gate prices and import prices from domestic agricultural price and trade statistics, after which all production values are totaled. This is equivalent to the ratio calculated by dividing the sum of the domestic production value of food by the total food supply value for domestic consumption.
- Feed self-sufficiency ratio: This index indicates how much feed is being supplied by domestic sources, calculated in terms of total digestible nutrients (TDN) using the Standard Tables of Food Composition.
Food self-sufficiency ratio calculation equation
37

2. Basic Terminology Abandoned cultivated land
Abandoned cultivated land represents a section in the statistical survey conducted by the Ministry of Agriculture, Forestry and Fisheries. In the Census of Agriculture and Forestry, it is defined as land that was cultivated in the past but has not been farmed for more than a year and will not be farmed for the next several years. Land that has not been farmed for more than a year but may be farmed in the next several years is called unplanted land and also includes cultivated land under management.
AFFrinnovation AFFrinnovation means adding value to agricultural products, forest products, and fishery products in an innovative way, making new combinations, or creating a value chain.
Agricultural irrigation facilities
These facilities are roughly divided into two types -- irrigation facilities for providing irrigation water for farmlands and sewerage facilities for discharging surplus surface and soil water at farmlands. Irrigation facilities include dams and other water storage facilities, water intake facilities such as weirs, drains, pumping facilities, circular tank diversion works, farm ponds and other water supply and distribution facilities. Sewerage facilities include drainage canals and drainage pump stations. In addition, there are water control facilities to monitor, control and operate irrigation and sewerage facilities.
Agricultural producers' cooperative corporation
According to the Agricultural Cooperative Act, more than three farmers are necessary to establish such as corporation. These corporations are meant to facilitate cooperation in agricultural production between cooperative members and increase common profit. There are two types of these corporations. One aims to establish communal facilities for equipment and resources or promote communalization of agricultural operations, and the other aims to manage a corporation agricultural business such as farming. Both are called agricultural producers' cooperative corporations.
ASEAN ASEAN stands for the Association of Southeast Asian Nations. ASEAN was established in the Thai capital of Bangkok in 1967 for cooperation in addressing the promotion of economic growth, and social and cultural development, the achievement of political and economic stability and other challenges in Southeast Asia. Upon its establishment, it consisted of five countries -- Indonesia, Malaysia, the Philippines, Singapore and Thailand. Brunei acceded to ASEAN in 1984, Vietnam in 1995, Laos and Myanmar in 1997 and Cambodia in 1999. ASEAN now thus comprises 10 countries. Prompted by the 1997 Asian currency crisis, Japan, China, South Korea and ASEAN have formed the ASEAN+3 framework for cooperation in East Asia.
Becquerel A becquerel is a unit for measuring the strength of radiation, indicating the number of nuclear decays within a unit time. One becquerel means the strength of radiation from a nuclear decay in a second.
Biomass Biomass means organic resources of flora and fauna origin, excluding fossil resources. Biomass is made by organisms that create organic matter from inorganic water and CO2 through photosynthesis using solar energy falling on the earth. This type of resources is renewable throughout its life cycle as long as there are organisms and solar energy.
Calorie supply/Calorie intake
Calorie supply refers to the total amount of calories from food that is supplied to the public, and calorie intake refers to the total amount of calories actually consumed by the public. As a rule, the value for calorie supply is taken from the Food Balance Sheet issued by the Ministry of Agriculture, Forestry and Fisheries, while the value for calorie intake is taken from the National Health and Nutrition Examination Survey issued by the Ministry of Health, Labor and Welfare. Although it is necessary to keep in mind that calculations for both values are entirely different, since the calorie supply value includes leftovers and food destroyed in the distribution stage, the difference between this value and calorie intake can be used as a measure of the amount of food that has been destroyed or unconsumed.
38

Certified farmer (system)
The certified farmer system certifies plans for improving agricultural management drafted by farmers to attain targets for efficient and stable farm management in basic plans prepared by municipal governments to meet their respective conditions under the Agricultural Management Framework Reinforcement Act. For certified farmers, or those whose plans have been certified, various policy measures are primarily implemented, including low interest financing from the Super L loan system and other programs, measures to prevent mobilization of farmlands and infrastructure improvement efforts to support business farmers.
Community based farm cooperatives
These farm cooperatives consist of farming households in certain regions that have developed a relationship through the local community or other geographical bases. In these cooperatives, farming households conduct agricultural production as a collaborative enterprise. Adopting the three basic tenets of (1) aggregation of diverted paddy fields, (2) communal use of communally purchased equipment and (3) communalization of the entire farming process from production to marketing with farming leaders playing a central role. These cooperatives take different forms and approaches depending on their geographical location.
Crop condition index The index indicates crop conditions, taking the form of a percentage ratio of a (forecast) yield per 10 ares to a standard yield per 10 ares. The standard yield is an anticipated yield estimated before planting based on the recent actual yield trend on the assumption of average-year meteorological conditions and disaster incidence for the relevant year and in consideration of the recent advancement of cultivation technologies.
Degraded farmland A degraded farmland is a farmland that has been left uncultivated and degraded due to the abandonment of cultivation and is viewed objectively as unable to be used for growing crops with conventional farming methods.
EPA/FTA EPA stands for Economic Partnership Agreement and FTA for Free Trade Agreement. An FTA is a treaty between particular countries or regions created for the purpose of reducing and repealing tariffs on goods and services trade barriers. An EPA is a treaty that adds rules on investment and protection of intellectual property to the basic contents of an FTA in order to enhance a wider range of economic relations. Under the General Agreement on Tariffs and Trade (GATT), member countries are allowed to liberalize trade with EPA or FTA partners as an exception to most-favored nation status on the following conditions: (1) “abolishment of tariffs and other restrictive trade regulations” for “essentially all trade”, (2) abolishing such practices within a reasonable time frame (as a rule, within 10 years), and (3) refraining from enhancing tariffs and other trade barriers for nations other than EPA or FTA partners (under Article 24 and other sections of the General Agreement on Tariffs and Trade).
Externalization of our diet
An increase in double-income and single-member households, the rapid aging of population, the diversification of lifestyles and other factors have resulted in a trend where households depend more on outside sources for cooking and meal preparation that have traditionally been done at home. At the same time, the food service industry is exploring new markets by providing more processed foods and home meal replacements such as ready-to-eat dishes and lunch boxes in response to these changes in food consumption patterns. This trend is comprehensively referred to as externalization of our diet. (Refer to home meal replacement.)
Foot-and-mouth disease
Foot-and-mouth disease infected cloven-hoofed animals such as cattle and pigs show clinical signs, including vesicles/blisters on the mouth and feet, and the disease leads to reducing the productivity of these industrial animals. The fatality rate is several percent for adult stock but can exceed 50% for infant stock. Given the disease’s strong infectious and epidemic capacity and the absence of effective treatments, the World Organization for Animal Health, known as OIE (Office International des Epizooties), views it as one of the most alarming infectious diseases. Meat of stock infected with the disease is not shipped to the market. Even if humans eat meat or milk of stock infected with the disease, human health will not be affected.
GDP GDP stands for gross domestic product. GDP refers to the total of value added for all goods and services produced in a country within a designated time frame, which is usually one year. It is used as an index to measure domestic economic activity levels.
39

Home meal replacement
Home meal replacements are between eating out at restaurants and preparing meals at home. They include commercially sold lunch boxes, ready-to-eat dishes and foods cooked and processed outside of the home that are consumed without being cooked or heated at school or at the workplace. These meals are perishable.
Idle farmland An idled farmland meets either of two provisions in Item 3, Article 30, Agricultural Land Act. The first provision cites a farmland that is unused for cultivation and is expected to remain unused for the purpose. The second cites a farmland that is used far less than other farmlands in the vicinity.
Local consumption of local products
The program for local consumption of local products is designed to expand the consumption of home-grown agricultural, forestry and fisheries products by promoting the utilization of local agricultural, forestry and fisheries products.
NPO NPO stands for non-profit organization. These organizations perform various activities to contribute to society and do not distribute profits to their members. NPOs are expected to play an important role in responding to diversified needs of society in various areas (including welfare, education, culture, community building, ecology and international cooperation). Organizations that have been incorporated through the Act to Promote Specified Nonprofit Activities are called non-profit corporations and are allowed to open bank accounts and lease office spaces under their respective organization titles.
Total agricultural output
In agricultural production, the total agricultural output is the total output of all finally completed agricultural goods. It is the amount of the item-based production volume of agricultural products minus intermediate products such as seeds and fodder to prevent overlapping calculations, multiplied by the price of each item when delivered from the farms.
Traceability ‘Food traceability’ means the ability to trace and follow the movement of an agricultural product, processed product, or other food, from where the food came and to where the food went. The establishment and maintenance of records regarding movements of foods through all stages of production, processing and distribution enables identification of the movements from production to distribution and facilitates rapid withdrawal in the case of a food incident.
40