FY18 1H RESULTS Flight Centre Travel Group - fctgl.com · Marketing % TTV 0.94% 1.13% (19 bps)...
42
FY18 1H RESULTS Flight Centre Travel Group ASX:FLT | February 22, 2018
Transcript of FY18 1H RESULTS Flight Centre Travel Group - fctgl.com · Marketing % TTV 0.94% 1.13% (19 bps)...

FY18 1H RESULTS
Flight Centre Travel Group
ASX:FLT | February 22, 2018
AGENDA
Highlights and Result Overview
Adam Campbell, CFO
Segment Results
Graham “Skroo” Turner, CEO
Business Transformation
Melanie Waters-Ryan, COO
Outlook
Graham “Skroo” Turner, CEO
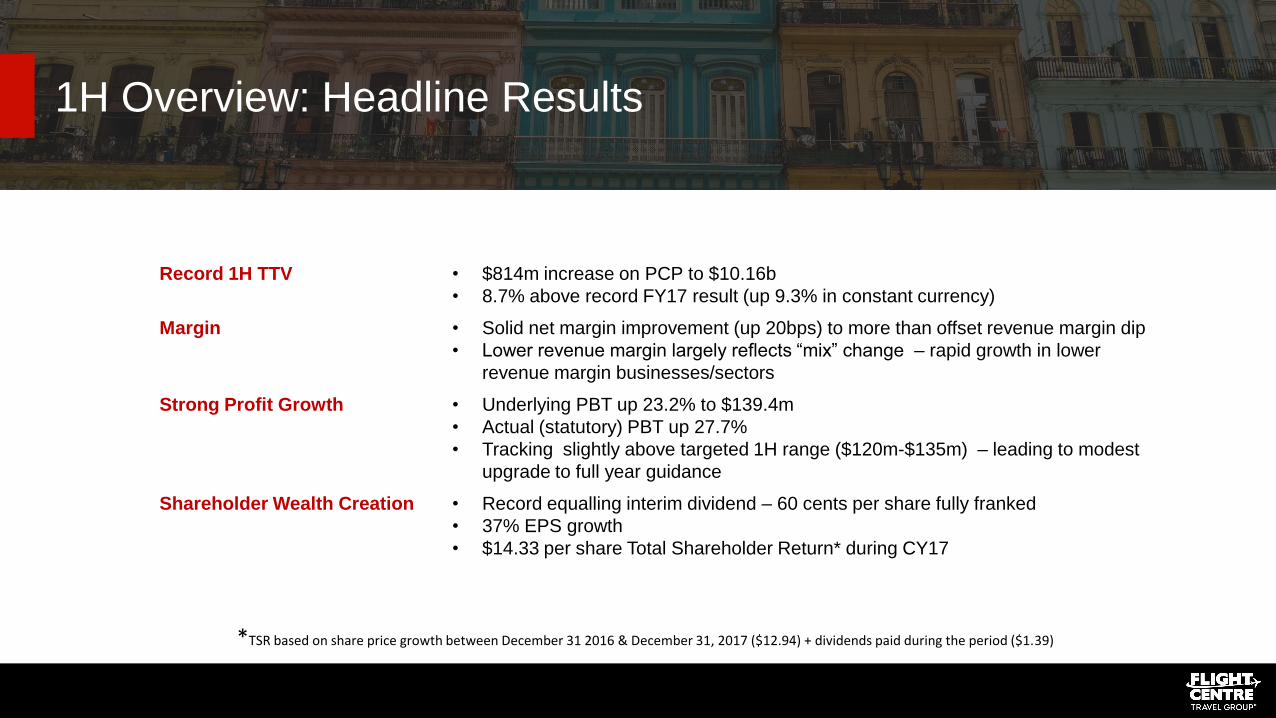
1H Overview: Headline Results
Record 1H TTV • $814m increase on PCP to $10.16b
• 8.7% above record FY17 result (up 9.3% in constant currency)
Margin • Solid net margin improvement (up 20bps) to more than offset revenue margin dip
• Lower revenue margin largely reflects “mix” change – rapid growth in lower
revenue margin businesses/sectors
Strong Profit Growth • Underlying PBT up 23.2% to $139.4m
• Actual (statutory) PBT up 27.7%
• Tracking slightly above targeted 1H range ($120m-$135m) – leading to modest
upgrade to full year guidance
Shareholder Wealth Creation • Record equalling interim dividend – 60 cents per share fully franked
• 37% EPS growth
• $14.33 per share Total Shareholder Return* during CY17
*TSR based on share price growth between December 31 2016 & December 31, 2017 ($12.94) + dividends paid during the period ($1.39)

1H Overview: Key Drivers
Efficiency & Productivity • Solid TTV growth achieved during period of network consolidation
• Further productivity gains – TTV per person up 7%
Executing Transformation Strategies • Progressing towards 7-2-100 targets
• Growing TTV, improving net margins & slowing cost growth
Business & Geographic Diversity • Record profit contribution from overseas businesses – also generated
almost 50% of TTV
• Developing growth platforms across 3 key pillars
• Strong corporate growth – cementing FLT’s position as Top 5 global TMC
New Revenue Streams • Acquisitions & organic
• New products
• New geographies
• New sectors
• New business models

Highlights: Successfully Executing Key Strategies
Early Progress Towards Transformation Targets
7 2 100
7% per annum TTV growth on average in
constant currency
= $4.5b growth over next 3 years
Tracking above target
Return to 2% full year net margin within 3 to 5
years (subject to mix)
1H (statutory) net margin up 20bps on PCP
Expected to improve on underlying 1.64%
FY17 full year result
<$100m in cost growth during FY18
$33m* 1H increase (3.4% up in constant
currency)
Lowest growth since GFC
Medium-term transformation goals are subject to review as FLT fine tunes strategies & as business mix changes. FLT will continue to provide separate annual guidance.
*Excludes touring costs, which were previously netted against revenue

Results in Detail: P&L • 1H TTV topped $10b for 1st time. More than doubled over past 8 years (Appendix 1)
• Almost 30% of 1H TTV from lower income margin OTA, multi-national corporate
(FCM) & FX businesses (Travel Money) – contributing to lower overall income
margin (as expected)
• “Mix” changes in India (TTG acquisition, FX growth) impacting overall income margin
• FY17 restated to show tour operating revenue & expenses gross (previously shown
nett in revenue)
• Successfully controlling cost growth to boost net margin
• Employee benefits expense increasing in line with revenue – incentivised workforce
• Decreased advertising spend – cost-effective enquiry generation, BYOjet & Aunt
Betty promoting ultra-low airfares via metasearch (rather than traditional)
• $2.6m increase in D&A expense, in line with expectations – reflects higher cap-ex in
recent years
• Transformation costs during 1H not significant & regarded as Business as Usual
• FY17 1H $4m underlying PBT adjustment from exiting Employment Office JV (no
adjustments during FY18 1H)
Profit & Loss
AUD $'m 1H FY18 1H FY17 Mvmt %
Group TTV 10,157 9,343 9%
Operating revenue 1,360 1,289 6%
Other revenue 14 15 (9%)
Total revenue 1,374 1,304 5%
Share of JV/Associates 1 1 (8%)
Employee benefits (719) (690) 4%
Marketing expense (96) (105) (9%)
Rent expense (81) (81) 0%
Tour operations (60) (53) 14%
D&A (39) (36) 7%
Finance costs (11) (12) (5%)
Other expenses (230) (219) 5%
PBT 139 109 28%
Underlying PBT 139 113 23%
EPS (cents) 101.2 73.7 37%
Sales teams 2,916 2,937 (1%)
Margins
Underlying Income Margin 13.53% 13.95% (43 bps)
Underlying PBT Margin 1.37% 1.21% 16 bps
Marketing % TTV 0.94% 1.13% (19 bps)

Results in Detail: Balance Sheet
• Strong cash position – circa $1.2billion in cash & investments
• Increased trade & other receivables driven by increase in corporate volume,
offset by decline in debtor days
• Goodwill on acquisitions leading to $88m intangible assets increase
• Ongoing investment in key IT projects also driving intangible asset growth
• Other non-current assets includes recent investments in JVs & associates –
3Mundi, Bibam & increased investment in Buffalo JV
• Movement in current trade payables & other liabilities reflects strong corporate
turnover growth & timing of wages & other operating accrual payments
• $361m in general cash + $107m in general investments (externally managed
funds) = $468m in general (company) cash & investments
• $377m positive net debt at Dec 31
Balance Sheet
AUD $'m As at
Dec-17 As at
Dec-16 Mvmt %
Cash & cash equivalents 1,011 1,010 0%
Financial assets 203 197 3%
Trade & other receivables 729 670 9%
Other current assets 100 94 6%
Current assets 2,042 1,971 4%
PPE 250 264 (5%)
Intangibles 561 463 21%
Other non-current assets 136 96 42%
Non-current assets 947 822 15%
Total assets 2,989 2,793 7%
Trade payables & other liabilities 1,255 1,200 5%
Borrowings 91 92 (0%)
Provisions 45 39 15%
Current liabilities 1,391 1,331 5%
Trade payables & other liabilities 127 92 38%
Provisions 37 36 3%
Non-current liabilities 164 128 28%
Total liabilities 1,555 1,458 7%
Net assets 1,433 1,335 7%
General cash 361 347 4%
General investments 107 102 5%
Client cash 649 663 (2%)
Client investments 96 96 0%
Total cash & investments 1,213 1,207 1%
Positive net debt 377 357 6%

Results in Detail: Cash Flow
• Operating cash outflow recorded during 1H, in line with normal seasonality
• Lower 1H operating outflow of $103m driven by TTV growth & lower tax
payments (decline in Australian PAYG instalment rate)
• Cash-funded acquisitions to enhance network (see Appendix 2):
• Olympus Tours (Mexico) – $24.6m net cash impact
• Executive Travel Limited (NZ) & Travel Managers Group (NZ) – $16.1m
• Les Voyages Laurier Du Vallon (Canada) – $16m
• BHMA (Asia) – $6.4m
• Travel Partners – $3.5m
• Cap-ex decreasing & now weighted towards systems after heavy recent
investment in shops & head office moves (see Appendix 3)
Cash flow statement
AUD $'m 1H FY18 1H FY17 Mvmt %
Operating activities
Operating activities before interest and tax (51) (83) (39%)
Net interest and tax paid (52) (63) (19%)
Cash flow from operating activities (103) (147) (30%)
Investing activities
Acquisitions (67) (16) 326%
Purchases of PPE and intangibles (43) (66) (35%)
Net purchases of financial assets (1) 9 (107%)
Other investing cash flows 4 (4) (201%)
Cash flow from investing activities (107) (76) 41%
Financing activities
Financing activities before dividends 32 17 95%
Dividends paid (95) (93) 2%
Cash flow from financing activities (63) (76) (18%)
Increase/(decrease) in cash held (273) (299) (9%)
FX impact 1 (8) (117%)
Cash and cash equivalents 1,010 1,008 0%
As at
Dec 17 As at
Dec 16
General cash (excl. Investments) 361 347 4%
Client cash 649 663 (2%)
Bank overdraft (1) (1) (47%)
Total cash 1,010 1,008 0%
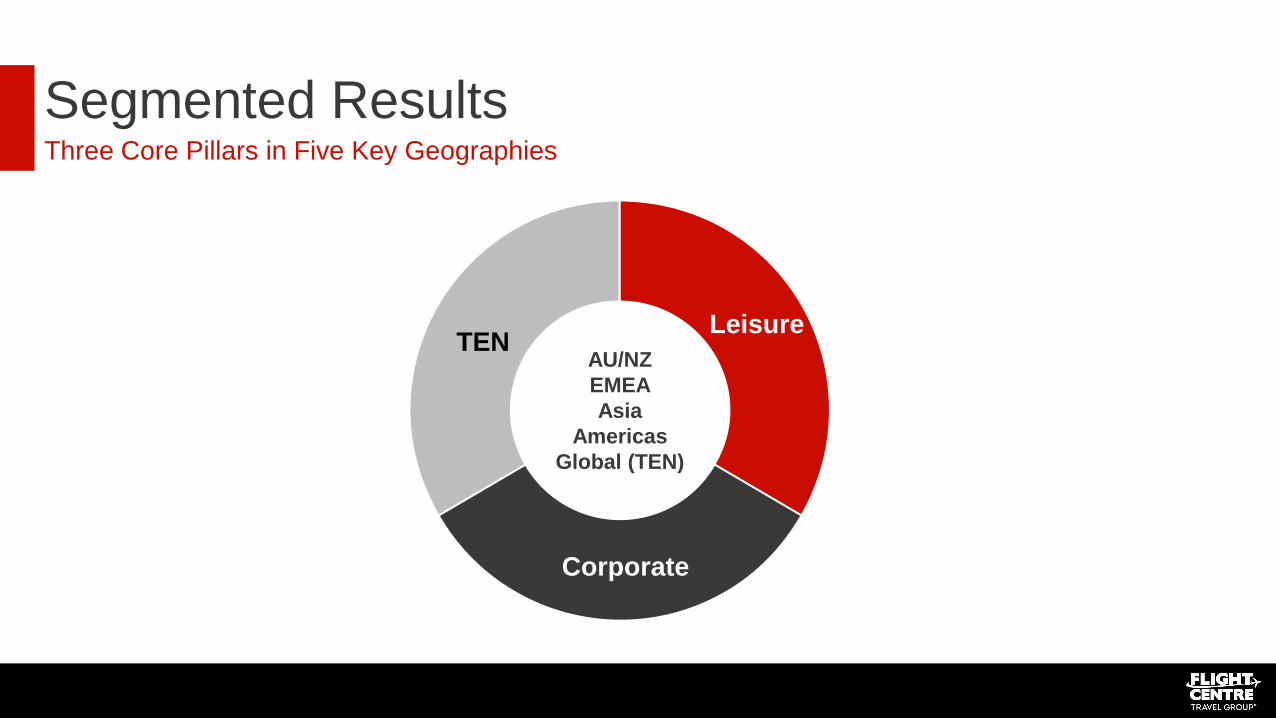
Segmented Results
AU/NZ
EMEA
Asia
Americas
Global (TEN)
Three Core Pillars in Five Key Geographies
TEN Leisure
Corporate
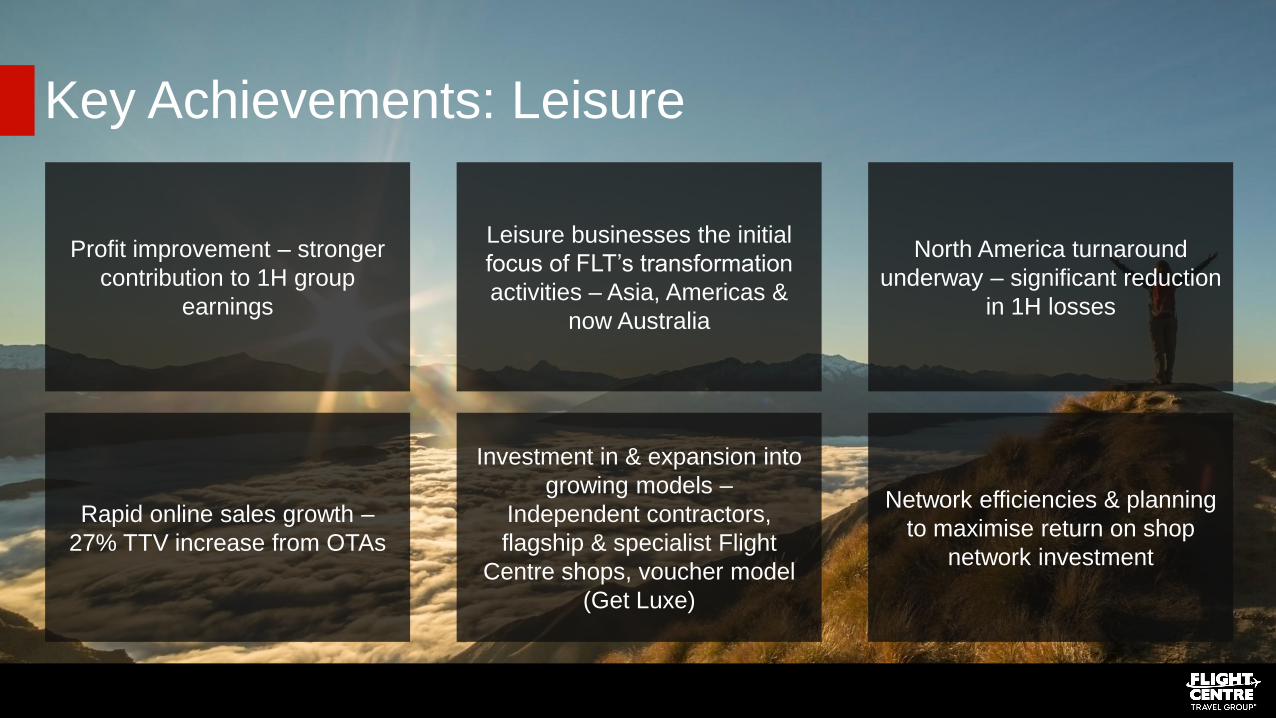
Key Achievements: Leisure
Profit improvement – stronger
contribution to 1H group
earnings
Leisure businesses the initial
focus of FLT’s transformation
activities – Asia, Americas &
now Australia
North America turnaround
underway – significant reduction
in 1H losses
Rapid online sales growth –
27% TTV increase from OTAs
Investment in & expansion into
growing models –
Independent contractors,
flagship & specialist Flight
Centre shops, voucher model
(Get Luxe)
Network efficiencies & planning
to maximise return on shop
network investment
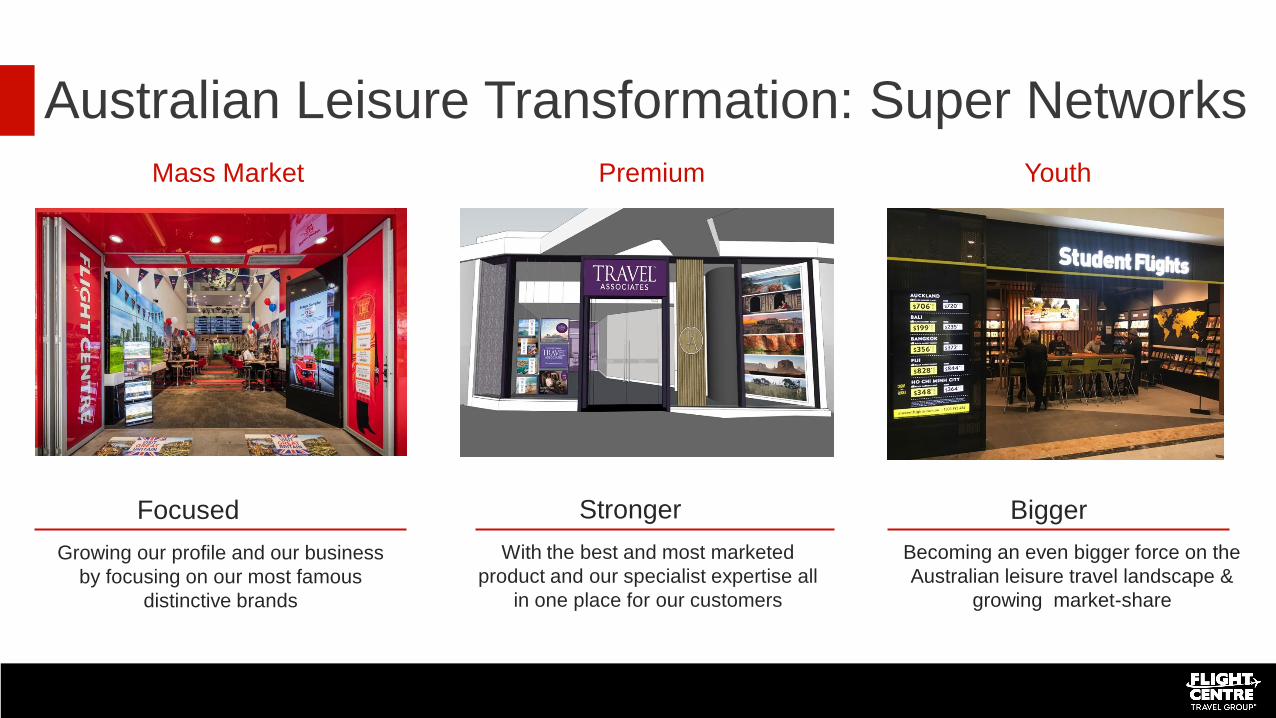
Australian Leisure Transformation: Super Networks
Mass Market Premium Youth
Focused Stronger Bigger
Growing our profile and our business
by focusing on our most famous
distinctive brands
With the best and most marketed
product and our specialist expertise all
in one place for our customers
Becoming an even bigger force on the
Australian leisure travel landscape &
growing market-share

Key Achievements: Corporate
Strong contribution to group
results – generated 37% of 1H
TTV (FY17 1H: 34%)
Now a Top-5 global TMC &
winning market-share – 19% 1H
TTV increase (up circa $600m
on PCP)
Developing global footprint –
integrating recent acquisitions,
FCM Germany launched
Strong growth in multi-national
FCM sales & account wins – 5
“enterprise” ($100m+) accounts
now in place
Corporate Traveller rebrand
underway to cement leading
SME customer offering
Ongoing investment in leading
system & tech suite

World Class Corporate Technology Suite
FCM Connect
• Global launch during 1H
• New name & positioning for FCM’s leading tech suite
• Single access point for traveller, booker, manager

World Class Corporate Technology Suite
Sam :]
• Corporate travel chat bot
• Blends AI with the expertise of FCM consultants
• Delivers personalised relevant info
• Launched in USA. Now in Europe
• Australia, Asia & Africa releases planned for 2H
• Leading tech and differentiator in the market
• Live chat and self-booking of air, hotels and cars
• https://www.au.fcm.travel/technology/sam

Key Achievements: Travel Experience Network
Investment in TEN Delivering Benefits That Are
Aligned to FLT’s Strategic Objectives
Greater control over customer offering
Ability to create unique products
Distribution via FLT shop & corporate business network
Improved margin through vertical integration
New external revenue streams – B2B & B2C Sales
Creating global networks across 3 sectors
Tour
Operators
Destination
Management
Companies
Hotel
Management
Topdeck (18-30s) Back-Roads (Small group/special interest)
Buffalo Tours (Asia) Olympus (Americas)
BHMA (Asia)
Also includes FLT’s product (non-air) procurement businesses, which predominantly service the company’s leisure & corporate sales networks
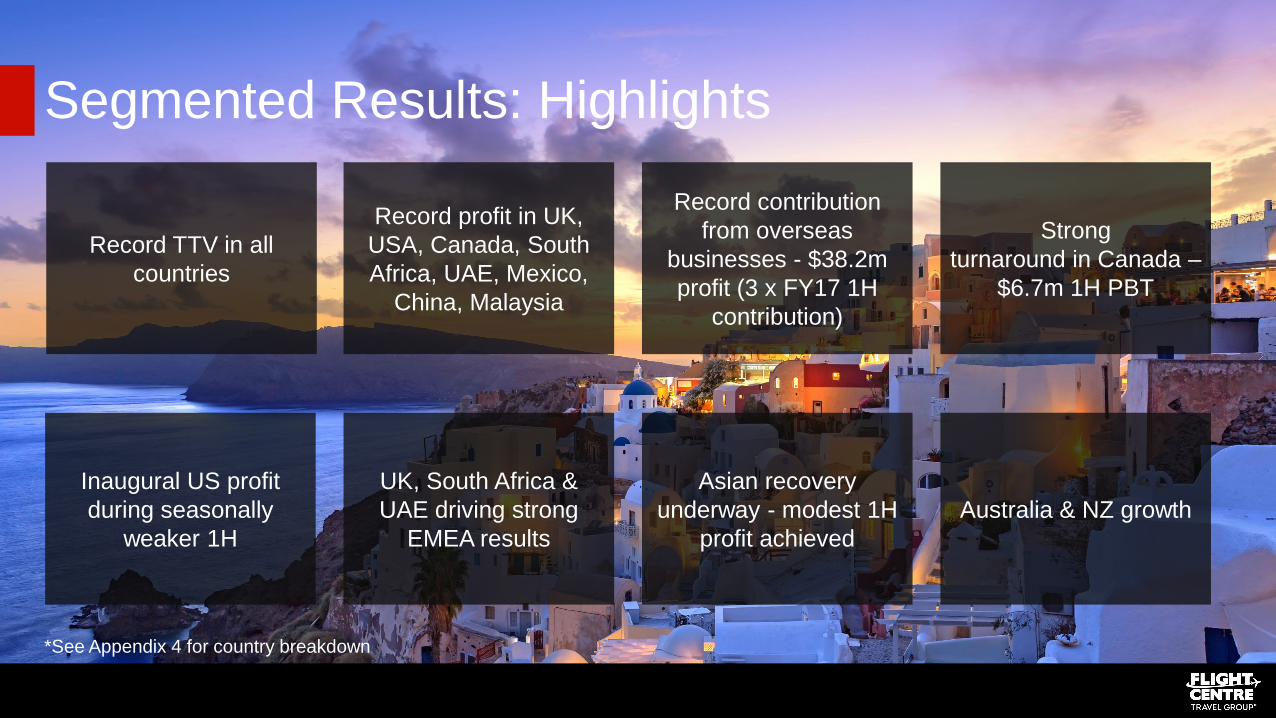
Segmented Results: Highlights
Record TTV in all
countries
Record profit in UK,
USA, Canada, South
Africa, UAE, Mexico,
China, Malaysia
Strong
turnaround in Canada –
$6.7m 1H PBT
Inaugural US profit
during seasonally
weaker 1H
UK, South Africa &
UAE driving strong
EMEA results
Australia & NZ growth
Record contribution
from overseas
businesses - $38.2m
profit (3 x FY17 1H
contribution)
Asian recovery
underway - modest 1H
profit achieved
*See Appendix 4 for country breakdown

Segmented Results: Australia / New Zealand
Result Overview & Key Drivers
• TTV up 4%, despite system change disruption & temporary sales force
contraction(expected)
• Modest profit growth in Australia – boosted by solid finish to 1H
• Australian leisure shop network (including Travel Money) generated
almost 44% of 1H group PBT
• 1H acquisitions contributing to NZ profit growth
• Successfully slowing cost growth – up circa 1%
• Strong growth in corporate TTV – further market-share gains
• Investment in Corporate Traveller SME offering
• Continued strong growth in online sales, digital capabilities
• New revenue streams – independent contractor, unique products,
interest-free holidays
AUD $m 1H FY18 1H FY17 Mvmt
TTV 5,895 5,653 4%
External Revenue 771 760 2%
Costs (667) (661) 1%
PBT 104 99 5%
Sales staff 8,273 8,542 (3%)
TTV per staff ($'000) 713 662 8%
Margins
Revenue Margin 13.08% 13.44% (35 bps)
PBT Margin 1.77% 1.75%
2 bps
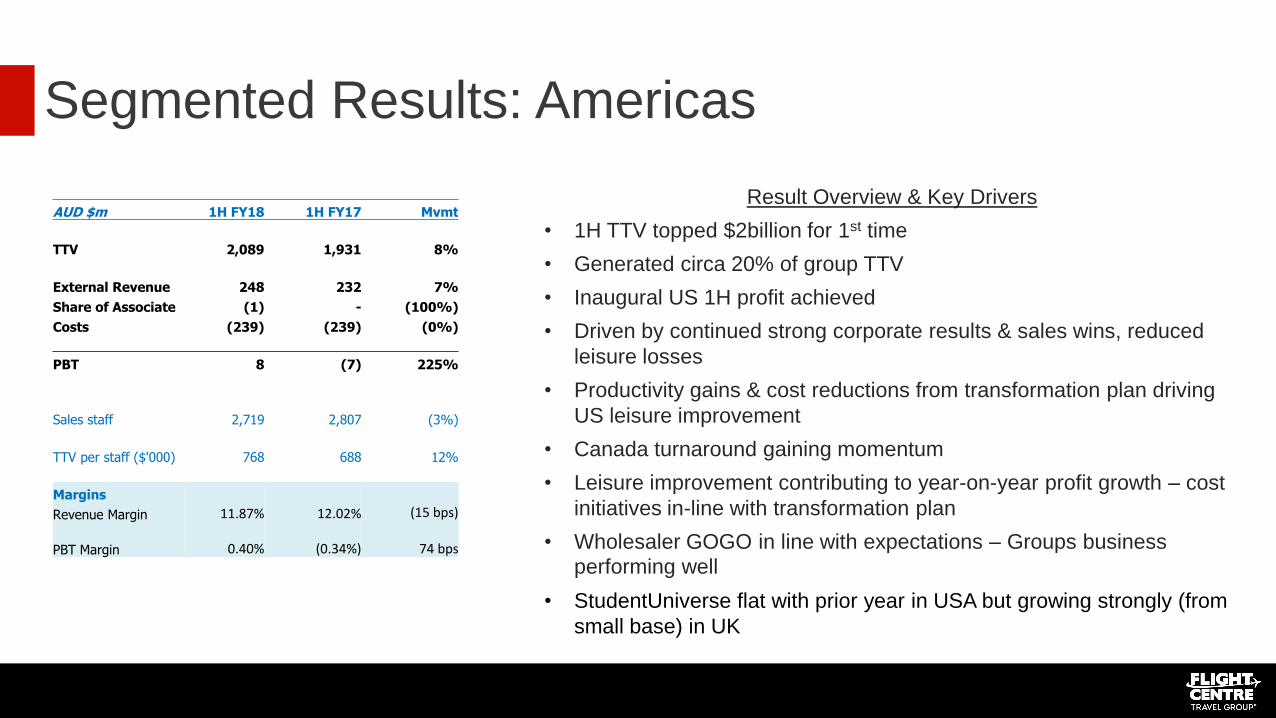
Segmented Results: Americas
Result Overview & Key Drivers
• 1H TTV topped $2billion for 1st time
• Generated circa 20% of group TTV
• Inaugural US 1H profit achieved
• Driven by continued strong corporate results & sales wins, reduced
leisure losses
• Productivity gains & cost reductions from transformation plan driving
US leisure improvement
• Canada turnaround gaining momentum
• Leisure improvement contributing to year-on-year profit growth – cost
initiatives in-line with transformation plan
• Wholesaler GOGO in line with expectations – Groups business
performing well
• StudentUniverse flat with prior year in USA but growing strongly (from
small base) in UK
AUD $m 1H FY18 1H FY17 Mvmt
TTV 2,089 1,931 8%
External Revenue 248 232 7%
Share of Associate (1) - (100%)
Costs (239) (239) (0%)
PBT 8 (7) 225%
Sales staff 2,719 2,807 (3%)
TTV per staff ($'000) 768 688 12%
Margins
Revenue Margin 11.87% 12.02% (15 bps)
PBT Margin 0.40% (0.34%)
74 bps

Segmented Results: EMEA
Result Overview & Key Drivers
• Strong TTV & profit growth (up 37%)
• Region generated circa 14% of group TTV & about 25% of group PBT
• Profits underpinned by strong UK, UAE & South Africa results
• UK profit up 30% in AUD
• Reduced losses in Ireland – targeting break-even full year result
• Integrating Europe corporate acquisitions – Netherlands, Sweden, Finland,
Norway, Denmark, Germany, France (25% interest)
• Investment in FCM Germany – equity presence in one of world’s largest
corporate markets
AUD $m 1H FY18 1H FY17 Mvmt
TTV 1,421 1,222 16%
External Revenue 196 178 11%
Costs (161) (152) 6%
PBT 35 25 37%
Sales staff 2,477 2,609 (5%)
TTV per staff ($'000) 574 468 22%
Margins
Revenue Margin 13.82% 14.53% (71 bps)
PBT Margin 2.46% 2.08%
37 bps

Segmented Results: Asia
Result Overview & Key Drivers
• Strong TTV growth from emerging region which includes Singapore,
Malaysia, India, Mainland China & Hong Kong
• Return to profit after 2 years of losses
• Transformation program well advanced & delivering benefits
• Singapore & Mainland China businesses profitable during 1H to offset
losses in Hong Kong & India
• Focus on corporate in South East Asia
• Leisure businesses downsized in Singapore, Beijing & Hong Kong &
now profitable
• Travel Tours acquisition (FY17) contributing to strong TTV growth in
India
AUD $m 1H FY18 1H FY17 Mvmt
TTV 637 439 45%
External Revenue 43 36 20%
Costs (42) (39) 6%
PBT 1 (4) 128%
Sales staff 1,286 1,198 7%
TTV per staff ($'000) 495 366 35%
Margins
Revenue Margin 6.72% 8.13% (141 bps)
PBT Margin 0.16% (0.82%)
98 bps

Segmented Results: Other
Result Overview & Key Drivers
• Items that are not allocated to geographical segments, including
FLT’s TEN businesses
• TTV & revenue growth mainly driven by inclusion of Olympus
• Improved touring results after challenging FY17 1H
• Increased segment losses – impact of BHMA, acquisition costs, op-
ex relating to new systems, transformation costs, increased
incentives as a result of strong 1H trading
AUD $m 1H FY18 1H FY17 Mvmt
TTV 115 99 17%
External Revenue 115 99 17%
Share of JV 2 1 54%
Costs (126) (105) 20%
PBT (9) (5) (85%)
Margins
Underlying PBT Margin (7.64%) (4.83%)
(281 bps)

Travel Money
Circa $670m in 1H TTV, up 18%
Now FLT’s 4th largest brand
globally behind FCB, FCM & CT
Productivity & margin focus
New Travel Money Currency
Pass launched – prepaid
currency card
BYOjet + Aunt Betty
Almost $180m in 1H TTV
87% TTV growth
Circa $2.5m in PBT
Pure online play selling ultra low-
cost airfares via metasearch
BYOjet exported to New Zealand,
UK, Singapore
Plans for further expansion
Pedal Group (JV)
Includes retailer 99 Bikes &
wholesaler Advance Traders
Australia
$54.7m in consolidated 1H sales
(up 13%)
$2.8m in consolidated PBT (FLT
has 50% share)
36 shops throughout Australia – 5
new outlets during past year
including 1st WA & Canberra
stores
Avmin
Aircraft charter business growing
strongly
1H TTV up circa 40%, flight
sectors almost doubled during
period
Growth in ad-hoc charters
(private jets etc) & FIFO
New deals in place - QLD State
Government, Mildura FIFO
FY18 Results: Emerging Brand Success Stories

Transformation Update: Priorities
• Growing online completion (e-commerce) & online origination as part of
blended offering
• Improving digital services – booking engine upgrades, UX
enhancements, mobile apps, dNA (digital centre of excellence)
• Building new capabilities – data management, business intelligence,
cruise & hotel search
Digital Commerce Growth
• Removing duplication/Centralising functions
• Outsourcing some support functions into lower cost markets
• Developing a global TEN footprint
• Investment in 2 key enterprise technology projects - GDS (point-of-sale)
+ new financial platform (Microsoft Dynamics)
Globalisation – Air, Land, & IT
• Leaner support structures, leading to lower costs
• Network planning to secure optimal shop locations & deliver a
stronger ROI
• Stronger returns on recent system enhancements
• Improved network performance – achieving TTV growth target
during period of network contraction
Controlling Costs & Improving Efficiency
• Brand & some network consolidation delivering top & bottom-line
improvement
• Accelerating growth of successful business models
• Removal of underperforming business models
• Further investment in tech solutions to improve enquiry management &
enhance conversion – successful enquiry routing pilot in USA
(RedConnect)
• New models – home-based organic start-ups & acquisitions
Investment in Growth Brands & Business Models
Creating & accelerating change throughout the organisation

Digital Transformation
Improving our services
• Making digital integral to our strategy
• Building new websites, mobile apps and platforms
• Reaching more customers across more channels
• Increasing profitability by improving scalability
• Bringing services and products to market faster
• Making internal processes more efficient
• Exploring: Amazon Echo (Alexa) integration as an
example
Changing from a position of strength.

Digital Transformation
Online Completion • Global platform development and rollout on track
• UK and RSA live with new e-commerce solutions
• Major new UX/UI releases to all properties
• New native app releases driving continued growth and
repeat business
• Underway: Adding products online
Leisure e-commerce sales growing

Digital Transformation
Digital in All Channels
• New lead management technology live
• Digital Factory (dNA) driving change in digital
• Culture of testing and conversion rate optimisation
• Consolidation of services and tech to gain speed
• Integration of modern appointment tech – contributing to
higher conversion rates
• Increased focus on data and personalization
Phone calls Lead Gen Chats Appointments Emails Shop visits Web + App

Transformation Update: Efficiency & Costs
Lowering Overhead / Support Costs
Redundancies late in FY17 (Asia, some
Australia-based global roles)
Air ticketing functions globalised early
2H
Pursuing outsourcing opportunities –
some finance functions and online
customer support
Strengthening Platforms & Improving
Network Efficiency
New in-store POS systems now fully
deployed (2.5-year project)
Microsoft Dynamics (finance platform)
deployment project to begin in Australia
in FY18
Enhancements to corporate tech suite
Network plans implemented:
- Better utilisation & leasing
efficiencies
- Closing or relocating some poorly
located shops
- Opening bigger shops in better
locations

Transformation Update: Growth Brands & Models
• Initial focus on loss-making North America, UAE & Asia operations
• Canada & US leisure network consolidation to improve
performance
• Small Asia shop networks downsized or closed
• UAE leisure (3 shops) closed
• Focusing now on Australia – brands joining forces to create 3
Super Networks
• Some smaller brands consolidated or merged – Student Flights
(NZ, RSA), Cruiseabout, Escape Travel, Travel Money USA, Flight
Centre Namibia
• Flight Shops merged with acquired Travel Tours business in India –
now operating under Travel Tours brand
• BYOjet international expansion continued
• Investing in home-based/independent contractor models –
acquisitions & organic growth
• Growth in flagship & specialist Flight Centre offerings
• Flagship growth delivering returns - 80 flagship stores &
hyperstores now delivering 20% of Australian leisure TTV and 30%
of profit
• Investment in FCM network - 8 new countries during FY17 & 12 in
past 3 years - & leading technology/product suite
• Competing successfully with world’s largest TMCs for $100m+
“enterprise” accounts
• Focus on single corporate brand – FCM – in South East Asia
• Corporate Traveller rebrand in key markets to cement leading
customer offering in SME sector
• CT Go just launched in Australia – includes rapid on-boarding
function for new clients (15 minutes)
• Investment in Your CT in UK – single gateway to all tech tools
• Acquisitions to complement organic growth in key sectors as FLT
develops global touring, DMC & hotel management networks
• BHMA – 1st investment in hotel management sector
• Olympus secured as Americas-based DMC to operate alongside
Asia-based Buffalo Tours DMC
Leisure Corporate
Travel Experience Network (TEN)

Australian Super Networks: Overview
• Merging some Australian leisure brands to create larger & individually more successful businesses
• Smaller scale project also underway in NZ
Joining Forces to Create 3 Leisure Travel Super Networks
• Escape Travel & Cruiseabout to join forces with Flight Centre & Travel Associates in Australia
• Shops to be rebranded to FC or TA
• No consultant job losses - all affected sales staff to be redeployed to FC, TA
• Specialist divisions to be developed within FC network to capture markets previously serviced by ET & CA (tailor-made holidays, cruises)
• Will operate alongside Student Flights (Youth Network)
Key Aspects
• Targeting market-share growth & delivering a stronger footprint – higher profile brands with a stronger presence
• TA will more than double in size – from 50 to 103 sales teams
• Better locations, bigger shops for Flight Centre – sales teams to increase from 780 to about 920
• More aggressive marketing & greater share of voice – overall ad spend maintained & channelled towards a smaller brand stable
• Allowing for leaner support structures – lowering future costs – & bringing better products to market
Benefits

Super Networks: A Market-Share Growth Plan
Staff/teams affected by brand mergers
will be redeployed to either Flight
Centre or Travel Associates
No Travel Consultant Roles Lost No TTV Lost No Negative Impact on Customer or Suppliers
Overall sales force to be maintained
in short-term & then grown to achieve
market-share growth objective
Comprehensive communications plan in
place to eliminate disruption/confusion
Delivering a stronger product offering &
servicing capability with fewer brands
Working with suppliers within each network
to grow sales & the overall leisure market

Investing In Our People
New Initiatives
• Paid Maternity Leave (July 18)
• Workplace Flexibility
• Mentor Program
• Professional Development Training
• UK Apprenticeship Program
• Diversity Project

FY18 Outlook: Guidance Updated
Trading slightly above guidance
after 1H –leading to modest upgrade
to full year target
Now targeting $360m-$385m
underlying PBT
(previously $350m-$380m)
New guidance range represents
9.3%-16.8% growth on FY17
1H profit growth trajectory unlikely to
continue during 2H –
PCP was a relatively strong trading
period (PBT up 4.7% after being
down circa 22% after FY17 1H)
Some additional transformation
costs likely during 2H – focuses on
technology, support costs &
Australian leisure
Further disruption possible in
Australia & NZ while super network
plan is implemented

• Further growth expected after record-breaking 1H
• Americas: Leisure businesses approaching break-even over full year, gaining
corporate market-share
• EMEA: UK business continuing to perform well & driving strong EMEA results
Overseas Businesses
• Corporate business well placed for further growth during 2H
• Targeting stronger leisure TTV growth, but further disruption possible in short-term
Australia
• Affordability: Airfare prices have stabilised, but remain low by historical standards
• Amenities: Better In-Flight Experience – Qantas direct flights Perth-London, Premium
Cabin Upgrades, Virgin Australia Economy X
• Availability: More seats & more services but capacity growth in Australia slower than
during PCP (see Appendix 5)
Ongoing Market Growth As Golden Era of Travel Continues
Outlook: 2H
Growth
Drivers
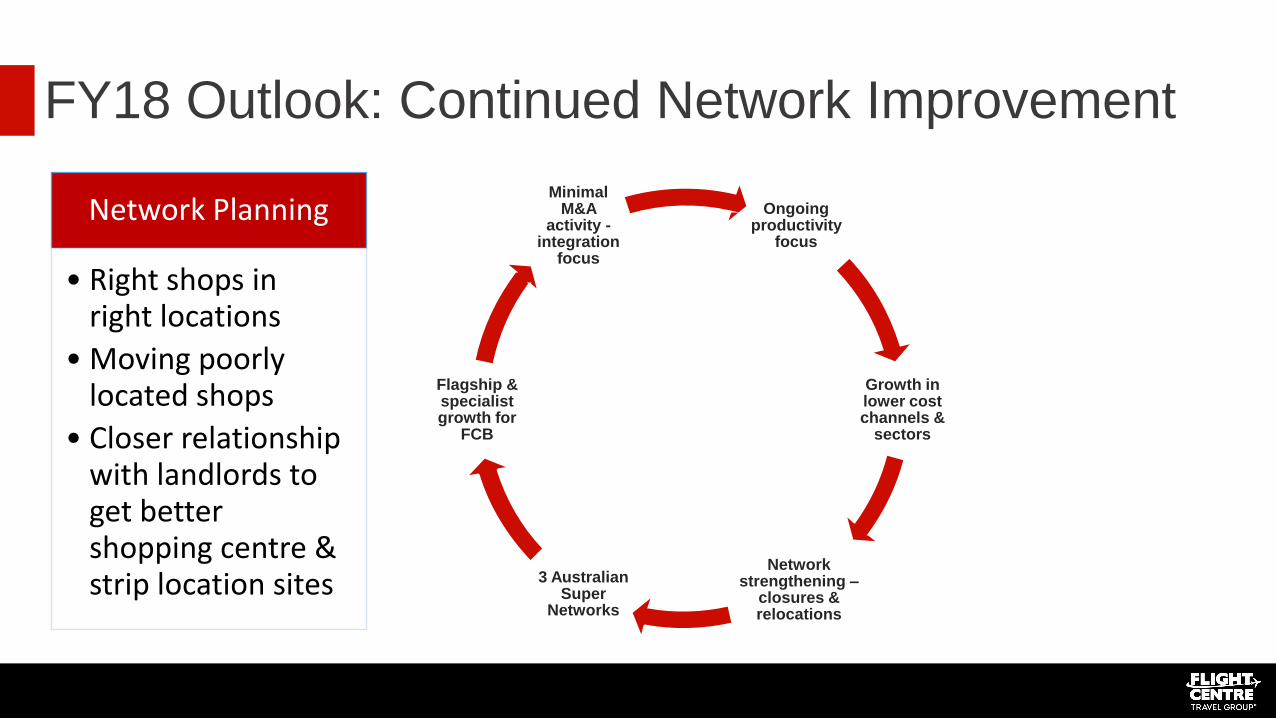
FY18 Outlook: Continued Network Improvement
Ongoing productivity
focus
Growth in lower cost channels &
sectors
Network strengthening –
closures & relocations
3 Australian Super
Networks
Flagship & specialist growth for
FCB
Minimal M&A
activity - integration
focus
Network Planning
• Right shops in right locations
• Moving poorly located shops
• Closer relationship with landlords to get better shopping centre & strip location sites

35
End of Presentation
Questions?

Appendix 1: TTV Growth Throughout The Cycle
1H TTV Has Now More Than Doubled in Eight Years
$0.00
$2.00
$4.00
$6.00
$8.00
$10.00
$12.00
Dec 31 2009 Dec 31 2010 Dec 31 2011 Dec 31 2012 Dec 31 2013 Dec 31 2014 Dec 31 2015 Dec 31 2016 Dec 31 2017
TTV ($b)
TTV ($b)
36

Appendix 2: Summary - Recent Acquisitions
Strategic Rational Date Completed Segment Ownership
Leisure Ignite Voucher-based model selling unique product offers direct & via shop
network Sep-16 Aust & NZ 49%
Sunny Provides FCTG the required licence to sell outbound travel to Chinese
nationals Oct-16 Asia 100%
Travel Partners Expansion of Australia leisure business into independent contractor &
affiliate models Sep-17 Aust & NZ 100%
Travel Managers Expansion of New Zealand leisure into brokers & franchisee models Aug-17 Aust & NZ 100%
Travel Tours Expansion of India's leisure business Feb-17 Asia 100%
Corporate
Nordics & Germany Further expansion of corporate business into Europe and access to in-
house developed OBT technology Dec-16 EMEA 100%
3Mundi (France) Further geographical expansion into Europe through acquisition of high
performing FCM Licensee Jun-17 EMEA 25%
Bibam Access to new technology, potential low cost base for future IT development
and geographical expansion Apr-17 Americas 24.1%
Les Voyages Laurier du Vallon Increased market share within Quebec region and synergies with existing
operations Aug-17 Americas 75%
Executive Travel Increased corporate market share within New Zealand Aug-17 Aust & NZ 100%
Travel Experiences
Buffalo (Vietnam) Expansion of existing DMC network to include Vietnam providing a
dominate DMC presence across Asia Apr-17 Other 58.5%*
Olympus Geographical DMC presence in Central America and the Caribbean Aug-17 Other 100%
BHMA Expansion of Travel Experience Network offerings through the acquisition of
hotel management operating platform and specialist IP Jul-17 Other 100%
37
* FLT previously owned 49% of a JV that did not include the Vietnam Buffalo Tours business

Cap-ex moderating & shifting
towards system & IT spend –
now about half of total budget
(FY15: Circa 25%)
38
Appendix 3: Changing Cap-Ex Profile
20 15
33 30
2
31
8
2 22
17
17
9
-
10
20
30
40
50
60
70
H1'18 H1'17 H1'16 H1'15
FLT capex spend $m
IT / Other Projects
Head Office
Shop

TTV: $5.3b, up 4% AUD EBIT: $108.8m BUSINESSES: 1,535
Australia1
TTV: $0.6b, up 11% in AUD (up 15% in lc) AUD EBIT: $1.9m BUSINESSES: 203
New Zealand
TTV: $367m, up 79% in AUD (up 77% in lc) AUD EBIT: ($0.3m) BUSINESSES: 129
India
TTV: $142m, up 4% in AUD AUD EBIT: $0.7m BUSINESSES: 30
Greater China
TTV: $273m, up 8% in AUD (up 7% in lc) AUD EBIT: $7.6m BUSINESSES: 182
South Africa
TTV: $128m, up 33% in AUD AUD EBIT: $1.8m BUSINESSES: 20
South East Asia
TTV: $0.7b, up 15% in AUD (up 14% in lc) AUD EBIT: $7.7m BUSINESSES: 221
Canada
TTV: $1.4b, up 5% in AUD (up 9% in lc) AUD EBIT: $2.6m BUSINESSES: 262
USA2
TTV: $134m, up 289% in AUD AUD EBIT: ($0.9m) BUSINESSES: 22
Rest of Europe1
TTV: $1.0b, up 8% in AUD (up 8% in lc) AUD EBIT: $25.4m BUSINESSES: 291
United Kingdom
1. Results include joint ventures & associates. 2. Results include the Student Universe business.
TTV: $30m, up 19% in AUD AUD EBIT: ($0.9m) BUSINESSES: 4
Latin America1
TTV: $52m, up 22% in AUD (up 26% in lc) AUD EBIT: $0.7m BUSINESSES: 9
UAE
Appendix 4: Results by Country
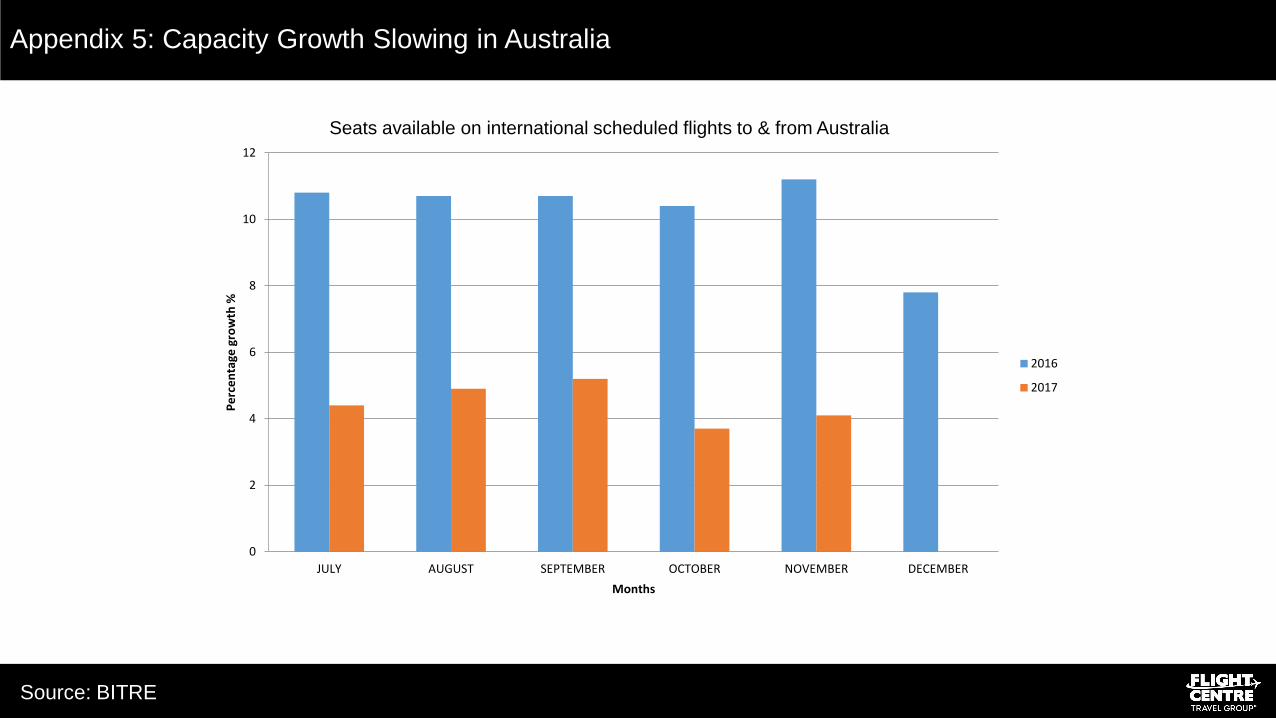
Appendix 5: Capacity Growth Slowing in Australia
0
2
4
6
8
10
12
JULY AUGUST SEPTEMBER OCTOBER NOVEMBER DECEMBER
Pe
rce
nta
ge g
row
th %
Months
Seats available on international scheduled flights to & from Australia
2016
2017
40 Source: BITRE

Appendix 6: Historical Results
41
5 year summary
December December December December December
2017 2016 2015 2014 2013
TTV $10,157m $9,343m $9,182m $8,138m $7,480m
Income margin 13.5% 14.0% 13.7% 13.6% 14.1%
EBITDA $177.4m $143.8m $188.0m $164.0m $179.3m
PBT $139.4m $109.2m $156.9m $141.0m $155.0m
NPAT $102.2m $74.4m $116.7m $100.3m $110.8m
EPS 101.2c 73.7c 115.7c 99.7c 110.3c
DPS 60.0c 45.0c 60.0c 55.0c 55.0c
ROE 7.1% 5.6% 9.1% 8.8% 10.3%
Capex $43.6m $65.7m $58.2m $39.5m $28.2m
Selling staff 14,755 15,082 14,747 13,941 13,000
General cash $361.5m $346.9m $429.8m $429.4m $401.9m
Client cash $649.4m $662.7m $612.2m $611.3m $594.4m
Cash and cash equivalents $1,010.9m $1,009.6m $1,042.0m $1,040.7m $996.3m
Investments $202.6m $197.5m $104.5m $62.0m $32.2m
Cash and investments $1,213.5m $1,207.1m $1,146.5m $1,102.7m $1,028.5m

Appendix 7: Net Margin Seasonality
0.00%
0.50%
1.00%
1.50%
2.00%
2.50%
3.00%
FY15 FY16 FY17 FY18
1H
2H
Full Year
Positive 1H net margin trend during FY18
Net margin typically increases during 2H
Improvement reflects:
• North American leisure seasonality – businesses become
profitable after loss-making 1H
• Relatively high fixed costs – leading to accelerated profit
growth during busier 2H trading periods
• Commission growth typically outpacing wage growth
Net Margin Numbers Above Are Based on Underlying PBT
42