FY07 Fringe Benefit Proposal to ONR Rev - Alaska
14
Transcript of FY07 Fringe Benefit Proposal to ONR Rev - Alaska
UNIVERSITY OF ALASKA
FY07 FORWARD PRICING FRINGE BENEFIT PROPOSALTO ESTABLISH PROVISIONAL RATES
The University of Alaska Fringe Benefit Forward Pricing Proposal
To Establish Provisional Rates
July 1, 2006 – June 30, 2007
Table of Contents Schedule Page
1 Significant Assumptions ……………………………………………………………………………………………… 1-3
2 Staff Benefit Rate Projections ……………………………………………………………………………………….. 4
3 Leave Benefit Projections ……………………………………………………………………………………………. 5
4 Staff Benefit Cost Distribution ……………………………………………………………………………………….. 6-8
5 Wage Base Projection ………………………………………………………………………………………………... 9
University of Alaska SB Schedule 1 FY07 Fringe Benefit Rate Projections Significant Assumptions
1
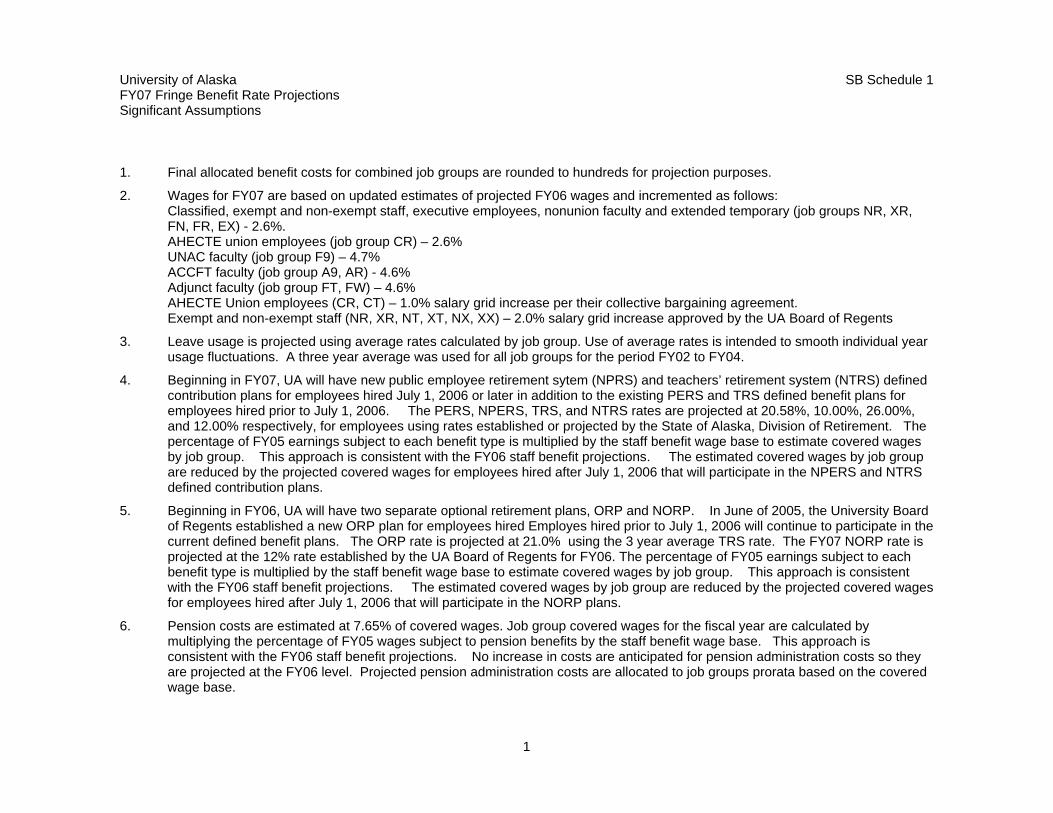
1. Final allocated benefit costs for combined job groups are rounded to hundreds for projection purposes.
2. Wages for FY07 are based on updated estimates of projected FY06 wages and incremented as follows: Classified, exempt and non-exempt staff, executive employees, nonunion faculty and extended temporary (job groups NR, XR, FN, FR, EX) - 2.6%. AHECTE union employees (job group CR) – 2.6% UNAC faculty (job group F9) – 4.7% ACCFT faculty (job group A9, AR) - 4.6% Adjunct faculty (job group FT, FW) – 4.6% AHECTE Union employees (CR, CT) – 1.0% salary grid increase per their collective bargaining agreement. Exempt and non-exempt staff (NR, XR, NT, XT, NX, XX) – 2.0% salary grid increase approved by the UA Board of Regents
3. Leave usage is projected using average rates calculated by job group. Use of average rates is intended to smooth individual year usage fluctuations. A three year average was used for all job groups for the period FY02 to FY04.
4. Beginning in FY07, UA will have new public employee retirement sytem (NPRS) and teachers’ retirement system (NTRS) defined contribution plans for employees hired July 1, 2006 or later in addition to the existing PERS and TRS defined benefit plans for employees hired prior to July 1, 2006. The PERS, NPERS, TRS, and NTRS rates are projected at 20.58%, 10.00%, 26.00%, and 12.00% respectively, for employees using rates established or projected by the State of Alaska, Division of Retirement. The percentage of FY05 earnings subject to each benefit type is multiplied by the staff benefit wage base to estimate covered wages by job group. This approach is consistent with the FY06 staff benefit projections. The estimated covered wages by job group are reduced by the projected covered wages for employees hired after July 1, 2006 that will participate in the NPERS and NTRS defined contribution plans.
5. Beginning in FY06, UA will have two separate optional retirement plans, ORP and NORP. In June of 2005, the University Board of Regents established a new ORP plan for employees hired Employes hired prior to July 1, 2006 will continue to participate in the current defined benefit plans. The ORP rate is projected at 21.0% using the 3 year average TRS rate. The FY07 NORP rate is projected at the 12% rate established by the UA Board of Regents for FY06. The percentage of FY05 earnings subject to each benefit type is multiplied by the staff benefit wage base to estimate covered wages by job group. This approach is consistent with the FY06 staff benefit projections. The estimated covered wages by job group are reduced by the projected covered wages for employees hired after July 1, 2006 that will participate in the NORP plans.
6. Pension costs are estimated at 7.65% of covered wages. Job group covered wages for the fiscal year are calculated by multiplying the percentage of FY05 wages subject to pension benefits by the staff benefit wage base. This approach is consistent with the FY06 staff benefit projections. No increase in costs are anticipated for pension administration costs so they are projected at the FY06 level. Projected pension administration costs are allocated to job groups prorata based on the covered wage base.
University of Alaska SB Schedule 1 FY07 Fringe Benefit Rate Projections Significant Assumptions
2
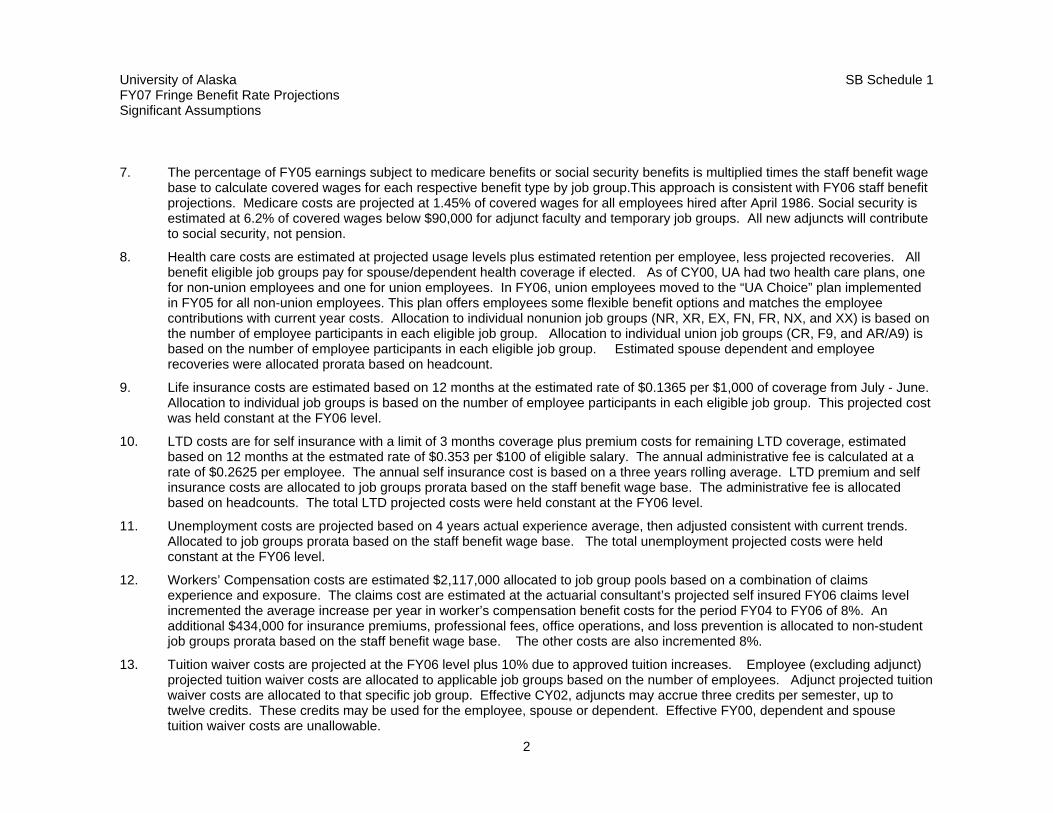
7. The percentage of FY05 earnings subject to medicare benefits or social security benefits is multiplied times the staff benefit wage base to calculate covered wages for each respective benefit type by job group.This approach is consistent with FY06 staff benefit projections. Medicare costs are projected at 1.45% of covered wages for all employees hired after April 1986. Social security is estimated at 6.2% of covered wages below $90,000 for adjunct faculty and temporary job groups. All new adjuncts will contribute to social security, not pension.
8. Health care costs are estimated at projected usage levels plus estimated retention per employee, less projected recoveries. All benefit eligible job groups pay for spouse/dependent health coverage if elected. As of CY00, UA had two health care plans, one for non-union employees and one for union employees. In FY06, union employees moved to the “UA Choice” plan implemented in FY05 for all non-union employees. This plan offers employees some flexible benefit options and matches the employee contributions with current year costs. Allocation to individual nonunion job groups (NR, XR, EX, FN, FR, NX, and XX) is based on the number of employee participants in each eligible job group. Allocation to individual union job groups (CR, F9, and AR/A9) is based on the number of employee participants in each eligible job group. Estimated spouse dependent and employee recoveries were allocated prorata based on headcount.
9. Life insurance costs are estimated based on 12 months at the estimated rate of $0.1365 per $1,000 of coverage from July - June. Allocation to individual job groups is based on the number of employee participants in each eligible job group. This projected cost was held constant at the FY06 level.
10. LTD costs are for self insurance with a limit of 3 months coverage plus premium costs for remaining LTD coverage, estimated based on 12 months at the estmated rate of $0.353 per $100 of eligible salary. The annual administrative fee is calculated at a rate of $0.2625 per employee. The annual self insurance cost is based on a three years rolling average. LTD premium and self insurance costs are allocated to job groups prorata based on the staff benefit wage base. The administrative fee is allocated based on headcounts. The total LTD projected costs were held constant at the FY06 level.
11. Unemployment costs are projected based on 4 years actual experience average, then adjusted consistent with current trends. Allocated to job groups prorata based on the staff benefit wage base. The total unemployment projected costs were held constant at the FY06 level.
12. Workers’ Compensation costs are estimated $2,117,000 allocated to job group pools based on a combination of claims experience and exposure. The claims cost are estimated at the actuarial consultant’s projected self insured FY06 claims level incremented the average increase per year in worker’s compensation benefit costs for the period FY04 to FY06 of 8%. An additional $434,000 for insurance premiums, professional fees, office operations, and loss prevention is allocated to non-student job groups prorata based on the staff benefit wage base. The other costs are also incremented 8%.
13. Tuition waiver costs are projected at the FY06 level plus 10% due to approved tuition increases. Employee (excluding adjunct) projected tuition waiver costs are allocated to applicable job groups based on the number of employees. Adjunct projected tuition waiver costs are allocated to that specific job group. Effective CY02, adjuncts may accrue three credits per semester, up to twelve credits. These credits may be used for the employee, spouse or dependent. Effective FY00, dependent and spouse tuition waiver costs are unallowable.
University of Alaska SB Schedule 1 FY07 Fringe Benefit Rate Projections Significant Assumptions
3
14. AHECTE Legal Trust costs, consulting, and other costs are projected at the level forecasted by the program director. AHECTE legal trust costs are allocated entirely to the benefiting job group, CR. Consulting and other costs are allocated to job groups prorata based on the staff benefit wage base. AHECTE contract costs were held constant at the FY06 level.
15. Labor relations costs are projected at the level forecasted by the program director and Statewide Office of Faculty and Staff Relations (formerly Human Resources) and are allocated to the union job groups prorata based on their staff benefit wage base. Contract negotiations will begin in FY07 so these costs were increased by $40,000 over the FY06 level.
16. Prior year staff benefit recovery carryforwards are estimated based on preliminary FY05 cost data.
17. In the FY05 fringe benefit rate forward pricing proposal, net health care costs were calculated based upon an incorrect recovery rate for previously incurred health care costs for union employees. As a result of union contract negotiations, the expected employee recovery due in FY05 was spread over a two-year period. The under-recovery generated from this difference would normally be built into our FY07 proposed rate. Since these costs have already been incurred in previous years, we have built the identifiable under-recovery of $1,469,400 for the union groups in the proposed FY06 rates. These carryforward amounts liquidated in the FY06 fringe benefit forward pricing proposal are deducted from the estimated FY05 carryforward amounts.
University of Alaska SB Schedule 2FY07 Staff Benefits Forward Pricing Proposal for Provisional RatesFY07 Staff Benefits Rate Projection
Job Group NR CR XR EX, FN, FR F9 A9,AR FT, FW CT, GT, NT, NX,XX GN,SNExecutives & ST, XT
Nonunion UNAC ACCFT Adjunct Temporary ExtendedClassified AHECTE APT Exempt Faculty Faculty Faculty Faculty Student SS Temporary Student TOTAL
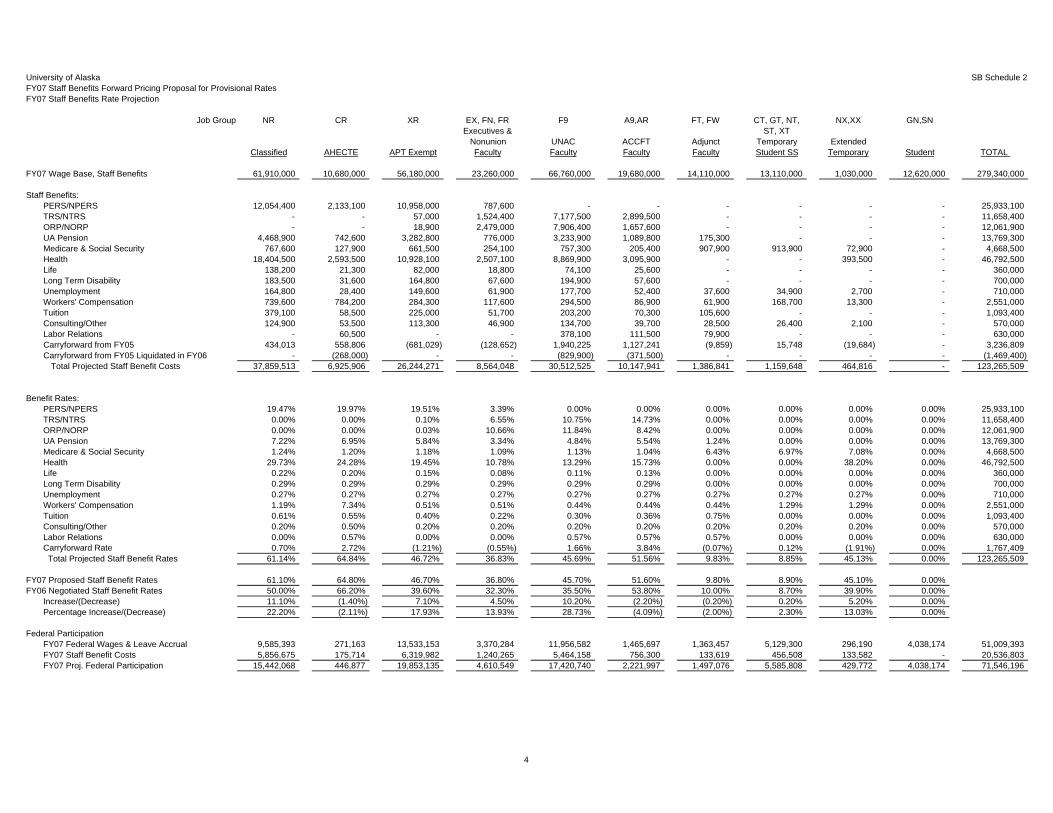
FY07 Wage Base, Staff Benefits 61,910,000 10,680,000 56,180,000 23,260,000 66,760,000 19,680,000 14,110,000 13,110,000 1,030,000 12,620,000 279,340,000
Staff Benefits:PERS/NPERS 12,054,400 2,133,100 10,958,000 787,600 - - - - - - 25,933,100 TRS/NTRS - - 57,000 1,524,400 7,177,500 2,899,500 - - - - 11,658,400 ORP/NORP - - 18,900 2,479,000 7,906,400 1,657,600 - - - - 12,061,900 UA Pension 4,468,900 742,600 3,282,800 776,000 3,233,900 1,089,800 175,300 - - - 13,769,300 Medicare & Social Security 767,600 127,900 661,500 254,100 757,300 205,400 907,900 913,900 72,900 - 4,668,500 Health 18,404,500 2,593,500 10,928,100 2,507,100 8,869,900 3,095,900 - - 393,500 - 46,792,500 Life 138,200 21,300 82,000 18,800 74,100 25,600 - - - - 360,000 Long Term Disability 183,500 31,600 164,800 67,600 194,900 57,600 - - - - 700,000 Unemployment 164,800 28,400 149,600 61,900 177,700 52,400 37,600 34,900 2,700 - 710,000 Workers' Compensation 739,600 784,200 284,300 117,600 294,500 86,900 61,900 168,700 13,300 - 2,551,000 Tuition 379,100 58,500 225,000 51,700 203,200 70,300 105,600 - - - 1,093,400 Consulting/Other 124,900 53,500 113,300 46,900 134,700 39,700 28,500 26,400 2,100 - 570,000 Labor Relations - 60,500 - - 378,100 111,500 79,900 - - - 630,000 Carryforward from FY05 434,013 558,806 (681,029) (128,652) 1,940,225 1,127,241 (9,859) 15,748 (19,684) - 3,236,809 Carryforward from FY05 Liquidated in FY06 - (268,000) - - (829,900) (371,500) - - - - (1,469,400) Total Projected Staff Benefit Costs 37,859,513 6,925,906 26,244,271 8,564,048 30,512,525 10,147,941 1,386,841 1,159,648 464,816 - 123,265,509
Benefit Rates:PERS/NPERS 19.47% 19.97% 19.51% 3.39% 0.00% 0.00% 0.00% 0.00% 0.00% 0.00% 25,933,100TRS/NTRS 0.00% 0.00% 0.10% 6.55% 10.75% 14.73% 0.00% 0.00% 0.00% 0.00% 11,658,400ORP/NORP 0.00% 0.00% 0.03% 10.66% 11.84% 8.42% 0.00% 0.00% 0.00% 0.00% 12,061,900UA Pension 7.22% 6.95% 5.84% 3.34% 4.84% 5.54% 1.24% 0.00% 0.00% 0.00% 13,769,300Medicare & Social Security 1.24% 1.20% 1.18% 1.09% 1.13% 1.04% 6.43% 6.97% 7.08% 0.00% 4,668,500Health 29.73% 24.28% 19.45% 10.78% 13.29% 15.73% 0.00% 0.00% 38.20% 0.00% 46,792,500Life 0.22% 0.20% 0.15% 0.08% 0.11% 0.13% 0.00% 0.00% 0.00% 0.00% 360,000Long Term Disability 0.29% 0.29% 0.29% 0.29% 0.29% 0.29% 0.00% 0.00% 0.00% 0.00% 700,000Unemployment 0.27% 0.27% 0.27% 0.27% 0.27% 0.27% 0.27% 0.27% 0.27% 0.00% 710,000Workers' Compensation 1.19% 7.34% 0.51% 0.51% 0.44% 0.44% 0.44% 1.29% 1.29% 0.00% 2,551,000Tuition 0.61% 0.55% 0.40% 0.22% 0.30% 0.36% 0.75% 0.00% 0.00% 0.00% 1,093,400Consulting/Other 0.20% 0.50% 0.20% 0.20% 0.20% 0.20% 0.20% 0.20% 0.20% 0.00% 570,000Labor Relations 0.00% 0.57% 0.00% 0.00% 0.57% 0.57% 0.57% 0.00% 0.00% 0.00% 630,000Carryforward Rate 0.70% 2.72% (1.21%) (0.55%) 1.66% 3.84% (0.07%) 0.12% (1.91%) 0.00% 1,767,409 Total Projected Staff Benefit Rates 61.14% 64.84% 46.72% 36.83% 45.69% 51.56% 9.83% 8.85% 45.13% 0.00% 123,265,509
FY07 Proposed Staff Benefit Rates 61.10% 64.80% 46.70% 36.80% 45.70% 51.60% 9.80% 8.90% 45.10% 0.00% FY06 Negotiated Staff Benefit Rates 50.00% 66.20% 39.60% 32.30% 35.50% 53.80% 10.00% 8.70% 39.90% 0.00%
Increase/(Decrease) 11.10% (1.40%) 7.10% 4.50% 10.20% (2.20%) (0.20%) 0.20% 5.20% 0.00% Percentage Increase/(Decrease) 22.20% (2.11%) 17.93% 13.93% 28.73% (4.09%) (2.00%) 2.30% 13.03% 0.00%
Federal ParticipationFY07 Federal Wages & Leave Accrual 9,585,393 271,163 13,533,153 3,370,284 11,956,582 1,465,697 1,363,457 5,129,300 296,190 4,038,174 51,009,393 FY07 Staff Benefit Costs 5,856,675 175,714 6,319,982 1,240,265 5,464,158 756,300 133,619 456,508 133,582 - 20,536,803 FY07 Proj. Federal Participation 15,442,068 446,877 19,853,135 4,610,549 17,420,740 2,221,997 1,497,076 5,585,808 429,772 4,038,174 71,546,196
4
University of Alaska SB Schedule 3FY07 Staff Benefits Forward Pricing Proposal for Provisional RatesFY07 Leave Benefit Projection
Job Group NR CR XR EX, FR FN EX, FR, FN F9 AR, A9 FT, FW CT, GT, NT, NX,XX GN,SNExecutives & Less than 12 Mth Executives & ST, XT
12 Mth Nonunion Nonunion Nonunion UNAC ACCFT Adjunct Temporary ExtendedClassified AHECTE APT Exempt Faculty Faculty Faculty Faculty Faculty Faculty Student SS Temporary Student TOTAL
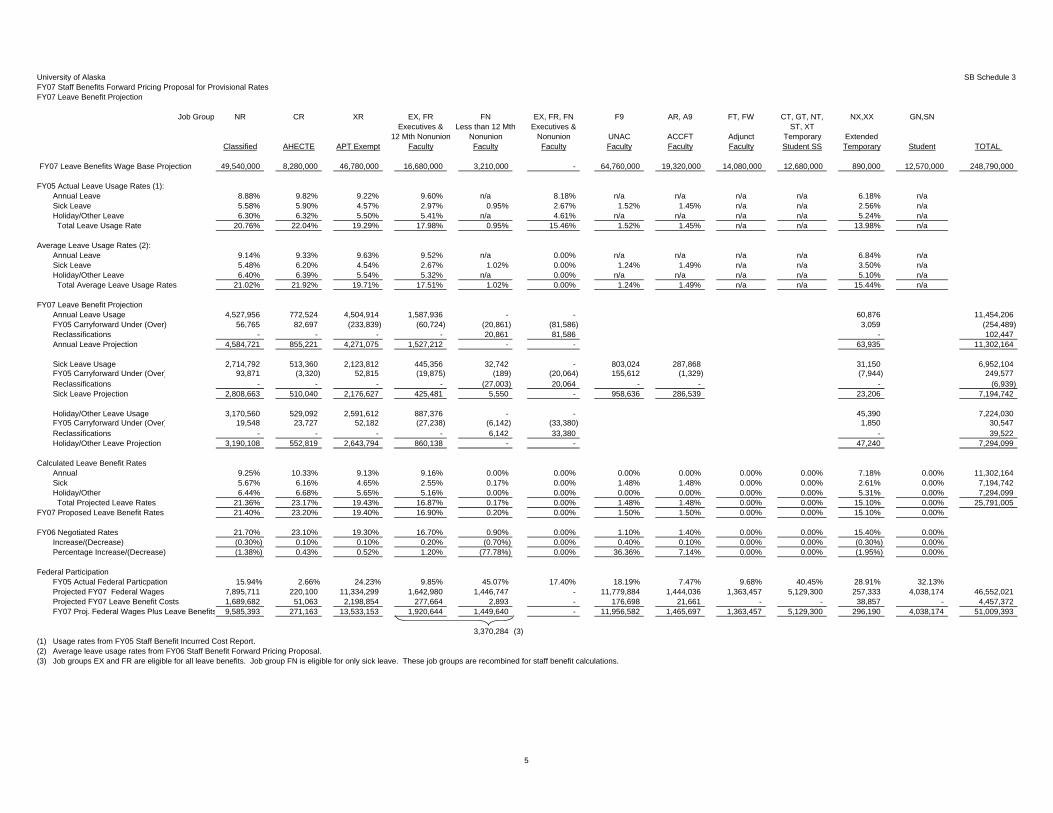
FY07 Leave Benefits Wage Base Projection 49,540,000 8,280,000 46,780,000 16,680,000 3,210,000 - 64,760,000 19,320,000 14,080,000 12,680,000 890,000 12,570,000 248,790,000
FY05 Actual Leave Usage Rates (1):Annual Leave 8.88% 9.82% 9.22% 9.60% n/a 8.18% n/a n/a n/a n/a 6.18% n/aSick Leave 5.58% 5.90% 4.57% 2.97% 0.95% 2.67% 1.52% 1.45% n/a n/a 2.56% n/aHoliday/Other Leave 6.30% 6.32% 5.50% 5.41% n/a 4.61% n/a n/a n/a n/a 5.24% n/a Total Leave Usage Rate 20.76% 22.04% 19.29% 17.98% 0.95% 15.46% 1.52% 1.45% n/a n/a 13.98% n/a
Average Leave Usage Rates (2):Annual Leave 9.14% 9.33% 9.63% 9.52% n/a 0.00% n/a n/a n/a n/a 6.84% n/aSick Leave 5.48% 6.20% 4.54% 2.67% 1.02% 0.00% 1.24% 1.49% n/a n/a 3.50% n/aHoliday/Other Leave 6.40% 6.39% 5.54% 5.32% n/a 0.00% n/a n/a n/a n/a 5.10% n/a Total Average Leave Usage Rates 21.02% 21.92% 19.71% 17.51% 1.02% 0.00% 1.24% 1.49% n/a n/a 15.44% n/a
FY07 Leave Benefit ProjectionAnnual Leave Usage 4,527,956 772,524 4,504,914 1,587,936 - - 60,876 11,454,206 FY05 Carryforward Under (Over) 56,765 82,697 (233,839) (60,724) (20,861) (81,586) 3,059 (254,489) Reclassifications - - - - 20,861 81,586 - 102,447 Annual Leave Projection 4,584,721 855,221 4,271,075 1,527,212 - - 63,935 11,302,164
Sick Leave Usage 2,714,792 513,360 2,123,812 445,356 32,742 - 803,024 287,868 31,150 6,952,104 FY05 Carryforward Under (Over) 93,871 (3,320) 52,815 (19,875) (189) (20,064) 155,612 (1,329) (7,944) 249,577 Reclassifications - - - - (27,003) 20,064 - - - (6,939) Sick Leave Projection 2,808,663 510,040 2,176,627 425,481 5,550 - 958,636 286,539 23,206 7,194,742
Holiday/Other Leave Usage 3,170,560 529,092 2,591,612 887,376 - - 45,390 7,224,030 FY05 Carryforward Under (Over) 19,548 23,727 52,182 (27,238) (6,142) (33,380) 1,850 30,547 Reclassifications - - - - 6,142 33,380 - 39,522 Holiday/Other Leave Projection 3,190,108 552,819 2,643,794 860,138 - - 47,240 7,294,099
Calculated Leave Benefit RatesAnnual 9.25% 10.33% 9.13% 9.16% 0.00% 0.00% 0.00% 0.00% 0.00% 0.00% 7.18% 0.00% 11,302,164Sick 5.67% 6.16% 4.65% 2.55% 0.17% 0.00% 1.48% 1.48% 0.00% 0.00% 2.61% 0.00% 7,194,742Holiday/Other 6.44% 6.68% 5.65% 5.16% 0.00% 0.00% 0.00% 0.00% 0.00% 0.00% 5.31% 0.00% 7,294,099 Total Projected Leave Rates 21.36% 23.17% 19.43% 16.87% 0.17% 0.00% 1.48% 1.48% 0.00% 0.00% 15.10% 0.00% 25,791,005
FY07 Proposed Leave Benefit Rates 21.40% 23.20% 19.40% 16.90% 0.20% 0.00% 1.50% 1.50% 0.00% 0.00% 15.10% 0.00%
FY06 Negotiated Rates 21.70% 23.10% 19.30% 16.70% 0.90% 0.00% 1.10% 1.40% 0.00% 0.00% 15.40% 0.00% Increase/(Decrease) (0.30%) 0.10% 0.10% 0.20% (0.70%) 0.00% 0.40% 0.10% 0.00% 0.00% (0.30%) 0.00% Percentage Increase/(Decrease) (1.38%) 0.43% 0.52% 1.20% (77.78%) 0.00% 36.36% 7.14% 0.00% 0.00% (1.95%) 0.00%
Federal ParticipationFY05 Actual Federal Particpation 15.94% 2.66% 24.23% 9.85% 45.07% 17.40% 18.19% 7.47% 9.68% 40.45% 28.91% 32.13% Projected FY07 Federal Wages 7,895,711 220,100 11,334,299 1,642,980 1,446,747 - 11,779,884 1,444,036 1,363,457 5,129,300 257,333 4,038,174 46,552,021 Projected FY07 Leave Benefit Costs 1,689,682 51,063 2,198,854 277,664 2,893 - 176,698 21,661 - - 38,857 - 4,457,372 FY07 Proj. Federal Wages Plus Leave Benefits 9,585,393 271,163 13,533,153 1,920,644 1,449,640 - 11,956,582 1,465,697 1,363,457 5,129,300 296,190 4,038,174 51,009,393
3,370,284 (3)(1) Usage rates from FY05 Staff Benefit Incurred Cost Report.(2) Average leave usage rates from FY06 Staff Benefit Forward Pricing Proposal.(3) Job groups EX and FR are eligible for all leave benefits. Job group FN is eligible for only sick leave. These job groups are recombined for staff benefit calculations.
5
snvmb
Rectangle
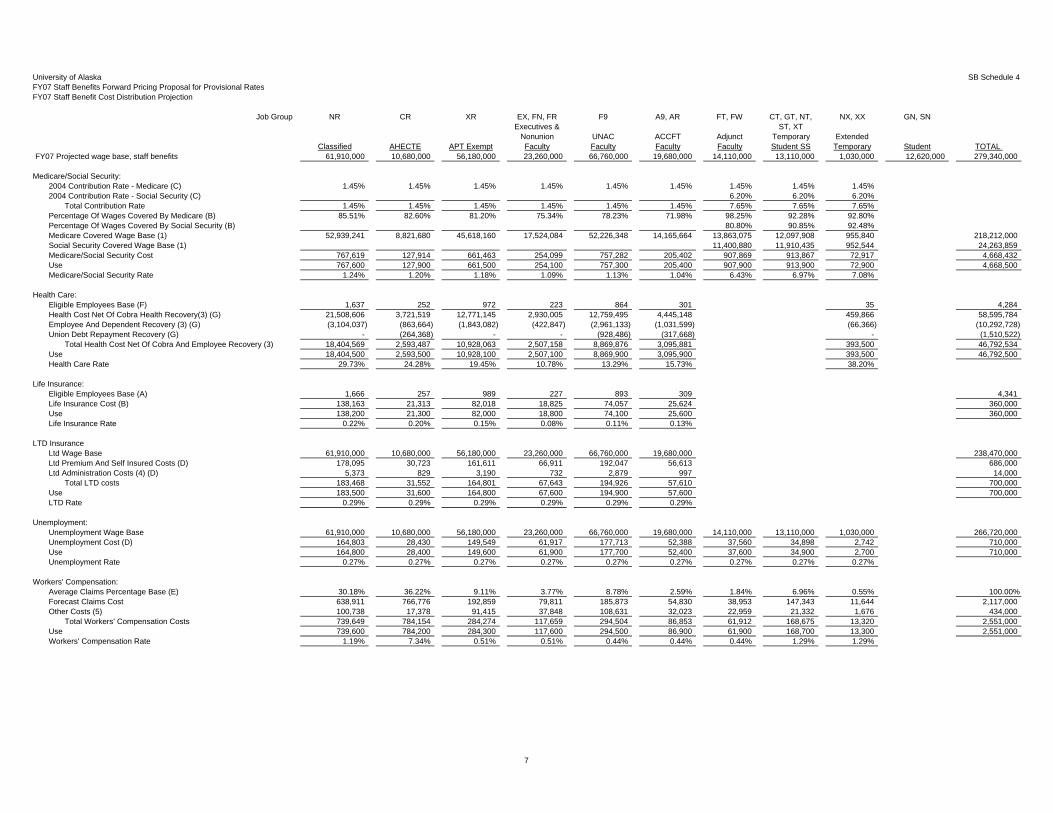
University of Alaska SB Schedule 4FY07 Staff Benefits Forward Pricing Proposal for Provisional RatesFY07 Staff Benefit Cost Distribution Projection
Job Group NR CR XR EX, FN, FR F9 A9, AR FT, FW CT, GT, NT, NX, XX GN, SNExecutives & ST, XT
Nonunion UNAC ACCFT Adjunct Temporary ExtendedClassified AHECTE APT Exempt Faculty Faculty Faculty Faculty Student SS Temporary Student TOTAL
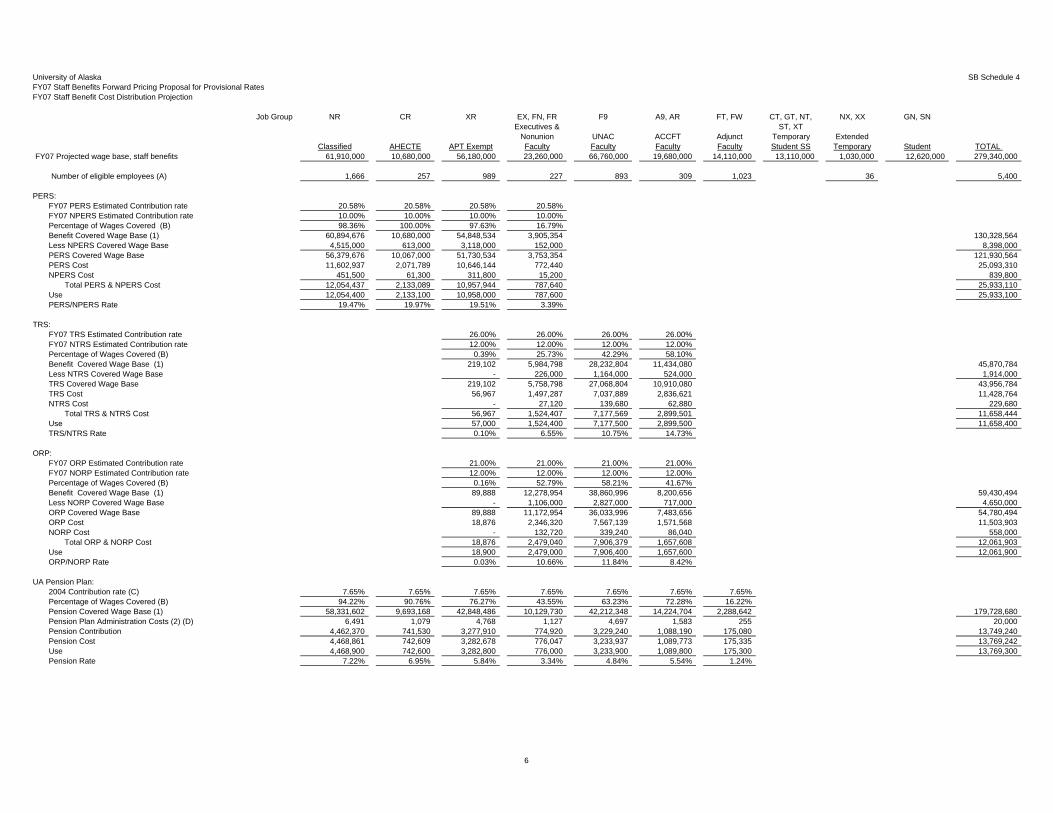
FY07 Projected wage base, staff benefits 61,910,000 10,680,000 56,180,000 23,260,000 66,760,000 19,680,000 14,110,000 13,110,000 1,030,000 12,620,000 279,340,000
Number of eligible employees (A) 1,666 257 989 227 893 309 1,023 36 5,400
PERS:FY07 PERS Estimated Contribution rate 20.58% 20.58% 20.58% 20.58% FY07 NPERS Estimated Contribution rate 10.00% 10.00% 10.00% 10.00% Percentage of Wages Covered (B) 98.36% 100.00% 97.63% 16.79% Benefit Covered Wage Base (1) 60,894,676 10,680,000 54,848,534 3,905,354 130,328,564 Less NPERS Covered Wage Base 4,515,000 613,000 3,118,000 152,000 8,398,000 PERS Covered Wage Base 56,379,676 10,067,000 51,730,534 3,753,354 121,930,564 PERS Cost 11,602,937 2,071,789 10,646,144 772,440 25,093,310 NPERS Cost 451,500 61,300 311,800 15,200 839,800
Total PERS & NPERS Cost 12,054,437 2,133,089 10,957,944 787,640 25,933,110 Use 12,054,400 2,133,100 10,958,000 787,600 25,933,100 PERS/NPERS Rate 19.47% 19.97% 19.51% 3.39%
TRS:FY07 TRS Estimated Contribution rate 26.00% 26.00% 26.00% 26.00% FY07 NTRS Estimated Contribution rate 12.00% 12.00% 12.00% 12.00% Percentage of Wages Covered (B) 0.39% 25.73% 42.29% 58.10% Benefit Covered Wage Base (1) 219,102 5,984,798 28,232,804 11,434,080 45,870,784 Less NTRS Covered Wage Base - 226,000 1,164,000 524,000 1,914,000 TRS Covered Wage Base 219,102 5,758,798 27,068,804 10,910,080 43,956,784 TRS Cost 56,967 1,497,287 7,037,889 2,836,621 11,428,764 NTRS Cost - 27,120 139,680 62,880 229,680
Total TRS & NTRS Cost 56,967 1,524,407 7,177,569 2,899,501 11,658,444 Use 57,000 1,524,400 7,177,500 2,899,500 11,658,400 TRS/NTRS Rate 0.10% 6.55% 10.75% 14.73%
ORP:FY07 ORP Estimated Contribution rate 21.00% 21.00% 21.00% 21.00% FY07 NORP Estimated Contribution rate 12.00% 12.00% 12.00% 12.00% Percentage of Wages Covered (B) 0.16% 52.79% 58.21% 41.67% Benefit Covered Wage Base (1) 89,888 12,278,954 38,860,996 8,200,656 59,430,494 Less NORP Covered Wage Base - 1,106,000 2,827,000 717,000 4,650,000 ORP Covered Wage Base 89,888 11,172,954 36,033,996 7,483,656 54,780,494 ORP Cost 18,876 2,346,320 7,567,139 1,571,568 11,503,903 NORP Cost - 132,720 339,240 86,040 558,000
Total ORP & NORP Cost 18,876 2,479,040 7,906,379 1,657,608 12,061,903 Use 18,900 2,479,000 7,906,400 1,657,600 12,061,900 ORP/NORP Rate 0.03% 10.66% 11.84% 8.42%
UA Pension Plan:2004 Contribution rate (C) 7.65% 7.65% 7.65% 7.65% 7.65% 7.65% 7.65% Percentage of Wages Covered (B) 94.22% 90.76% 76.27% 43.55% 63.23% 72.28% 16.22% Pension Covered Wage Base (1) 58,331,602 9,693,168 42,848,486 10,129,730 42,212,348 14,224,704 2,288,642 179,728,680 Pension Plan Administration Costs (2) (D) 6,491 1,079 4,768 1,127 4,697 1,583 255 20,000 Pension Contribution 4,462,370 741,530 3,277,910 774,920 3,229,240 1,088,190 175,080 13,749,240 Pension Cost 4,468,861 742,609 3,282,678 776,047 3,233,937 1,089,773 175,335 13,769,242 Use 4,468,900 742,600 3,282,800 776,000 3,233,900 1,089,800 175,300 13,769,300 Pension Rate 7.22% 6.95% 5.84% 3.34% 4.84% 5.54% 1.24%
6
University of Alaska SB Schedule 4FY07 Staff Benefits Forward Pricing Proposal for Provisional RatesFY07 Staff Benefit Cost Distribution Projection
Job Group NR CR XR EX, FN, FR F9 A9, AR FT, FW CT, GT, NT, NX, XX GN, SNExecutives & ST, XT
Nonunion UNAC ACCFT Adjunct Temporary ExtendedClassified AHECTE APT Exempt Faculty Faculty Faculty Faculty Student SS Temporary Student TOTAL
FY07 Projected wage base, staff benefits 61,910,000 10,680,000 56,180,000 23,260,000 66,760,000 19,680,000 14,110,000 13,110,000 1,030,000 12,620,000 279,340,000
Medicare/Social Security:2004 Contribution Rate - Medicare (C) 1.45% 1.45% 1.45% 1.45% 1.45% 1.45% 1.45% 1.45% 1.45% 2004 Contribution Rate - Social Security (C) 6.20% 6.20% 6.20%
Total Contribution Rate 1.45% 1.45% 1.45% 1.45% 1.45% 1.45% 7.65% 7.65% 7.65% Percentage Of Wages Covered By Medicare (B) 85.51% 82.60% 81.20% 75.34% 78.23% 71.98% 98.25% 92.28% 92.80% Percentage Of Wages Covered By Social Security (B) 80.80% 90.85% 92.48% Medicare Covered Wage Base (1) 52,939,241 8,821,680 45,618,160 17,524,084 52,226,348 14,165,664 13,863,075 12,097,908 955,840 218,212,000 Social Security Covered Wage Base (1) 11,400,880 11,910,435 952,544 24,263,859 Medicare/Social Security Cost 767,619 127,914 661,463 254,099 757,282 205,402 907,869 913,867 72,917 4,668,432 Use 767,600 127,900 661,500 254,100 757,300 205,400 907,900 913,900 72,900 4,668,500 Medicare/Social Security Rate 1.24% 1.20% 1.18% 1.09% 1.13% 1.04% 6.43% 6.97% 7.08%
Health Care:Eligible Employees Base (F) 1,637 252 972 223 864 301 35 4,284 Health Cost Net Of Cobra Health Recovery(3) (G) 21,508,606 3,721,519 12,771,145 2,930,005 12,759,495 4,445,148 459,866 58,595,784 Employee And Dependent Recovery (3) (G) (3,104,037) (863,664) (1,843,082) (422,847) (2,961,133) (1,031,599) (66,366) (10,292,728) Union Debt Repayment Recovery (G) - (264,368) - - (928,486) (317,668) - (1,510,522)
Total Health Cost Net Of Cobra And Employee Recovery (3) 18,404,569 2,593,487 10,928,063 2,507,158 8,869,876 3,095,881 393,500 46,792,534 Use 18,404,500 2,593,500 10,928,100 2,507,100 8,869,900 3,095,900 393,500 46,792,500 Health Care Rate 29.73% 24.28% 19.45% 10.78% 13.29% 15.73% 38.20%
Life Insurance:Eligible Employees Base (A) 1,666 257 989 227 893 309 4,341 Life Insurance Cost (B) 138,163 21,313 82,018 18,825 74,057 25,624 360,000 Use 138,200 21,300 82,000 18,800 74,100 25,600 360,000 Life Insurance Rate 0.22% 0.20% 0.15% 0.08% 0.11% 0.13%
LTD InsuranceLtd Wage Base 61,910,000 10,680,000 56,180,000 23,260,000 66,760,000 19,680,000 238,470,000 Ltd Premium And Self Insured Costs (D) 178,095 30,723 161,611 66,911 192,047 56,613 686,000 Ltd Administration Costs (4) (D) 5,373 829 3,190 732 2,879 997 14,000
Total LTD costs 183,468 31,552 164,801 67,643 194,926 57,610 700,000 Use 183,500 31,600 164,800 67,600 194,900 57,600 700,000 LTD Rate 0.29% 0.29% 0.29% 0.29% 0.29% 0.29%
Unemployment:Unemployment Wage Base 61,910,000 10,680,000 56,180,000 23,260,000 66,760,000 19,680,000 14,110,000 13,110,000 1,030,000 266,720,000 Unemployment Cost (D) 164,803 28,430 149,549 61,917 177,713 52,388 37,560 34,898 2,742 710,000 Use 164,800 28,400 149,600 61,900 177,700 52,400 37,600 34,900 2,700 710,000 Unemployment Rate 0.27% 0.27% 0.27% 0.27% 0.27% 0.27% 0.27% 0.27% 0.27%
Workers' Compensation:Average Claims Percentage Base (E) 30.18% 36.22% 9.11% 3.77% 8.78% 2.59% 1.84% 6.96% 0.55% 100.00%Forecast Claims Cost 638,911 766,776 192,859 79,811 185,873 54,830 38,953 147,343 11,644 2,117,000 Other Costs (5) 100,738 17,378 91,415 37,848 108,631 32,023 22,959 21,332 1,676 434,000
Total Workers' Compensation Costs 739,649 784,154 284,274 117,659 294,504 86,853 61,912 168,675 13,320 2,551,000 Use 739,600 784,200 284,300 117,600 294,500 86,900 61,900 168,700 13,300 2,551,000 Workers' Compensation Rate 1.19% 7.34% 0.51% 0.51% 0.44% 0.44% 0.44% 1.29% 1.29%
7
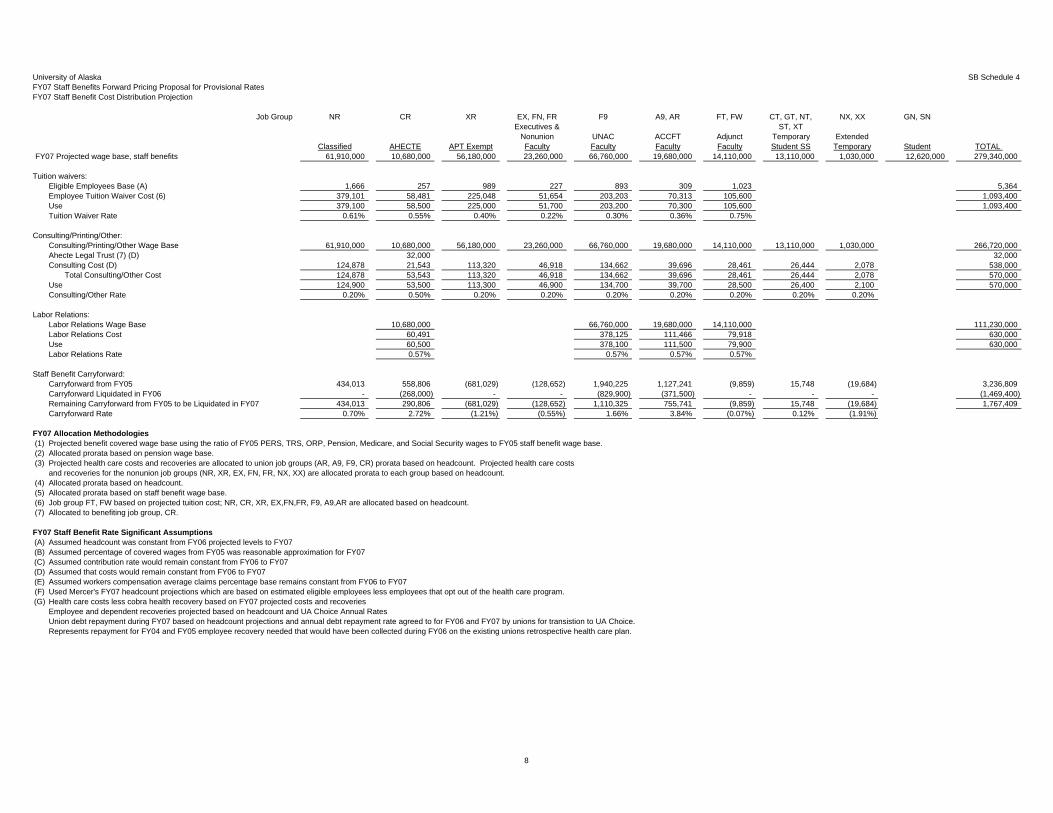
University of Alaska SB Schedule 4FY07 Staff Benefits Forward Pricing Proposal for Provisional RatesFY07 Staff Benefit Cost Distribution Projection
Job Group NR CR XR EX, FN, FR F9 A9, AR FT, FW CT, GT, NT, NX, XX GN, SNExecutives & ST, XT
Nonunion UNAC ACCFT Adjunct Temporary ExtendedClassified AHECTE APT Exempt Faculty Faculty Faculty Faculty Student SS Temporary Student TOTAL
FY07 Projected wage base, staff benefits 61,910,000 10,680,000 56,180,000 23,260,000 66,760,000 19,680,000 14,110,000 13,110,000 1,030,000 12,620,000 279,340,000
Tuition waivers:Eligible Employees Base (A) 1,666 257 989 227 893 309 1,023 5,364 Employee Tuition Waiver Cost (6) 379,101 58,481 225,048 51,654 203,203 70,313 105,600 1,093,400 Use 379,100 58,500 225,000 51,700 203,200 70,300 105,600 1,093,400 Tuition Waiver Rate 0.61% 0.55% 0.40% 0.22% 0.30% 0.36% 0.75%
Consulting/Printing/Other:Consulting/Printing/Other Wage Base 61,910,000 10,680,000 56,180,000 23,260,000 66,760,000 19,680,000 14,110,000 13,110,000 1,030,000 266,720,000 Ahecte Legal Trust (7) (D) 32,000 32,000 Consulting Cost (D) 124,878 21,543 113,320 46,918 134,662 39,696 28,461 26,444 2,078 538,000
Total Consulting/Other Cost 124,878 53,543 113,320 46,918 134,662 39,696 28,461 26,444 2,078 570,000 Use 124,900 53,500 113,300 46,900 134,700 39,700 28,500 26,400 2,100 570,000 Consulting/Other Rate 0.20% 0.50% 0.20% 0.20% 0.20% 0.20% 0.20% 0.20% 0.20%
Labor Relations:Labor Relations Wage Base 10,680,000 66,760,000 19,680,000 14,110,000 111,230,000 Labor Relations Cost 60,491 378,125 111,466 79,918 630,000 Use 60,500 378,100 111,500 79,900 630,000 Labor Relations Rate 0.57% 0.57% 0.57% 0.57%
Staff Benefit Carryforward:Carryforward from FY05 434,013 558,806 (681,029) (128,652) 1,940,225 1,127,241 (9,859) 15,748 (19,684) 3,236,809 Carryforward Liquidated in FY06 - (268,000) - - (829,900) (371,500) - - - (1,469,400) Remaining Carryforward from FY05 to be Liquidated in FY07 434,013 290,806 (681,029) (128,652) 1,110,325 755,741 (9,859) 15,748 (19,684) 1,767,409 Carryforward Rate 0.70% 2.72% (1.21%) (0.55%) 1.66% 3.84% (0.07%) 0.12% (1.91%)
FY07 Allocation Methodologies(1) Projected benefit covered wage base using the ratio of FY05 PERS, TRS, ORP, Pension, Medicare, and Social Security wages to FY05 staff benefit wage base.(2) Allocated prorata based on pension wage base.(3) Projected health care costs and recoveries are allocated to union job groups (AR, A9, F9, CR) prorata based on headcount. Projected health care costs
and recoveries for the nonunion job groups (NR, XR, EX, FN, FR, NX, XX) are allocated prorata to each group based on headcount.(4) Allocated prorata based on headcount.(5) Allocated prorata based on staff benefit wage base.(6) Job group FT, FW based on projected tuition cost; NR, CR, XR, EX,FN,FR, F9, A9,AR are allocated based on headcount.(7) Allocated to benefiting job group, CR.
FY07 Staff Benefit Rate Significant Assumptions(A) Assumed headcount was constant from FY06 projected levels to FY07(B) Assumed percentage of covered wages from FY05 was reasonable approximation for FY07(C) Assumed contribution rate would remain constant from FY06 to FY07(D) Assumed that costs would remain constant from FY06 to FY07(E) Assumed workers compensation average claims percentage base remains constant from FY06 to FY07(F) Used Mercer's FY07 headcount projections which are based on estimated eligible employees less employees that opt out of the health care program.(G) Health care costs less cobra health recovery based on FY07 projected costs and recoveries
Employee and dependent recoveries projected based on headcount and UA Choice Annual RatesUnion debt repayment during FY07 based on headcount projections and annual debt repayment rate agreed to for FY06 and FY07 by unions for transistion to UA Choice.Represents repayment for FY04 and FY05 employee recovery needed that would have been collected during FY06 on the existing unions retrospective health care plan.
8
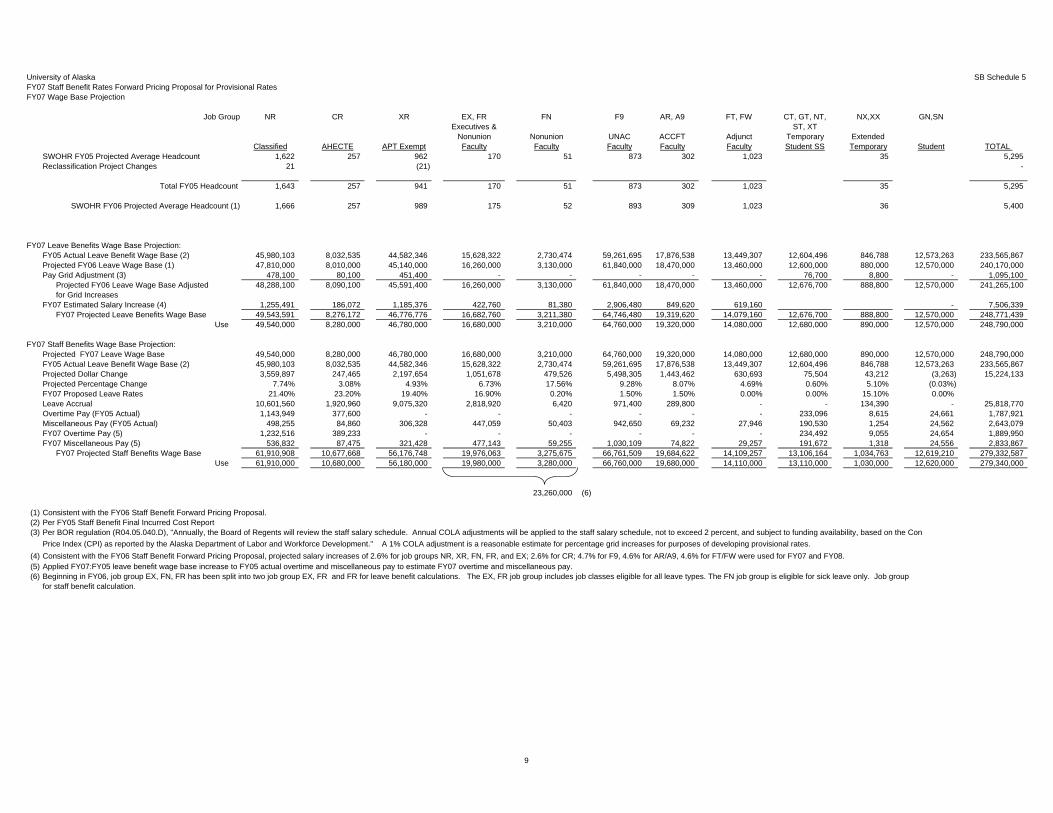
University of Alaska SB Schedule 5FY07 Staff Benefit Rates Forward Pricing Proposal for Provisional RatesFY07 Wage Base Projection
Job Group NR CR XR EX, FR FN F9 AR, A9 FT, FW CT, GT, NT, NX,XX GN,SNExecutives & ST, XT
Nonunion Nonunion UNAC ACCFT Adjunct Temporary ExtendedClassified AHECTE APT Exempt Faculty Faculty Faculty Faculty Faculty Student SS Temporary Student TOTAL
SWOHR FY05 Projected Average Headcount 1,622 257 962 170 51 873 302 1,023 35 5,295 Reclassification Project Changes 21 (21) -
Total FY05 Headcount 1,643 257 941 170 51 873 302 1,023 35 5,295
SWOHR FY06 Projected Average Headcount (1) 1,666 257 989 175 52 893 309 1,023 36 5,400
FY07 Leave Benefits Wage Base Projection:FY05 Actual Leave Benefit Wage Base (2) 45,980,103 8,032,535 44,582,346 15,628,322 2,730,474 59,261,695 17,876,538 13,449,307 12,604,496 846,788 12,573,263 233,565,867Projected FY06 Leave Wage Base (1) 47,810,000 8,010,000 45,140,000 16,260,000 3,130,000 61,840,000 18,470,000 13,460,000 12,600,000 880,000 12,570,000 240,170,000Pay Grid Adjustment (3) 478,100 80,100 451,400 - - - - - 76,700 8,800 - 1,095,100
Projected FY06 Leave Wage Base Adjusted 48,288,100 8,090,100 45,591,400 16,260,000 3,130,000 61,840,000 18,470,000 13,460,000 12,676,700 888,800 12,570,000 241,265,100 for Grid Increases
FY07 Estimated Salary Increase (4) 1,255,491 186,072 1,185,376 422,760 81,380 2,906,480 849,620 619,160 - 7,506,339 FY07 Projected Leave Benefits Wage Base 49,543,591 8,276,172 46,776,776 16,682,760 3,211,380 64,746,480 19,319,620 14,079,160 12,676,700 888,800 12,570,000 248,771,439
Use 49,540,000 8,280,000 46,780,000 16,680,000 3,210,000 64,760,000 19,320,000 14,080,000 12,680,000 890,000 12,570,000 248,790,000
FY07 Staff Benefits Wage Base Projection:Projected FY07 Leave Wage Base 49,540,000 8,280,000 46,780,000 16,680,000 3,210,000 64,760,000 19,320,000 14,080,000 12,680,000 890,000 12,570,000 248,790,000 FY05 Actual Leave Benefit Wage Base (2) 45,980,103 8,032,535 44,582,346 15,628,322 2,730,474 59,261,695 17,876,538 13,449,307 12,604,496 846,788 12,573,263 233,565,867 Projected Dollar Change 3,559,897 247,465 2,197,654 1,051,678 479,526 5,498,305 1,443,462 630,693 75,504 43,212 (3,263) 15,224,133 Projected Percentage Change 7.74% 3.08% 4.93% 6.73% 17.56% 9.28% 8.07% 4.69% 0.60% 5.10% (0.03%)FY07 Proposed Leave Rates 21.40% 23.20% 19.40% 16.90% 0.20% 1.50% 1.50% 0.00% 0.00% 15.10% 0.00% Leave Accrual 10,601,560 1,920,960 9,075,320 2,818,920 6,420 971,400 289,800 - - 134,390 - 25,818,770 Overtime Pay (FY05 Actual) 1,143,949 377,600 - - - - - - 233,096 8,615 24,661 1,787,921 Miscellaneous Pay (FY05 Actual) 498,255 84,860 306,328 447,059 50,403 942,650 69,232 27,946 190,530 1,254 24,562 2,643,079 FY07 Overtime Pay (5) 1,232,516 389,233 - - - - - - 234,492 9,055 24,654 1,889,950 FY07 Miscellaneous Pay (5) 536,832 87,475 321,428 477,143 59,255 1,030,109 74,822 29,257 191,672 1,318 24,556 2,833,867
FY07 Projected Staff Benefits Wage Base 61,910,908 10,677,668 56,176,748 19,976,063 3,275,675 66,761,509 19,684,622 14,109,257 13,106,164 1,034,763 12,619,210 279,332,587 Use 61,910,000 10,680,000 56,180,000 19,980,000 3,280,000 66,760,000 19,680,000 14,110,000 13,110,000 1,030,000 12,620,000 279,340,000
23,260,000 (6)
(1) Consistent with the FY06 Staff Benefit Forward Pricing Proposal.(2) Per FY05 Staff Benefit Final Incurred Cost Report(3) Per BOR regulation (R04.05.040.D), "Annually, the Board of Regents will review the staff salary schedule. Annual COLA adjustments will be applied to the staff salary schedule, not to exceed 2 percent, and subject to funding availability, based on the Con
Price Index (CPI) as reported by the Alaska Department of Labor and Workforce Development." A 1% COLA adjustment is a reasonable estimate for percentage grid increases for purposes of developing provisional rates.(4) Consistent with the FY06 Staff Benefit Forward Pricing Proposal, projected salary increases of 2.6% for job groups NR, XR, FN, FR, and EX; 2.6% for CR; 4.7% for F9, 4.6% for AR/A9, 4.6% for FT/FW were used for FY07 and FY08.(5) Applied FY07:FY05 leave benefit wage base increase to FY05 actual overtime and miscellaneous pay to estimate FY07 overtime and miscellaneous pay.(6) Beginning in FY06, job group EX, FN, FR has been split into two job group EX, FR and FR for leave benefit calculations. The EX, FR job group includes job classes eligible for all leave types. The FN job group is eligible for sick leave only. Job group
for staff benefit calculation.
9
snvmb
Rectangle