FY 2020 CEN Strategy Progress - United States Department ...
38
UNCLASSIFIED UNCLASSIFIED 1 PROGRESS REPORT FOR THE UNITED STATES STRATEGY FOR CENTRAL AMERICA’S PLAN FOR MONITORING AND EVALUATION Consistent with House Report 116-78 accompanying the Department of State, Foreign Operations, and Related Programs Appropriations, 2020 (Div. G, P.L. 116-94), the U.S. Department of State and the U.S. Agency for International Development (USAID) hereby submit a progress report on the plan for monitoring and evaluation for the United States Strategy for Central America (Strategy). A public version of this report will be posted to the Department of State and USAID websites, available at www.state.gov/p/wha/rt/strat and www.usaid.gov/central-america. PROGRESS REPORT BACKGROUND Consistent with the joint explanatory statements accompanying the Department of State, Foreign Operations, and Related Programs Appropriations Act, 2016 (Div. K., P.L. 114-113); the Department of State, Foreign Operations, and Related Programs Appropriations Act, 2017 (Div. J., P.L. 115-31); the Department of State, Foreign Operations, and Related Programs Appropriations Act, 2018 (Div. K., P.L. 115-141); the Department of State, Foreign Operations, and Related Programs Appropriations Act, 2019 (Div. F, P.L. 116-6); and the House Report 116- 78 accompanying the FY 2020 SFOAA, the Department of State and USAID consolidated data across all sources of funding for programs implemented under the Strategy. This progress report provides detailed data, by country, for an updated set of performance and context indicators included in the previous monitoring and evaluation progress report transmitted to Congress on May 22, 2019. In March 2019, the President announced the suspension of assistance to El Salvador, Guatemala, and Honduras to encourage these countries to do more to prevent illegal immigration to the United States. Since then, enhanced migration cooperation with these governments has contributed to sharp declines in border arrivals. Department of Homeland Security (DHS) encounters of Salvadoran, Guatemalan, and Honduran migrants along the U.S. southern border decreased from 623,666 in FY 2019 to 93,679 in the first eleven months in FY 2020 (October 2019 to August 2020). The three governments have also signed a combined 15 agreements and arrangements with the United States to enhance border security, increase asylum cooperation, strengthen information sharing, and promote access to temporary employment opportunities in the United States. As a result of the significant reduction in illegal immigration flows, the White House supports moving forward with U.S. assistance to El Salvador, Guatemala, and Honduras. The suspension in assistance has impacted some foreign assistance programs and reduced the results achieved since the last report, due to descoping, rescoping, or ending programs. Prior to the end of FY 2019, the Department of State and USAID reprogrammed approximately $396 million of FY 2018 foreign assistance planned for El Salvador, Guatemala, and Honduras to other priorities, including support for the Venezuela crisis, Colombia counternarcotics efforts, development priorities in Latin America and Africa, and the Indo-Pacific Strategy. Funding to other Central American countries continued as planned, with an additional $10 million in FY
Transcript of FY 2020 CEN Strategy Progress - United States Department ...

UNCLASSIFIED
UNCLASSIFIED 1
PROGRESS REPORT FOR THE UNITED STATES STRATEGY FOR CENTRAL
AMERICA’S PLAN FOR MONITORING AND EVALUATION
Consistent with House Report 116-78 accompanying the Department of State, Foreign
Operations, and Related Programs Appropriations, 2020 (Div. G, P.L. 116-94), the U.S.
Department of State and the U.S. Agency for International Development (USAID) hereby submit
a progress report on the plan for monitoring and evaluation for the United States Strategy for
Central America (Strategy). A public version of this report will be posted to the Department of
State and USAID websites, available at www.state.gov/p/wha/rt/strat and
www.usaid.gov/central-america.
PROGRESS REPORT BACKGROUND
Consistent with the joint explanatory statements accompanying the Department of State, Foreign
Operations, and Related Programs Appropriations Act, 2016 (Div. K., P.L. 114-113); the
Department of State, Foreign Operations, and Related Programs Appropriations Act, 2017 (Div.
J., P.L. 115-31); the Department of State, Foreign Operations, and Related Programs
Appropriations Act, 2018 (Div. K., P.L. 115-141); the Department of State, Foreign Operations,
and Related Programs Appropriations Act, 2019 (Div. F, P.L. 116-6); and the House Report 116-
78 accompanying the FY 2020 SFOAA, the Department of State and USAID consolidated data
across all sources of funding for programs implemented under the Strategy. This progress report
provides detailed data, by country, for an updated set of performance and context indicators
included in the previous monitoring and evaluation progress report transmitted to Congress on
May 22, 2019.
In March 2019, the President announced the suspension of assistance to El Salvador, Guatemala,
and Honduras to encourage these countries to do more to prevent illegal immigration to the
United States. Since then, enhanced migration cooperation with these governments has
contributed to sharp declines in border arrivals. Department of Homeland Security (DHS)
encounters of Salvadoran, Guatemalan, and Honduran migrants along the U.S. southern
border decreased from 623,666 in FY 2019 to 93,679 in the first eleven months in FY 2020
(October 2019 to August 2020). The three governments have also signed a combined
15 agreements and arrangements with the United States to enhance border
security, increase asylum cooperation, strengthen information sharing, and promote access to
temporary employment opportunities in the United States. As a result of the significant
reduction in illegal immigration flows, the White House supports moving forward
with U.S. assistance to El Salvador, Guatemala, and Honduras.
The suspension in assistance has impacted some foreign assistance programs and reduced the
results achieved since the last report, due to descoping, rescoping, or ending programs. Prior to
the end of FY 2019, the Department of State and USAID reprogrammed approximately $396
million of FY 2018 foreign assistance planned for El Salvador, Guatemala, and Honduras to
other priorities, including support for the Venezuela crisis, Colombia counternarcotics efforts,
development priorities in Latin America and Africa, and the Indo-Pacific Strategy. Funding to
other Central American countries continued as planned, with an additional $10 million in FY
UNCLASSIFIED
UNCLASSIFIED 2
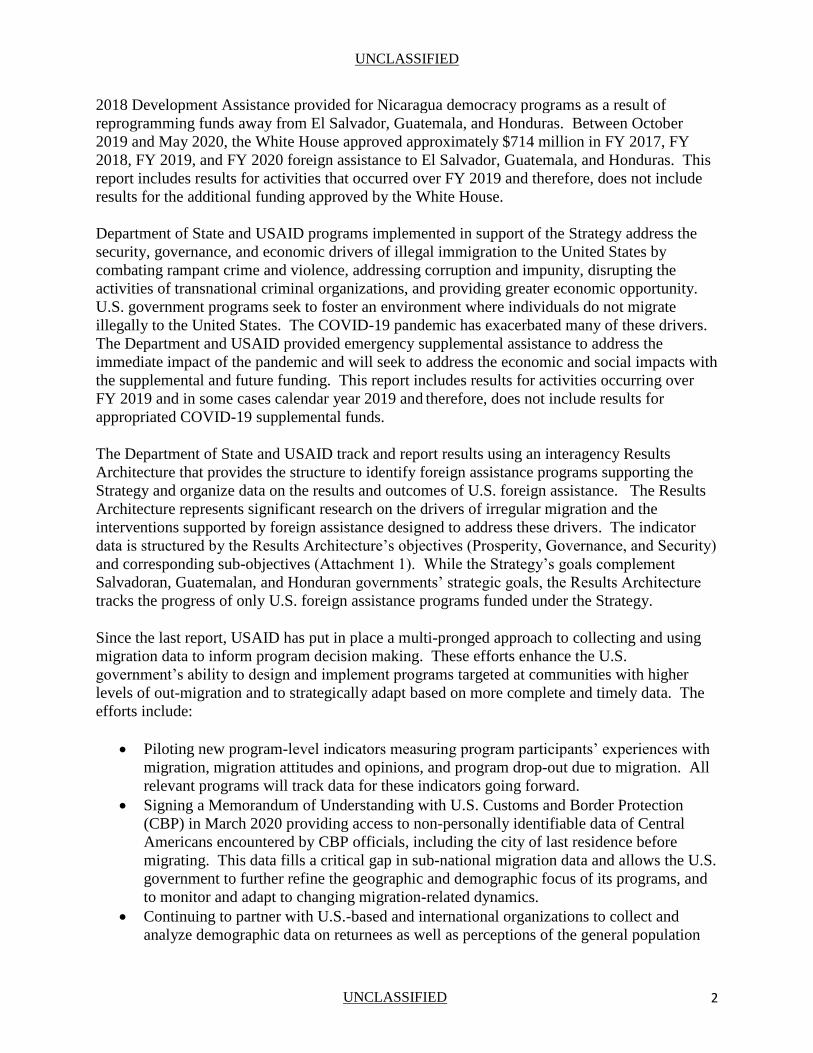
2018 Development Assistance provided for Nicaragua democracy programs as a result of
reprogramming funds away from El Salvador, Guatemala, and Honduras. Between October
2019 and May 2020, the White House approved approximately $714 million in FY 2017, FY
2018, FY 2019, and FY 2020 foreign assistance to El Salvador, Guatemala, and Honduras. This
report includes results for activities that occurred over FY 2019 and therefore, does not include
results for the additional funding approved by the White House.
Department of State and USAID programs implemented in support of the Strategy address the
security, governance, and economic drivers of illegal immigration to the United States by
combating rampant crime and violence, addressing corruption and impunity, disrupting the
activities of transnational criminal organizations, and providing greater economic opportunity.
U.S. government programs seek to foster an environment where individuals do not migrate
illegally to the United States. The COVID-19 pandemic has exacerbated many of these drivers.
The Department and USAID provided emergency supplemental assistance to address the
immediate impact of the pandemic and will seek to address the economic and social impacts with
the supplemental and future funding. This report includes results for activities occurring over
FY 2019 and in some cases calendar year 2019 and therefore, does not include results for
appropriated COVID-19 supplemental funds.
The Department of State and USAID track and report results using an interagency Results
Architecture that provides the structure to identify foreign assistance programs supporting the
Strategy and organize data on the results and outcomes of U.S. foreign assistance. The Results
Architecture represents significant research on the drivers of irregular migration and the
interventions supported by foreign assistance designed to address these drivers. The indicator
data is structured by the Results Architecture’s objectives (Prosperity, Governance, and Security)
and corresponding sub-objectives (Attachment 1). While the Strategy’s goals complement
Salvadoran, Guatemalan, and Honduran governments’ strategic goals, the Results Architecture
tracks the progress of only U.S. foreign assistance programs funded under the Strategy.
Since the last report, USAID has put in place a multi-pronged approach to collecting and using
migration data to inform program decision making. These efforts enhance the U.S.
government’s ability to design and implement programs targeted at communities with higher
levels of out-migration and to strategically adapt based on more complete and timely data. The
efforts include:
Piloting new program-level indicators measuring program participants’ experiences with
migration, migration attitudes and opinions, and program drop-out due to migration. All
relevant programs will track data for these indicators going forward.
Signing a Memorandum of Understanding with U.S. Customs and Border Protection
(CBP) in March 2020 providing access to non-personally identifiable data of Central
Americans encountered by CBP officials, including the city of last residence before
migrating. This data fills a critical gap in sub-national migration data and allows the U.S.
government to further refine the geographic and demographic focus of its programs, and
to monitor and adapt to changing migration-related dynamics.
Continuing to partner with U.S.-based and international organizations to collect and
analyze demographic data on returnees as well as perceptions of the general population

UNCLASSIFIED
UNCLASSIFIED 3
regarding migration. Additionally, third-party independent evaluations—all of which
will be published online when complete—will include questions on migration-related
outcomes as appropriate.
Examples of Department of State and USAID results in Fiscal Year 2019 include:
● Enhanced local economies by boosting private sector exports and domestic sales by more
than $140 million and helped businesses generate more than 30,000 new jobs.
● Strengthened the rule of law through support to over 1,000 civil society organizations,
training for more than 1,700 human rights defenders, improving case management in
350 local courts, and training nearly 9,000 judicial personnel.
● Reached nearly 120,000 at-risk youth, primarily in high-crime urban areas, with social
services and other support.
● Supported law enforcement efforts to seize over 106,000 kilograms of illegal narcotics.
● In addition to dramatic declines in national homicide rates since 2015, there have been
even greater decreases in homicides in communities where USAID’s citizen-security
programs are paired with the Department of State’s law enforcement efforts. In several
of these locations, where violence is driving out-migration, homicide rates have
dropped between 40 and 73 percent since 2015.
Challenges Remain:
Over the past year, USAID has rescoped its portfolio to ensure alignment with the President’s
priorities of deterring illegal immigration to the United States by initiating new project and
activity designs toward these objectives. As USAID implements these new approaches and
interventions, the Agency must also prepare for lasting changes to the development and
humanitarian landscape in the medium- to long-term caused by the COVID-19 pandemic and
efforts to contain it in Central America. For example, USAID may need to adjust programs to
strengthen disease surveillance systems, focus on the long-term health effects of COVID-19 on
vulnerable populations, and address economic, conflict and instability, citizen security, increased
gender-based violence, and governance impacts of COVID-19 throughout the region. Lastly, the
realities associated with monitoring and evaluation of USAID program results and contributions
to country capacity and commitment will be considerably different both during the pandemic and
in a post-COVID region.
This report includes data for a select set of indicators related to foreign assistance appropriated to
the Department of State and USAID for Central America and measured through October 31,
2019. This report does not include data for other U.S. government agencies, such as the
Department of Defense (DOD), that implement programs supporting the Strategy’s objectives,
but have separate authorities and appropriations. Figure 1 reflects the primary foreign assistance
accounts contributing to the data provided in this report.

UNCLASSIFIED
UNCLASSIFIED 4
Figure 1:
Appropriation Recipient (FY 2015-2019) DA ESF FMF GHP IMET INCLE
Belize x x
Costa Rica x x
El Salvador x x x x
Guatemala x x x x x
Honduras x x x x
Nicaragua x x x
Panama x x x
CARSI1 x x
CAMRI2 x
USAID Central America Regional x x
Other3 x x
The GAO issued a public report on the results of the Strategy in October 2019. The report
included mixed results of progress for programs implemented under the Strategy and
recommended the Department of State take on more of a coordination role within the interagency
in monitoring and evaluating the effectiveness of U.S. government programs. The GAO report
with the Department of State, USAID, and DoD’s comments documenting concerns with the
report and non-concurrence with the recommendation can be found at
https://www.gao.gov/assets/710/701750.pdf.
PERFORMANCE INDICATORS
The performance indicator table (Attachment 2) includes all available performance indicator
data, by country, for programs implemented with some Fiscal Year 2017 and 2018, and prior
year foreign assistance funds for results occurring in Fiscal Years 2017, 2018, and 2019, unless
otherwise noted. The results represent key areas of progress or lack thereof towards achievement
of the Strategy’s objectives across multiple programs, countries, and agencies implementing U.S.
foreign assistance programs in support of the Strategy. Fiscal Year 2020 targets are not yet
confirmed due to funding delays for programs in El Salvador, Guatemala, and Honduras, and the
uncertainty surrounding the impact of COVID-19 on programs.
In addition to the region-wide performance indicators, each agency and program selects and uses
additional project-specific indicators to monitor performance at the project level. Data for these
indicators is maintained at the agency or country levels to track and report results in accordance
with the Department of State, USAID, or other U.S. agency policies and practices.
1 Central America Regional Security Initiative 2 Central America Maritime Regional Initiative 3 Includes interagency prosperity and governance, trade-capacity building, and Inter-American Foundation.

UNCLASSIFIED
UNCLASSIFIED 5
CONTEXT INDICATORS
The context indicator graphics (Attachment 3) provide a high-level view of the operating
environment in El Salvador, Guatemala, and Honduras and tracks long-term changes that may
result from combined efforts of Central American governments, U.S. government agencies,
private sector and civil society, and other donors. National government sources and reputable
third-party organizations provide data for these indicators. These indicators complement metrics
used by USAID to assess the self-reliance of its partner countries overall, and each country’s
capacity and commitment to that end, to tailor its partnerships accordingly. Journey to Self-
Reliance metrics and roadmaps are available at https://selfreliance.usaid.gov. Attachment 3
includes international and regional benchmarks, as appropriate, for comparison with the most
recent available data. Context indicators do not directly measure the results of U.S. government
projects or activities; rather, they measure factors outside the control of the U.S. government that
have the potential to affect the achievement of expected results. Over the longer term, U.S.
government programs can contribute to changes in factors measured by these context indicators.
EVALUATIONS
In addition to collecting, analyzing, and reporting performance and context data, the Department
of State and USAID also use third-party independent evaluations (performance and impact) to
generate robust evidence needed to maximize outcomes. Between fiscal years 2016 and 2019,
USAID completed 29 evaluations of programs under the Strategy, which are available on
USAID’s Development Experience Clearinghouse website (https://dec.usaid.gov). USAID plans
to carry out additional evaluations in the coming years, subject to the availability of funds, to
address key agency-wide and regional learning priorities, including questions related to
migration.
Attachments:
Attachment 1: Results Architecture with Indicators
Attachment 2: Program Indicators
Attachment 3: Context Indicators
ATTACHMENT 1: U.S. STRATEGY FOR CENTRAL AMERICA – RESULTS ARCHITECTURE WITH PERFORMANCE INDICATORS

Attachment 1: U.S. Strategy for Central America – Results Architecture with Performance Indicators
1
Objective 1 – Prosperity
1.1 Improve Trade and Transport
Person-hours of USG-supported training completed
in trade and investment
Average time (in hours) to export goods along trade corridor receiving USG
assistance
1.2 Diversify and Connect Electric Grids
Number of people trained in technical energy fields
supported by USG assistance
1.3 Reduce Poverty
Number of children under five (0-59 months) reached by
nutrition-specific interventions through USG-supported
programs
Number of jobs attributed to Central America Strategy
implementation
Dollar value of exports and domestic sales attributed to
CEN Strategy implementation
Number of people with improved economic benefits
derived from sustainable natural resources management
and/or biodiversity conservation as a result of
USG assistance
Number of farmers and others who have applied improved technologies or management
practices with USG assistance
1.4 Improve Quality of Education
Number of individuals who complete USG-assisted workforce development
programs
Number of learners in secondary schools or
equivalent non-school based settings reached with USG
education assistance
Number of parent teacher associations or community-
based school governance structures engaged in primary
or secondaryeducation supported with USG
assistance
1.5 Support Natural Disaster Resilience
Number of hectares of biologically significant areas
under improved natural resource management as a results of USG assistance

Attachment 1: U.S. Strategy for Central America – Results Architecture with Performance Indicators
2
Objective 2 - Governance
2.1 Professionalize Civil Service
Number of judicial personnel trained with USG assistance
2.2 Improve Fiscal Accountability
Number of mechanisms for external oversight of public resource use
supported by USG assistance
2.3 Governments Uphold Democratic Values
Number of youth at risk of violence trained in social or leadership skills
through USG assisted programs
Number of civil society organizations strengthened to promote policy
dialogue, advocate for change, and/or serve as watchdogs on key issues
Number of independent worker organizations supported by USG to
promote international labor standards
Number of training days provided to journalists with USG assistance,
measured by person-days of training
Number of human rights defenders trained and supported
2.4 Implement justice reforms
Percent of respondents who are confident in the likelihood of a
prosectution and conviction of a homicide in their neighborhood
Number of active prosecutions
Number of convictions
Number of USG-assisted courts with improved case management
systems
Attachment 1: U.S. Strategy for Central America – Results Architecture with Performance Indicators
3
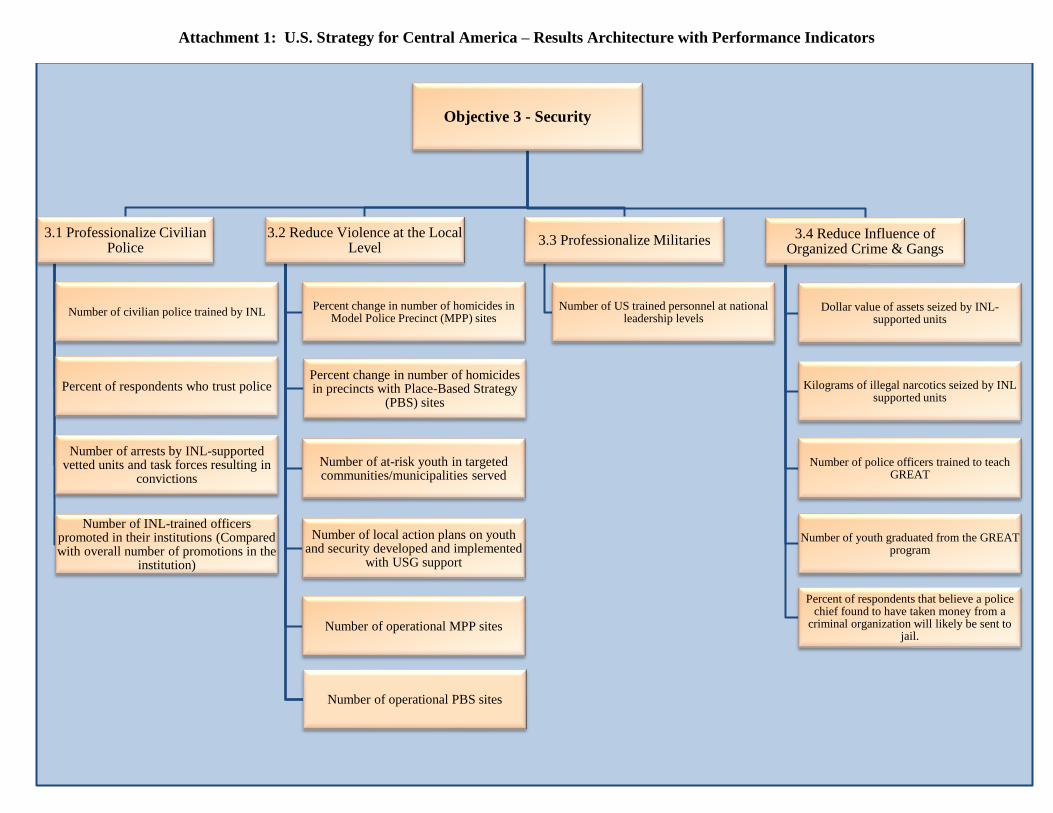
Objective 3 - Security
3.1 Professionalize Civilian Police
Number of civilian police trained by INL
Percent of respondents who trust police
Number of arrests by INL-supported vetted units and task forces resulting in
convictions
Number of INL-trained officers promoted in their institutions (Compared with overall number of promotions in the
institution)
3.2 Reduce Violence at the Local Level
Percent change in number of homicides in Model Police Precinct (MPP) sites
Percent change in number of homicides in precincts with Place-Based Strategy
(PBS) sites
Number of at-risk youth in targeted communities/municipalities served
Number of local action plans on youth and security developed and implemented
with USG support
Number of operational MPP sites
Number of operational PBS sites
3.3 Professionalize Militaries
Number of US trained personnel at national leadership levels
3.4 Reduce Influence of Organized Crime & Gangs
Dollar value of assets seized by INL-supported units
Kilograms of illegal narcotics seized by INL supported units
Number of police officers trained to teach GREAT
Number of youth graduated from the GREAT program
Percent of respondents that believe a police chief found to have taken money from a
criminal organization will likely be sent to jail.

Attachment 2: U.S. Strategy for Central America Region-Wide Performance Indicators – Results by Country
1
Updated 9/25/20
Indicator/Country: 1FY 2017
Actual
FY 2018
Actual
FY 2019
Target
FY 2019
Actual
FY 2020
Target2 Notes/Context:
1.1 Improve Trade and Transport
Average time (in hours) to export goods along
trade corridor receiving USG assistance 47 46 39 52 tbc
Includes results for State WHA Regional budget funded interagency activities
awarded to USAID's E3 Bureau, and the Department of Commerce. FY 2017
actuals represent baseline measurements. USAID Central America Regional
trade activity will report on this indicator for selected logistical corridors in
future years.
Costa Rica 20 20 15 20 tbc
Measures the average time taken to export goods in target value chains along the
defined trade corridor receiving U.S. government (USG) assistance from the
point of origin to the destination. FY 2017 actual figures represent the current
time it takes to export goods along the trade corridors receiving USG assistance.
El Salvador 30 24 20 24 tbc
Guatemala 36 36 30 36 tbc
Honduras 88 88 70 108 tbc
Nicaragua 60 72 60 72 tbc
Person-hours of USG-supported training
completed in trade and investment n/a 4,158 22,176 28,451 tbc
Includes results for State WHA Regional budget funded interagency activities
awarded to USAID's E3 Bureau, the Department of Commerce, the Federal
Aviation Administration, and State WHA Regional- managed trade capacity-
building activities.
Belize n/a 32 128 128 tbc
Measures training hours delivered in full or in part from USG assistance. USG
support may include provision of funds to pay teachers, providing hosting
facilities, or other key contributions necessary to ensure training occurs.
Costa Rica n/a 136 770 320 tbc
El Salvador n/a 1,920 5,727 5,543 tbc
Guatemala n/a 144 4,349 7,382 tbc
Honduras n/a 328 4,861 5,720 tbc
Nicaragua n/a 64 778 328 tbc
Panama n/a 1,480 1,968 1,968 tbc
Regional n/a 54 3,595 7,033 tbc
1.2 Diversify and Connect Electric Grids
Number of people trained in technical energy
fields supported by USG assistance n/a 275 200 148 tbc
Includes State WHA Regional budget supported interagency activities awarded
to ENR and the Department of Commerce.
Costa Rica n/a 40 - 11 tbc
Technical energy fields are those that increase the efficiency, reliability,
diversity, and transparency of energy services and promote investment in the
development, transport, processing, and utilization of indigenous energy sources
and imported fuels.
El Salvador n/a 3 - 11 tbc
Guatemala n/a 41 100 12 tbc
Honduras n/a 107 100 93 tbc
Nicaragua n/a 2 - 10 tbc
Panama n/a 82 - 11 tbc

Attachment 2: U.S. Strategy for Central America Region-Wide Performance Indicators – Results by Country
2
Updated 9/25/20
Indicator/Country: 1FY 2017
Actual
FY 2018
Actual
FY 2019
Target
FY 2019
Actual
FY 2020
Target2 Notes/Context:
1.3 Reduce Poverty
Dollar value of exports and domestic sales
attributed to CEN Strategy implementation $92,235,536 $73,739,213 $106,133,196 $141,731,095 tbc
Includes USAID data for one El Salvador activity, three each for Guatemala and
Honduras. Four of these activities met or exceeded their FY 2019 targets and
three activities ended in FY 2019.
El Salvador n/a $2,618,025 $29,000,000 $43,500,000 tbc Measures outcomes of USAID’s agricultural and non-agricultural assistance
programs. Increased productivity and production of small-holders or firms help
promote broad-based economic growth and reduce poverty.
Guatemala $47,788,404 $16,602,390 $58,133,196 $69,213,607 tbc
Honduras $44,447,132 $49,982,798 $19,000,000 $29,017,488 tbc
Regional n/a $4,536,000 n/a n/a tbc
Number of children under five (0-59 months)
reached by nutrition-specific interventions
through USG-supported programs
16,007 219,993 230,492 177,461 tbc Includes USAID data for two activities each for Honduras and Guatemala.
Three of these activities ended in FY 2019 or 2020.
El Salvador n/a n/a n/a n/a tbc Measures the reach of evidence-based nutrition-specific interventions among
children under 5 years of age. Such interventions are essential for preventing
and treating malnutrition and for improving child survival.
Guatemala n/a 203,150 215,492 164,715 tbc
Honduras 16,007 16,843 15,000 12,746 tbc
Number of farmers and others who have
applied improved technologies or management
practices with USG assistance
43,943 74,313 68,883 70,823 tbc
Includes USAID data for one activity each for the Central America Regional
budget and El Salvador, two in Honduras, and five in Guatemala. Includes State
WHA Regional budget trade capacity-building activities. Six activities met or
exceeded FY 2019 targets. Activities not meeting targets cited budget
uncertainty as the reason. Includes data for the Inter-American Foundation small
grants activities in El Salvador, Guatemala, Honduras, Nicaragua, and Panama.
El Salvador 1,273 300 902 1,384 tbc
Measures technological change and its adoption by different agricultural sector
actors, which is critical to increasing agricultural productivity.
Guatemala n/a 33,925 26,581 32,934 tbc
Honduras 34,500 39,659 41,300 35,546 tbc
Nicaragua n/a n/a n/a 76 tbc
Panama n/a n/a n/a 75 tbc
Regional 8,170 429 100 808 tbc

Attachment 2: U.S. Strategy for Central America Region-Wide Performance Indicators – Results by Country
3
Updated 9/25/20
Indicator/Country: FY 2017
Actual
FY 2018
Actual
FY 2019
Target
FY 2019
Actual
FY 2020
Target Notes/Context:
Number of jobs attributed to Central America
Strategy implementation 29,053 18,376 33,477 31,758 tbc
Includes USAID data for one Central America Regional budget activity, three
each for El Salvador and Honduras, five in Guatemala, and two in Nicaragua.
Activities that did not meet targets cited reasons such as funding uncertainty,
lack of economic opportunities, and beneficiary’s decision to continue their
education. Includes State WHA Regional trade capacity building activities.
El Salvador 2,508 2,666 5,030 7,084 tbc Measures the USG’s contribution to agricultural and non-agricultural job
creation and stability in Central America. Jobs provide income and help reduce
poverty and are an indirect measure of business growth. Employment refers to
work for pay, profit, or family gain (cash and/or in kind). This may include
formal and informal, farm and off-farm, and full-time and part-time
employment. Unpaid internship or volunteer work does not qualify as
employment.
Guatemala 21,906 8,259 23,743 17,402 tbc
Honduras 4,322 7,213 4,404 6,360 tbc
Nicaragua 317 156 250 342 tbc
Regional n/a 82 50 570 tbc
Number of people with improved economic
benefits derived from sustainable natural
resources management and/or biodiversity
conservation as a result of USG assistance
22,025 44,857 40,574 70,000 tbc
Includes USAID data for one activity in Honduras and two for the Central
America Regional budget. All activities exceeded their FY 2019 targets. The
FY 2019 results for the activity in Honduras greatly exceeded targets due to the
mission updating its data collection method to adhere more closely to the
indicator definition. USAID/Guatemala will adopt this indicator for one activity
in future reporting. Additional reporting includes a State WHA Regional budget
interagency activity awarded to State’s Bureau for Oceans and International
Environmental and Scientific Affairs (OES).
Honduras 22,025 43,800 40,000 69,358 tbc Measures economic growth and social development results of sustainable natural
resource management programs. Improved economic benefits are positive
changes in economic earnings or consumption due to sustainable management or
conservation of natural resources, which can include wages, communal revenues,
non-cash benefits, economic benefits from ecosystem services and reductions in
the rate of loss of an economic benefit under threat.
Guatemala n/a n/a n/a n/a tbc
Regional n/a 1,057 574 642 tbc

Attachment 2: U.S. Strategy for Central America Region-Wide Performance Indicators – Results by Country
4
Updated 9/25/20
Indicator/Country: FY 2017
Actual
FY 2018
Actual
FY 2019
Target
FY 2019
Actual
FY 2020
Target Notes/Context:
1.4 Improve Quality of Education
Number of individuals who complete USG-
assisted workforce development programs 2,427 6,175 19,210 19,051 tbc
Includes USAID data for two activities each in El Salvador, Guatemala, and
Nicaragua, and one each in Honduras and the Central America Regional budget.
Project redesign and reduced funding lead to some activities not meeting targets.
Future year reporting will reflect definitional changes to State and USAID's
standard indicators for workforce development programs. Includes data for State
WHA Regional budget interagency funds awarded to DOL, and State WHA
Regional trade capacity building activities. For more information on USAID’s
workforce development program results, see Third Annual Central America
Workforce Development Report, available at
https://pdf.usaid.gov/pdf_docs/PA00X12N.pdf
El Salvador 985 3,040 6,316 4,142 tbc Measures scale and accomplishment of initial step in guiding at-risk youth
toward improved employment and livelihoods. Completion of workforce
development programs by at-risk youth in Central America also shows indirect
results of programs aiming to improve the quality and strength of labor markets
and institutions. Completing a workforce development program means that an
individual has met the completion requirements of a structured workforce
development program (components of which are defined by the program
offered).
Guatemala 461 1,409 7,525 10,793 tbc
Honduras n/a 651 3,313 2,441 tbc
Nicaragua 981 1,075 1,539 1,559 tbc
Regional n/a 0 517 116 tbc
Number of learners in secondary schools or
equivalent non-school based settings reached
with USG education assistance
115,786 136,741 97,289 73,310 tbc
Includes USAID data for three activities each in El Salvador and Guatemala, and
one each in Honduras and Nicaragua. Activities in Guatemala, Honduras, and
Nicaragua met or exceeded their FY 2019 targets. Targets were not met in El
Salvador due to the change of El Salvador's administration and the transition of
key ministry officials, as well as budget uncertainty. Includes State WHA
Regional budget CARSI small grant activities in Belize.
Belize 13,500 534 n/a n/a tbc Measures scale of USAID programs benefiting students in high-risk
communities in Central America. Learners are enrolled in formal secondary
school or non-formal equivalent of secondary school for the purpose of acquiring
basic education skills or knowledge. A learner is an individual enrolled in an
education program to acquire academic basic education skills or knowledge.
Learners enrolled in formal secondary school or the non-formal equivalent of
secondary school count towards this indicator. Learners are counted if they are
enrolled in secondary or secondary-equivalent education, and directly benefit
from USG education assistance designed to support student acquisition of
academic basic education skills and knowledge.
El Salvador 100,811 84,949 37,984 14,729 tbc
Guatemala 557 8,749 3,405 6,621 tbc
Honduras n/a 41,690 55,000 51,060 tbc
Nicaragua 918 819 900 900 tbc

Attachment 2: U.S. Strategy for Central America Region-Wide Performance Indicators – Results by Country
5
Updated 9/25/20
Indicator/Country: FY 2017
Actual
FY 2018
Actual
FY 2019
Target
FY 2019
Actual
FY 2020
Target Notes/Context:
Number of parent teacher associations (PTAs)
or community-based school governance
structures engaged in primary or secondary
education supported with USG assistance
n/a n/a 600 682 tbc
Includes USAID data for one activity in Guatemala and two in Honduras. Two
of the three activities met or exceeded their FY 2019 targets. USAID will
review utility of this indicator for future reporting.
Guatemala n/a n/a 33 35 tbc
Support to community-based school governance structures promotes capacity
building at the grassroots, local level. Such structures promote opportunities for
democracy in action as well as improved local ownership, accountability, and
stability of schools. This supports improved accessibility and quality of
education, leading ultimately to improved learning outcomes. Efforts include
support for participation of parents (or guardians) and other community members
in school-level decision making, monitoring school quality, monitoring or
participation in school governance, advocacy work, and/or sponsorship or
fundraising initiatives for supplemental educational materials.
Honduras n/a n/a 567 647 tbc
1.5 Support Natural Disaster Resilience
Number of hectares of biologically significant
areas under improved natural resource
management as a result of USG assistance
1,220,364 1,637,165 1,624,172 1,719,236 tbc
Includes USAID data for two activities in Guatemala, and one each for the
Central America regional budget and Honduras. Activities reporting met or
exceeded FY 2019 targets. Includes one State WHA Regional budget
interagency activity for OES and State WHA Regional trade capacity-building
activities.
El Salvador 324 433 0 0 tbc Biologically significant areas are those identified as important for biodiversity
through national, regional, or global priority-setting processes, or areas where
natural resource management (NRM) interventions intend to positively impact
biodiversity in areas. Improved natural resource management includes activities
that promote enhanced management of natural resources for one or more
objectives, such as conserving biodiversity, maintaining ecosystems services,
strengthening sustainable use of natural resources, mitigating climate change,
and/or promoting community participation in NRM.
Guatemala 1,220,040 1,247,247 1,334,447 1,338,917 tbc
Honduras n/a 112,182 150,000 240,341 tbc
Regional n/a 277,303 139,725 139,590 tbc

Attachment 2: U.S. Strategy for Central America Region-Wide Performance Indicators – Results by Country
6
Updated 9/25/20
Indicator/Country:
Indicator/Country: FY 2017
Actual
FY 2018
Actual
FY 2019
Target
FY 2019
Actual
FY 2020
Target Notes/Context:
2.1 Professionalize Civil Service
Number of justice sector personnel trained with
USG assistance 9,461 15,133 3,025 8,988 tbc
Includes Department of State Bureau of International Narcotics and Law
Enforcement Affairs (INL) data for activities in Belize, Costa Rica, El Salvador,
Guatemala, Honduras, Nicaragua, and Panama. Includes one activity for the
Department of State Bureau of Democracy, Human Rights, and Labor (DRL) in
Guatemala. Includes USAID data from one Central America Regional budget
activity, two activities each in El Salvador, Guatemala, and Honduras. All but one
USAID activity exceeded FY 2019 targets.
Belize 9 6 n/r 13 tbc Justice sector actors defined as any member of a local, municipal, or national entity
responsible for investigating allegations of illegal conduct, prosecuting the guilty,
exonerating the innocent, and remedying the needs of victims in a fair and efficient
manner. DRL's program ended in June 2018. Panama's participants decreased due
to a shift to more specialized trainings. INL Guatemala added additional staff late
in 2017, increasing its capacity to conduct additional trainings in 2018. USAID
began reporting results starting in FY 2018. Measures training of judicial
personnel, which improves these officials' ability to effectively carry out their
duties. This, in turn, improves the capacity of the judiciary to act as a check on
government power. Training also instills a sense of the value of and necessity for
judicial independence, transparency, and accountability in a democratic society.
Costa Rica 1,846 1,125 n/r 222 tbc
El Salvador 2,277 4,297 1,865 4,274 tbc
Guatemala 1,949 6,419 745 1,763 tbc
Honduras 659 1,841 320 1,242 tbc
Panama 2,721 1,385 n/r 1,218 tbc
Regional n/r 60 95 256 tbc
2.2 Improve Fiscal Accountability
Number of mechanisms for external oversight of
public resource use supported by USG assistance n/a 4 7 5 tbc
Includes State WHA regional interagency activities awarded to the Department of
the Treasury’s Office of Technical Assistance (OTA).
Guatemala n/a 0 2 2 tbc Mechanisms are interventions or actions taken by parliaments, audit agencies,
ombudsman, anti-corruption agencies, and non-governmental organizations.
External oversight refers to actions taken by those actors to monitor, disclose,
highlight, discipline, investigate, or otherwise bring attention to public resource use
in a particular country. Honduras n/a 4 5 3 tbc
Attachment 2: U.S. Strategy for Central America Region-Wide Performance Indicators – Results by Country
7
Updated 9/25/20
Indicator/Country: FY 2017
Actual
FY 2018
Actual
FY 2019
Target
FY 2019
Actual
FY 2020
Target Notes/Context:
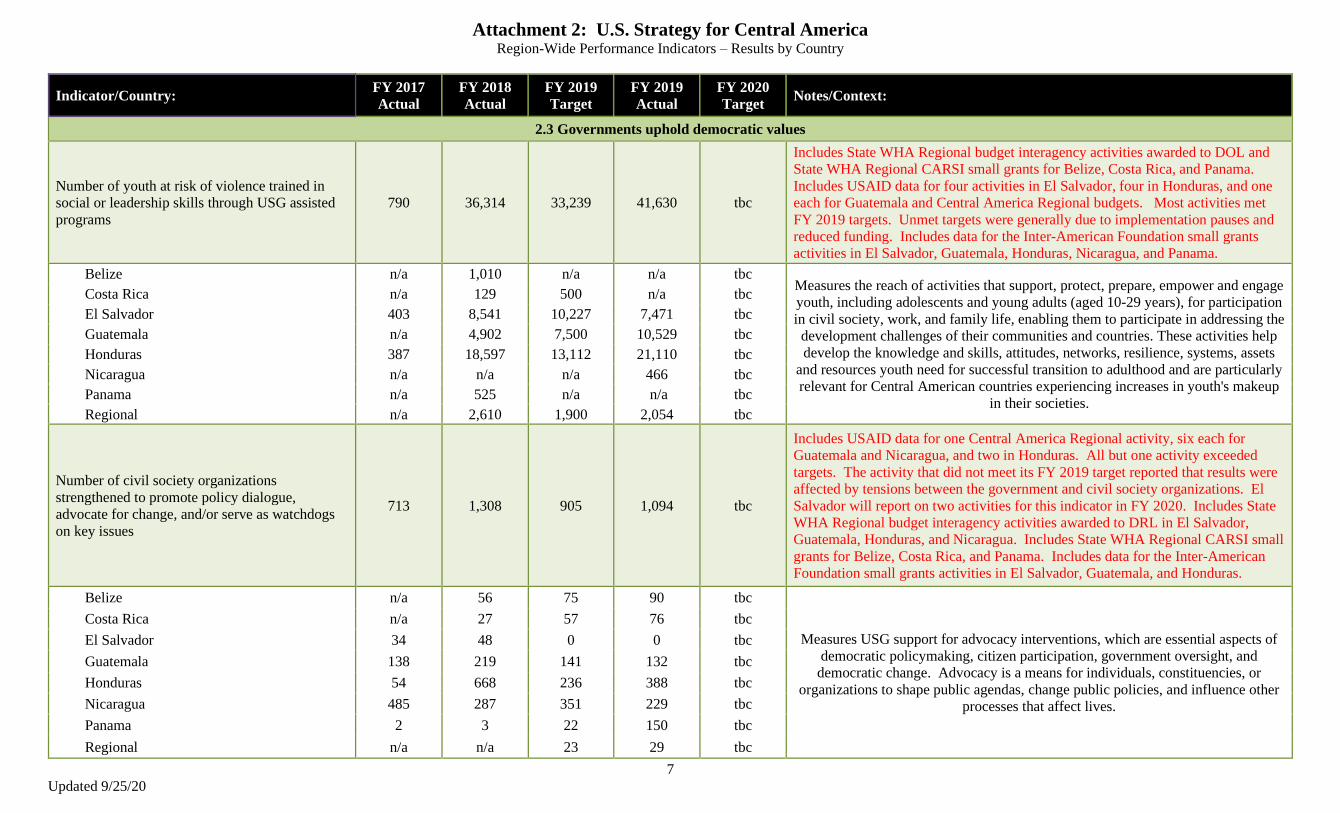
2.3 Governments uphold democratic values
Number of youth at risk of violence trained in
social or leadership skills through USG assisted
programs
790 36,314 33,239 41,630 tbc
Includes State WHA Regional budget interagency activities awarded to DOL and
State WHA Regional CARSI small grants for Belize, Costa Rica, and Panama.
Includes USAID data for four activities in El Salvador, four in Honduras, and one
each for Guatemala and Central America Regional budgets. Most activities met
FY 2019 targets. Unmet targets were generally due to implementation pauses and
reduced funding. Includes data for the Inter-American Foundation small grants
activities in El Salvador, Guatemala, Honduras, Nicaragua, and Panama.
Belize n/a 1,010 n/a n/a tbc Measures the reach of activities that support, protect, prepare, empower and engage
youth, including adolescents and young adults (aged 10-29 years), for participation
in civil society, work, and family life, enabling them to participate in addressing the
development challenges of their communities and countries. These activities help
develop the knowledge and skills, attitudes, networks, resilience, systems, assets
and resources youth need for successful transition to adulthood and are particularly
relevant for Central American countries experiencing increases in youth's makeup
in their societies.
Costa Rica n/a 129 500 n/a tbc
El Salvador 403 8,541 10,227 7,471 tbc
Guatemala n/a 4,902 7,500 10,529 tbc
Honduras 387 18,597 13,112 21,110 tbc
Nicaragua n/a n/a n/a 466 tbc
Panama n/a 525 n/a n/a tbc
Regional n/a 2,610 1,900 2,054 tbc
Number of civil society organizations
strengthened to promote policy dialogue,
advocate for change, and/or serve as watchdogs
on key issues
713 1,308 905 1,094 tbc
Includes USAID data for one Central America Regional activity, six each for
Guatemala and Nicaragua, and two in Honduras. All but one activity exceeded
targets. The activity that did not meet its FY 2019 target reported that results were
affected by tensions between the government and civil society organizations. El
Salvador will report on two activities for this indicator in FY 2020. Includes State
WHA Regional budget interagency activities awarded to DRL in El Salvador,
Guatemala, Honduras, and Nicaragua. Includes State WHA Regional CARSI small
grants for Belize, Costa Rica, and Panama. Includes data for the Inter-American
Foundation small grants activities in El Salvador, Guatemala, and Honduras.
Belize n/a 56 75 90 tbc
Measures USG support for advocacy interventions, which are essential aspects of
democratic policymaking, citizen participation, government oversight, and
democratic change. Advocacy is a means for individuals, constituencies, or
organizations to shape public agendas, change public policies, and influence other
processes that affect lives.
Costa Rica n/a 27 57 76 tbc
El Salvador 34 48 0 0 tbc
Guatemala 138 219 141 132 tbc
Honduras 54 668 236 388 tbc
Nicaragua 485 287 351 229 tbc
Panama 2 3 22 150 tbc
Regional n/a n/a 23 29 tbc
Attachment 2: U.S. Strategy for Central America Region-Wide Performance Indicators – Results by Country
8
Updated 9/25/20
Indicator/Country: FY 2017
Actual
FY 2018
Actual
FY 2019
Target
FY 2019
Actual
FY 2020
Target Notes/Context:
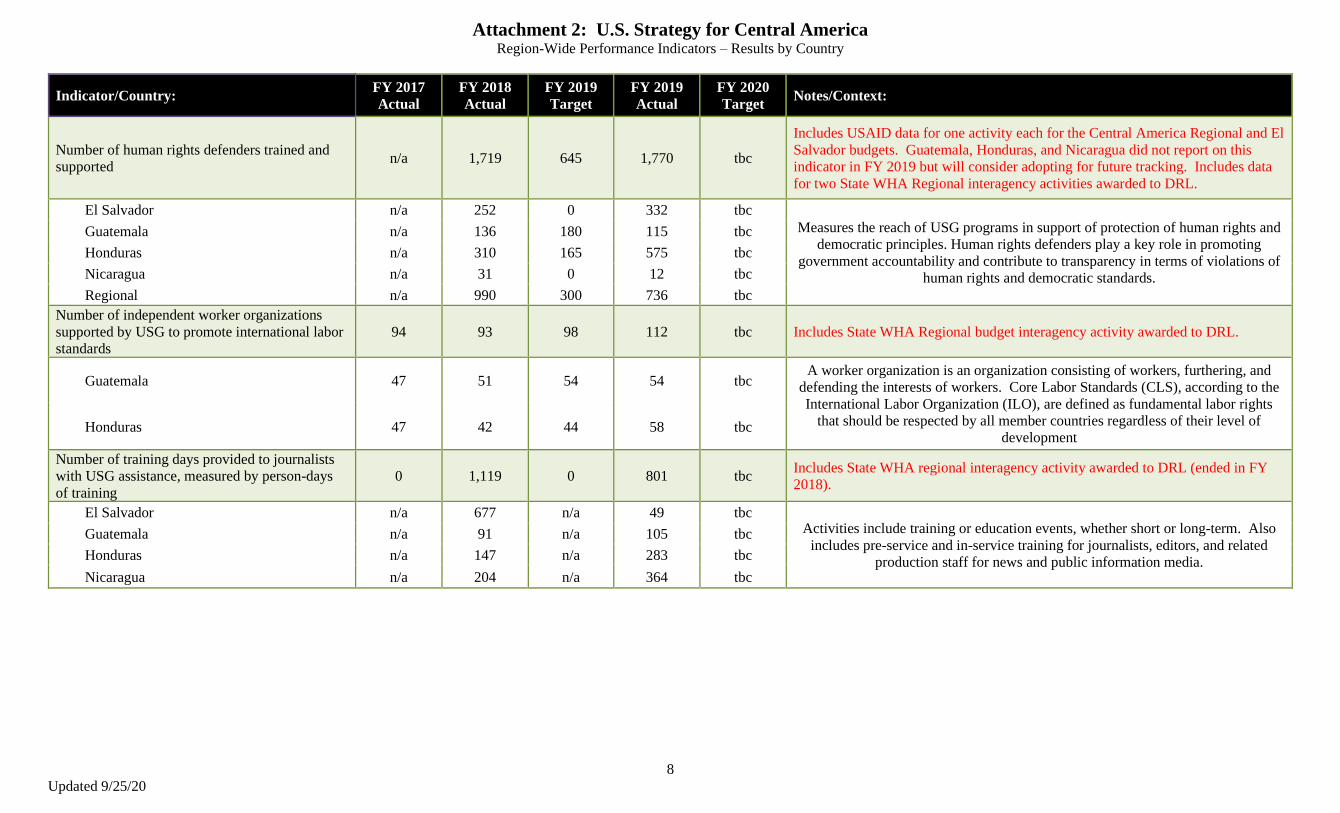
Number of human rights defenders trained and
supported n/a 1,719 645 1,770 tbc
Includes USAID data for one activity each for the Central America Regional and El
Salvador budgets. Guatemala, Honduras, and Nicaragua did not report on this
indicator in FY 2019 but will consider adopting for future tracking. Includes data
for two State WHA Regional interagency activities awarded to DRL.
El Salvador n/a 252 0 332 tbc
Measures the reach of USG programs in support of protection of human rights and
democratic principles. Human rights defenders play a key role in promoting
government accountability and contribute to transparency in terms of violations of
human rights and democratic standards.
Guatemala n/a 136 180 115 tbc
Honduras n/a 310 165 575 tbc
Nicaragua n/a 31 0 12 tbc
Regional n/a 990 300 736 tbc
Number of independent worker organizations
supported by USG to promote international labor
standards
94 93 98 112 tbc Includes State WHA Regional budget interagency activity awarded to DRL.
Guatemala 47 51 54 54 tbc A worker organization is an organization consisting of workers, furthering, and
defending the interests of workers. Core Labor Standards (CLS), according to the
International Labor Organization (ILO), are defined as fundamental labor rights
that should be respected by all member countries regardless of their level of
development Honduras 47 42 44 58 tbc
Number of training days provided to journalists
with USG assistance, measured by person-days
of training
0 1,119 0 801 tbc Includes State WHA regional interagency activity awarded to DRL (ended in FY
2018).
El Salvador n/a 677 n/a 49 tbc Activities include training or education events, whether short or long-term. Also
includes pre-service and in-service training for journalists, editors, and related
production staff for news and public information media.
Guatemala n/a 91 n/a 105 tbc
Honduras n/a 147 n/a 283 tbc
Nicaragua n/a 204 n/a 364 tbc
Attachment 2: U.S. Strategy for Central America Region-Wide Performance Indicators – Results by Country
9
Updated 9/25/20
Indicator/Country: FY 2017
Actual
FY 2018
Actual
FY 2019
Target
FY 2019
Actual
FY 2020
Target Notes/Context:
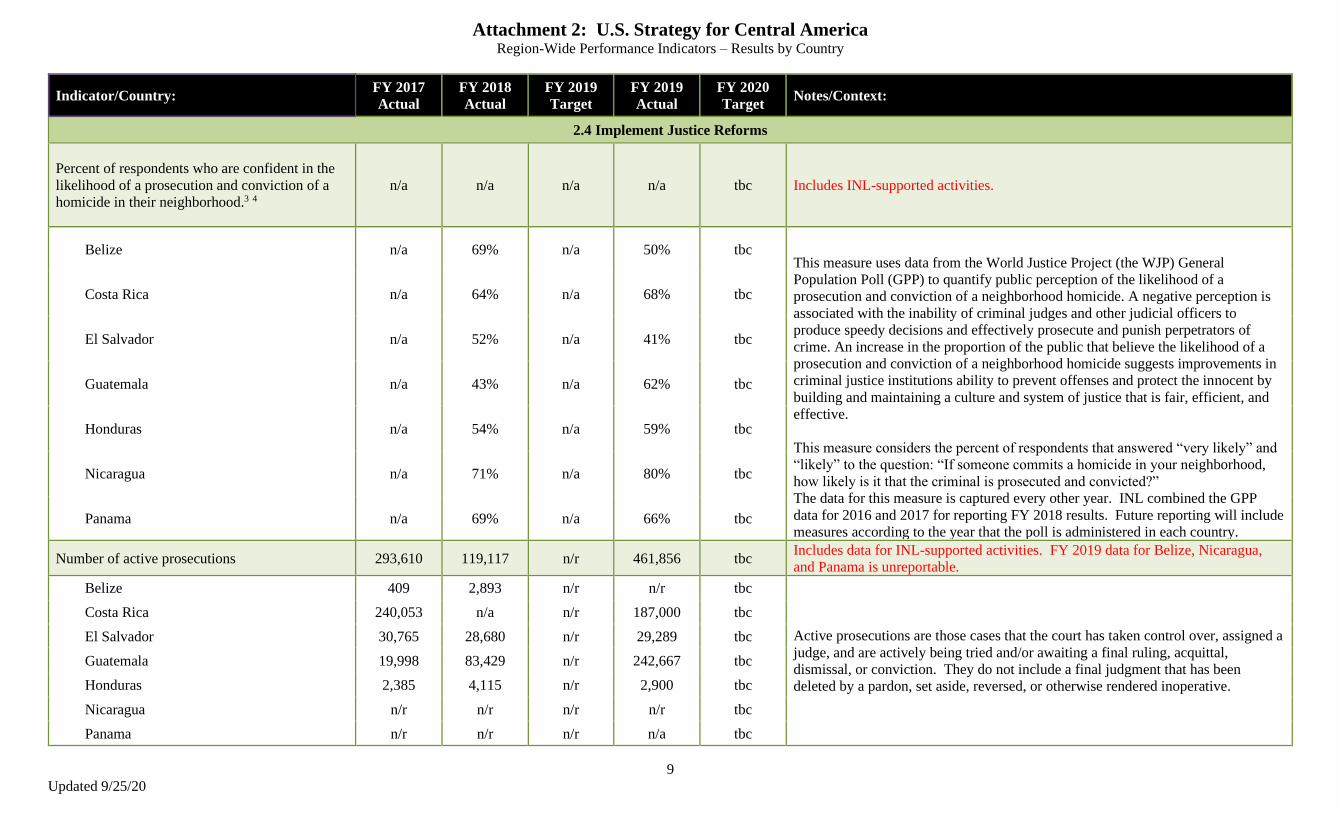
2.4 Implement Justice Reforms
Percent of respondents who are confident in the
likelihood of a prosecution and conviction of a
homicide in their neighborhood.3 4
n/a n/a n/a n/a tbc Includes INL-supported activities.
Belize n/a 69% n/a 50% tbc This measure uses data from the World Justice Project (the WJP) General
Population Poll (GPP) to quantify public perception of the likelihood of a
prosecution and conviction of a neighborhood homicide. A negative perception is
associated with the inability of criminal judges and other judicial officers to
produce speedy decisions and effectively prosecute and punish perpetrators of
crime. An increase in the proportion of the public that believe the likelihood of a
prosecution and conviction of a neighborhood homicide suggests improvements in
criminal justice institutions ability to prevent offenses and protect the innocent by
building and maintaining a culture and system of justice that is fair, efficient, and
effective.
This measure considers the percent of respondents that answered “very likely” and
“likely” to the question: “If someone commits a homicide in your neighborhood,
how likely is it that the criminal is prosecuted and convicted?”
The data for this measure is captured every other year. INL combined the GPP
data for 2016 and 2017 for reporting FY 2018 results. Future reporting will include
measures according to the year that the poll is administered in each country.
Costa Rica n/a 64% n/a 68% tbc
El Salvador n/a 52% n/a 41% tbc
Guatemala n/a 43% n/a 62% tbc
Honduras n/a 54% n/a 59% tbc
Nicaragua n/a 71% n/a 80% tbc
Panama n/a 69% n/a 66% tbc
Number of active prosecutions 293,610 119,117 n/r 461,856 tbc Includes data for INL-supported activities. FY 2019 data for Belize, Nicaragua,
and Panama is unreportable.
Belize 409 2,893 n/r n/r tbc
Active prosecutions are those cases that the court has taken control over, assigned a
judge, and are actively being tried and/or awaiting a final ruling, acquittal,
dismissal, or conviction. They do not include a final judgment that has been
deleted by a pardon, set aside, reversed, or otherwise rendered inoperative.
Costa Rica 240,053 n/a n/r 187,000 tbc
El Salvador 30,765 28,680 n/r 29,289 tbc
Guatemala 19,998 83,429 n/r 242,667 tbc
Honduras 2,385 4,115 n/r 2,900 tbc
Nicaragua n/r n/r n/r n/r tbc
Panama n/r n/r n/r n/a tbc

Attachment 2: U.S. Strategy for Central America Region-Wide Performance Indicators – Results by Country
10
Updated 9/25/20
Indicator/Country: FY 2017
Actual
FY 2018
Actual
FY 2019
Target
FY 2019
Actual
FY 2020
Target Notes/Context:
Number of convictions 208,925 80,570 n/r 350,484 tbc Includes data for INL-supported activities. FY 2019 data for Belize, Nicaragua,
and Panama is unreportable.
Belize n/r 2,369 n/r n/r tbc
A conviction is the verdict that results when a court of law finds the final judgment
on a verdict of guilty, a plea of guilty, or a plea of nolo contendere.
Costa Rica 183,125 n/a n/r 270,613 tbc
El Salvador 6,994 6,913 n/r 20,707 tbc
Guatemala 18,536 70,657 n/r 56,481 tbc
Honduras 270 631 n/r 2,683 tbc
Nicaragua n/r n/r n/r n/r tbc
Panama n/r n/r n/r n/r tbc
Number of USG-assisted courts with improved
case management systems 205 333 256 347 tbc
Includes USAID data for one activity in El Salvador, one in Honduras, and two in
Guatemala. Honduras expects to adopt this indicator in FY 2020. All activities
reporting on this indicator exceeded FY 2019 targets.
El Salvador 42 88 7 91 tbc
Measures USAID support for judicial systems. Improved court management
information enables courts to control and monitor their operations (and explain
their operations to citizens), thereby improving court efficiency and effectiveness.
Guatemala 163 244 249 256 tbc
Honduras n/r 1 0 0 tbc
Nicaragua n/r n/r n/r n/r tbc
Regional n/r n/r n/r n/r tbc

Attachment 2: U.S. Strategy for Central America Region-Wide Performance Indicators – Results by Country
11
Updated 9/25/20
Indicator/Country: FY 2017
Actual
FY 2018
Actual
FY 2019
Target
FY 2019
Actual
FY 2020
Target Notes/Context:
3.1 Professionalize Civilian Police
Number of civilian police trained 23,606 18,748 n/r 14,256 tbc Includes data for INL-supported activities.
Belize 156 60 n/r 163 tbc
Civilian law enforcement defined as any member of a local, municipal, or national
non-military police.
Costa Rica 1,612 1,880 n/r 1,205 tbc
El Salvador 4,418 4,174 n/r 3,527 tbc
Guatemala 7,315 7,598 n/r 4,347 tbc
Honduras 3,507 3,936 n/r 4,148 tbc
Panama 6,598 1,100 n/r 866 tbc
Percent of respondents who trust police 3 4 n/r n/a n/r n/a tbc Includes data for INL-supported activities.
Belize n/r 18% n/r 20% tbc This measure uses data from the World Justice Project (the WJP) General
Population Poll (GPP) to quantify public perception of trust in police. A negative
perception is associated with police brutality, prevalence of crime, and a lack of
order and security. An increase in the proportion of the public that express trust in
police suggests improvements in the ability of law enforcement agencies to prevent
crime, enforce laws, and ensure citizen security. This measure considers the percent
of respondents that answered, “a lot” and “some” to the question: “Please tell me,
how much trust do you have in the police?” The survey is conducted every other
year, so the data for this measure is captured every other year. INL combined the
GPP data for 2016 and 2017 for reporting FY 2018 results. Future reporting will
include measures according to the year that the poll is administered in each country.
Costa Rica n/r 35% n/r 49% tbc
El Salvador n/r 20% n/r 14% tbc
Guatemala n/r 12% n/r 27% tbc
Honduras n/r 25% n/r 29% tbc
Nicaragua n/r 35% n/r 38% tbc
Panama n/r 34% n/r 43% tbc
Number of arrests by INL-supported vetted units
and task forces resulting in convictions 1,866 1,351 n/r 1,409 tbc Includes data for INL-supported activities.
Belize 6 2 n/r n/r tbc
The number includes convictions of individuals arrested by a vetted/specialized unit
or task force and arrest resulted in a conviction within the reporting period. Costa
Rica does not have vetted units.
El Salvador 1,808 1,239 n/r 1,379 tbc
Guatemala 11 45 n/r 0 tbc
Honduras 41 47 n/r 30 tbc
Panama n/r 18 n/r n/r tbc
Attachment 2: U.S. Strategy for Central America Region-Wide Performance Indicators – Results by Country
12
Updated 9/25/20
Indicator/Country: FY 2017
Actual
FY 2018
Actual
FY 2019
Target
FY 2019
Actual
FY 2020
Target Notes/Context:
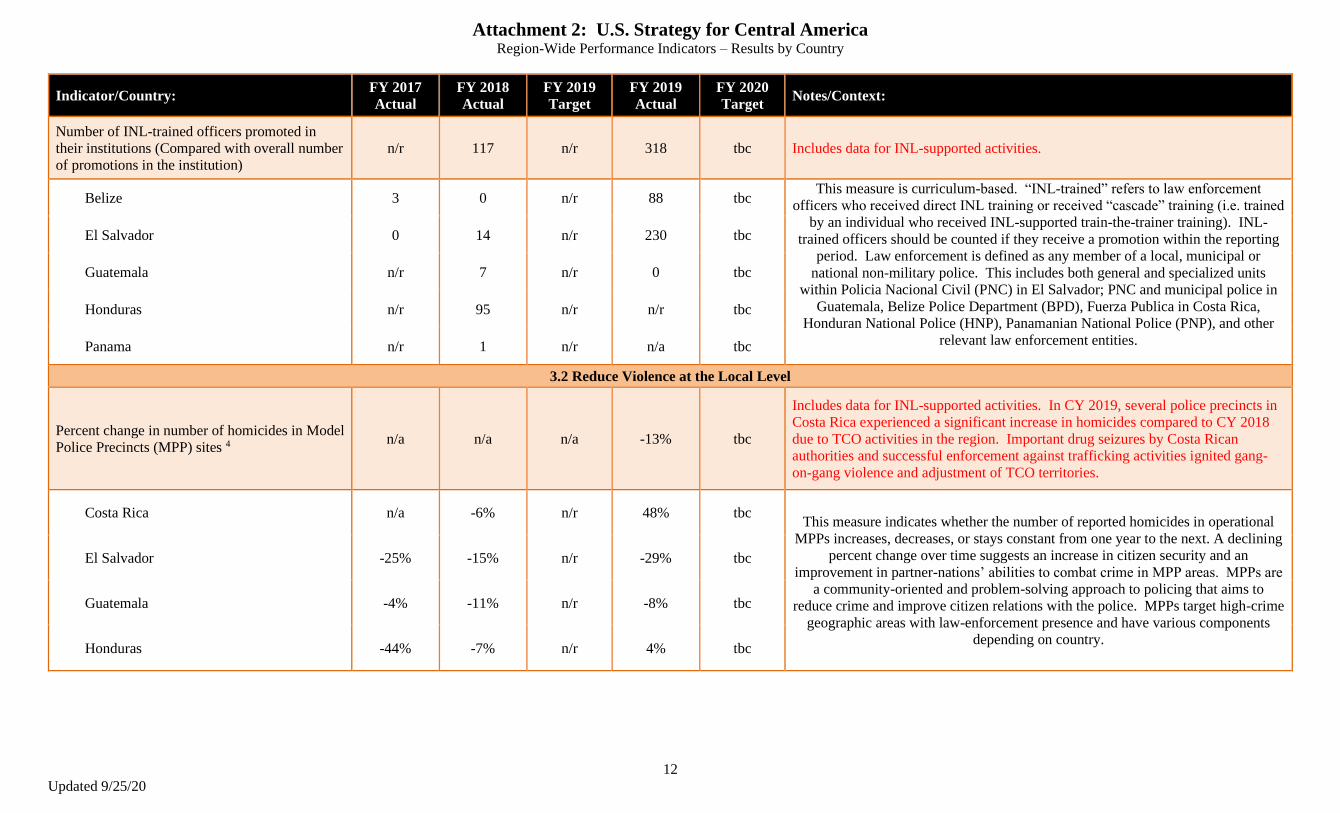
Number of INL-trained officers promoted in
their institutions (Compared with overall number
of promotions in the institution)
n/r 117 n/r 318 tbc Includes data for INL-supported activities.
Belize 3 0 n/r 88 tbc This measure is curriculum-based. “INL-trained” refers to law enforcement
officers who received direct INL training or received “cascade” training (i.e. trained
by an individual who received INL-supported train-the-trainer training). INL-
trained officers should be counted if they receive a promotion within the reporting
period. Law enforcement is defined as any member of a local, municipal or
national non-military police. This includes both general and specialized units
within Policia Nacional Civil (PNC) in El Salvador; PNC and municipal police in
Guatemala, Belize Police Department (BPD), Fuerza Publica in Costa Rica,
Honduran National Police (HNP), Panamanian National Police (PNP), and other
relevant law enforcement entities.
El Salvador 0 14 n/r 230 tbc
Guatemala n/r 7 n/r 0 tbc
Honduras n/r 95 n/r n/r tbc
Panama n/r 1 n/r n/a tbc
3.2 Reduce Violence at the Local Level
Percent change in number of homicides in Model
Police Precincts (MPP) sites 4 n/a n/a n/a -13% tbc
Includes data for INL-supported activities. In CY 2019, several police precincts in
Costa Rica experienced a significant increase in homicides compared to CY 2018
due to TCO activities in the region. Important drug seizures by Costa Rican
authorities and successful enforcement against trafficking activities ignited gang-
on-gang violence and adjustment of TCO territories.
Costa Rica n/a -6% n/r 48% tbc This measure indicates whether the number of reported homicides in operational
MPPs increases, decreases, or stays constant from one year to the next. A declining
percent change over time suggests an increase in citizen security and an
improvement in partner-nations’ abilities to combat crime in MPP areas. MPPs are
a community-oriented and problem-solving approach to policing that aims to
reduce crime and improve citizen relations with the police. MPPs target high-crime
geographic areas with law-enforcement presence and have various components
depending on country.
El Salvador -25% -15% n/r -29% tbc
Guatemala -4% -11% n/r -8% tbc
Honduras -44% -7% n/r 4% tbc

Attachment 2: U.S. Strategy for Central America Region-Wide Performance Indicators – Results by Country
13
Updated 9/25/20
Indicator/Country: FY 2017
Actual
FY 2018
Actual
FY 2019
Target
FY 2019
Actual
FY 2020
Target Notes/Context:
Percent change in number of homicides in
precincts with Place-Based Strategy (PBS) sites 4 n/a n/a n/a -8% tbc Includes data for INL and USAID-supported activities.
El Salvador -35% 12% n/r -31% tbc This measure indicates whether the number of reported homicides in police
precincts with operational PBS sites increases, decreases, or stays constant from
one year to the next. A declining percent change over time suggests an increase in
citizen security and an improvement in partner-nations’ abilities to combat crime in
police precincts with PBS sites. A PBS site is defined as distinct geographic areas
(typically a neighborhood or police precinct) where INL, USAID, and other
relevant US agencies involved in citizen security coordinate and cooperate to
establish effective, efficient, and integrated crime-management systems to reach the
common goal of improving citizen security.
Guatemala 1% -24% n/r 3% tbc
Honduras -43% -6% n/r 12% tbc
Number of at-risk youth in targeted
communities/municipalities served 79,706 143,078 160,279 118,581 tbc
Includes USAID data for one Central America Regional budget activity, five
activities in El Salvador, one each in Guatemala and Nicaragua, and four in
Honduras. Most activities met or exceeded their targets. Unmet targets were
primarily due to reduced funding levels, termination of activities, or (in one case) a
misstated FY 2019 target. USAID plans to assess the utility and definition of this
indicator for future reporting.
El Salvador 38,327 36,021 42,270 53,082 tbc
Measures reach of USAID programs (including CARSI-funded programs) focused
on at-risk youth, including youth receiving services through USAID-supported
outreach centers.
Guatemala 1,917 2,192 6,400 498 tbc
Honduras 20,693 83,358 98,000 46,206 tbc
Nicaragua 2,051 1,916 2,236 3,505 tbc
Regional 16,718 19,591 11,373 15,290 tbc
Number of local action plans on youth and
security developed and implemented with USG
support
196 98 103 110 tbc
Includes USAID data for four activities (one each in El Salvador, Guatemala,
Honduras, and Nicaragua) reported in FY 2019. The activity in El Salvador ended
in FY 2019 and had zero results or target.
El Salvador 15 n/a n/a 0 tbc Measures reach of USAID’s community-based crime and violence prevention
programs. Prevention programs implemented in partnership with actors capable of
influencing crime and violence prevention at a local level help ensure program
ownership and sustainability of results.
Guatemala 70 70 80 78 tbc
Honduras 5 5 5 12 tbc
Nicaragua 106 23 18 20 tbc

Attachment 2: U.S. Strategy for Central America Region-Wide Performance Indicators – Results by Country
14
Updated 9/25/20
Indicator/Country: FY 2017
Actual
FY 2018
Actual
FY 2019
Target
FY 2019
Actual
FY 2020
Target Notes/Context:
Number of operational MPP sites 4 145 161 n/r 164 tbc Includes data for INL-supported activities.
Costa Rica 15 18 n/r 18 tbc Measures the number of operational MPPs and/or PBS sites in each country. MPPs
increase citizen security in high-crime areas by training and equipping police to
combat crime, as well as by building trust between community members and the
police so that police officers can detect, prevent, and investigate crime more
effectively. A PBS site is considered operational when USAID and INL have
mutually agreed-upon activities and high-level goals and activities are being
implemented. Costa Rica, Nicaragua, and Panama do not have MPP sites.
El Salvador 15 19 n/r 19 tbc
Guatemala 94 99 n/r 99 tbc
Honduras 21 25 n/r 28 tbc
Number of operational PBS sites 4 11 13 0 12 tbc Includes data for INL-supported activities.
El Salvador 3 3 n/a 3 tbc Measures the number of operational MPPs and/or PBS sites in each country. MPPs
increase citizen security in high-crime areas by training and equipping police to
combat crime, as well as by building trust between community members and the
police so that police officers can detect, prevent, and investigate crime more
effectively. A PBS site is considered operational when USAID and INL have
mutually agreed-upon activities and high-level goals and activities are being
implemented. Costa Rica, Nicaragua, and Panama do not have MPP sites.
Guatemala 1 1 n/r 1 tbc
Honduras 7 9 n/r 8 tbc
3.3 Professionalize Regional Military
Number of US trained personnel at national
leadership levels 25 23 31 6 tbc
Includes Department of State Political-Military Affairs (PM)-supported activities.
COVID-19 had a significant impact on international students’ ability to attend
courses in the United States in FY 2020; therefore targets are lower.
Belize 1 0 3 1 tbc
PM funds courses (Staff and War Colleges with each of the military services) for
senior-level officers and enlisted personnel that will hold positions of responsibility
within their respective organizations and often play key roles in decision making.
Costa Rica 2 1 7 1 tbc
El Salvador 6 1 5 0 tbc
Guatemala 5 6 2 0 tbc
Honduras 2 1 3 0 tbc
Panama 9 14 11 4 tbc

Attachment 2: U.S. Strategy for Central America Region-Wide Performance Indicators – Results by Country
15
Updated 9/25/20
Indicator/Country: FY 2017
Actual
FY 2018
Actual
FY 2019
Target
FY 2019
Actual
FY 2020
Target Notes/Context:
3.4 Reduce Influence of Organized Crime and Gangs
Dollar value of assets seized by INL-supported
units 4 $49,503,953 $37,994,700 n/r $17,632,559 tbc Includes data for INL-supported activities.
Belize $189,000 n/a n/r $1,348 tbc
Assets to report include, but are not limited to, confiscated properties, including
real estate property such as a house or motel, cars, jewelry, boats, and firearms.
Bulk cash seized should be included as a part of the total value recovered. All
values reported in US dollars.
Costa Rica $4,402,407 $1,504,475 n/r $3,734,436 tbc
El Salvador $12,092,121 $13,763,314 n/r $8,309,840 tbc
Guatemala $32,762,666 $8,064,246 n/r $4,312,398 tbc
Honduras $57,759 $11,846,118 n/r $941,797 tbc
Panama n/a $2,816,547 n/r $332,740 tbc
Kilograms of illegal narcotics seized by INL-
supported units 4 598,689 134,881 n/r 106,443 tbc Includes data for INL-supported activities.
Belize 1,044 1,669 n/r 1,924 tbc
Illicit narcotics should include, but are not limited to, opiates, “opiate-like”
synthetic substances, and synthetic substances in the form of amphetamine and
amphetamine-type compounds, hallucinogens, and cannabis. This measure does
not include eradications. All measurements reported in metric kilograms. FY 2018
actual Nicaragua data is preliminary and will be updated when the Government of
Nicaragua updates its annual police report.
Costa Rica 35,767 35,820 n/r 39,040 tbc
El Salvador 7,974 13,698 n/r 11,102 tbc
Guatemala 502,215 25,011 n/r 24,549 tbc
Honduras 2,504 43,446 n/r 5,992 tbc
Nicaragua 7,319 5,523* n/a n/a tbc
Panama 41,866 15,237 n/r 23,836 tbc
Number of police officers trained to teach
GREAT 699 724 n/r 1,851 tbc Includes data for INL-supported activities.
Belize 130 21 n/r 99 tbc
The number of Regional Police Officers certified to deliver Gang Resistance
Education and Training (GREAT) anti-gang/crime prevention training.
Costa Rica 89 219 n/r 186 tbc
El Salvador 89 80 n/r 172 tbc
Guatemala 114 127 n/r 1,232 tbc
Honduras 132 47 n/r 79 tbc
Panama 145 230 n/r 83 tbc

Attachment 2: U.S. Strategy for Central America Region-Wide Performance Indicators – Results by Country
16
Updated 9/25/20
Indicator/Country: FY 2017
Actual
FY 2018
Actual
FY 2019
Target
FY 2019
Actual
FY 2020
Target Notes/Context:
Number of youth graduated from the GREAT
program 299,485 194,853 n/r 168,131 tbc Includes data for INL-supported activities.
Belize 2,723 4,283 n/r 1,819 tbc
The number of youth under the age of 18 graduated from the GREAT anti-
gang/crime prevention program. Students counted graduating within the reporting
period.
Costa Rica 25,468 25,000 n/r 13,674 tbc
El Salvador 20,249 17,300 n/r 43,012 tbc
Guatemala 17,500 30,034 n/r 2,664 tbc
Honduras 212,466 99,051 n/r 63,787 tbc
Panama 21,079 19,185 n/r 43,175 tbc
Percent of respondents that believe a police chief
found to have taken money from a criminal
organization will likely be sent to jail 3 4
n/a n/a n/a n/a tbc Includes data for INL-supported activities.
Belize 55% 55% n/r 40% tbc This measure is the percent of respondents in the World Justice Project General
Population Poll who answered either “very likely” or “likely” to the question: “If a
police chief is found taking money from a criminal organization, such as a drug
cartel or an arms smuggler, how likely is this officer to be sent to jail?” Public
perceptions of police corruption and accountability is an indicator of a partner
nation’s capacity to reduce the corruption of public officials. This survey is
conducted every second year in CARSI countries. In years in which the survey is
not conducted in a country, the result from the prior year is included.
Costa Rica 64% 64% n/r 61% tbc
El Salvador 57% 53% n/r 53% tbc
Guatemala 50% 59% n/r 59% tbc
Honduras 52% 52% n/r 55% tbc
Nicaragua 52% 52% n/a 60% tbc
Panama 57% 57% n/r 50% tbc
1 Fiscal Year (FY) refers to the FY in which results occurred, unless otherwise noted. 2 FY 2020 targets are to be confirmed (TBC) due to funding uncertainties and unknown impact of COVID-19. 3 INL reports data for this measure through the World Justice Project’s Global Population Poll (GPP). WJP administers the GPP in each country every other year. The FY 2019 data in this report represents the combined calendar
year 2017 and 2018 data for these countries. 4 Data reported by calendar year.

Attachment 3: U.S. Strategy for Central America – El Salvador, Guatemala, and Honduras Context Indicators
1
Governance
Caption Tax Revenue as a Percentage of GDP has remained relatively steady in El Salvador, Guatemala, and Honduras from 2014 to 2019. The IMF projects tax revenue decreases in El Salvador, Guatemala, and Honduras in 2020 due largely to the Coronavirus outbreak. Despite these projections, tax revenue as a percentage of GDP remains high in El Salvador, Guatemala, and Honduras when compared to LAC regional averages (13.72 as of 2018) according to the World Bank. Sources Indicators: El Salvador: Banco Central de Reserva de El Salvador; Guatemala: Ministerio de Finanzas Públicas; Honduras: World Bank; Regional average: USAID analysis of World Bank data Analysis: IMF Report, available at https://www.imf.org/~/media/Files/Publications/CR/2017/cr17331.ashx; World Bank, available at https://data.worldbank.org/indicator/GC.TAX.TOTL.GD.ZS

Attachment 3: U.S. Strategy for Central America – El Salvador, Guatemala, and Honduras Context Indicators
2
Caption Perceptions of corruption in El Salvador, Guatemala, and Honduras have continued to deteriorate from 2014 into 2019 and remain poor by global and regional standards according to the Corruption Perception Index (CPI). Transparency International reports that the majority of citizens in El Salvador, Guatemala, and Honduras believe that corruption is getting worse and that presidents, parliamentarians, and public officials are the worst offenders. According to the Washington Office on Latin America (WOLA), while laws regarding corruption have improved since 2015, impunity and lack of prosecution of corrupt officials have contributed toward a decrease in trust of public officials and fueled discontent among citizens. Furthermore, increased social media usage in El Salvador, Guatemala, and Honduras has further exacerbated distrust and dissatisfaction in governments, according to LAPOP. For the CPI, the maximum score is 100; a higher score indicates lower corruption. Sources Indicators: Transparency International: https://www.transparency.org/en/cpi Analysis: Global Corruption Barometer Latin America & Caribbean 2019, available at https://images.transparencycdn.org/images/2019_GCB_LatinAmerica_Caribbean_Full_Report_200409_091428.pdf; WOLA, available at https://www.wola.org/programs/issues/monitoring-u-s-and-international-aid-to-central-america/; LAPOP 2019 Pulse of Democracy Report, available at https://www.vanderbilt.edu/lapop/ab2018/2018-19_AmericasBarometer_Regional_Report_10.13.19.pdf

Attachment 3: U.S. Strategy for Central America – El Salvador, Guatemala, and Honduras Context Indicators
3
Caption The percent of citizens that express trust in courts in El Salvador, Guatemala, and Honduras remains low and is declining in Guatemala and Honduras. According to the LAPOP Americas Barometer Report, low levels of trust in El Salvador, Guatemala, and Honduras reflect recent LAC region-wide downward trends in perceptions that the courts guarantee a fair trial. Despite new anti-corruption laws, high levels of impunity for human rights abusers and corrupt officials remains rampant in El Salvador, Guatemala, and Honduras, further reducing citizens' trust in the justice system, according to WOLA. Also troubling are decreasing perceptions that basic human rights are guaranteed and protected by the courts in both El Salvador, Guatemala, and Honduras and the LAC region generally. Sources Indicators: All Countries: Department of State’s Office of Opinion Research Analysis: Global Corruption Barometer Latin America & Caribbean 2019, available at https://images.transparencycdn.org/images/2019_GCB_LatinAmerica_Caribbean_Full_Report_200409_091428.pdf ; WOLA, available at https://www.wola.org/programs/issues/monitoring-u-s-and-international-aid-to-central-america/; LAPOP 2019 Pulse of Democracy Report, available at https://www.vanderbilt.edu/lapop/ab2018/2018-19_AmericasBarometer_Regional_Report_10.13.19.pdf; The Dialogue, available at https://www.thedialogue.org/analysis/corruption-and-human-rights-in-the-northern-triangle/

Attachment 3: U.S. Strategy for Central America – El Salvador, Guatemala, and Honduras Context Indicators
4
Security
Caption Since 2015, El Salvador, Guatemala, and Honduras have seen dramatic decreases in national intentional homicide rates (per 100,000), though it still remains one of the most violent regions in the world. The World Health Organization (WHO) considers a rate of 10 homicides per 100,000 inhabitants or higher to be characteristic of endemic violence. Despite dramatic decreases in rates of homicide since 2014, violence in El Salvador, Guatemala, and Honduras remains endemic and higher than the LAC-wide average (22.0). El Salvador recorded dramatic declines in homicides from 2018 (50.3) to 2019 (36.0). InSight Crime attributes this decrease to reductions in deadly confrontations between security forces and gangs since, as WOLA adds, anti-gang work often results in high levels of extrajudicial killings and civilian deaths. From 2018 (41.4) to 2019 (45), Honduras saw an increase in the homicide rate. InSight Crime attributes this higher rate to multiple massacres related to territorial disputes and violence between different gangs. The Dialogue notes that high rates of impunity among human rights abusers and high rates of corruption among public officials in Honduras prevents effective interventions towards reductions in violence. Sources Indicators: El Salvador: Instituto de Medicina Legal, IML; Guatemala: Secretaría Técnica del Consejo Nacional de Seguridad; Honduras: Instituto Universitario en Democracia, Paz y Seguridad (Observatorio de la Violencia; Central America averages UNODC available at https://dataunodc.us.org/content/data/homicide-rate Analysis: 2018-2019 AmericasBarometer Report by LAPOP, available at https://www.vanderbilt.edu/lapop/ab2018/2018-19_AmericasBarometer_Regional_Report_10.13.19.pdf; InSight Crime’s 2019 Homicide Round-Up, available at https://www.insightcrime.org/news/analysis/insight-crime-2019-homicide-round-up/; Gaps in Human Rights Protections in El Salvador: Evaluating State Capacity to Protect and Promote Human Rights, available at https://www.wola.org/analysis/gaps-in-human-rights-protections-in-el-salvador-evaluating-state-capacity-to-protect-and-promote-human-rights/; The Dialogue, available at https://www.thedialogue.org/analysis/corruption-and-human-rights-in-the-northern-triangle/
Attachment 3: U.S. Strategy for Central America – El Salvador, Guatemala, and Honduras Context Indicators
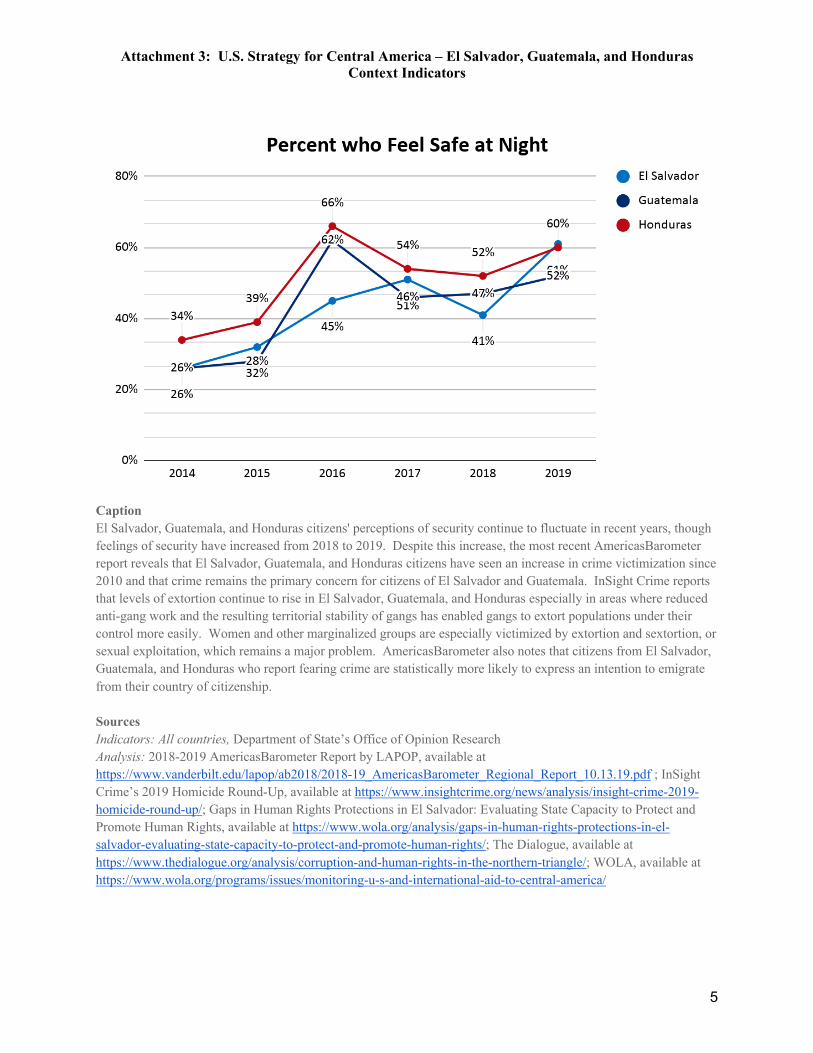
5
Caption El Salvador, Guatemala, and Honduras citizens' perceptions of security continue to fluctuate in recent years, though feelings of security have increased from 2018 to 2019. Despite this increase, the most recent AmericasBarometer report reveals that El Salvador, Guatemala, and Honduras citizens have seen an increase in crime victimization since 2010 and that crime remains the primary concern for citizens of El Salvador and Guatemala. InSight Crime reports that levels of extortion continue to rise in El Salvador, Guatemala, and Honduras especially in areas where reduced anti-gang work and the resulting territorial stability of gangs has enabled gangs to extort populations under their control more easily. Women and other marginalized groups are especially victimized by extortion and sextortion, or sexual exploitation, which remains a major problem. AmericasBarometer also notes that citizens from El Salvador, Guatemala, and Honduras who report fearing crime are statistically more likely to express an intention to emigrate from their country of citizenship. Sources Indicators: All countries, Department of State’s Office of Opinion Research Analysis: 2018-2019 AmericasBarometer Report by LAPOP, available at https://www.vanderbilt.edu/lapop/ab2018/2018-19_AmericasBarometer_Regional_Report_10.13.19.pdf ; InSight Crime’s 2019 Homicide Round-Up, available at https://www.insightcrime.org/news/analysis/insight-crime-2019-homicide-round-up/; Gaps in Human Rights Protections in El Salvador: Evaluating State Capacity to Protect and Promote Human Rights, available at https://www.wola.org/analysis/gaps-in-human-rights-protections-in-el-salvador-evaluating-state-capacity-to-protect-and-promote-human-rights/; The Dialogue, available at https://www.thedialogue.org/analysis/corruption-and-human-rights-in-the-northern-triangle/; WOLA, available at https://www.wola.org/programs/issues/monitoring-u-s-and-international-aid-to-central-america/

Attachment 3: U.S. Strategy for Central America – El Salvador, Guatemala, and Honduras Context Indicators
6
Caption Citizens' trust in the police in El Salvador, Guatemala, and Honduras remains low due to corruption and extrajudicial violence by police forces. Recent research by LAPOP shows that citizens of El Salvador, Guatemala, and Honduras are frequently asked for bribes from police officers and lack confidence that police will respond quickly to calls for help. Distrust in police has also resulted in significant underreporting of crime. InSight Crime reports that high levels of violence towards civilian and extrajudicial killings in El Salvador, Guatemala, and Honduras by police as part of anti-gang activity has further deteriorated trust in police. LAPOP reports that increased usage of social media by citizens and the sharing of stories and videos exposing police corruption and abuse with impunity has contributed toward lower levels of trust in the police across El Salvador, Guatemala, and Honduras and the LAC region more broadly. Sources Indicators: All countries, Department of State’s Office of Opinion Research Analysis: 2018-2019 AmericasBarometer Report by LAPOP, available at https://www.vanderbilt.edu/lapop/ab2018/2018-19_AmericasBarometer_Regional_Report_10.13.19.pdf; InSight Crime’s 2019 Homicide Round-Up available at https://www.insightcrime.org/news/analysis/insight-crime-2019-homicide-round-up/; Gaps in Human Rights Protections in El Salvador: Evaluating State Capacity to Protect and Promote Human Rights, available at https://www.wola.org/analysis/gaps-in-human-rights-protections-in-el-salvador-evaluating-state-capacity-to-protect-and-promote-human-rights/; The Dialogue, available at https://www.thedialogue.org/analysis/corruption-and-human-rights-in-the-northern-triangle/

Attachment 3: U.S. Strategy for Central America – El Salvador, Guatemala, and Honduras Context Indicators
7
Prosperity
Caption National poverty rates (poverty headcount ratio based on national poverty lines) in El Salvador, Guatemala, and Honduras remain high, exceeding LAC annual averages in all cases; poverty rates in Guatemala and Honduras exceed the 10-year (2008-2018) average for Central America (41.7%). Guatemala does not have national poverty data after 2014. Sources Indicators: All countries, World Bank Poverty and Equity Data Note The source of poverty rate statistics for Honduras in previous years’ Progress Reports Honduras’s National Institute of Statistics (INE). For comparability with other countries and the regional average, this year’s report uses World Bank statistics. For more information, see https://www.ine.gob.hn/V3/imag-doc/2019/07/Pobreza-en-los-Hogares.pdf

Attachment 3: U.S. Strategy for Central America – El Salvador, Guatemala, and Honduras Context Indicators
8
Caption Unemployment and lack of opportunities in El Salvador, Guatemala, and Honduras are often cited by local youth populations as a barrier to peace and stability in their communities. From 2018 to 2019, estimates for youth unemployment improved slightly in El Salvador and Guatemala. While estimates of youth unemployment for all three countries fall below the annual average for LAC, the International Labor Organization (ILO) estimates that nearly a third of youth are not in employment, education, or training in each of these countries. Moreover, the ILO estimates that youth unemployment will increase throughout the LAC region in coming years. Sources Indicators: All countries, International Labor Organization Analysis: Global Employment Trends for Youth 2020, available at https://www.ilo.org/wcmsp5/groups/public/---dgreports/---dcomm/---publ/documents/publication/wcms_737648.pdf

Attachment 3: U.S. Strategy for Central America – El Salvador, Guatemala, and Honduras Context Indicators
9
Caption Lower-secondary completion rates in El Salvador, Guatemala, and Honduras remain relatively unchanged since 2014. This indicator is an upper estimate of the actual lower secondary completion rate; the numerator may include late entrants and overage children who have repeated one or more grades of lower secondary education as well as children who entered school early. According to the World Bank, on average, close to 25 percent of students in the sub-region leave the education system by the age of 15.
Sources Indicators: All countries, UNESCO Institute for Statistics Analysis: World Bank, Out of School and Out of Work, available at https://openknowledge.worldbank.org/bitstream/handle/10986/22349/K8318.pdf?sequence=8

Attachment 3: U.S. Strategy for Central America – El Salvador, Guatemala, and Honduras Context Indicators
10
Caption The most recent Ease of Doing Business top 50 ranked countries do not include any Latin American countries. In 2019, El Salvador and Guatemala sat slightly above the LAC average (59.1) due to a variety of regulatory reforms that made starting a business easier in each country. El Salvador and Guatemala scored above regional averages on sub-indicators related to getting electricity, trading across borders, and starting a business, while Honduras’ score fell below these averages.
Sources Indicators: World Bank Doing Business Analysis: World Bank Doing Business 2020, Regional Profile, available at https://www.doingbusiness.org/content/dam/doingBusiness/media/Profiles/Regional/DB2020/LAC.pdf

Attachment 3: U.S. Strategy for Central America – El Salvador, Guatemala, and Honduras Context Indicators
11
Migration
U.S. Customs and Border Protection Apprehended and Inadmissible Migrants FY 2014-20201
Caption U.S. Customs and Border Protection (CBP) encounters of migrants from El Salvador, Guatemala, and Honduras (apprehended migrants in between U.S. ports of entry and those deemed inadmissible at U.S. ports of entry) on the southwest border peaked in FY 2019, but have greatly decreased as of August 2020 due to pandemic-related border closures and U.S. cooperation with Mexico and Central America. The total number of apprehensions in FY 2019 remained below the levels observed throughout most of the 1980s, 1990s and 2000s, when around 1 million or more migrants were apprehended each fiscal year. CBP apprehension and inadmissible statistics include counts of unaccompanied children, accompanied minor children family units, and single adults. Sources U.S. Customs and Border Protection, available at https://www.cbp.gov/newsroom/stats/sw-border-migration/usbp-sw-border-apprehensions and https://www.cbp.gov/newsroom/stats/sw-border-migration/ofo-sw-border-inadmissibles
1 FY 2014-2016 inadmissible data is not available for El Salvador, Guatemala, and Honduras.

Attachment 3: U.S. Strategy for Central America – El Salvador, Guatemala, and Honduras Context Indicators
12
Caption The number of apprehensions of Salvadoran and Guatemalan migrants by Mexican government authorities peaked in 2015 but increased from 2018 to 2019. The number of apprehensions of Honduran migrants, also high in 2015 and 2016, increased greatly from 2018 to 2019. The total number of Mexican government apprehensions of migrants from all three countries in 2019 (152,138) was greater than 2016 levels (150,035), but less than 2015 levels (177,949). Sources Gobierno de México, Unidad de Política Migratoria, Registro e Identidad de Personas, Boletín Estadístico, available at http://www.politicamigratoria.gob.mx/es/PoliticaMigratoria/Boletines_Estadisticos

Attachment 3: U.S. Strategy for Central America – El Salvador, Guatemala, and Honduras Context Indicators
13
Caption The number of Salvadoran, Guatemalan, and Honduran nationals returned to their countries of origin remained high in the first 9 months of 2019 compared to 2018 levels. The majority of returnees are men. Source International Organization for Migration’s Northern Triangle Migration Initiative (NTMI), available at https://mic.iom.int/webntmi/en/downloads/