
FY 2015 Results Presentation - Bumi Armada FY2015 Presentation.pdfThis presentation may contain...
17
“Knots Ahead of the Rest” FY 2015 Results Presentation 26 February 2016
Transcript of FY 2015 Results Presentation - Bumi Armada FY2015 Presentation.pdfThis presentation may contain...
“Knots Ahead of the Rest”
FY 2015 Results Presentation
26 February 2016
Disclaimer
2
This presentation may contain statements of future expectations and other forward-looking statements based on management’s
and/or other information providers’ current views and assumptions and involve known and unknown risks and uncertainties that
could cause actual results, performance, or events to differ materially from those in such statements. Such forward-looking
statements are subject to various risks and uncertainties, which may materially and adversely impact the actual results and
performance of the Company’s businesses. Certain such forward-looking statements can be identified by the use of forward-looking
terminology such as “believes”, “may”, “will”, “should”, “would be”, “expects” or “anticipates” or similar expressions, or the negative
thereof, or other variations thereof, or comparable terminology, or by discussions of strategy, plans, or intentions. Should one or
more of these risks or uncertainties materialise, or should underlying assumptions prove incorrect, actual results may vary materially
from those described as anticipated, believed, or expected in this presentation. The Company does not intend, and does not assume
any obligation, to update any industry information or forward-looking statements set forth in this presentation to reflect subsequent
events or future circumstances.

Overview Q4 2015
Overview
Core earnings were strong despite non-cash charges
Cash flows from operations remain positive
Significant reductions have been made in overheads
FPSO
Conversion projects continue on track
FPSO operational uptime remains high
Positive prospect in Vietnam, other new projects continue to be deferred.
OMS
OSV fleet utilisation continues to deteriorate (46% versus 54% in Q3 2015)
Some new short-term charters secured in Q1 2016.
Strong activity on the Installer and recovery made on the C7 project installation
3

Major Projects Overview
Armada Olombendo (15-06)
70% complete
E-House on-board
Fiscal Metering Module
Utilities and Diesel Generator Modules
4
Armada Kraken (North Sea)
80% complete
Accommodation ready
Power Generators
Turret crane installed
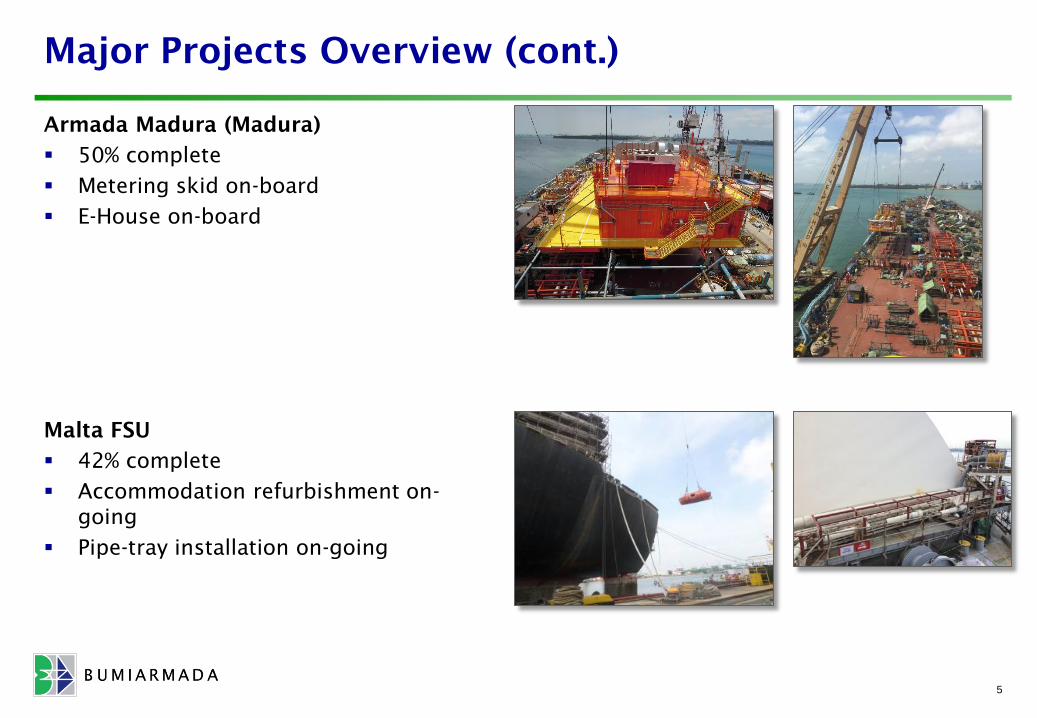
Major Projects Overview (cont.)
Armada Madura (Madura)
50% complete
Metering skid on-board
E-House on-board
5
Malta FSU
42% complete
Accommodation refurbishment on-
going
Pipe-tray installation on-going
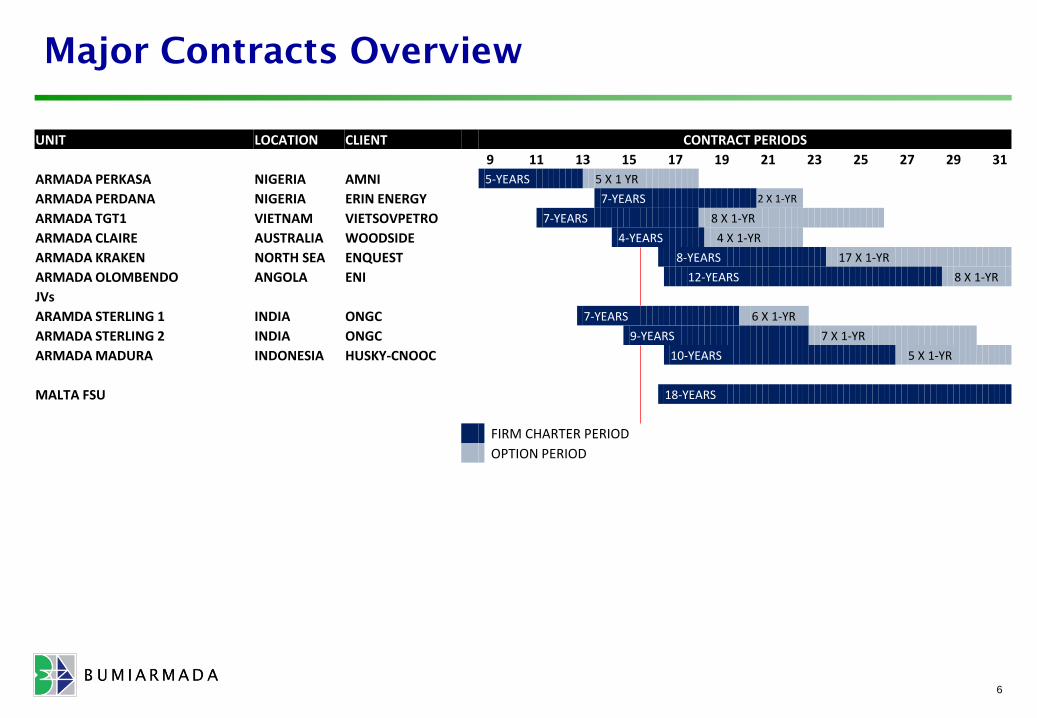
Major Contracts Overview
6
UNIT LOCATION CLIENT CONTRACT PERIODS
9 11 13 15 17 19 21 23 25 27 29 31
ARMADA PERKASA NIGERIA AMNI 5-YEARS 5 X 1 YR
ARMADA PERDANA NIGERIA ERIN ENERGY 7-YEARS 2 X 1-YR
ARMADA TGT1 VIETNAM VIETSOVPETRO 7-YEARS 8 X 1-YR
ARMADA CLAIRE AUSTRALIA WOODSIDE 4-YEARS 4 X 1-YR
ARMADA KRAKEN NORTH SEA ENQUEST 8-YEARS 17 X 1-YR
ARMADA OLOMBENDO ANGOLA ENI 12-YEARS 8 X 1-YR
JVs
ARAMDA STERLING 1 INDIA ONGC 7-YEARS 6 X 1-YR
ARMADA STERLING 2 INDIA ONGC 9-YEARS 7 X 1-YR
ARMADA MADURA INDONESIA HUSKY-CNOOC 10-YEARS 5 X 1-YR
MALTA FSU 18-YEARS
FIRM CHARTER PERIOD
OPTION PERIOD

“Knots Ahead of the Rest”
Financial Results
Key takeaways
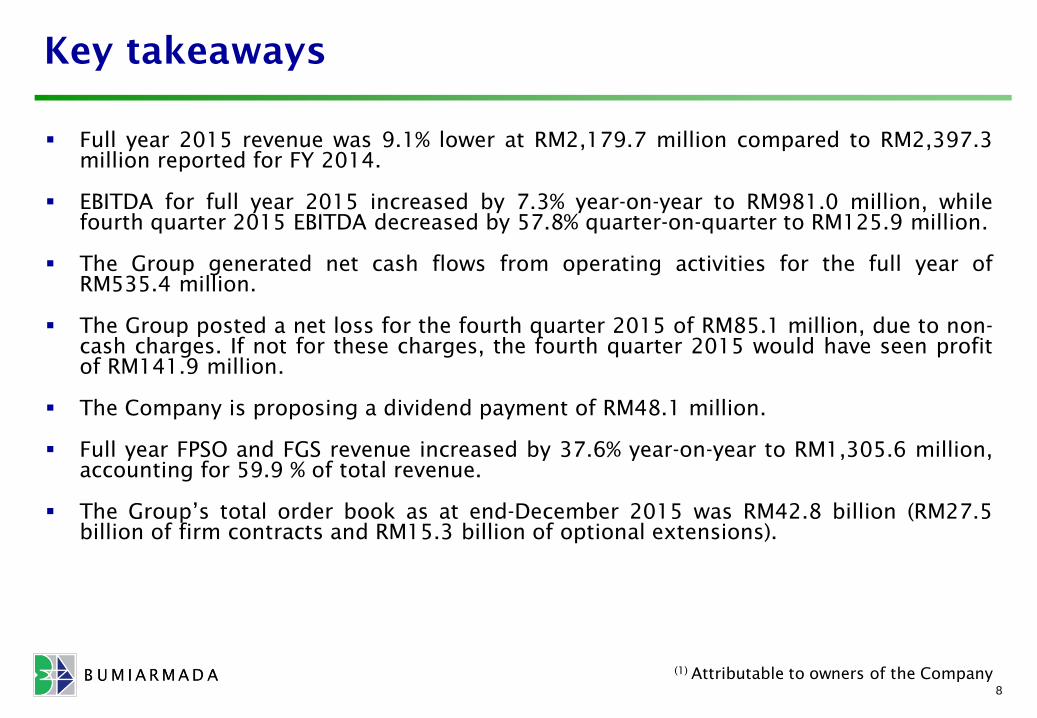
Full year 2015 revenue was 9.1% lower at RM2,179.7 million compared to RM2,397.3
million reported for FY 2014.
EBITDA for full year 2015 increased by 7.3% year-on-year to RM981.0 million, while
fourth quarter 2015 EBITDA decreased by 57.8% quarter-on-quarter to RM125.9 million.
The Group generated net cash flows from operating activities for the full year of
RM535.4 million.
The Group posted a net loss for the fourth quarter 2015 of RM85.1 million, due to non-
cash charges. If not for these charges, the fourth quarter 2015 would have seen profit
of RM141.9 million.
The Company is proposing a dividend payment of RM48.1 million.
Full year FPSO and FGS revenue increased by 37.6% year-on-year to RM1,305.6 million,
accounting for 59.9 % of total revenue.
The Group’s total order book as at end-December 2015 was RM42.8 billion (RM27.5
billion of firm contracts and RM15.3 billion of optional extensions).
(1) Attributable to owners of the Company
8

Results Overview – Q4 2015 vs. Q3 2015 (RM’mil)
9
Major decrease of EBITDA due to:• Lower OSV utilisation
• Allowance for doubtful debts• Offset with stronger
contributions from FPSO & FGS and T&I segments
Higher revenue due to:• Increased activity on the Installer,
recognition of VO in respect of the installation of the C7 FPSO and for the
LukOil project• Increase in conversion activity on the Malta
FSUPartly offset by:
• Lower OSV utilisation
• Included in the LAT is the following exceptional items:
• Impairment of property, plant and equipment within FPSO segment of
RM41.3 mil• Impairment of available for sale of RM4.2
mil• Allowance for doubtful debts of RM183.3
mil• Excluding exceptional items above, the
Group posted a profit of RM141.9 mil
559.5589.0
Q3 2015 Q4 2015
Revenue
+5.3%298.6
125.9
Q3 2015 Q4 2015
EBITDA
-57.8%
71.0
(86.9)
Q3 2015 Q4 2015
Net Profit / (Loss)
> -100%

10
Results Overview – FY 2015 vs. FY 2014 (RM’mil)
Increase of EBITDA due to:• Higher contribution from FPSO and
FGS projects• A gain on disposal of subsidiary
• Higher share of joint ventures mainly from Madura FPSO conversion
Slightly offset by:• Lower OSV utilisation• Retrenchment costs
• Allowance for doubtful debts
Lower revenue:• Reduced activity from the LukOil
and lower utilisation of the subsea vessels
• Lower OSV utilisationPartly offset by:
• Increase due mainly to higher conversion activity from the ENI
1506 FPSO and Malta FSU projects
• Included in the LAT is the following exceptional items:
• Impairment of property, plant and equipment and non-current assets held
for sale of RM395.1 mil• Share of impairment of non-core asset at
a joint venture of RM20.5 mil• Impairment of available for sale of
RM25.2 mil• Impairment of investment in a joint
venture of RM2.7 mil• Allowance for doubtful debts of RM168.0
mil• Excluding exceptional items above, the
Group posted a profit of RM369.7 mil
2,397.32,179.7
FY 2014 FY 2015
Revenue
-9.1%
914.0 981.0
FY 2014 FY 2015
EBITDA
+7.3%224.4
(241.8)
FY 2014 FY 2015
Net Profit / (Loss)
> -100%
11
Revenue composition by segments – Q4 2015 vs.
Q3 2015 (RM’mil)
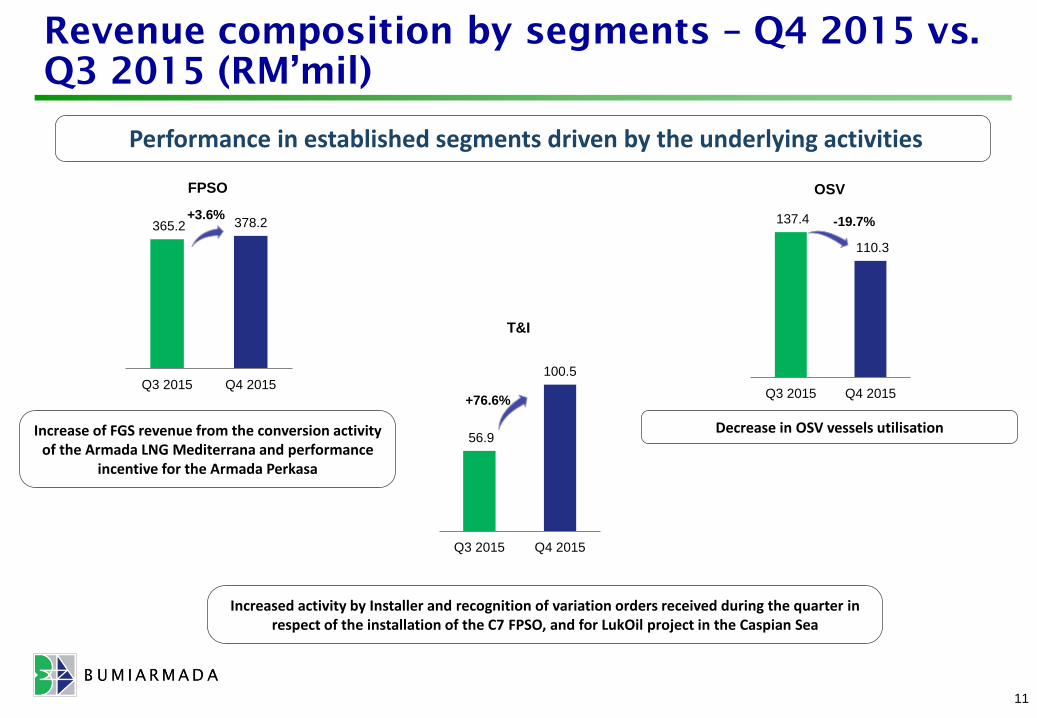
Decrease in OSV vessels utilisationIncrease of FGS revenue from the conversion activity of the Armada LNG Mediterrana and performance
incentive for the Armada Perkasa
Increased activity by Installer and recognition of variation orders received during the quarter in respect of the installation of the C7 FPSO, and for LukOil project in the Caspian Sea
Performance in established segments driven by the underlying activities
365.2 378.2
Q3 2015 Q4 2015
FPSO
+3.6% 137.4
110.3
Q3 2015 Q4 2015
OSV
-19.7%
56.9
100.5
Q3 2015 Q4 2015
T&I
+76.6%

12
Revenue composition by segments – FY 2015 vs.
FY 2014 (RM’mil)
Decrease in OSV vessels utilisationHigher conversion activity from the ENI 1506 FPSO project and FGS revenue from conversion activity of a
floating storage unit, the Armada LNG Mediterrana
Reduced activity from the LukOil project in the Caspian Sea and lower utilisation of the Armada Hawk and the Armada Condor
Performance in established segments driven by the underlying activities
949.1
1,305.6
FY 2014 FY 2015
FPSO
+37.6%654.6
538.1
FY 2014 FY 2015
OSV
-17.8%
793.6
336.0
FY 2014 FY 2015
T&I
-57.7%
Profit after tax excluding provisions and non-cash
charges
13
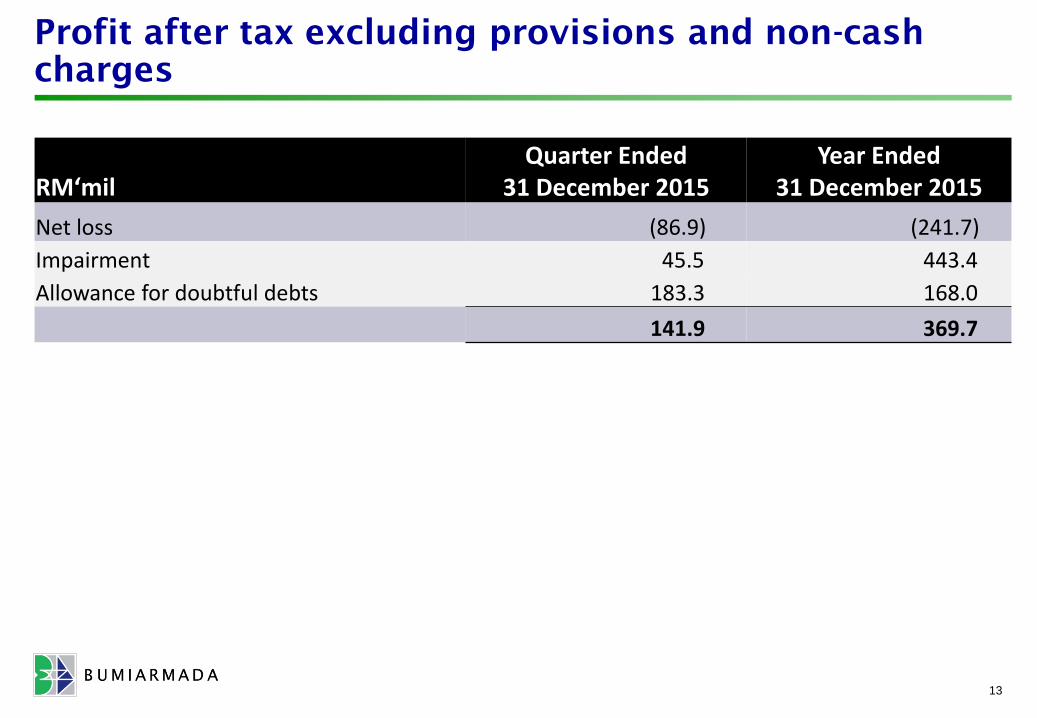
RM‘milQuarter Ended
31 December 2015Year Ended
31 December 2015
Net loss (86.9) (241.7)
Impairment 45.5 443.4
Allowance for doubtful debts 183.3 168.0
141.9 369.7
Revenue composition by geographical %
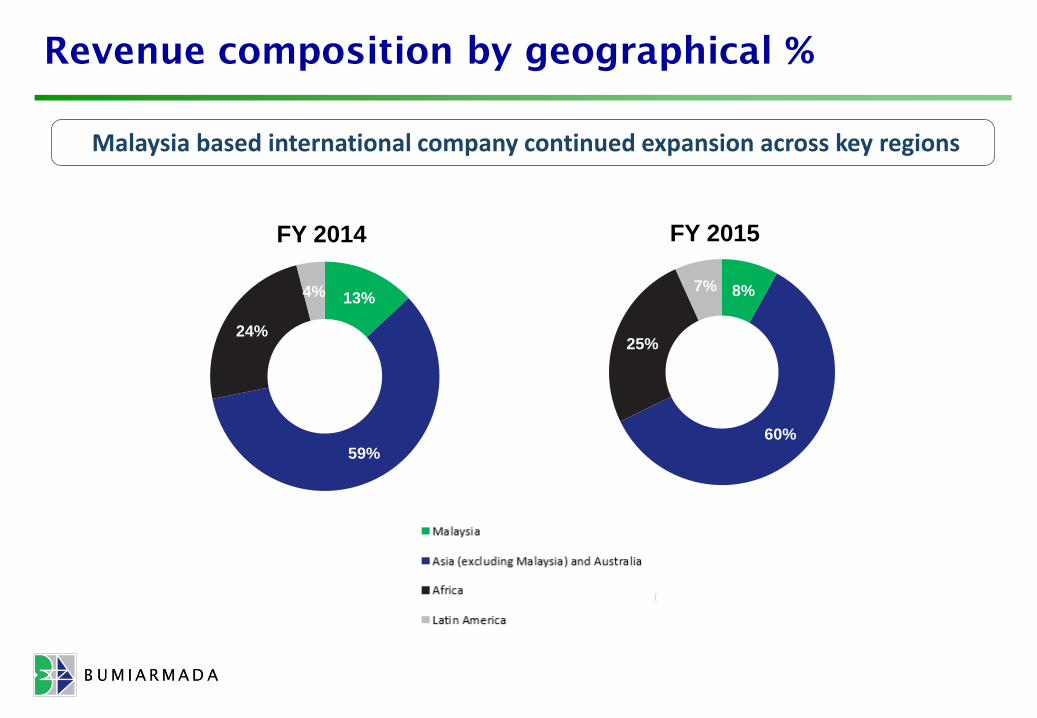
Malaysia based international company continued expansion across key regions
13%
59%
24%
4%
FY 2014
8%
60%
25%
7%
FY 2015
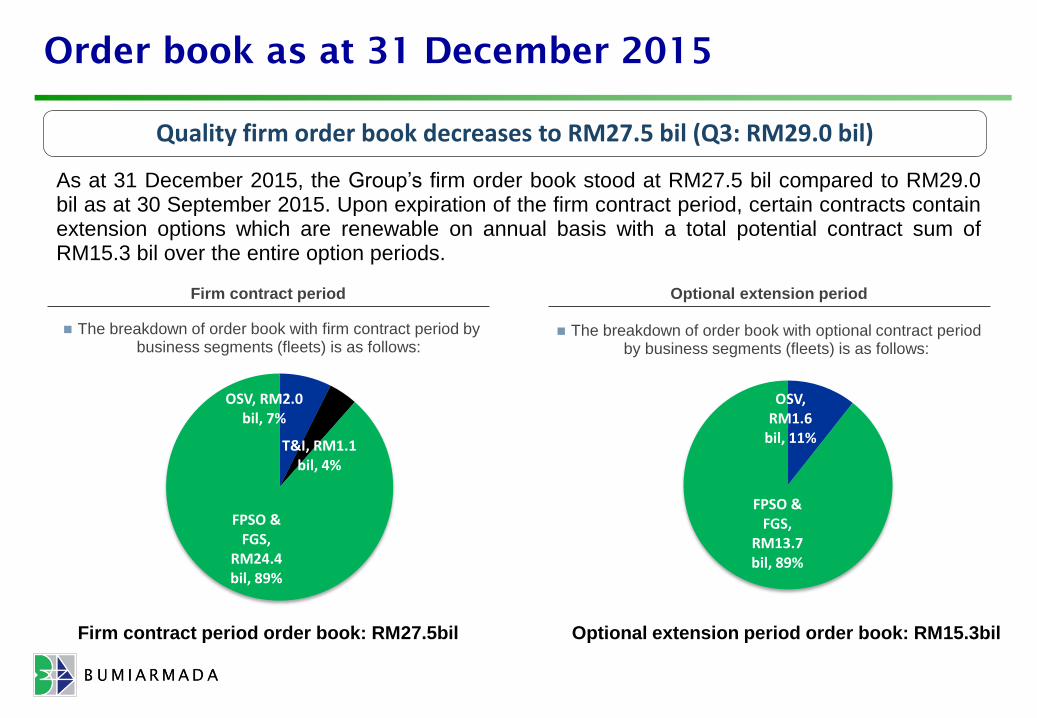
As at 31 December 2015, the Group’s firm order book stood at RM27.5 bil compared to RM29.0bil as at 30 September 2015. Upon expiration of the firm contract period, certain contracts containextension options which are renewable on annual basis with a total potential contract sum ofRM15.3 bil over the entire option periods.
The breakdown of order book with firm contract period by business segments (fleets) is as follows:
The breakdown of order book with optional contract period by business segments (fleets) is as follows:
Firm contract period Optional extension period
Firm contract period order book: RM27.5bil Optional extension period order book: RM15.3bil
Quality firm order book decreases to RM27.5 bil (Q3: RM29.0 bil)
Order book as at 31 December 2015
OSV, RM2.0 bil, 7%
T&I, RM1.1 bil, 4%
FPSO & FGS,
RM24.4 bil, 89%
OSV, RM1.6
bil, 11%
FPSO & FGS,
RM13.7 bil, 89%

Summary
Focus on the conversion of the four new projects.
Continue to generate net positive cash flow from operations.
Focus on cost efficiency and cost reductions.
Strong prospects for longer term growth.
2017-2018 will be strong years for BAB as new projects come on-stream.
16

“Knots Ahead of the Rest”
Q&A


![Analyst Presentation (Q2 FY2015-16) [Company Update]](https://static.fdocuments.net/doc/165x107/577ca7931a28abea748c763a/analyst-presentation-q2-fy2015-16-company-update.jpg)


![Analyst Presentation (Q1 FY2015-16) [Company Update]](https://static.fdocuments.net/doc/165x107/577cb26f1a28aba7118c046a/analyst-presentation-q1-fy2015-16-company-update.jpg)