FY 2015-2019 General Revenue Forecast Presentation - …€¦ · · 2014-02-18Overview . Current...
43
Presentation Steven A. Solomon Director of Finance February 18, 2014 FY 2015-2019 General Revenue Forecast
Transcript of FY 2015-2019 General Revenue Forecast Presentation - …€¦ · · 2014-02-18Overview . Current...

Presentation
Steven A. Solomon Director of Finance
February 18, 2014
FY 2015-2019 General Revenue Forecast

Overview Current Economic Outlook
National State Local
FY 2014 2nd Quarter Revenue Update Five Year Revenue Forecasting Process FY 2015-2019 Revenue Forecast
Residential Real Estate Tax Revenue Commercial Real Estate Tax Revenue Personal Property Tax Revenue Sales Tax Revenue All Other Revenue Summary
2 FY 2015-2019 General Revenue Forecast - February 18, 2014

CURRENT ECONOMIC OUTLOOK
3

Current Economic Situation: National
S & P 500, 2009-14 •S&P 500: Closed at 1,831.37 on Dec. 31, 2013; Up 168% from 2009 bottom; lost some ground to start out 2014 •GDP: 3.2% in 4th Quarter 2013 (prel.), following 4.1% in 3rd Quarter; strengthening economy despite continued sequestration and federal government shutdown in October
•U.S. Unemployment Rate: 6.6% in Jan. 2014, compared to 7.9% one year earlier; 1.37 million net new jobs in 2013 •First time unemployment claims: currently bounded between 325,000 and 350,000, a slight improvement over 2013
•New home sales: total sales in 2013 increased 16.3% to 428,000 from 368,000 in 2012; still well below pre-recession levels
•Retail sales: increased 2.4% annually in December; if consumers continue to be willing to spend, consumption gains could be one of the leading contributors to 2014 GDP growth
4 FY 2015-2019 General Revenue Forecast - February 18, 2014

Current Economic Situation: State
• Unemployment at 4.8% in December 2013 compared to 5.4% one year earlier
• Employment grew by over
30,000 (0.8%) y-o-y in Q2 CY 2013 • Average weekly wages
increased 1.7% y-o-y in Q2 CY 2013
• Total state general fund
revenue collections exceeded the forecast by $263.6 million in fiscal year 2013. Total revenues rose 5.3 percent, ahead of the revised annual forecast of 3.6 percent growth
Source: Virginia Employment Commission Source: Virginia Employment Commission
Source: Virginia Employment Commission Source: Virginia Secretary of Finance
5 FY 2015-2019 General Revenue Forecast - February 18, 2014

Current Economic Situation: State
Currently the Commonwealth does two-year revenue forecasts The state’s FY 14-15 revenue forecast has been reduced by $140M
FY 14 General Fund revenue estimates were reduced by $125 million FY 15 General Fund revenue estimates were reduced by $15 million
This revision was based on updated economic information and actual revenue collections through January 31, 2014 Year-to-date collections fell .5% from last year, compared to the December forecast for 1.7% growth The two primary revenue classes that led to this decline are non-withholding individuals (primarily self-employed) and corporate income taxes This will impact the Commonwealth budget process this year
6 FY 2015-2019 General Revenue Forecast - February 18, 2014

Current Economic Situation: Local
• Unemployment Rate: 4.3% December
2013 compared to 4.5% in December a year earlier and still below the nation and state rates
• At-place employment (117,965 in Q2 CY 2013) up 3.9% y-o-y—12.5% since 2008
• Housing market values are moving
toward a more sustainable growth rate—inventory still down. Average sale price, Dec. 2013: $335,403—6.1% increase y-o-y
• 2013 foreclosures (632) down 81% since
2009 peak; down 33% y-o-y
• Office, Industrial and Flex commercial vacancy rates improving, Retail vacancy slightly higher, y-o-y. Total vacancy rate (8.4% in December 2013) compared to 9.0% one year earlier; total new construction continues at a generally reduced level from peak
• Sales tax revenue growth experienced slight decline due to uncertainty caused by sequestration and the Federal government shutdown
Source: Virginia Employment Commission
Source: MRIS
Source: . Wm. Co. Courthouse
Source: Pr. Wm. Co. Finance Dept.
7 FY 2015-2019 General Revenue Forecast - February 18, 2014

Current Economic Situation: PWC Residential Real Estate Market
8 FY 2015-2019 General Revenue Forecast - February 18, 2014
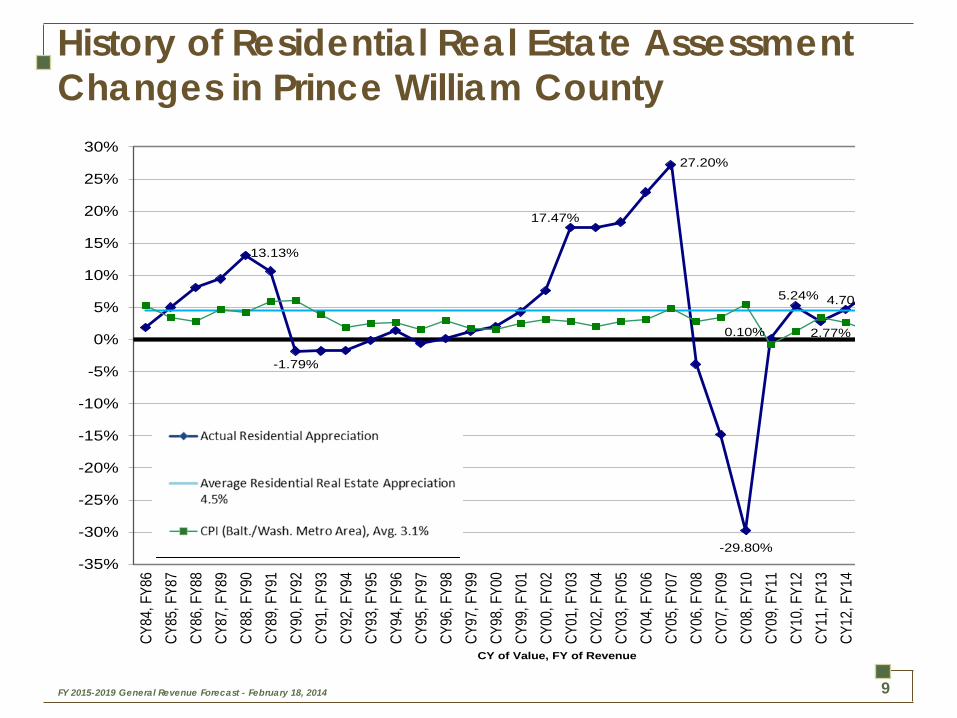
History of Residential Real Estate Assessment Changes in Prince William County
13.13%
-1.79%
17.47%
27.20%
-29.80%
0.10%
5.24%
2.77%
4.70%
-35%
-30%
-25%
-20%
-15%
-10%
-5%
0%
5%
10%
15%
20%
25%
30%CY
84, F
Y86
CY85
, FY8
7CY
86, F
Y88
CY87
, FY8
9CY
88, F
Y90
CY89
, FY9
1CY
90, F
Y92
CY91
, FY9
3CY
92, F
Y94
CY93
, FY9
5CY
94, F
Y96
CY95
, FY9
7CY
96, F
Y98
CY97
, FY9
9CY
98, F
Y00
CY99
, FY0
1CY
00, F
Y02
CY01
, FY0
3CY
02, F
Y04
CY03
, FY0
5CY
04, F
Y06
CY05
, FY0
7CY
06, F
Y08
CY07
, FY0
9CY
08, F
Y10
CY09
, FY1
1CY
10, F
Y12
CY11
, FY1
3CY
12, F
Y14
CY of Value, FY of Revenue
Actual Residential Appreciation
FY15-19 Forecast
Average Residential Real EstateAppreciation 4.5%
CPI (Balt/Wash metro area), Avg. 3.1%
9 FY 2015-2019 General Revenue Forecast - February 18, 2014

FY 2014 SECOND QUARTER REVENUE UPDATE
10
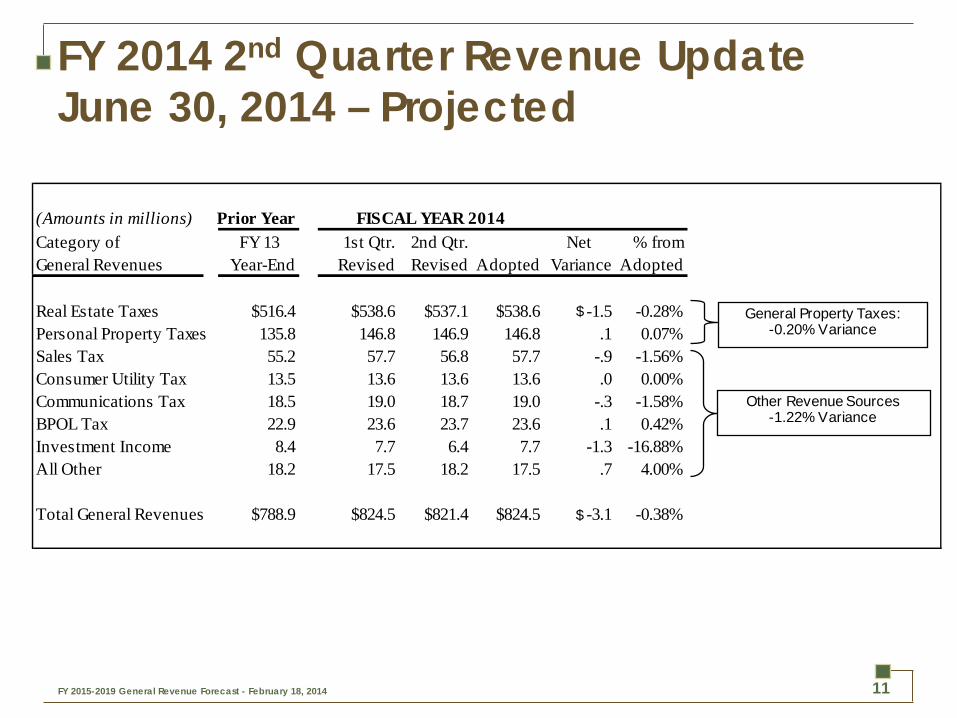
FY 2014 2nd Quarter Revenue Update June 30, 2014 – Projected
(Amounts in millions) Prior YearCategory of FY 13 1st Qtr. 2nd Qtr. Net % fromGeneral Revenues Year-End Revised Revised Adopted Variance Adopted
Real Estate Taxes $516.4 $538.6 $537.1 $538.6 -1.5 -0.28%Personal Property Taxes 135.8 146.8 146.9 146.8 .1 0.07%Sales Tax 55.2 57.7 56.8 57.7 -.9 -1.56%Consumer Utility Tax 13.5 13.6 13.6 13.6 .0 0.00%Communications Tax 18.5 19.0 18.7 19.0 -.3 -1.58%BPOL Tax 22.9 23.6 23.7 23.6 .1 0.42%Investment Income 8.4 7.7 6.4 7.7 -1.3 -16.88%All Other 18.2 17.5 18.2 17.5 .7 4.00%
Total General Revenues $788.9 $824.5 $821.4 $824.5 -3.1 -0.38%
FISCAL YEAR 2014
General Property Taxes:-0.20% Variance
Other Revenue Sources-1.22% Variance
$
$
11 FY 2015-2019 General Revenue Forecast - February 18, 2014

FIVE YEAR REVENUE FORECASTING PROCESS
12

Multi-Year Revenue Forecasting PWC does multi-year revenue and expenditure forecasts through the Five Year Plan
The FY 14–18 forecast was developed in January 2013 – that is the revenue projection we are now updating GFOA referred to this as a “best practice” that should be adopted by other local governments in the United States
Currently the Commonwealth does two year revenue forecasts Every other local government jurisdiction in this region does one year forecasting
Those jurisdictions see the FY 15 projection for the first time when their FY 15 budget is presented
13 FY 2015-2019 General Revenue Forecast - February 18, 2014

Revenue Forecasting Process
BOCS Adopts a Tax Policy Identify Major Revenue Sources Ongoing Analysis of U.S., State, and Local Trends Bring in Knowledgeable Partners Developing Projections
Data driven Conservative assumptions
Monitor Trends
14 FY 2015-2019 General Revenue Forecast - February 18, 2014

Identify The Revenue Sources
Real Estate, Personal Property, and Sales Taxes Comprise Over 89% of Prince William County Revenue
64.99%
17.74%
6.91%
1.62% 2.23%2.89%0.81%
2.81%Real Estate Taxes
Personal Property Taxes
Sales Tax
Consumer Utility Tax
Communications Sales Tax
BPOL Tax
Investment Income
All Other Revenue
15 FY 2015-2019 General Revenue Forecast - February 18, 2014

Develop a Process To Become Knowledgeable About Local, State and National Economic Trends
JOBS RELATED DATA
PRODUCTION/INVENTORY DATA
HOUSING
SALES
GOVERNMENT / GDP
PRICES / EX-IM
16 FY 2015-2019 General Revenue Forecast - February 18, 2014

Internal and External Partners in Developing a Revenue Forecast
FINANCE
STAFF
Budget
Development Services
Economic Development
Planning
Public Works
Schools
State Economists
Association of Realtors
Federal Reserve Bank of Richmond
Local Builders Industry Assoc.
Commercial Real Estate Brokers
Auto Industry
Retail Industry
17 FY 2015-2019 General Revenue Forecast - February 18, 2014

Residential Real Estate Assessments The Virginia Constitution requires properties to be assessed at fair market value as of January 1 (tax year) Board cannot adopt separate rates for residential and commercial real estate Metropolitan Regional Information Systems (MRIS) is the service the County uses to monitor residential sales throughout the year The Assessments Office continuously studies the sales market and collects information about properties to estimate fair market value as of January 1 of each year
18 FY 2015-2019 General Revenue Forecast - February 18, 2014

Residential Real Estate Assessments Sales occurring from January 1st to December 31st of each year are analyzed to determine if market values of residential properties should change Since the assessment is as of January 1st, sales occurring in the last quarter of the year are weighted more heavily December 2013 average sales price ($335,403) were higher than the average of all other months
19 FY 2015-2019 General Revenue Forecast - February 18, 2014
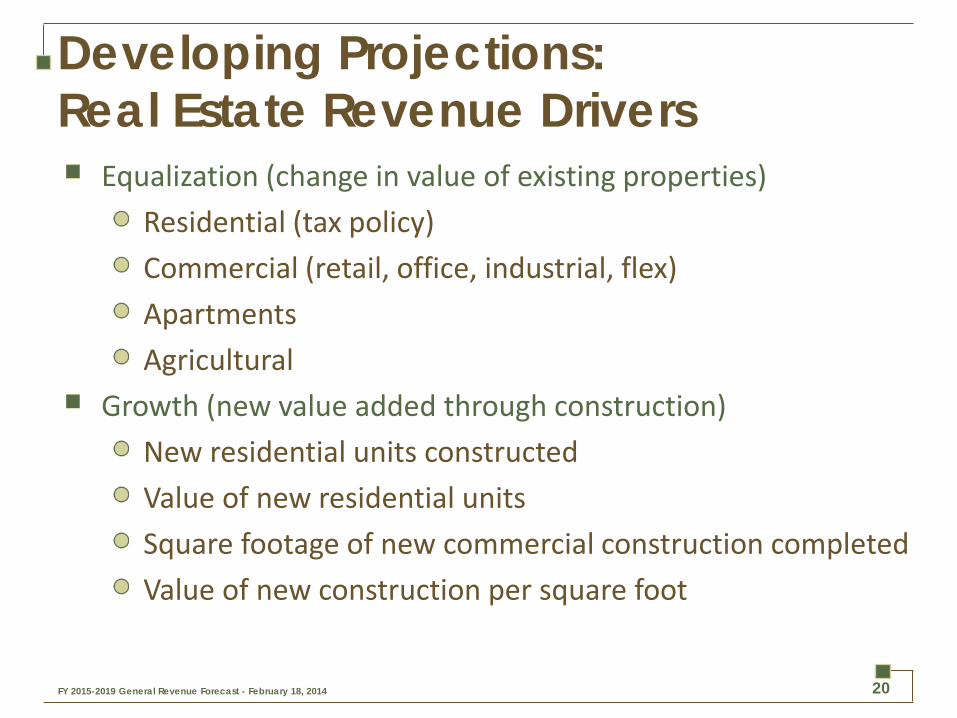
Developing Projections: Real Estate Revenue Drivers
Equalization (change in value of existing properties) Residential (tax policy) Commercial (retail, office, industrial, flex) Apartments Agricultural
Growth (new value added through construction) New residential units constructed Value of new residential units Square footage of new commercial construction completed Value of new construction per square foot
20 FY 2015-2019 General Revenue Forecast - February 18, 2014

Developing Projections: Residential Revenue Drivers
Real Estate Market Metrics Average Sales Price Average Number of Days on the Market Ratio of Active Listings to Sales (Months of Inventory) Foreclosures
External Factors 30-Year Mortgage Rates Unemployment rate Credit environment
21 FY 2015-2019 General Revenue Forecast - February 18, 2014

Real Estate Revenue Monitoring
Sales price vs. assessed values Sales volume Foreclosures Real estate market metrics (MRIS)
Number of days on market Inventory to sales ratio Percentage of sales using financing Percentage of sales price to list price Market stratification data Average sales price
Residential Financing PWC – December, 2013
Source: MRIS.com
22 FY 2015-2019 General Revenue Forecast - February 18, 2014

Commercial Real Estate Assessments The Virginia Constitution requires properties to be assessed at fair market value as of January 1 (tax year) The frequency of sales of comparable properties are not as prevalent in the commercial market as they are in the residential market As a result, Prince William County utilizes the “income” approach to valuing commercial property National and regional capitalization rate information is analyzed to determine if market values of income producing properties should change Income & expense information is gathered from County businesses to assess their “market value” Lease rates are valued at the “market rate” as of January 1 of the tax year
23 FY 2015-2019 General Revenue Forecast - February 18, 2014

Developing Projections: Commercial Revenue Drivers
Commercial Real Estate Market Metrics Vacancy rates Lease rates per sq. ft. Prevailing capitalization rates Size and composition of commercial pipeline Income and expense data for each commercial property Market sales Additional weighting is given to information received closest to the valuation date (January 1)
24 FY 2015-2019 General Revenue Forecast - February 18, 2014

Residential vs Commercial Assessments
Residential Values Average sales price Average number of days on the market Ratio of active listings to sales (months of inventory) Foreclosures
Commercial Values Vacancy rates Lease rates per sq. Ft. Prevailing capitalization rates Size and composition of commercial pipeline Income and expense data for each commercial property Market sales
25 FY 2015-2019 General Revenue Forecast - February 18, 2014

FY 2015-2019 REVENUE FORECAST
26

Current Situation: Residential Values
Housing values for existing residential properties were higher than anticipated this year Housing values are recouping value lost in the recession Reasons for increasing values of existing residential real estate:
Low inventory and strong demand – particularly under $450K price point Fast home turnover – 39 days on average Slow growth in new housing units PWC homes still have an affordability advantage relative to most nearby jurisdictions
Residential values appear to be growing faster than surrounding jurisdictions January 2013 forecast of residential value appreciation for FY 15 3.5% January 2014 projection forecast of residential value appreciation for FY 15 7.5%
27 FY 2015-2019 General Revenue Forecast - February 18, 2014

Current Situation: New Residential Growth
New residential growth is less than previously forecasted The price point spread between existing and new home values is still very wide
January 2013 forecast of new residential units for FY 15 1,260 January 2014 forecast of new residential units for FY 15 1,201 New residential growth is now expected to be lower throughout the five year plan than previously forecasted
28 FY 2015-2019 General Revenue Forecast - February 18, 2014

Current Situation: Commercial Values
Commercial values grew at a slower rate than previously forecasted
Values in the Office space were weaker than expected region-wide Retail values did not advance as much as projected
Among a group with unusually divergent commercial vacancy trends, PWC has the lowest rate at 8.9% January 2013Forecast of Commercial Value Appreciation for FY 15 3.0% January 2014 Forecast of Commercial Value Appreciation for FY 15 2.5%
29 FY 2015-2019 General Revenue Forecast - February 18, 2014

FY 2015-2019 Real Estate Revenue Forecast
($ in 000s) FY 14 FY 15 FY 16 FY 17 FY 18 FY 19
Real Estate Taxes $537,072 $550,239 $570,560 $592,219 $614,106 $637,252
Percent Change in Revenue 4.00% 2.45% 3.69% 3.80% 3.70% 3.77%
Residential Appreciation 4.70% 7.50% 5.00% 3.50% 3.50% 3.50%
New Residential Units 1,205 1,201 1,200 1,250 1,300 1,350
Commercial Appreciation 5.00% 2.50% 3.00% 3.00% 3.00% 3.00%
New Commercial S.F. 969,175 831,745 743,282 550,000 600,000 720,000
Apartment Appreciation 12.60% 5.00% 5.00% 5.00% 5.00% 5.00%
New Apartment Units 228 550 2,243 1,028 300 300
($ in 000s)
30 FY 2015-2019 General Revenue Forecast - February 18, 2014

Projected New Apartment Unit Production
31 FY 2015-2019 General Revenue Forecast - February 18, 2014

History of Residential Real Estate (Includes Projection)
13.13%
-1.79%
17.47%
27.20%
-29.80%
0.10%
5.24%
2.77%
4.70%7.50%
-35%
-30%
-25%
-20%
-15%
-10%
-5%
0%
5%
10%
15%
20%
25%
30%C
Y84,
FY8
6C
Y85,
FY8
7C
Y86,
FY8
8C
Y87,
FY8
9C
Y88,
FY9
0C
Y89,
FY9
1C
Y90,
FY9
2C
Y91,
FY9
3C
Y92,
FY9
4C
Y93,
FY9
5C
Y94,
FY9
6C
Y95,
FY9
7C
Y96,
FY9
8C
Y97,
FY9
9C
Y98,
FY0
0C
Y99,
FY0
1C
Y00,
FY0
2C
Y01,
FY0
3C
Y02,
FY0
4C
Y03,
FY0
5C
Y04,
FY0
6C
Y05,
FY0
7C
Y06,
FY0
8C
Y07,
FY0
9C
Y08,
FY1
0C
Y09,
FY1
1C
Y10,
FY1
2C
Y11,
FY1
3C
Y12,
FY1
4C
Y13,
FY1
5C
Y14,
FY1
6C
Y15,
FY1
7C
Y16,
FY1
8C
Y17,
FY1
9
CY of Value, FY of Revenue
Actual Residential Appreciation
FY15-19 Forecast
Average Residential Real EstateAppreciation 4.5%
CPI (Balt/Wash metro area), Avg. 3.1%
32 FY 2015-2019 General Revenue Forecast - February 18, 2014

Personal Property Tax Drivers
Average value of vehicles located in the county Number of additional vehicles entering the county Business equipment replacement rate
33 FY 2015-2019 General Revenue Forecast - February 18, 2014

Current Situation – Personal Property Tax Revenue
Average assessment increase fell from 2.89% to 0.50% in the Preliminary forecast due to the overall national acceleration in the sale of new autos which brought the value of used cars down Units increased modestly, however still not at the levels of the early 2000s
FY 15 remains at 8,000 units FY 16 increased from 7,500 to 9,790 FY 17-19 increased from 7,500 to 8,000
34 FY 2015-2019 General Revenue Forecast - February 18, 2014

FY 2015-2019 Personal Property Revenue Forecast
($ in 000s) FY 14 FY 15 FY 16 FY 17 FY 18 FY 19
Personal Property Taxes 146,860$ 150,180$ 158,250$ 165,820$ 173,690$ 181,870$
Percent Change in Revenue 8.16% 2.26% 5.37% 4.78% 4.75% 4.71%
Assessed Value Growth 1.66% 0.50% 2.84% 2.84% 2.84% 2.84%
Billable Unit Growth 2.90% 2.43% 2.91% 2.31% 2.25% 2.21%
Business Tangible 5.41% 2.50% 2.50% 2.00% 2.00% 2.00%
35 FY 2015-2019 General Revenue Forecast - February 18, 2014

Sales Tax Drivers
Consumer spending habits
Median household income
Population growth or contraction
Inflation
Number of businesses
36 FY 2015-2019 General Revenue Forecast - February 18, 2014

Current Situation – Sales Tax Revenue
Adopted sales tax revenue increase of 4% for FY 15 has been reduced to 3% in the preliminary forecast
Summer months showed some weakening in the consistency and strength of the upward trend that had been in place for over 3 years The longer term local impacts of the government shutdown and sequestration are still not certain
37 FY 2015-2019 General Revenue Forecast - February 18, 2014

FY 2015-2019 All Other Revenue Forecast
($ in 000s) FY 14 FY 15 FY 16 FY 17 FY 18 FY 19
Sales Tax 56,825$ 58,525$ 60,280$ 62,090$ 63,950$ 65,870$ %Change 3.0% 3.0% 3.0% 3.0% 3.0% 3.0%
Consumer Utility Tax 13,566$ 13,700$ 13,910$ 14,190$ 14,540$ 14,900$ %Change 0.6% 1.0% 1.5% 2.0% 2.5% 2.5%
Communication Tax 18,720$ 18,910$ 19,290$ 19,670$ 20,070$ 20,470$ % Growth 1.0% 1.0% 2.0% 2.0% 2.0% 2.0%
BPOL Tax 23,658$ 24,427$ 25,221$ 26,041$ 26,887$ 27,761$ %Change 3.3% 3.3% 3.3% 3.3% 3.2% 3.3%
Investment Income 6,430$ 6,831$ 7,247$ 7,676$ 8,120$ 8,578$ %Change -23.3% 6.2% 6.1% 5.9% 5.8% 5.6%
All Other 23,290$ 23,802$ 24,384$ 24,970$ 25,614$ 26,262$ %Change -5.4% 2.2% 2.4% 2.4% 2.6% 2.5%
38 FY 2015-2019 General Revenue Forecast - February 18, 2014

Changes in Revenue Drivers Jan. 2013 Jan. 2014 Forecast Forecast for FY 15 for FY 15 Residential Value 3.5%↑ 7.5%↑ Commercial Value 3.0%↑ 2.5%↑ Personal Property 2.9%↑ 0.5%↑ Sales Tax Revenue 4.0%↑ 3.0%↑ Tax Rate $1.170 $1.126 Avg. Residential Tax Bill Increase 2.5% 2.50% Avg. Commercial Tax Bill Increase 2.0% -2.3%
39 FY 2015-2019 General Revenue Forecast - February 18, 2014

Impact of Real Estate Market Value Changes and the Tax Policy on the Revenue Forecast
To keep average residential tax bills growing at just 2.5% require 5.5 cent tax rate reduction New lower tax rate is applied to all commercial and residential property Result is a reduction in most commercial tax bills Result is a reduction in projected commercial revenue in FY 15 of 4.64% and an average commercial tax bill decrease of 2.3%
40 FY 2015-2019 General Revenue Forecast - February 18, 2014

Preliminary Revenue Projected Reductions for County and Schools
Both the County and Schools have had to rebalance their Five Year Plans at the reduced projected revenue amounts The County’s rebalancing is reflected in the Proposed FY 15-19 Five Year Plan
Total General Revenue FY 15 FY 16 FY 17 FY 18 FY 19 TOTAL
School (8,748,916)$ (9,217,208)$ (9,542,497)$ (10,963,821)$ (12,168,027)$ (50,640,469)$ County (6,470,374) (6,783,346) (6,988,445) (7,803,651) (8,795,597) (36,841,413)
LOSS IN REVENUE (15,219,290)$ (16,000,554)$ (16,530,942)$ (18,767,472)$ (20,963,624)$ (87,481,882)$ CHANGE IN REVENUE
41 FY 2015-2019 General Revenue Forecast - February 18, 2014

Summary Housing values are recouping value lost in the recession
Low inventory and strong demand – particularly under $450K price point Fast home turnover – 39 days on average Slow growth in new housing units PWC homes still have an affordability advantage relative to most nearby jurisdictions
Commercial values grew less than projected Values in the Office space were weaker than expected region-wide Retail values did not advance as much as projected
Apartment appreciation projected at 5% over the five year plan with projected new construction in FY 16 of over 2,200 units Personal Property did not appreciate as much as expected due to the reduction in value of used cars Sales Tax revenue growth slowed its upward trend that had been in place for over 3½ years Investment income is projected to remain constrained given market conditions and Federal monetary policy
42 FY 2015-2019 General Revenue Forecast - February 18, 2014

FY 2015-2019 Revenue Forecast BOCS Guidance: 2.5% Tax Bill Increase
Real Estate Tax Rate: $1.181 $1.126 $1.099 $1.088 $1.078 $1.068
% to Total FY 2014($ in 000s) (FY 2015) Revised Est. FY 2015 FY 2016 FY 2017 FY 2018 FY 2019
Real Estate Taxes 64.99% $537,072 $550,239 $570,560 $592,219 $614,106 $637,252
Personal Property Taxes 17.74% 146,860 150,180 158,250 165,820 173,690 181,870
Sales Tax 6.91% 56,825 58,525 60,280 62,090 63,950 65,870
Consumer Utility Tax 1.62% 13,566 13,700 13,910 14,190 14,540 14,900
Communications Sales Tax 2.23% 18,720 18,910 19,290 19,670 20,070 20,470
BPOL Tax 2.89% 23,658 24,427 25,221 26,041 26,887 27,761
Investment Income 0.81% 6,430 6,831 7,247 7,676 8,120 8,578
All Other 2.81% 23,290 23,803 24,385 24,970 25,614 26,262
Total General Revenue 100.00% $826,421 $846,614 $879,142 $912,676 $946,977 $982,963
Increase over Prior Year 2.44% 3.84% 3.81% 3.76% 3.80%
School Portion $469,030 $480,508 $499,024 $518,112 $537,616 $558,081
County Portion 352,310 360,924 374,806 389,119 403,752 419,106
Transportation Fund 5,081 5,182 5,312 5,445 5,608 5,776
Total General Revenue $826,421 $846,614 $879,142 $912,676 $946,977 $982,963
43 FY 2015-2019 General Revenue Forecast - February 18, 2014