
FY 2011-2013 Recommended Budget Document - Final
372
City of Oxnard, California RECOMMENDED BUDGET FY 2011-2013 CITY COUNCIL DR. THOMAS E. HOLDEN Mayor DR. IRENE G. PINKARD Mayor Pro Tem BRYAN A. MacDONALD Councilman TIM FLYNN Councilman CARMEN RAMIREZ Councilmember FY 2011-2013 B DGET TEAM U Edmund F. Sotelo, City Manager Karen Burnham, Assistant City Manager Grace Magistrale Hoffman, Deputy City Manager Martin Erickson, Special Assistant to the City Manager James Cameron, Chief Financial Officer Beth Vo, Budget Manager Michael More, Financial Resources Manager Tanya Williams, Accountant II RECOMMENDED BUDGET
Transcript of FY 2011-2013 Recommended Budget Document - Final

City of Oxnard, California
RECOMMENDED BUDGET FY 2011-2013
CITY COUNCIL
DR. THOMAS E. HOLDEN Mayor
DR. IRENE G. PINKARD
Mayor Pro Tem BRYAN A. MacDONALD
Councilman
TIM FLYNN Councilman
CARMEN RAMIREZ Councilmember
FY 2011-2013 B DGET TEAM U Edmund F. Sotelo, City Manager
Karen Burnham, Assistant City Manager
Grace Magistrale Hoffman, Deputy City Manager Martin Erickson, Special Assistant to the City Manager
James Cameron, Chief Financial Officer Beth Vo, Budget Manager
Michael More, Financial Resources Manager Tanya Williams, Accountant II
ADOPTED BUDGET ADOPTED BUDGET RECOMMENDED BUDGET


Budget Message


EDMUND F. SOTELO
City Manager
CITY MANAGER’S OFFICE 305 West Third Street • Oxnard, CA 93030 • (805) 385-7430 • Fax (805) 385-7595
June 14, 2011 TO: Mayor and City Councilmembers Housing Authority Commissioners Community Development Commission Members FROM: Edmund F. Sotelo, City Manager SUBJECT: Recommended Operating and Capital Improvement Project Budgets
for FYs 2011-12 and 2012-13 The Budget Team and associated City staff are pleased to present the FYs 2011-12 and 2012-13 Recommended Budget to the City Council. The City continues to experience challenges resulting from the most severe recession since the great depression. While certain segments of the economy have begun a solid, albeit slow recovery, other areas such as housing have been unpredictable. Over the last two years the City Council provided clear direction and set the tone for developing a budget that protected critical City services while achieving the necessary savings to balance general fund revenue shortfalls in excess of $15 million. While some of the savings were short term and one-time solutions were used as a stop gap measure, the base general fund budget was reduced from $119.4 million to $107.1 million. General Fund revenue growth has been adequate to replace most of the one-time solutions used to balance prior budgets and to meet funding commitments; however, an additional savings of $1.4 million was required to balance the recommended budgets for FYs 2011-12 and 2012-13. The two-year budget has been developed in accordance with the direction provided by the City Council during the last two budgets and consistent with the City’s vision and priorities established by the City Council:
“The City of Oxnard will have clean, safe, prosperous and attractive neighborhoods with open, transparent government.”
The FY 2011-12 budget is recommended at $368.3 million, an increase of $7.2 million from the prior fiscal year.

Recommended Operating and Capital Improvement Project Budgets for FYs 2011-12 and 2012-13 June 30, 2011
II
The recommended budget consists of: General Funds $107,066,000 Measure O ½ Cent Sales Tax 4,353,390 Special Revenue Funds 27,176,058 Other Governmental Funds 28,716,116 Enterprise Funds 94,179,469 Housing Authority (non-City) 24,354,506 Capital Improvements 19,849,761 Debt Service 34,380,530 Internal Service Funds 28,261,454 Total Recommended Budget $368,337,284 The total budget for the second year is $349.7 million. General Fund The recommended FY 2011-12 general fund budget represents a decrease of $1.4 million from the FY 2010-11 adopted budget of $108.5 million. FY 2011-12 revenue increases of $2.4 million in property taxes and $2 million in sales taxes make up for most of the $5 million reduction in one-time sources from internal service funds. The remaining revenue shortfall is primarily the result of lower franchise fees from the Gas Company in the amount of $1.2 million. While most of the revenue projections were consistent with anticipated economic trends, the change in franchise fees was unexpected and required a similar reduction to General Fund appropriations. In addition to this approximately $1 million reduction taken from supplies, contracts, and other non-personnel budgets, the recommended budget includes expenditure reductions of $2.2 million due to revised internal service funds, primarily workers compensation, which had not been revised for several years and accumulated large fund balances beyond reserve requirements. Increases due to the January 2012 salary adjustment of 2% approved for several bargaining units, higher pension contributions, and other minor changes reflecting actual salaries and benefits added $1.4 million to the budget. The debt service budget includes the $1.5 million required to refinance the 2010 Bond Anticipation Notes and a net $200,000 was added for electricity costs.

Recommended Operating and Capital Improvement Project Budgets for FYs 2011-12 and 2012-13 June 30, 2011
The following charts summarize the revenues and expenditures recommended for FY 2011-12. General Fund Revenues ($ millions)
Property Tax $41.7
Sales Tax $22.2
Other Taxes $11.7
Interfund Revenues
$9.2
Charges for Services
$10.8
Other $11.5
General Fund Appropriations ($ millions)
Police $48.5 Recreation/ Library $10
Development Services $6
General Services
$9.6Other $8.3
Fire $14.9
General Government
$9.8
FY 2012-13 general fund revenues are projected to increase $4.1 million as the economic recovery is anticipated to continue at a moderate pace. Economic Trends and Revenue Impacts As noted previously, the economy continues to impact the budget. Even though National GDP measures have recovered from a -6.4% in the first quarter of 2009 (calendar year), it has
averaged about 2.4 % over the last five quarters. This first quarter of 2011 GDP growth was only 1.8%, although the year as a whole is anticipated to be about 3%. This trend is reflected in City tax revenues. After several years of declining revenues, FY 2010-11 experienced higher property, sales tax and other tax revenues than had been forecast.
U.S. GDP
3.1%2.6%
1.7%
2.7%
1.8%
0.0%
1.0%
2.0%
3.0%
4.0%
Q1 Q2 Q3 Q4 Q1
2010 2011
Longer term economic growth is anticipated to improve, providing a basis for more optimistic revenue growth in the next two years.
III

Recommended Operating and Capital Improvement Project Budgets for FYs 2011-12 and 2012-13 June 30, 2011
On a positive note, unemployment, which has been higher than national figures, has begun to decline. The chart to the left depicts Ventura County trends. The most recent rate for the County was 10.5%; however, Oxnard’s rate was 13.1% in April. Unemployment is an important measure for predicting sales tax revenues and while improving, is still very high.
Oxnard Quarterly Unemployment
11.0%
12.0%
13.0%
14.0%
15.0%
16.0%
1st 3rd 1st 3rd 1st2009 20112010
Most of the revenue decline due to the recession was experienced in FYs 2008-09 and 2009-10 and while the economy has generally improved, revenues are relatively flat in FY 2010-2011. The FYs 2011-12 and 2012-13 general fund budgets were developed assuming the economy would continue to recover with a moderate increase in revenues.
Property Taxes are projected to increase $2.4 million on a budgetary basis. While the assessed valuations that will provide a basis for next fiscal year’s property taxes are not known, the current fiscal year experienced a less than 1% decline in assessed valuations. Property taxes for the City were 1% higher than budgeted in FY 2010-11 as projections for that year were overly conservative. FY 2011-12 revenues are expected to be moderately higher than FY 2010-11. Although recent housing data is a concern, assessed valuations would have been established during the period when data was more positive.
Growth in Assessed Valuation
-10.0%
-5.0%
0.0%
5.0%
10.0%
15.0%
20.0%
2007 2009 2011 2013
Actual Future
in
er ployment rate in Oxnard will
merit close monitoring of these revenues.
onservatively projected to have no growth. Also as explained before, $5 million in one-time sources are no longer available.
Sales tax revenues are also projected to have moderate growth in the coming two years after a 6% increase overbudget in FY 2010-11. The increase during FY 2010-11 ispart due to the triple flip adjustments which will likely dampen growth in FYs 2011-12 and 2012-13. Concerns ovfuel costs and the high unem
For other revenues, only limited growth is projected with declines in franchise fees as explained before as well aspermits and licenses. Transient Occupancy Taxes and
Business License fees are projected to increase; however, Charges for Services are c
Sales Tax Re
$-
$5.0
$10.0
$15.0
$20.0
$25.0
$30.0
2008 2009 2010
venues
2011 2012 2013
Actual Future
IV

Recommended Operating and Capital Improvement Project Budgets for FYs 2011-12 and 2012-13 June 30, 2011
General Fund Operating Reserve The operating reserve policy states “The City Council will endeavor to maintain an operating reserve equal to 18 percent of the General Fund Operating Budget. The operating reserve shall be to: cover cash flow requirements; meet unanticipated revenue shortfalls; take advantage of unexpected opportunities; invest in projects with a rapid payback; ensure against physical or natural disasters; and provide interest earnings.” The City’s General Fund recommended budget is $107.1 million for FY 2011-12; and 18 percent is $19.3 million. At the end of FY 2009-10, the General Fund Operating Reserve was $18.4 million, which was 17% of FY 2009-10 operating expenses. At his time a decrease of $1 to $2 million in the FY 2010-11 operating reserve is possible due to a combination of high fuel costs and lower franchise fees. Enterprise Funds Over the last several years, City Council has approved enterprise fund rates to meet the financial needs of the Water, Wastewater, and Environmental Resource utilities. As is true with other
operating funds, these enterprise funds have been subjected to the same rigorous cost cutting measures in order to hold down costs. These are capital intensive activities that require a long-term approach to improving and maintaining infrastructure. In the case of water and wastewater treatment facilities and pipelines must be maintained or upgraded. Environmental Resources vehicles and equipment must be replaced to avoid increasingly expensive maintenance and alternative fuels should be fully explored. Every year, rates must be evaluated in terms of debt coverage requirements in existing bond covenants as well as meeting ongoing operating costs. It is anticipated that rate adjustments will be prese
Utility Operating Revenues
$-
$20.0
$40.0
$60.0
$80.0
$100.0
$120.0
2009 2010 2011 2012 2013
Actual Future
nted to Council later in the fiscal year. Federal and State Funds
Grant Funds
$-$2.0$4.0$6.0$8.0
$10.0$12.0$14.0
2009 2010 2011 2012 2013
Federal and non-federal grant funding fluctuate from year to year depending on available funding and programming needs that are eligible for Federal, State, and other agency grants. During the fiscal year, grants may be awarded to the City, which may not be reflected in the recommended and adopted budgets. Over the last several years, the American Reinvestment and Recovery Act provided a total of $34 million, primarily for capital improvements that are not
Federal Other
V

Recommended Operating and Capital Improvement Project Budgets for FYs 2011-12 and 2012-13 June 30, 2011
reflected here. Reductions to Federal Housing and Urban Development (HUD) grants are incorporated in the recommended budget; however, until the Federal budget is approved, the full impact will not be known. Capital Improvement Program The total Capital Improvement Project Budget recommended for FY 2011-12 is $19.8 million. This recommendation is for new funding with a reasonable expectation that it will be available as budgeted. No funding is recommended for FY 2012-13 due to the uncertainty of the various sources, including CDBG. The exception is Measure O funding which is discussed in the next section. Measure O Half-Cent Sales Tax In November 2009, the community approved the Measure O half-cent sales tax. Through community surveys and discussions with the City Council, various priority areas have been identified, including the City’s approved priorities for clean, safe, prosperous, and attractive neighborhoods. Similar priorities were identified in several surveys. In March and July 2010, City Council allocated a combined $8.2 million for various projects and programs related to Parks and Open Space, Traffic and Road Improvements, Public Safety and Gang Prevention/ Intervention, and Recreation and Youth Programming. In January 2011, Council allocated $12.7 million for the College Park, Phase 1C project. On April 12, 2011, City Council held a Study Session to discuss long-term Measure O funding. Based on the previous community surveys and input from the community and City Council, staff presented a preliminary list of projects and programs to assist City Council in reviewing and discussing long-term funding options. City Council conceptually approved a funding allocation based on community input and City Council priorities, and also directed staff to return with certain public safety projects and a plan to migrate long-term ongoing costs from Measure O to the General Fund. On May 17 2011, Council approved a new fire station at College Park, funding for a computer-aided dispatch and records management system, and community policing enhancements for a combined $12.1 million. Additional discussions are planned for June 2011. It is anticipated that Measure O will generate approximately $10 million annually with more than $21 million having been collected through June 2011, including interest earnings. The fund balance, which was $10.9 million at the end of FY 2009-10, is projected to grow to $17 million at the end of FY 2010-11 after expenditures of $4 million.
VI

Recommended Operating and Capital Improvement Project Budgets for FYs 2011-12 and 2012-13 June 30, 2011
Conclusion The FYs 2011-12 and 2012-13 Recommended Budget provides a financial plan for the City of Oxnard based on the City Council’s vision of “clean, safe, prosperous and attractive neighborhoods with open, transparent government.” This budget sets forth a plan in which community services are the highest priority and ensures that the City provides effective leadership in achieving the City Council’s goals, objectives, and top priorities. The budget addresses the significant impacts of the current economic recession through a broad range of savings recommendations The Recommended Operating and Capital Improvement Budget has been prepared through the efforts of employees throughout the City. Edmund F. Sotelo City Manager
VII

PAGE
TABLE OF CONTENTS
City of Oxnard, California viii
BUDGET MESSAGE ...................................................................................................................... i SUMMARY INFORMATION
Summary of All Funds Expenditures ....................................................................................... 1 General Fund Expenditures ...................................................................................................... 2 Other Funds Expenditures ........................................................................................................ 3 General Fund Revenues and Sources ....................................................................................... 5 Special Revenue Funds Revenues and Sources........................................................................ 7 Enterprise Funds Revenues and Sources .................................................................................. 10 Internal Service Funds Revenues and Sources ......................................................................... 11 Comparative Personnel Summary (All Funds)......................................................................... 12 City Organizational Structure................................................................................................... 13 Debt Service Summary............................................................................................................. 14 Indirect Cost Determination ..................................................................................................... 16
SUMMARIES
City Attorney ............................................................................................................................ 19 Collection Services............................................................................................................ 22
City Clerk.................................................................................................................................. 25 City Council.............................................................................................................................. 29 City Manager ............................................................................................................................ 33
Public Information ............................................................................................................ 36 Community Relations/Community Access TV................................................................. 38 Legislative Affairs............................................................................................................. 40 Neighborhood Services ..................................................................................................... 42 Information Systems
Enterprise Information Systems Management ............................................................. 44 Geographic Information Systems................................................................................. 46 Personal Computer/Network Systems.......................................................................... 48 Document Publishing Services..................................................................................... 50 Telecommunications .................................................................................................... 52
General Services Facilities Maintenance.................................................................................................. 54 Fleet Services ............................................................................................................... 56 Graffiti Action Program ............................................................................................... 58 Parks and Facilities Development ................................................................................ 60 Parks and Public Grounds ............................................................................................ 62 River Ridge Golf Course.............................................................................................. 64 Street Landscaping ....................................................................................................... 66 Street Lighting.............................................................................................................. 68 Street Trees and Medians ............................................................................................. 70
City Treasurer ........................................................................................................................... 73 Utility Customer/Licensing Services ................................................................................ 77

PAGE
TABLE OF CONTENTS
City of Oxnard, California ix
Community Development......................................................................................................... 79 Central Business District................................................................................................... 80 Southwinds........................................................................................................................ 82 Ormond Beach .................................................................................................................. 84 HERO Project Area........................................................................................................... 86 Special Projects/CDC Operations ..................................................................................... 88 Economic Development .................................................................................................... 90 Convention and Visitors Bureau ....................................................................................... 92 20% Set-Aside................................................................................................................... 94
Development Services .............................................................................................................. 97 Development Support ....................................................................................................... 98 Building and Engineering ................................................................................................. 100 Planning and Environmental Services .............................................................................. 102 Traffic Engineering and Operations.................................................................................. 104 Transit Services................................................................................................................. 106
Finance...................................................................................................................................... 109 Administration .................................................................................................................. 110 General Accounting .......................................................................................................... 112 Budget and Capital Improvement Projects ....................................................................... 114 Purchasing......................................................................................................................... 116 Financial Resources .......................................................................................................... 118 Liability Management ....................................................................................................... 120 Grants Management .......................................................................................................... 122 Mail and Courier Services................................................................................................. 124
Fire ........................................................................................................................................... 127 Fire Suppression and Other Emergency Services ............................................................. 128 Fire Prevention.................................................................................................................. 130 Disaster Preparedness ....................................................................................................... 132 Certified Unified Program Agency (CUPA)..................................................................... 134
Housing..................................................................................................................................... 137 Public Housing.................................................................................................................. 138 Rental Assistance .............................................................................................................. 140 Affordable Housing Assistance......................................................................................... 142 Housing Rehabilitation ..................................................................................................... 144 Homeless Assistance......................................................................................................... 146 Mobilehome Rent Stabilization ........................................................................................ 148 Fair Housing...................................................................................................................... 150 Grants Administration....................................................................................................... 152
Human Resources ..................................................................................................................... 155 Workers’ Compensation ................................................................................................... 158 Safety Management........................................................................................................... 160
Library ...................................................................................................................................... 163 Library Community Outreach........................................................................................... 164 Library Circulation Services ............................................................................................. 166 Library Information/Reference Services........................................................................... 168 Library Support Services .................................................................................................. 170

PAGE
TABLE OF CONTENTS
City of Oxnard, California x
Library Branch Services.................................................................................................... 172 Carnegie Art Museum....................................................................................................... 174
Police ...................................................................................................................................... 177 Code Compliance.............................................................................................................. 178 Community Patrol ............................................................................................................. 180 Criminal Investigation....................................................................................................... 182 Police Support Services .................................................................................................... 184 Emergency Communications ............................................................................................ 186
Public Works............................................................................................................................. 189 Administrative Services .................................................................................................... 191 Construction and Design Services .................................................................................... 195
Engineering Design and Contract Administration ....................................................... 196 Construction Services - Streets .................................................................................... 198 Street Maintenance and Repair .................................................................................... 200 Parking Lots ................................................................................................................. 202 Surveying Services ....................................................................................................... 204
Utilities Services ............................................................................................................... 207 Water Procurement....................................................................................................... 208 Water Conservation and Education.............................................................................. 210 Water Production.......................................................................................................... 212 Water Distribution........................................................................................................ 214 Water Metering ............................................................................................................ 216 Water Connection Fee.................................................................................................. 218 Water Security & Contamination Prevention............................................................... 220 Source Control.............................................................................................................. 222 Storm Water Quality Management .............................................................................. 224 Collection System Maintenance and Upgrades............................................................ 226 Flood Control ............................................................................................................... 228 Wastewater Collection Connection.............................................................................. 230 Laboratory Services...................................................................................................... 232 Treatment Plant Operations.......................................................................................... 234 Treatment Plant Maintenance and Upgrades................................................................ 236 Environmental Resources Planning ............................................................................. 238 Waste Reduction and Education .................................................................................. 240 Environmental Resources Residential Collection ........................................................ 242 Environmental Resources Commercial Collection ...................................................... 244 Environmental Resources Industrial Collection........................................................... 246 Environmental Resources Processing and Disposal..................................................... 248 Public Information – Special Projects .......................................................................... 250
Recreation and Community Services........................................................................................ 253 Recreation Services........................................................................................................... 254 Youth Development .......................................................................................................... 256 South Oxnard Center......................................................................................................... 258 Senior Services/Special Populations ................................................................................. 260 Performing Arts and Convention Center .......................................................................... 262

PAGE
TABLE OF CONTENTS
City of Oxnard, California xi
Measure O................................................................................................................................. 265 Park and Open Space ........................................................................................................ 266 Public Safety and Gang Prevention/Intervention.............................................................. 268 Recreation and Youth Programming................................................................................. 270 Traffic and Road Improvements ....................................................................................... 272
RESOLUTIONS
Approving FY 2011-2012 City Operating and Capital Budgets .............................................. 277 Authorizing Employee Positions .............................................................................................. 282 Authorizing Classification and Salary Schedules..................................................................... 295 Establishing Appropriation Limit ............................................................................................. 300 Approving Community Development Commission Budget..................................................... 302 Approving Housing Authority Budget ..................................................................................... 304 Establishing Financial Management Policies ........................................................................... 305
CAPITAL IMPROVEMENT PROJECT PLAN
Introduction............................................................................................................................... 317 Revenues Available for Capital Improvement.......................................................................... 318 FY 2011-2013 Project Descriptions ......................................................................................... 320


Summary Information


SUMMARY OF ALL FUNDS EXPENDITURES
City of Oxnard, California 1
2009-2010
Actual 2010-2011 Adopted
2010-2011 Revised
2011-2012 Recommended
2012-2013 Proposed
Governmental Funds City Attorney $ $1,422,395 $ $1,341,833 $ $1,343,783 $ $1,336,917 $ 1,336,917 City Clerk 465,494 518,724 436,611 353,311 398,111 City Council 370,062 377,032 389,432 352,382 352,382 City Manager 1,275,467 1,386,251 1,362,314 1,141,493 1,141,493
Legislative Affairs 91,990 258,701 217,065 287,001 287,001 General Services 9,755,470 9,506,297 9,485,726 9,631,795 9,631,795 Public Information 749,949 706,600 699,107 644,637 644,637
City Treasurer 1,151,852 1,170,674 1,104,617 1,167,167 1,167,167 Community Development
Commission Funds 21,762,632 12,911,050 22,466,673 16,595,417 17,156,863 Development Services 8,656,914 8,124,382 7,846,437 8,176,071 8,203,652 Finance 3,345,687 3,515,278 3,326,032 3,481,758 3,481,758 Fire 20,207,407 18,992,284 20,028,589 19,825,479 19,825,479 Human Resources 1,178,700 1,244,938 1,146,703 1,171,903 1,171,903 Housing 5,093,810 2,630,484 10,848,379 2,641,331 2,601,105 Library 5,021,280 5,204,894 4,848,506 4,577,282 4,577,282 Police 61,521,800 61,562,632 65,300,886 59,864,368 59,864,368 Public Works 6,946,404 6,946,480 7,113,416 6,099,951 6,099,951 Recreation and Community
Services 7,413,912 6,438,488 7,319,253 8,013,509 5,913,509 Non-Departmental (less Capital
and Debt) 5,707,668 4,615,038 7,168,356 4,075,771 8,171,971
Subtotal $ 162,138,893 $ 147,452,060 $ 172,451,885 $ 149,437,543 $ 152,027,344 Districts Landscape Maintenance Districts 2,786,914 2,787,497 3,081,281 2,664,572 2,664,572 Maintenance Community
Facilities Districts 4,848,637 5,113,376 5,236,453 5,162,077 5,064,949 Bonded Assessment Districts 5,840,010 5,851,057 5,851,057 5,615,715 5,615,715 Art in Public Places Trust Fund 66,700 - - - -
Subtotal $ 13,542,261 $ 13,751,930 $ 14,168,791 $ 13,442,364 $ 13,345,236
Measure O 2,186 - 20,962,439 4,353,390 2,833,460
Enterprise Funds 114,387,702 102,114,880 101,785,583 94,179,469 94,426,410
Internal Service Funds 30,258,279 27,882,197 28,170,829 28,261,454 28,261,454 Housing Authority (Non-City) 24,223,149 26,928,555 26,928,555 24,354,506 24,354,506 Capital Improvements 44,598,620 7,857,356 220,040,443 19,849,761 - Debt Services 22,816,398 35,121,792 36,088,412 34,458,797 34,458,797
Total All Funds $ 411,967,488 $ 361,108,770 $ 620,596,937 $ 368,337,284 $ 349,707,207

GENERAL FUND EXPENDITURES
2 City of Oxnard, California
(Excluding Multi-Year Grants)
2009-2010
Actual 2010-2011 Adopted
2010-2011 Revised
2011-2012 Recommended
2012-2013 Proposed
Departmental Funds City Attorney $ 1,422,395 $ 1,341,833 $ 1,343,783 $ 1,336,917 $ 1,336,917 City Clerk 465,494 518,724 436,611 353,311 398,111 City Council 370,062 377,032 389,432 352,382 352,382 City Manager (b) 1,275,467 1,386,251 1,362,314 1,141,493 1,141,493
Legislative Affairs (a) 91,990 90,701 49,065 119,001 119,001 General Services (a) 9,663,860 9,506,297 9,400,726 9,631,795 9,631,795 Public Information (b) 710,121 656,600 649,107 644,637 644,637
City Treasurer 1,151,852 1,170,674 1,104,617 1,167,167 1,167,167 Community Development 1,361,382 1,335,014 1,065,014 1,321,665 1,321,665 Development Services 6,342,802 6,085,111 5,807,166 5,967,358 5,967,358 Finance 3,352,023 3,515,278 3,326,032 3,481,758 3,481,758 Fire 14,626,092 14,443,593 14,372,275 14,942,227 14,942,227 Housing 283,893 267,194 267,194 248,696 248,696 Human Resources 1,178,700 1,244,938 1,146,703 1,171,903 1,171,903 Library 5,000,590 5,204,894 4,732,212 4,577,282 4,577,282 Police 48,411,252 50,090,366 48,817,805 48,506,118 48,506,118 Public Works 3,012,326 3,195,391 3,195,391 2,572,922 2,572,922 Recreation and Community
Services 5,857,583 5,880,492 5,646,192 5,375,330 5,375,330
Subtotal $ 104,577,884 $ 106,310,383 $ 103,111,639 $ 102,911,962 $ 102,956,762 Non-Departmental General Non-Departmental $ 1,147,751 $ 902,431 $ 1,048,265 $ 1,015,881 $ 1,015,881 Reserves & Transfers 4,339,395 1,193,207 3,391,704 2,632,903 6,729,103 General Debt Service 95,261 84,705 84,705 78,267 78,267 Contribution to Carnegie Museum - - 408,987 426,987 426,987
Subtotal $ 5,582,407 $ 2,180,343 $ 4,933,661 $ 4,154,038 $ 8,250,238 Capital Improvements -1,311,235 - - - -
Total General Fund $ 108,849,056 $ 108,490,726 $ 108,045,300 $ 107,066,000 $ 111,207,000
(a) Previously included in General Services (b) Reclass Community Relations from City Manager to Public Information

OTHER FUNDS EXPENDITURES
City of Oxnard, California 3
2009-2010
Actual 2010-2011 Adopted
2010-2011 Revised
2011-2012 Recommended
2012-2013 Proposed
Special Revenue Funds City Manager - Legislative Affairs (a) - $ 168,000 $ 168,000 $ 168,000 $ 168,000 City Manager – General Services (a) 91,610 - 85,000 - - City Manager – Public Information 39,828 50,000 50,000 - - Development Services 2,314,112 2,039,271 2,039,271 2,208,713 2,236,294 Finance -6,336 - - - - Fire 5,581,315 4,548,691 5,656,314 4,883,252 4,883,252 Housing (b) 4,809,917 2,363,290 10,581,185 2,392,635 2,352,409 Library 20,690 - 116,294 - - Police (c) 13,110,548 11,472,266 16,483,081 11,358,250 11,358,250 Public Works 3,934,078 3,751,089 3,918,025 3,527,029 3,527,029 Recreation and Community Services 1,556,329 557,996 1,673,061 2,638,179 538,179 Non-Departmental (less Capital and
Debt) 220,522 2,519,400 2,319,400 - - Subtotal $ 31,672,613 $ 27,470,003 $ 43,089,631 $ 27,176,058 $ 25,063,413
Other Governmental Funds Community Development
Commission Funds 20,401,250 11,576,036 21,401,659 15,273,752 15,835,198 Landscape Maintenance Districts 2,786,914 2,787,497 3,081,281 2,664,572 2,664,572 Maintenance Community Facilities
Districts 4,848,637 5,113,376 5,236,453 5,162,077 5,064,949 Bonded Assessment Districts 5,840,010 5,851,057 5,851,057 5,615,715 5,615,715 Art in Public Places Trust Fund 66,700 - - - -
Subtotal $ 33,943,511 $ 25,327,966 $ 35,570,450 $ 28,716,116 $ 29,180,434 Measure O City Manager – General Services - - 14,371,446 - - Development Services - - 3,500,000 - - Fire - - 250,000 - - Police - - - 4,353,390 2,833,460 Public Works 11,006 - 1,650,993 - - Recreation and Community Services - - 990,000 - - Non-Departmental -8,820 - 200,000 - -
Subtotal $ 2,186 - $ 20,962,439 $ 4,353,390 $ 2,833,460 Enterprise Funds Water (d) 28,683,893 38,416,477 37,452,170 33,155,226 33,353,653 Wastewater (d) 21,353,340 18,343,311 18,926,521 16,439,836 16,486,128 Environmental Resources (d) 37,378,512 39,079,120 39,079,120 37,915,705 37,907,805 Performing Arts and Convention
Center 1,648,003 1,496,219 1,496,219 1,482,376 1,482,376 Golf Course 25,323,954 4,779,753 4,831,553 5,186,326 5,196,448
Subtotal $114,387,702 $102,114,880 $101,785,583 $ 94,179,469 $ 94,426,410 Internal Service Funds Public Liability 2,716,844 3,916,351 3,916,351 3,912,695 3,912,695 Workers Compensation Fund 8,954,989 6,381,933 6,442,136 6,418,599 6,418,599 Utility Customer Services 1,439,682 1,450,728 1,450,728 1,476,090 1,476,090 Information Systems 4,015,739 4,101,539 4,101,539 4,061,053 4,061,053 Facilities Maintenance 3,781,984 3,840,067 3,850,001 3,578,309 3,578,309 Equipment Maintenance 9,349,041 8,191,579 8,410,074 8,814,708 8,814,708
Subtotal $ 30,258,279 $ 27,882,197 $ 28,170,829 $ 28,261,454 $ 28,261,454

4 City of Oxnard, California
OTHER FUNDS EXPENDITURES
2009-2010
Actual 2010-2011 Adopted
2010-2011 Revised
2011-2012 Recommended
2012-2013 Proposed
Housing Authority (Non-City) 24,223,149 26,928,555 26,928,555 24,354,506 24,354,506 Capital Improvements (b, d) 45,909,855 7,857,356 220,040,443 19,849,761 - Debt Services (d) 22,721,137 35,037,087 36,003,707 34,380,530 34,380,530
Total Other Funds $303,118,432 $252,618,044 $512,551,637 $261,271,284 $ 238,500,207
(a) Previously included in General Services (b) Reclass of HOME Entitlement Loan Program from CIP to Operational and reclass Public Housing & Rental Assistance Payroll from
Housing/Special Revenue Funds to Housing Authority (Non-City) (c) Police Operating Training Fund included in Police (d) Adjusted for indirect cost from debt services and vacancy management

GENERAL FUND REVENUES AND SOURCES
City of Oxnard, California 5
2009-2010
Actual 2010-2011 Adopted
2010-2011 Revised
2011-2012 Recommended
2012-2013 Proposed
Property Tax Current - Secured $ 23,757,674 $ 22,696,000 $ 22,696,000 $ 24,425,000 $ 25,646,000 Current - Unsecured 768,897 807,000 807,000 713,000 749,000 Delinquent - Secured 139,721 140,000 140,000 105,000 110,000 Delinquent - Unsecured 32,180 34,000 34,000 64,000 67,000 Supplemental Tax 507,581 561,000 561,000 158,000 166,000 CDC Pass-Through Payment 494,872 600,000 600,000 630,000 662,000 Interest/Penalties on Delinquency 279,177 279,000 279,000 133,000 133,000 ERAP - Refund - - - - - Property Tax In-Lieu of VLF 14,289,916 13,576,000 13,576,000 14,902,000 15,647,000 Payment In-Lieu of Property Tax 75,702 17,000 17,000 18,000 19,000 Deed Transfer Tax 509,370 529,000 529,000 549,000 576,000
Subtotal Property Tax $ 40,855,090 $ 39,239,000 $ 39,239,000 $ 41,697,000 $ 43,775,000 Sales Tax Sales Tax 14,784,497 15,175,000 15,175,000 16,801,000 17,641,000 Sales Tax - Refund (25,706) - - (25,000) (25,000) Sales Tax - Triple Flip 4,435,593 5,075,000 5,075,000 5,432,000 5,595,000
Subtotal Sales Tax $ 19,194,384 $ 20,250,000 $ 20,250,000 $ 22,208,000 $ 23,211,000
Other Taxes Transient Occupancy Tax 3,061,163 3,089,000 3,089,000 3,459,000 3,632,000 Business License Tax 4,692,615 4,772,000 4,772,000 4,775,000 4,918,000 Southern California Gas 917,115 2,000,000 2,000,000 876,000 902,000 Time Warner/Verizon 1,737,063 1,793,000 1,793,000 1,516,000 1,561,000 Verizon Cable 159,767 196,000 196,000 322,000 332,000 Southern California Edison 625,700 657,000 657,000 649,000 668,000 Penalties and Interest on
Delinquent Accounts 127,525 130,000 130,000 107,000 110,000 Subtotal Other Taxes $ 11,320,948 $ 12,637,000 $ 12,637,000 $ 11,704,000 $ 12,123,000
Licenses and Permits Animal Licenses 291,660 353,000 353,000 315,000 324,000 Building Permits 928,165 946,000 946,000 810,000 851,000 Entertainment Permits 17,226 17,000 17,000 15,000 15,000 Other Licenses and Permits 286,875 246,000 246,000 196,000 206,000
Subtotal Licenses & Permits $ 1,523,926 $ 1,562,000 $ 1,562,000 $ 1,336,000 $ 1,396,000 Intergovernmental Revenues Homeowner Prop. Tax Relief 238,841 246,000 246,000 246,000 246,000 State Mandated Cost
Reimbursement 170,705 171,000 171,000 185,000 185,000 Motor Vehicle In-Lieu 555,440 652,000 652,000 709,000 744,000 Public Safety Augmentation 950,203 960,000 960,000 984,000 984,000 AB 1191 Revenues 27,813 - - 85,000 85,000
Subtotal Intergovernmental $ 1,943,002 $ 2,029,000 $ 2,029,000 $ 2,209,000 $ 2,244,000
Interfund Revenues Infrastructure Use $ 2,425,000 $ 2,425,000 $ 2,425,000 $ 2,425,000 $ 2,425,000 Indirect Cost Reimbursements 6,653,548 6,655,000 6,655,000 6,755,000 6,755,000
Subtotal Interfund Revenues $ 9,078,548 $ 9,080,000 $ 9,080,000 $ 9,180,000 $ 9,180,000

6
GENERAL FUND REVENUES AND SOURCES
City of Oxnard, California
2009-2010
Actual 2010-2011 Adopted
2010-2011 Revised
2011-2012 Recommended
2012-2013 Proposed
Charges for Services Document Processing/Copying
Fees $ 429,659 $ 441,000 $ 441,000 $ 388,000 $ 408,000 Police and Fire Fees 632,934 650,000 650,000 647,000 678,000 Services To Other Programs 5,464,755 5,394,000 5,394,000 5,286,000 5,444,000 Parks and Recreation Fees 718,044 712,000 708,000 732,000 754,000 Development Services fees 1,725,622 1,681,000 1,681,000 1,869,000 1,925,000 Permit Center Fees 147,700 144,000 144,000 148,000 152,000 Street Cut Fees 3,307 2,000 2,000 6,000 6,000 Abandoned Vehicle Fees 70,118 74,000 74,000 50,000 52,000 Tipping Fees 120,000 120,000 120,000 124,000 128,000 Misc. Charges/Damage
Reimbursements 1,465,712 1,461,000 1,447,000 1,451,000 1,491,000 Rents 14,777 15,000 15,000 18,000 19,000 Miscellaneous Reimbursements - - - 2,000 2,000 Miscellaneous Revenues 5,597 3,000 3,000 12,000 12,000 Sale of Vehicles & Equip. 57,997 70,000 70,000 74,000 76,000 Vending Services 33,807 37,000 37,000 - - Sale of Land 666,594 - - - -
Subtotal Charges for Services $ 11,556,623 $ 10,804,000 $ 10,786,000 $ 10,807,000 $ 11,147,000 Fines and Forfeitures Parking Fines 1,623,636 1,741,000 1,741,000 1,707,000 1,758,000 Court Fines-Non Traffic 441,612 451,000 451,000 440,000 453,000 Administrative Fines 185,715 205,000 205,000 198,000 204,000 Misc. Fines 96,733 98,000 98,000 99,000 102,000
Subtotal Fines and Forfeitures $ 2,347,696 $ 2,495,000 $ 2,495,000 $ 2,444,000 $ 2,517,000 Interest Income Interest on Investments 523,311 584,000 584,000 286,000 295,000 Interest - Other 54,256 25,000 25,000 101,000 104,000
Subtotal Interest Income $ 577,567 $ 609,000 $ 609,000 $ 387,000 $ 399,000 Miscellaneous Sources RiverPark Public Safety Transfer 1,300,000 1,400,000 1,400,000 1,442,000 1,485,000 Other Special Assessments 71,909 76,000 76,000 78,000 80,000 Host Fee From Solid Waste - 70,000 70,000 - - Transfer from Solid Waste Fund 36,750 - - - - Transfer from Internal Service
Funds 5,719,933 5,798,026 5,798,026 - - Repayment from CDC 1,030,560 1,030,000 1,030,000 1,030,000 1,030,000 Appropriated Fund Balance 546,085 - 257,988 - - Non-Operating Revenues - 1,411,700 726,286 2,544,000 2,620,000
Subtotal Miscellaneous Revenues $ 8,705,237 $ 9,785,726 $ 9,358,300 $ 5,094,000 $ 5,215,000 Total General Fund Revenues $ 107,103,021 $ 108,490,726 $ 108,045,300 $ 107,066,000 $ 111,207,000

SPECIAL REVENUE FUNDS REVENUES AND SOURCES
City of Oxnard, California 7
2009-2010
Actual 2010-2011 Adopted
2010-2011 Revised
2011-2012 Recommended
2012-2013 Proposed
Air Pollution Buydown Fees PL Offsite Air Quality $ 292,074 $ 105,000 $ 105,000 $ 292,100 $ 292,100Fare Revenues 66,703 18,000 18,000 66,700 66,700Interest on Investments 88,508 135,000 135,000 88,500 88,500Miscellaneous Receipts/Reimbursements - - - - - From/(To) Capital Reserves 1,646,002 (5,625) 1,269,411 (279,300) (279,300)
Subtotal $ 2,093,287 $ 252,375 $ 1,527,411 $ 168,000 $ 168,000Half-Cent Sales Tax Sales Tax 8,908,667 - 9,372,975 10,000,000 10,000,000Interest on Investments $ 83,388 $ - $ - $ 90,000 $ 90,000
Subtotal $ 8,992,055 $ - $ 9,372,975 $ 10,090,000 $ 10,090,000Public Safety Retirement Fund Voter Approved Property Tax $ 13,516,568 $ 14,469,122 $ 14,469,122 $ 13,516,600 $ 13,516,600
Subtotal $ 13,516,568 $ 14,469,122 $ 14,469,122 $ 13,516,600 $ 13,516,600Community Facilities Districts and Assessment Districts CFD #1 & 2 Westport 1,254,473 1,069,625 1,069,625 1,094,512 1,069,625CFD #3 Seabridge/Mandalay 2,255,963 1,860,702 1,860,702 1,928,950 1,860,702CFD #4 Seabridge Maintenance 1,573,985 1,077,736 1,077,736 992,369 1,077,736CFD #5 RiverPark Maintenance 4,286,693 3,412,429 3,412,429 3,662,216 3,412,429CFD #6- Northshore Maintenance 72,106 68,672 68,672 68,670 68,672CFD #88-1 Oxnard Town Center 247,753 234,648 234,648 248,456 234,648CFD #2000-3 Oxnard Blvd/Highway 101 749,745 751,794 751,794 744,205 751,794AD #2000-1 Oxnard Blvd/Highway 101 183,998 184,652 184,652 184,348 184,652AD #85-5 Mandalay Bay 349,109 - - - - AD #96-1 Rose/101 695,935 732,914 732,914 734,732 732,914AD #2001-1 Rice/Highway 101 1,116,975 1,108,834 1,108,834 1,108,168 1,108,834From/(To) Capital Reserves (a) (2,098,088) 464,427 585,504 11,166 178,658
Subtotal $ 10,688,647 $ 10,964,433 $ 11,087,510 $ 10,777,792 $ 10,680,664Landscape Maintenance Districts Waterway Assessment District 527,431 609,517 753,301 527,500 527,500LMD #1 - Summerfield 13,088 13,007 13,007 13,100 13,100LMD #2 - C.I.B.C. Told 1,082 1,040 1,040 1,100 1,100LMD #3 - River Ridge 87,028 83,873 83,873 87,100 87,100LMD #4 - Beach Main Col/Hot 45,165 39,446 39,446 45,200 45,200LMD #9 - Strawberry Fields 13,094 12,615 12,615 13,100 13,100LMD #7/8 - Northfield Business 31,795 32,500 32,500 31,800 31,800LMD #10 - Country Club 24,842 24,076 24,076 24,800 24,800LMD #11 - St. Tropez 7,066 6,990 6,990 7,100 7,100LMD #12 - Standard Pacific 23,342 22,394 22,394 23,300 23,300LMD #14 - California Cove 40,137 36,693 36,693 40,100 40,100LMD #16 - Lighthouse 19,637 19,552 19,552 19,600 19,600LMD #13 - Fd562 - Le Village 19,189 18,045 18,045 19,200 19,200LMD #15 - Pelican Pointe 9,169 9,300 9,300 9,200 9,200LMD #17 - San Miguel 9,926 9,121 9,121 9,900 9,900LMD #20 - Volvo & Harbor 3,544 2,415 2,415 3,500 3,500LMD #18 - St. John's Hospital 6,217 5,861 5,861 6,300 6,300LMD #19 - Shopping at Rose 1,069 1,000 1,000 1,100 1,100LMD #21 - Cypress Point 1,040 1,000 1,000 1,000 1,000LMD #22 -McDonalds Median 502 500 500 500 500LMD #23 - Greystone 5,559 5,588 5,588 5,500 5,500LMD #24 - Vineyards 18,633 18,300 18,300 18,600 18,600LMD #25 - The Pointe 24,369 23,799 23,799 24,400 24,400LMD #26 – Albertsons 6,111 4,000 4,000 6,100 6,100LMD #27 - Rose Island 13,023 13,262 13,262 13,000 13,000

8
SPECIAL REVENUE FUNDS REVENUES AND SOURCES
City of Oxnard, California
2009-2010
Actual 2010-2011 Adopted
2010-2011 Revised
2011-2012 Recommended
2012-2013 Proposed
LMD #28 - Harborside 69,115 63,915 63,915 69,200 69,200LMD #29 - Mercy Charities 1,354 1,359 1,359 1,300 1,300LMD #30 - Haas Automation 42,903 41,281 41,281 42,900 42,900LMD #31 - Rancho De La Rosa 70,980 67,875 67,875 71,000 71,000LMD #32 - Oak Park 21,517 20,527 20,527 21,600 21,600LMD #33 - Rio Del Sol 49,744 49,534 49,534 49,700 49,700LMD #35 - MVS Commercial Center 11,210 19,016 19,016 11,200 11,200LMD. #34 - Sunrise Pointe 56,718 51,458 51,458 56,800 56,800LMD #36 - Villa Santa Cruz 127,437 123,115 123,115 127,500 127,500LMD #37 - Pacific Breeze 31,090 27,382 27,382 31,100 31,100LMD #38 - Aldea Del Mar 97,738 93,055 93,055 97,800 97,800LMD #39 - El Sueno/Promesa 177,041 161,270 161,270 177,100 177,100LMD #39 - D.R. Horton 13,195 15,000 15,000 13,200 13,200LMD #40 – Cantada 82,290 65,051 65,051 82,300 82,300LMD #41 - Pacific Cove 59,875 58,993 58,993 59,900 59,900LMD #42 - Cantabria/Coronado 165,285 147,036 147,036 165,300 165,300LMD #43 - Greenbelt (PARCRO) 75,929 87,222 87,222 75,900 75,900LMD #44 - American Pacific Homes 20,181 17,927 17,927 20,200 20,200LMD #45 - Channel Point 3,325 6,283 6,283 3,300 3,300LMD #46 - Daily Ranch 192,027 163,702 163,702 192,100 192,100LMD #47 - Sycamore Place 58,631 55,762 55,762 58,600 58,600LMD #48 - Victoria Estates 156,491 136,845 136,845 156,500 156,500LMD #49 - Cameron Ranch 17,858 15,469 15,469 17,800 17,800LMD #50 - DV Senior Hsg. 20,691 19,379 19,379 20,700 20,700LMD #51 – Pfeiler 129,072 113,580 113,580 129,100 129,100LMD #52 - Wingfield Homes 70,964 62,994 62,994 71,000 71,000LMD #53 - Huff Court 3,265 3,019 3,019 3,300 3,300LMD #54 - Meadow Crest Villas 18,131 18,773 18,773 18,200 18,200LMD #55 - Wingfield West 23,916 25,107 25,107 23,900 23,900LMD #56 - The Cottages 4,455 4,214 4,214 4,400 4,400LMD #57 - Golden St. Self Storage 10,884 10,715 10,715 10,900 10,900LMD #58 – Westwind 60,108 68,909 68,909 60,100 60,100LMD #59 - Orbela 18,046 17,590 17,590 18,000 18,000From/(To) Capital Reserves (a) (126,610) (59,754) 90,246 (249,428) (249,428)
Subtotal $ 2,786,914 $ 2,787,497 $ 3,081,281 $ 2,664,572 $ 2,664,572State/Local Grants and Sources Parks and Recreation State Grant 1,713,766 - 718,802 2,100,000 - Water Resources State Grant 3,171,168 - - - - State Gas Tax 3,756,363 3,688,275 3,688,275 3,740,900 3,740,900Traffic Safety Fund 760,937 761,700 761,700 761,700 761,700
From/(To) Traffic Safety Fund Balance 271,108 212,916 212,916 189,141 189,141State Housing Grants 2,383,736 - - State Law Enforcement Grants 1,189,027 - 801,639 - - Library Grants 70,799 - 67,420 - - State Transportation Grants 5,578,515 - - - - Traffic Congestion Relief Grants 1,815,446 - - - - Transportation Development Act (TDA)
Local Transportation Fund – 8 133,534 - - 133,600 133,600Local Transportation Fund – 4 651,693 708,239 708,239 651,600 651,600Local Transportation Fund – 3 66,431 64,000 64,000 66,400 66,400From/(To) Capital Reserves (a) 1,288,111 (4,000) 579,619 (135,020) (135,020)

SPECIAL REVENUE FUNDS REVENUES AND SOURCES
City of Oxnard, California 9
2009-2010
Actual 2010-2011 Adopted
2010-2011 Revised
2011-2012 Recommended
2012-2013 Proposed
RSVP Ventura County 53,229 - 84,721 43,254 43,254General Fund Match 85,723 - 104,697 85,658 85,658
Other State Grants 61,139 - 71,575 - - Subtotal $ 23,050,725 $ 5,431,130 $ 7,863,603 $ 7,637,233 $ 5,537,233
Federal Grants and Sources Federal Law Enforcement Grants(a) 1,104,726 141,365 916,664 94,816 94,816Federal Transportation Grants (36,545) 738,000 1,827,562 - - Community Development Block Grant Fund
CDBG Federal Entitlement 2,192,290 3,289,325 3,291,467 2,472,304 2,472,304CDBG ARRA 613,066 - - - -
Housing & Urban Development HOME Fund HUD HOME Federal Entitlement 1,639,426 1,326,193 1,449,541 1,422,175 1,422,175
American Recovery Reinvestment Act Grant 7,283,919 - 98,949 - - Subtotal $ 12,796,882 $ 5,494,883 $ 7,584,183 $ 3,989,295 $ 3,989,295
Development Fees Quimby Fees 170,902 168,870 168,870 45,000 45,000Park Acquisition and Development Fee 10,161 8,006 8,006 4,000 4,000Storm Drain Facility Fee 462,975 425,132 425,132 463,000 463,000Circulation System Improvement Fees 1,312,714 1,170,000 1,170,000 1,312,700 1,312,700Capital Growth Fees - Residential 329,467 1,496,082 1,496,082 329,400 329,400Capital Growth Fees - Nonresidential 87,014 406,099 406,099 87,000 87,000Utility Undergrounding 80,089 55,000 55,000 80,100 80,100CUPA Operating Fund 747,111 895,436 895,436 731,620 731,620Housing In-Lieu Fees 204,232 - - - - Affordable Rental Housing Fund 82,232 - - - - Art in Public Places Trust Fund Balance 40,301 - - - -
Subtotal $ 3,527,198 $ 4,624,625 $ 4,624,625 $ 3,052,820 $ 3,052,820Capital/Lease Funds Certificate of Participation (COP) Funded Projects 78,676 - - - - Capital Projects - Assessment District 2000 16,878 - - - - Capital Projects – Rice/Highway 101 Assessment 5,522 - - - - Capital Projects – CFD 2000-3 33,126 - - - - 2009 Lease Purchase Equipment 1,395,646 2,519,400 3,237,400 - -
Subtotal $ 1,529,848 $ 2,519,400 $ 3,237,400 $ - $ - Community Development Commission Funds Tax Increment Revenue 18,955,432 19,126,414 19,126,414 18,955,400 18,955,400Less Pass Through to Other Agencies (5,931,181) (3,635,000) (3,635,000) (4,131,000) (4,131,000)Interest on Investments 1,047,703 822,482 822,482 1,047,700 1,047,700Operating Loan Proceeds 1,030,560 1,030,560 1,030,560 1,030,600 1,030,600Internal Administrative Fees 1,778,394 1,944,000 1,944,000 1,778,400 1,778,400Miscellaneous Receipts/ Reimbursements 449,184 435,000 435,000 449,300 449,300
Subtotal $ 17,330,092 $ 19,723,456 $ 19,723,456 $ 19,130,400 $ 19,130,400
Total Special Revenue Funds $ 96,312,216 $ 66,266,921 $ 82,571,566 $ 71,026,712 $ 68,829,584 (a) Reclassification of Police COP Universal grant from State to Federal. (b) Reclassification of HPRP, ESG and Continuum of Care from State to Federal.

ENTERPRISE FUNDS REVENUES AND SOURCES
City of Oxnard, California 10
2009-2010
Actual 2010-2011 Adopted
2010-2011 Revised
2011-2012 Recommended
2012-2013 Proposed
Water Service Fees $ 34,067,701 $ 41,065,300 $ 41,065,300 $ 38,160,000 $ 38,460,000 Water Security/Prevention Fees 657,350 505,600 505,600 750,000 770,000 Interest on Investments 1,321,029 2,833,952 2,833,952 2,344,000 2,344,000 Connection/Development Fees 979,454 599,400 599,400 460,000 460,000 Miscellaneous Receipts/
Reimbursements 2,735,148 3,650,900 3,650,900 3,069,400 3,922,900 Transfer from Capitalized
Interest - 4,625,996 4,625,996 - - Bond/Credit Financing Proceeds 100,466,754 - 90,000 - - From / (To) Capital Reserves (104,774,573) (927,138) (1,981,445) 3,412,061 2,436,988
Subtotal $ 35,452,563 $ 52,354,010 $ 51,389,703 $ 48,195,461 $ 48,393,888
Wastewater Service Fees 21,685,498 25,887,900 25,887,900 23,400,000 23,930,000 Interest on Investments 406,886 453,300 453,300 30,000 30,000 Connection/Development Fees 1,168,423 1,716,000 1,716,000 320,000 380,000 Miscellaneous Receipts/
Reimbursements (a) 886,013 3,664,900 3,664,900 610,000 635,000 Transfers from Connection Fees
for Debt Service 3,950,000 1,200,000 1,200,000 - - From / (To) Capital Reserves (669,108) (3,233,604) (2,650,394) 3,254,171 2,685,463
Subtotal $ 27,427,712 $ 29,688,496 $ 30,271,706 $ 27,614,171 $ 27,660,463
Environmental Resources Service Fees 40,019,264 41,938,700 41,938,700 42,710,000 43,500,000 Interest on Investments 146,015 140,900 140,900 179,000 185,000 Connection/Development Fees 67,173 116,000 116,000 - - Miscellaneous Receipts/
Reimbursements 332,800 1,284,900 1,309,091 275,000 285,000 Bond/Credit Financing Proceeds 42,732 - - - - From / (To) Capital Reserves 35,507 (807,533) (831,724) (709,791) (1,523,691)
Subtotal $ 40,643,491 $ 42,672,967 $ 42,672,967 $ 42,454,209 $ 42,446,309
Performing Arts and Convention Center Service Fees $ 513,859 $ 483,000 $ 483,000 $ 540,200 $ 540,200 Interest on Investments - - - - - Contribution from General
Fund 947,811 947,811 947,811 947,811 947,811 From / (To) Capital Reserves 186,333 65,408 65,408 (5,635) (5,635)
Subtotal $ 1,648,003 $ 1,496,219 $ 1,496,219 $ 1,482,376 $ 1,482,376
Golf Course Service Fees $ 4,273,446 $ 4,600,000 $ 4,600,000 $ 4,000,000 $ 4,000,000 Interest on Investments 16,881 103,703 103,703 - - Miscellaneous Receipts/
Reimbursements 4,794 10,000 10,000 10,000 10,000 Bond Proceeds 40,778,492 - - - - To/From Capital Reserves (a) (19,749,659) 66,050 117,850 1,176,326 1,186,448
Subtotal $ 25,323,954 $ 4,779,753 $ 4,831,553 $ 5,186,326 $ 5,196,448 Total Enterprise Revenues $ 130,495,723 $ 130,991,445 $ 130,662,148 $ 124,932,543 $ 125,179,484
(a) Reclassification of Penalties and Forfeiture to operating revenue

INTERNAL SERVICE FUNDS REVENUES AND SOURCES
City of Oxnard, California 11
2009-2010
Actual 2010-2011 Adopted
2010-2011 Revised
2011-2012 Recommended
2012-2013 Proposed
Public Liability Service Fees $ 1,815,203 $ 3,832,186 $ 3,832,186 $ 3,832,186 $ 3,832,186 Interest on Investments 120,401 110,000 110,000 110,000 110,000 Miscellaneous Receipts/
Reimbursements 172,595 10,000 10,000 10,000 10,000 From / (To) Capital Reserves 608,645 (35,835) (35,835) (39,491) (39,491)
Subtotal $ 2,716,844 $ 3,916,351 $ 3,916,351 $ 3,912,695 $ 3,912,695 Workers Compensation Fund Service Fees 6,320,836 7,400,000 7,400,000 5,944,500 5,944,500 Interest on Investments 248,907 230,000 230,000 120,000 120,000 Miscellaneous Receipts/
Reimbursements 520,955 540,000 540,000 357,417 357,417 From / (To) Capital Reserves 1,864,291 (1,788,067) (1,727,864) (3,318) (3,318)
Subtotal $ 8,954,989 $ 6,381,933 $ 6,442,136 $ 6,418,599 $ 6,418,599 Utility Customer Services Service Fees 1,336,292 1,336,292 1,336,292 1,478,221 1,478,221 Interest on Investments 14,575 15,000 15,000 15,000 15,000 From / (To) Capital Reserves 88,815 99,436 99,436 (17,131) (17,131)
Subtotal $ 1,439,682 $ 1,450,728 $ 1,450,728 $ 1,476,090 $ 1,476,090 Information Systems Service Fees 4,280,244 4,101,539 4,101,539 3,855,969 3,855,969 Interest on Investments - - - - - Miscellaneous Receipts/
Reimbursements - - - - - From / (To) Capital Reserves (264,505) - - 205,084 205,084
Subtotal $ 4,015,739 $ 4,101,539 $ 4,101,539 $ 4,061,053 $ 4,061,053 Facilities Maintenance Service Fees 3,975,059 3,955,798 3,955,798 3,675,900 3,675,900 Interest on Investments 26,035 20,000 20,000 20,000 20,000 Miscellaneous Receipts/
Reimbursements 54,053 59,800 59,800 59,800 59,800 From / (To) Capital Reserves (273,163) (195,531) (185,597) (177,391) (177,391)
Subtotal $ 3,781,984 $ 3,840,067 $ 3,850,001 $ 3,578,309 $ 3,578,309 Fleet Maintenance Service Fees 8,835,525 8,700,000 8,700,000 8,814,708 8,814,708 Interest on Investments 15,269 10,000 10,000 10,000 10,000 Miscellaneous Receipts/
Reimbursements 2,407 - - - - From / (To) Capital Reserves 495,840 (518,421) (299,926) (10,000) (10,000)
Subtotal $ 9,349,041 $ 8,191,579 $ 8,410,074 $ 8,814,708 $ 8,814,708 Total Revenues $ 30,258,279 $ 27,882,197 $ 28,170,829 $ 28,261,454 $ 28,261,454

Comparative Personnel Summary Permanent Full-Time Equivalent Positions
City of Oxnard, California 12
Departmental2009-2010
Actual 2010-2011
Budget 2010-11 Revised
2011-12 Recommended
2012-2013 Proposed
GENERAL FUND
Carnegie Art Museum 0 0 3.5 3.5 3.5 City Attorney 10 10 10 10 10 City Clerk 4 4 4 4 4 City Council 5.3 5.3 5.3 5.3 5.3 City Manager 11.75 11.75 11.75 11.95 11.95
General Services 39.65 36.65 36.65 34.45 34.45 Public Information 3 3 3 3 3
City Treasurer 7.75 7.75 7.75 7.75 7.75 Community Development
Commission 1.1 1.1 1.6 2.1 2.1 Development Services 55.25 55.25 55.25 52.934 52.934 Finance 30.2 30.2 27.7 25.35 25.35 Fire 100 100 100 99 99 Housing 1.23 1.23 1.5144 1.5144 1.5144Human Resources 13.2 13.2 13.2 13.2 13.2 Library 46.5 46.5 43 43 43 Recreation and Community
Services 36.85 36.85 36.65 36.65 36.65 Police 388 388 388.2 387.2 387.2 Public Works 48.52 49.52 48.7 48.7 48.7 Total General Fund 802.3 800.3 797.7644 789.5984 789.5984
INTERNAL SERVICE FUNDS Information Systems 22 22 22 22.15 22.15 Equipment Maintenance 35 35 35 35.2 35.2 Facilities Maintenance 37.35 36.35 36.35 35.35 35.35 Customer Billing 12 12 12 12 12
Total Internal Service Funds 106.35 105.35 105.35 104.7 104.7
SPECIAL FUNDS CDBG Human Services .35 .35 .35 0 0 CUPA Fire 6 6 6 5 5 Housing 81.02 81.02 81.9316 81.2516 81.2516General Services 2 5 5 8 8 Redevelopment 10.8 10.8 11.3 11.15 11.15 Total Special Funds 100.17 103.17 104.5816 105.4016 105.4016
UTILITY FUNDS Solid Waste 77.71 77.71 78.72 78.72 78.72 Wastewater 71.57 71.57 70.42 70.42 70.42 Water 49.9 49.9 51.16 51.16 51.16 Total Utility Funds 199.18 199.18 200.3 200.3 200.3 TOTAL CITY 1,208.00 1,208.00 1,208.00 1,200.00 1,200.00

City
of O
xnar
d R
EV: 0
7/01
/11
Org
aniz
atio
nal C
hart
R
esid
ents
City
Tre
asur
erD
anie
Nav
as
C
usto
mer
Ser
vice
(E
den
Alo
mer
i) B
usin
ess L
icen
sing
U
tility
Bill
ing
City
Cou
ncil
Dr.
Thom
as E
. Hol
den,
May
or
Dr.
Iren
e G
. Pin
kard
, May
or P
ro T
em
Bry
an A
. Mac
Don
ald,
Cou
ncilm
an
Tim
Fly
nn, C
ounc
ilman
C
arm
en R
amire
z, C
ounc
ilmem
ber
City
Cle
rkD
anie
l Mar
tinez
El
ectio
ns
Info
rmat
ion
Res
ourc
es
City
Att
orne
yA
lan
Hol
mbe
rg
Deb
t Col
lect
ion
Lega
l Ass
ista
nce
Spec
ial L
itiga
tion
City
Man
ager
Edm
und
Sote
lo
CD
CC
urtis
Can
non
Cen
tral B
usin
ess D
ist.
Har
bor D
istri
ct
H.E
.R.O
O
rmon
d B
each
So
uthw
inds
Sp
ecia
l Pro
ject
s
A
ssis
tant
City
Man
ager
K
aren
Bur
nham
Polic
eFi
reH
ousi
ngFi
nanc
e
Rec
reat
ion
and
Com
mun
ity
Serv
ices
Dev
elop
men
t Se
rvic
esPu
blic
Wor
ksC
ity M
anag
erH
uman
Res
ourc
esL
ibra
ry
Jeri
Will
iam
s Jo
e M
illig
an
Bill
Wilk
ins
Jim
Cam
eron
V
AC
AN
T M
att W
ineg
ar
Rob
Ros
hani
an
(Act
ing)
Ed
mun
d So
telo
M
iche
lle T
elle
z B
arba
ra M
urra
y A
dmin
istr
ativ
e Se
rvic
es
(Jas
on B
enite
s)
Emer
genc
y C
omm
unic
atio
ns
Prof
essi
onal
St
anda
rds
Supp
ort S
ervi
ces
Fi
eld
Ope
ratio
ns
(Sco
tt W
hitn
ey)
Cod
e C
ompl
ianc
e C
omm
unity
Pat
rol
In
vest
igat
ive
Serv
ices
(V
acan
t) In
vest
igat
ive
Serv
ices
Sp
ecia
l Ser
vice
s
Dis
aste
r Pr
epar
edne
ss
(Deb
orah
Sha
ne)
E
mer
genc
y Se
rvic
es
(Dar
win
Bas
e)
(Mic
hael
O’M
alia
) (C
hris
Don
abed
ian)
Fire
Pre
vent
ion
(Gar
y Su
gich
)
CU
PA
(Mig
uel T
rujil
lo)
Adm
inis
trat
ive
Serv
ices
(C
arrie
Sab
atin
i)
Aff
orda
ble
Hou
sing
(K
arl L
awso
n)
H
ousi
ng A
ssis
tanc
e (W
ill R
eed)
Cap
ital F
und
Ass
et
Man
agem
ent
(Ric
k Sh
ear)
Gra
nts
Man
agem
ent
(Nor
ma
Ow
ens)
G
rant
s Ass
ista
nce
Bud
get a
nd C
apita
l Im
prov
emen
t (B
eth
Vo)
B
udge
t C
apita
l Im
prov
emen
t Pr
ojec
ts
Fina
ncia
l Res
ourc
es
(Mik
e M
ore)
D
ebt &
Pro
perty
M
anag
emen
t Li
abili
ty
Man
agem
ent
Gen
eral
Acc
ount
ing
(Mar
ichu
Mar
amba
) A
ccou
ntin
g Pa
yrol
l & B
enef
its
Pu
rcha
sing
(B
ruce
Dan
dy)
Mai
l Ser
vice
Pu
rcha
sing
Com
mun
ity
Faci
litie
s (B
ob H
olde
n)
Perf
orm
ing
Arts
and
C
onve
ntio
n C
ente
r
Rec
reat
ion
&
Com
mun
ity
Serv
ices
(V
acan
t) R
ecre
atio
n Se
rvic
es
Seni
or/S
peci
al
Popu
latio
n Se
rvic
es
Sout
h O
xnar
d C
ente
r Sp
ecia
l Eve
nts
You
th D
evel
opm
ent
Dev
elop
men
t Su
ppor
t Tr
ansp
orta
tion
Plan
ning
&
Serv
ices
Bui
ldin
g an
d E
ngin
eeri
ng
(Rob
Ros
hani
an)
Bui
ldin
g an
d En
gine
erin
g
Plan
ning
(S
ue M
artin
) Pl
anni
ng &
En
viro
nmen
tal
Serv
ices
Adm
inis
trat
ion
C
onst
ruct
ion
and
Des
ign
Serv
ices
(L
ou B
alde
rram
a)
C
onst
ruct
ion
Serv
ices
D
esig
n St
reet
Mai
nten
ance
&
Rep
air
Traf
fic S
igns
&
Mar
king
s
Util
ities
Ser
vice
s (V
acan
t) W
ater
W
aste
wat
er
Envi
ronm
enta
l R
esou
rces
Ope
ratio
ns
Bud
get
Cab
le T
elev
isio
n C
omm
unity
R
elat
ions
N
eigh
borh
ood
Serv
ices
Pu
blic
Info
rmat
ion
Spec
ial P
roje
cts
Leg
isla
tive
Aff
airs
(M
artin
Eric
kson
)
Info
rmat
ion
Syst
ems
(Gra
ce H
offm
an)
City
wid
e N
etw
ork
Supp
ort
Doc
umen
t Pub
lishi
ng
Serv
ices
G
eogr
aphi
c In
form
atio
n Sy
stem
s H
elp
Des
k M
unic
ipal
Sof
twar
e Su
ppor
t Te
leco
mm
unic
atio
ns
Supp
ort
Gen
eral
Ser
vice
s (M
icha
el H
ende
rson
) Fa
cilit
ies
Mai
nten
ance
La
ndsc
ape
Ass
essm
ent &
G
raff
iti R
emov
al
Park
/Fac
ility
D
evel
opm
ent
Park
s Mai
nten
ance
R
iver
Rid
ge G
olf
Cou
rse
St
reet
Lig
htin
g
Flee
t Ser
vice
s
Empl
oyee
Ben
efits
Em
ploy
ee T
rain
ing
Hum
an R
esou
rces
La
bor N
egot
iatio
ns
Safe
ty &
Wel
lnes
s W
orke
rs’
Com
pens
atio
n
Circ
ulat
ion
Serv
ices
B
ranc
h Se
rvic
es
Com
mun
ity O
utre
ach
Publ
ic S
ervi
ces
Supp
ort S
ervi
ces
Stru
ctur
e: D
epar
tmen
t - D
epar
tmen
t Dire
ctor
- D
ivis
ion
- (D
ivis
ion
Man
ager
) – P
rogr
am
1
3

Debt Service Summary
City of Oxnard, California 14
FY 2011-2012
7-1-11
Balance Principal Interest Admin Total MaturityGeneral Fund
Certificates of Participation, Series 1999 6,395,000 275,000 302,058 5,125 582,183 6/1/2028Land Acquisition Component (S.F.) 113,547 21,137 4,191 138 25,466 6/1/2016Adjustable Lease Revenue Bonds, 2003 11,945,000 395,000 482,220 68,500 945,720 6/1/2033300 West Third Street 253,812 47,245 9,368 309 56,922 6/1/2016Old Oxnard High School 877,198 163,286 32,376 1,070 196,732 6/1/2016Lease Revenue Bonds Series 2011* 21,720,000 255,000 1,079,652 3,125 1,337,777 6/1/2036Bank Of America Lease Purchases 817,662 333,428 98,783 - 432,211 7/15/2015
Total General Fund 42,122,219 1,490,096 2,008,648 78,267 3,577,011Water Fund
Water Revenue Refunding Project Bonds, 2001 9,725,000 325,000 483,321 5,125 813,446 6/1/2030Water Revenue Project Bonds, Series 2004 41,150,000 1,065,000 1,962,984 5,125 3,033,109 6/1/2034Water Revenue Project Bonds, Series 2006 52,185,000 875,000 2,551,385 5,125 3,431,510 6/1/2036Water Revenue Project Bonds, Series 2010A 16,455,000 1,215,000 752,475 - 1,967,475 6/1/2022Water Revenue Project Bonds, Series 2010B
(BAB’s) 83,670,000 - 3,761,012 - 3,761,012 6/1/2040
Bank Of America Lease Purchases 383,637 40,568 6,208 - 46,776 3/16/2015Total Water Fund 203,568,637 3,520,568 9,517,385 15,375 13,053,328
Wastewater Treatment Fund Wastewater Refunding Bonds Series 2003 26,030,000 2,355,000 1,314,813 11,625 4,996,251 6/1/2020Wastewater Revenue Bonds, 2004 Series A 80,000,000 - 4,087,726 7,125 4,094,851 6/1/2034Wastewater Revenue Bonds, 2004 Series B 21,450,000 885,000 861,647 154,500 1,901,147 6/1/2036Wastewater Revenue Project Bonds, Series 2006 11,440,000 260,000 536,730 5,125 801,855 6/1/2036Bank Of America Lease Purchases 234,847 32,559 4,987 - 37,546 3/1/2016
Total Wastewater Treatment Fund 139,154,847 3,532,559 6,805,903 178,375 11,831,650Solid Waste Fund
Solid Waste Revenue Refunding Bonds, Series 2005 10,395,000 2,065,000 519,750 5,125 2,589,875 5/1/2016
Fifth and Del Norte Acquisition 270,944 123,587 11,011 - 134,598 6/1/2013Fifth and Del Norte Improvements 127,467 81,538 5,151 - 86,689 12/1/2012Land Acquisition Component (E.Y.) 113,547 21,137 4,191 138 25,466 6/1/2016Trash Container Lease Purchase 2,548,457 320,973 101,972 1,125 424,070 4/23/2018Bank Of America Lease Purchases 487,258 54,225 10,862 - 65,087 3/1/2016
Total Solid Waste Fund 13,942,673 2,666,460 652,937 6,388 3,325,785Community Development Commission
Tax Allocation Refund and Project Bonds, Series 2004 14,705,000 730,000 637,996 3,125 1,371,121 9/1/2026
Local Obligation Revenue 2006 Tax Allocation Bonds 19,005,000 450,000 867,022 9,375 1,326,397 9/1/2035
HERO Tax Allocation Bonds Series 2008 11,445,000 185,000 525,338 3,500 713,838 9/1/2038HERO Tax Allocation Bonds Series 2011* 18,360,000 - 773,882 3,125 777,007 9/1/2041
Total Community Development Commission 63,515,000 1,365,000 2,804,238 19,125 4,188,363Golf Course Enterprise Fund
Golf Course Component 4,875,800 907,604 179,956 5,950 1,093,510 6/1/2016Total Golf Course Enterprise Fund 4,875,800 907,604 179,956 5,950 1,093,510
Special Revenue Fund Library Component 2,066,096 384,592 76,253 2,520 463,365 6/1/2016Variable Rate Lease, Series 2006 (Civic Center) 21,990,000 545,000 776,247 118,100 1,439,347 6/1/2036Gas Tax Rev COP’S 2007 Street Improvement
Program 26,425,000 535,000 1,178,150 5,125 1,718,275 9/1/2037
Total Special Revenue Fund 50,481,096 1,464,592 2,030,650 125,745 3,620,987
*Estimates only.

Debt Service Summary
City of Oxnard, California 15
FY 2012-2013
7-1-12
Balance Principal Interest Admin Total MaturityGeneral Fund
Certificates of Participation, Series 1999 6,120,000 290,000 289,820 5,125 584,945 6/1/2028Land Acquisition Component (S.F.) 92,410 21,888 3,472 138 25,498 6/1/2016Adjustable Lease Revenue Bonds, 2003 11,550,000 405,000 466,274 68,500 939,774 6/1/2033300 West Third Street 206,567 48,927 7,761 309 56,997 6/1/2016Old Oxnard High School 713,912 169,099 26,824 1,070 196,993 6/1/2016Lease Revenue Bonds Series 2011* 21,465,000 255,000 1,079,652 3,125 1,337,777 6/1/2036Bank Of America Lease Purchases 484,234 346,307 85,895 - 432,202 7/15/2015
Total General Fund 40,632,123 1,536,221 1,959,698 78,267 3,574,186Water Fund
Water Revenue Refunding Project Bonds, 2001 9,400,000 340,000 469,103 5,125 814,228 6/1/2030Water Revenue Project Bonds, Series 2004 40,085,000 1,095,000 1,928,904 5,125 3,029,029 6/1/2034Water Revenue Project Bonds, Series 2006 51,310,000 920,000 2,507,635 5,125 3,432,760 6/1/2036Water Revenue Project Bonds, Series 2010A 14,025,000 1,255,000 716,025 - 1,971,025 6/1/2022Water Revenue Project Bonds, Series 2010B
(BAB’s) 83,670,000 - 3,761,012 - 3,761,012 6/1/2040
Bank Of America Lease Purchases 343,069 41,940 4,833 - 46,773 3/16/2015Total Water Fund 198,833,069 3,651,940 9,387,512 15,375 13,054,827
Wastewater Treatment Fund Wastewater Refunding Bonds Series 2003 23,675,000 2,470,000 1,197,063 11,625 4,993,501 6/1/2020Wastewater Revenue Bonds, 2004 Series A 80,000,000 - 4,087,726 7,125 4,094,851 6/1/2034Wastewater Revenue Bonds, 2004 Series B 20,565,000 915,000 826,096 154,500 1,895,596 6/1/2036Wastewater Revenue Project Bonds, Series 2006 11,180,000 270,000 526,330 5,125 801,455 6/1/2036Bank Of America Lease Purchases 202,288 33,638 3,907 - 37,545 3/1/2016
Total Wastewater Treatment Fund 135,622,288 3,688,638 6,641,122 178,375 11,822,948Solid Waste Fund
Solid Waste Revenue Refunding Bonds, Series 2005 8,330,000 2,165,000 416,500 5,125 2,586,625 5/1/2016
Fifth and Del Norte Acquisition 147,357 137,788 4,785 - 142,573 6/1/2013Fifth and Del Norte Improvements 45,929 43,028 1,042 - 44,070 12/1/2012Land Acquisition Component (E.Y.) 92,410 21,888 3,472 138 25,498 6/1/2016Trash Container Lease Purchase 2,227,484 334,365 88,578 1,125 424,068 4/23/2018Bank Of America Lease Purchases 433,033 56,076 9,010 - 65,086 3/1/2016
Total Solid Waste Fund 11,276,213 2,758,145 523,387 6,388 3,287,920Community Development Commission
Tax Allocation Refund and Project Bonds, Series 2004 13,975,000 755,000 612,921 3,125 1,371,046 9/1/2026
Local Obligation Revenue 2006 Tax Allocation Bonds 18,555,000 465,000 752,599 9,375 1,226,974 9/1/2035
HERO Tax Allocation Bonds Series 2008 11,260,000 190,000 517,838 3,500 711,338 9/1/2038HERO Tax Allocation Bonds Series 2011* 18,360,000 245,000 773,882 3,125 1,022,007 9/1/2041
Total Community Development Commission 62,150,000 1,655,000 2,657,240 19,125 4,331,365Golf Course Enterprise Fund
Golf Course Component 3,968,196 939,914 149,097 5,950 1,094,961 6/1/2016Total Golf Course Enterprise Fund 3,968,196 939,914 149,097 5,950 1,094,961
Special Revenue Fund Library Component 1,681,504 398,283 63,179 2,520 463,982 6/1/2016Variable Rate Lease, Series 2006 (Civic Center) 21,445,000 570,000 757,009 118,100 1,445,109 6/1/2036Gas Tax Rev COP’S 2007 Street Improvement
Program 25,890,000 555,000 1,156,350 5,125 1,716,475 9/1/2037
Total Special Revenue Fund 49,016,504 1,523,283 1,976,538 125,745 3,625,566*Estimates only.

Indirect Cost Determination
16 City of Oxnard, California
The annual amount of indirect cost reimbursement to the General Fund is developed from an indirect cost plan which adheres to the guidelines as published by the Federal Office of Management & Budget. The indirect cost plan also serves as the basis for reimbursement from state and federal grants. The indirect cost plan is essentially a statistical model which allocates the costs of administrative and support departments (indirect costs) to direct service departments. Each fiscal year since 1985-86, when the Indirect Cost Methodology was first adopted, the plan has been reviewed and updated both as to costs of providing the administrative and support services and the statistics upon which each department’s costs will be allocated. In keeping with the Council’s policy of full cost recovery, each department has reviewed, and modified where appropriate, the statistical base for allocating indirect costs. How Indirect Costs are Determined Generally, costs associated with any department can be divided into two major categories: direct costs and indirect costs. Direct costs represent resources that can be specifically identified with a particular activity or function. To the extent possible such costs are charged directly to that activity for purposes of cost determination. For example, the salary of a police officer is directly associated with the police function and should be charged directly to that department. Indirect costs represent resources that are employed for common or joint purposes benefiting several activities or functions. As such, indirect costs are not as readily chargeable to individual departments or divisions and, therefore, generally require allocation based upon usage relationships. For example, Human Resources provides a varied level of benefit and supporting service to all operating departments throughout the year. Because it is not cost effective to determine the amount of support service to charge on a direct charge basis, these costs are allocated through the indirect cost plan. The major component of indirect cost involves the operating expense of central service activities that provide common supportive services to other funds and departments. These supportive services include the City Council, City Manager’s Office, Financial Services, City Attorney’s Office, City Clerk’s Office, City Treasurer’s Office and Mail and Courier Services. Annual depreciation costs of usable buildings, motor vehicles, and other equipment not paid for through federal grants are also allowable as Indirect Costs.

Indirect Cost Determination
City of Oxnard, California 17
How the City Benefits The City benefits financially from an Indirect Cost Allocation Plan in the following ways:
1. Administrative Costs are Recovered: Administrative programs within the General Fund provide a benefit and support to other funds in the City. The Indirect Cost Allocation Plan calculates the costs of these support services so the General Fund can be reimbursed.
2. Additional Grant Revenue: An approved indirect cost plan makes it possible for the City to
receive additional grant funds under state and federal guidelines to cover indirect costs. 3. Use of Indirect Costs as Matching Funds for Grants: Indirect costs justified through any
indirect cost plan may be used to satisfy cash matching requirements for grants. Although this use of the indirect cost plan does not create additional revenues for the City, the use of indirect costs to match federal funds can reduce the need for additional local appropriations.
4. A more accurate cost of providing services is identified.
An indirect cost plan is another tool used to identify the full cost of a specific activity or function. Accurate full cost information can be valuable in the decision making process (e.g., price determination, comparing the cost of contracting for a service with providing it internally, assessing a need for additional or fewer staff, capital budgeting decisions, etc.), and can be used to inform the public of the full cost of providing services.


City Attorney


%Change
Expenses by Category
City Attorney Department Summary
19
%Change
%Change
Expenses by Fund
Expenses by Program 2009-10Actual
2010-11Budget
2010-11Revised
2011-12Recommended
2012-13Proposed
2009-10Actual
2010-11Budget
2010-11Revised
2011-12Recommended
2012-13Proposed
2009-10Actual
2010-11Budget
2010-11Revised
2011-12Recommended
2012-13Proposed
Salaries and Benefits 1,064,660 1,060,882 1,060,882 1,074,045 1,074,0451.24%Other Expenses 357,735 280,951 282,901 262,872 262,872-7.08%Total Expenses 1,422,395 1,341,833 1,343,783 1,336,917 1,336,917-0.51%
General Fund 1,422,395 1,341,833 1,343,783 1,336,917 1,336,917-0.51%1,422,395 1,341,833 1,343,783 1,336,917 1,336,917-0.51%Total All Funds
City Attorney 1,320,998 1,239,003 1,240,953 1,234,086 1,234,086-0.55%Collection Services 101,397 102,830 102,830 102,831 102,8310.00%
1,422,395 1,341,833 1,343,783 1,336,917 1,336,917-0.51%Total All Programs

City Attorney City Attorney
Activities / Functions
20
The staff in the Office of the City Attorney contributes to an outstanding quality of life in Oxnard by advising the Code Compliance Unit, prosecuting City Code violations, preparing various agreements, ordinances and resolutions, ensuring compliance with zoning requirements, protecting the public treasury, and providing expert legal advice to City officials. The Office of the City Attorney staff provides effective legal representation to the City Council, City boards, commissions, committees, task forces and City staff in general municipal, public liability and workers’ compensation claims and litigation, and administrative matters by including all stakeholders in strategy development and resolution of each matter. Specifically, the Office of the City Attorney staff advises the City Council, Community Development Commission and Housing Authority on legal issues related to policy matters; provides legal advice to boards, commissions, committees, task forces, department directors and division managers; conducts legal research, drafts legal opinions, reviews agenda reports, reviews and prepares agreements, prepares ordinances, resolutions, regulations and administrative policies; assists the Code Compliance Unit in the prosecution of City Code violations; and manages and defends public liability claims and cases, workers’ compensation claims and cases, and administrative matters involving the City.

%Change
City Attorney City Attorney
21
Expenses by Category
Expenses by Fund %Change
Personnel
2009-10Actual
2010-11Budget
2010-11Revised
2011-12Recommended
2012-13Proposed
2009-10Actual
2010-11Budget
2010-11Revised
2011-12Recommended
2012-13Proposed
2009-10Actual
2010-11Budget
2010-11Revised
2011-12Recommend
2012-13Proposed
Salaries and Benefits 965,892 962,717 962,717 973,879 973,8791.16%Other Expenses 355,106 276,286 278,236 260,207 260,207-6.48%Total Expenses 1,320,998 1,239,003 1,240,953 1,234,086 1,234,086-0.55%
General Fund 1,320,998 1,239,003 1,240,953 1,234,086 1,234,086-0.55%1,320,998 1,239,003 1,240,953 1,234,086 1,234,086-0.55%Total All Funds
Administrative Legal Assistant (C) 1.00 1.00 1.00 1.00 1.00Administrative Legal Secretary I/II (C) 1.00 1.00 1.00 1.00 1.00Administrative Legal Secretary III (C) 1.00 1.00 1.00 1.00 1.00Assistant City Attorney 3.00 3.00 3.00 3.00 3.00City Attorney 1.00 1.00 1.00 1.00 1.00Deputy City Attorney II 1.00 1.00 1.00 1.00 1.00Law Office Manager 1.00 1.00 1.00 1.00 1.00
9.00 9.00 9.00 9.00 9.00Total Personnel

City Attorney Collection Services
Activities / Functions
22
The debt collection staff develops and implements cost effective, efficient, proactive debt collection processes for all departments and divisions. The activities of the debt collection staff include: provide training to staff members to emphasize the importance of their responsibility for effective debt collection; continue collaboration among all departments and divisions for effective debt collection practice; process debt collection in a consistent, economical and timely manner; and research and review resource tools to implement and improve debt collection practices.

%Change
City Attorney Collection Services
23
Expenses by Category
Expenses by Fund %Change
Personnel
2009-10Actual
2010-11Budget
2010-11Revised
2011-12Recommended
2012-13Proposed
2009-10Actual
2010-11Budget
2010-11Revised
2011-12Recommended
2012-13Proposed
2009-10Actual
2010-11Budget
2010-11Revised
2011-12Recommend
2012-13Proposed
Salaries and Benefits 98,768 98,165 98,165 100,166 100,1662.04%Other Expenses 2,629 4,665 4,665 2,665 2,665-42.87%Total Expenses 101,397 102,830 102,830 102,831 102,8310.00%
General Fund 101,397 102,830 102,830 102,831 102,8310.00%101,397 102,830 102,830 102,831 102,8310.00%Total All Funds
Paralegal (C) 1.00 1.00 1.00 1.00 1.001.00 1.00 1.00 1.00 1.00Total Personnel


City Clerk


%Change
Expenses by Category
City Clerk Department Summary
25
%Change
%Change
Expenses by Fund
Expenses by Program 2009-10Actual
2010-11Budget
2010-11Revised
2011-12Recommended
2012-13Proposed
2009-10Actual
2010-11Budget
2010-11Revised
2011-12Recommended
2012-13Proposed
2009-10Actual
2010-11Budget
2010-11Revised
2011-12Recommended
2012-13Proposed
Salaries and Benefits 394,702 391,638 309,525 283,332 283,332-8.46%Other Expenses 70,792 127,086 127,086 69,979 114,779-44.94%Total Expenses 465,494 518,724 436,611 353,311 398,111-19.08%
General Fund 465,494 518,724 436,611 353,311 398,111-19.08%465,494 518,724 436,611 353,311 398,111-19.08%Total All Funds
City Clerk 465,494 518,724 436,611 353,311 398,111-19.08%465,494 518,724 436,611 353,311 398,111-19.08%Total All Programs

City Clerk City Clerk
Activities / Functions
26
The City Clerk’s Office strives to keep the residents of Oxnard informed of City business and documents though the following initiatives: • Online agenda provides greater access to agendas and reports. • Streaming of Council meetings to provide greater accessibility to meetings. City Council meetings are available for viewing on
the Internet 24 hours a day • The Municipal Code Book allows for fast and efficient retrieval of code information online for residents and in-house employees • Ordinances, resolutions, and minutes from 1990 to present are scanned into electronic imaging media. This provides a database
for easy retrieval of information from the City Intranet. All of the tools outlined above greatly assist City Clerk staff to continue to provide professional, courteous customer service while seeing to the typical functions of a normally busy, high-functioning department. The City Clerk’s Office coordinated the November 2010 municipal election and citywide voter registration. The City Clerk’s Office provided voter registration forms at Satellite City Halls and municipal buildings. A media campaign included street banners reminding voters of the last day to register and to vote on Election Day. This office intends to prepare for the upcoming 2012 election by a media campaign, providing voter registration forms available at municipal buildings and events and meeting with Neighborhood Councils to discuss the importance of voting.

%Change
City Clerk City Clerk
27
Expenses by Category
Expenses by Fund %Change
Personnel
2009-10Actual
2010-11Budget
2010-11Revised
2011-12Recommended
2012-13Proposed
2009-10Actual
2010-11Budget
2010-11Revised
2011-12Recommended
2012-13Proposed
2009-10Actual
2010-11Budget
2010-11Revised
2011-12Recommend
2012-13Proposed
Salaries and Benefits 394,702 391,638 309,525 283,332 283,332-8.46%Other Expenses 70,792 127,086 127,086 69,979 114,779-44.94%Total Expenses 465,494 518,724 436,611 353,311 398,111-19.08%
General Fund 465,494 518,724 436,611 353,311 398,111-19.08%465,494 518,724 436,611 353,311 398,111-19.08%Total All Funds
Administrative Assistant 1.00 1.00 1.00 1.00 1.00Assistant City Clerk 1.00 1.00 1.00 1.00 1.00City Clerk 1.00 1.00 1.00 1.00 1.00Office Assistant I/II 1.00 1.00 1.00 1.00 1.00
4.00 4.00 4.00 4.00 4.00Total Personnel


City Council


%Change
Expenses by Category
City Council Department Summary
29
%Change
%Change
Expenses by Fund
Expenses by Program 2009-10Actual
2010-11Budget
2010-11Revised
2011-12Recommended
2012-13Proposed
2009-10Actual
2010-11Budget
2010-11Revised
2011-12Recommended
2012-13Proposed
2009-10Actual
2010-11Budget
2010-11Revised
2011-12Recommended
2012-13Proposed
Salaries and Benefits 203,422 203,549 203,549 205,012 205,0120.72%Other Expenses 166,640 173,483 185,883 147,370 147,370-20.72%Total Expenses 370,062 377,032 389,432 352,382 352,382-9.51%
General Fund 370,062 377,032 389,432 352,382 352,382-9.51%370,062 377,032 389,432 352,382 352,382-9.51%Total All Funds
City Council 370,062 377,032 389,432 352,382 352,382-9.51%370,062 377,032 389,432 352,382 352,382-9.51%Total All Programs

City Council City Council
Activities / Functions
30
The City Council governs the City in a manner that promotes a sound financial base, and responds to the current and future needs and concerns of City residents and businesses. To accomplish this, the Council appoints the City Manager and City Attorney, enacts City ordinances, establishes policy for administrative staff, and approves and oversees the budget of expenditures for the City. The Council also serves as the board of the City of Oxnard Financing Authority (COFA), the City’s Community Development Commission, and, supplemented by two Tenant Commissioners, serves as the City’s Housing Authority.

%Change
City Council City Council
31
Expenses by Category
Expenses by Fund %Change
Personnel
2009-10Actual
2010-11Budget
2010-11Revised
2011-12Recommended
2012-13Proposed
2009-10Actual
2010-11Budget
2010-11Revised
2011-12Recommended
2012-13Proposed
2009-10Actual
2010-11Budget
2010-11Revised
2011-12Recommend
2012-13Proposed
Salaries and Benefits 203,422 203,549 203,549 205,012 205,0120.72%Other Expenses 166,640 173,483 185,883 147,370 147,370-20.72%Total Expenses 370,062 377,032 389,432 352,382 352,382-9.51%
General Fund 370,062 377,032 389,432 352,382 352,382-9.51%370,062 377,032 389,432 352,382 352,382-9.51%Total All Funds
City Councilmember 4.00 4.00 4.00 4.00 4.00Executive Assistant II 0.30 0.30 0.30 0.30 0.30Mayor 1.00 1.00 1.00 1.00 1.00
5.30 5.30 5.30 5.30 5.30Total Personnel


City Manager


%Change
Expenses by Category
City Manager Department Summary
33
%Change
%Change
Expenses by Fund
Expenses by Program 2009-10Actual
2010-11Budget
2010-11Revised
2011-12Recommended
2012-13Proposed
2009-10Actual
2010-11Budget
2010-11Revised
2011-12Recommended
2012-13Proposed
2009-10Actual
2010-11Budget
2010-11Revised
2011-12Recommended
2012-13Proposed
Salaries and Benefits 14,344,482 14,522,640 14,318,663 14,210,697 14,210,697-0.75%Other Expenses 39,999,112 18,248,147 18,638,716 19,134,625 19,144,7472.66%Total Expenses 54,343,594 32,770,787 32,957,379 33,345,322 33,355,4441.18%
General Fund 11,741,438 11,639,849 11,461,212 11,536,926 11,536,9260.66%Air Pollution Buydown 0 168,000 168,000 168,000 168,0000.00%CDBG Federal Entitlement 39,828 50,000 50,000 0 0-100.00%2009 Lease Purchase Equipment 91,610 0 85,000 0 0-100.00%Golf Course 5,353,823 4,779,753 4,831,553 5,186,326 5,196,4487.34%Debt Service 19,970,131 0 0 0 0Information Service 4,015,739 4,101,539 4,101,539 4,061,053 4,061,053-0.99%Facilities Maintenance 3,781,984 3,840,067 3,850,001 3,578,309 3,578,309-7.06%Equipment Maintenance 9,349,041 8,191,579 8,410,074 8,814,708 8,814,7084.81%
54,343,594 32,770,787 32,957,379 33,345,322 33,355,4441.18%Total All Funds
City Manager 1,290,164 1,416,711 1,392,774 1,171,153 1,171,153-15.91%Public Information 227,931 174,527 174,527 148,670 148,670-14.82%Community Relations/Community Access TV
219,530 212,023 214,145 199,714 199,714-6.74%
Legislative Affairs 91,990 258,701 217,065 287,001 287,00132.22%Neighborhood Services 287,791 289,590 279,975 266,593 266,593-4.78%Enterprise Information Systems Management
1,222,776 1,303,218 1,303,218 1,249,163 1,249,163-4.15%
Geographic Information Systems 751,395 727,178 727,178 741,968 741,9682.03%Personal Computer/Network Systems
758,883 1,034,304 1,034,304 944,487 944,487-8.68%
Document Publishing Services 154,877 109,539 109,539 169,559 169,55954.79%Telecommunications 1,127,808 927,300 927,300 955,876 955,8763.08%Facilities Maintenance 3,781,984 3,840,067 3,850,001 3,578,309 3,578,309-7.06%Fleet Services 9,349,041 8,191,579 8,410,074 8,814,708 8,814,7084.81%Graffiti Action Program 816,920 785,526 770,500 840,874 840,8749.13%Parks and Facilities Development 318,024 230,648 230,648 237,745 237,7453.08%Parks and Public Grounds 4,759,139 4,638,004 4,685,370 4,630,596 4,630,596-1.17%River Ridge Golf Course 25,323,954 4,779,753 4,831,553 5,186,326 5,196,4487.34%Street Landscaping 1,000,850 1,073,418 1,073,418 948,369 948,369-11.65%Street Lighting 1,424,359 1,125,786 1,127,786 1,368,483 1,368,48321.34%Street Trees and Medians 1,436,178 1,652,915 1,598,004 1,605,728 1,605,7280.48%
54,343,594 32,770,787 32,957,379 33,345,322 33,355,4441.18%Total All Programs

City Manager City Manager
Activities / Functions
34
The City Manager’s Office implements City Council, Community Development Commission, and Housing Authority policies, provides oversight to all City departments, develops and recommends alternatives to address current and future community needs, ensures the City’s financial integrity, provides information on City government to residents, ensures that City services are provided equitably and cost-effectively, and provides oversight for the development of the City budget.

%Change
City Manager City Manager
35
Expenses by Category
Expenses by Fund %Change
Personnel
2009-10Actual
2010-11Budget
2010-11Revised
2011-12Recommended
2012-13Proposed
2009-10Actual
2010-11Budget
2010-11Revised
2011-12Recommended
2012-13Proposed
2009-10Actual
2010-11Budget
2010-11Revised
2011-12Recommend
2012-13Proposed
Salaries and Benefits 1,076,714 1,201,638 1,172,301 960,297 960,297-18.08%Other Expenses 213,450 215,073 220,473 210,856 210,856-4.36%Total Expenses 1,290,164 1,416,711 1,392,774 1,171,153 1,171,153-15.91%
General Fund 1,290,164 1,416,711 1,392,774 1,171,153 1,171,153-15.91%1,290,164 1,416,711 1,392,774 1,171,153 1,171,153-15.91%Total All Funds
Administrative Assistant (C) 1.00 1.00 1.00 1.00 1.00Assistant City Manager 0.65 0.65 0.65 0.65 0.65City Manager 0.85 0.85 0.85 0.85 0.85Deputy City Manager 1.00 1.00 1.00 0.85 0.85Executive Assistant II 1.70 1.70 1.70 1.70 1.70Management Analyst I/II/III 1.00 1.00 1.00 1.00 1.00Special Assistant to City Manager 1.00 1.00 1.00 0.50 0.50
7.20 7.20 7.20 6.55 6.55Total Personnel

City Manager Public Information
Activities / Functions
36
Provide oversight of the Communication and Public Information Office: Public Information Office, Community Relations Program, Citywatch TV, and Neighborhood Services. Supervise information specialists and other assigned staff; coordinate assigned activities with other City departments. Facilitate the accurate and full coverage of City issues by the news media; develop materials to be presented in press announcements, including press releases, press briefings, and feature articles on various City services. Write Opinion Editorials and letters to the Editor to the press from the Mayor and City Manager. Collect information, organize and prepare the Mayor’s State of the City presentation. Prepare talking points for City Council members. Coordinate official City functions for the City Council/City Manager; coordinate and conduct special events including dedication ceremonies, appreciation events, and City/community functions. Supervise the design and content of OxnardNews.org, the City’s Facebook and Twitter pages, City publications, including informational booklets, posters, and flyers. Release a quarterly newsletter called OxnardNews.org that highlights city programs and services. Develop communication plans for various City campaigns, both internally and externally; prepare communication materials in various formats. Meet with staff, identify projects, and develop work plans, estimates, timelines and prioritizations. Identify resources. Provide public outreach to the community prior to and during the construction of the Advanced Water Purification plant and the Recycled Water Backbone. Supervise scripts for slide, video and other presentations; maintain photo and video archives for publications, video and audiovisual presentations. Develop and implement methods and materials to promote special events sponsored by the City and its departments. Work with the Information Systems Division on the development of City websites. Prepare, review and issue press releases, media advisories and announcements for all City departments for distribution to the public, postings on the City’s website and/or postings on the City’s Television Channel. Maintain City press clippings and other related media clippings; communicate news/issues to the employees. Serve as a Spanish interpreter at City Council meetings. Translate and review materials for distribution to the Spanish speaking public. Organize emergency public information as lead PIO for the Emergency Operations center in the event of local disaster. Participate in the EOC Advisory Team, EOC Management Section, Downtown Improvement Task Force, Graffiti Task Force, Utilities Task Force, CityWide Enhancement Program (CWEP) and CWEP Leadership meetings. Maintain effective relationships with civic, corporate, business, and educational organizations, community organizations, and the public. Active member in national, statewide and county peer communications and information organizations to include National Information Officers Association (NIOA), California Association of Public Information Officials (CAPIO), League of California Cities, National League of Cities, California Emergency Services Association (CESA), among others. Serve as a liaison to community organizations to facilitate the planning and permit process for their yearly events.

%Change
City Manager Public Information
37
Expenses by Category
Expenses by Fund %Change
Personnel
2009-10Actual
2010-11Budget
2010-11Revised
2011-12Recommended
2012-13Proposed
2009-10Actual
2010-11Budget
2010-11Revised
2011-12Recommended
2012-13Proposed
2009-10Actual
2010-11Budget
2010-11Revised
2011-12Recommend
2012-13Proposed
Salaries and Benefits 162,248 118,740 118,740 86,858 86,858-26.85%Other Expenses 65,683 55,787 55,787 61,812 61,81210.80%Total Expenses 227,931 174,527 174,527 148,670 148,670-14.82%
General Fund 227,931 174,527 174,527 148,670 148,670-14.82%227,931 174,527 174,527 148,670 148,670-14.82%Total All Funds
Outreach/Education Specialist 2.00 2.00 2.00 2.00 2.00Public Information Officer 1.00 1.00 1.00 1.00 1.00
3.00 3.00 3.00 3.00 3.00Total Personnel

City Manager Community Relations/Community Access TV
Activities / Functions
38
Community Relations Program provides support to the Commission on Community Relations (CCR), which consists of seven members appointed to identify and advise the City Council on problems of discrimination in the community and to promote better human relations among all city residents. Community Relations Program staff provides support to coordinate the CCR’s monthly meetings (12 a year), schedule speakers and presenters, and provide assistance in organizing outreach activities for the Commissioners. The CCR is also responsible for the annual Multicultural Festival, the annual Community Recognition Awards Program, and co-sponsors the annual Dia del Niño/Children’s Day event. Government Access Television, which broadcasts under the name Oxnard Citywatch Television (Time Warner Cable Channel 10 & Verizon FiOS Channel 35), is responsible for live coverage of all the City Council meetings, as well as Planning Commission, Parks and Recreation Commission, and Commission on Community Relations. The channel also rebroadcasts the City Council meetings each weekday morning at 10 a.m., including 10 p.m. on the weekends. Citywatch production staff is responsible for gathering and receiving information and creating the bulletin announcement featured on the channel, OxnardNews.org, Facebook and Twitter. An average of 25 new bulletin announcements are created every week for 1,200 bulletin board postings every year. These announcements range from job announcements, meetings, City Council agenda posting, community awareness, recreational events, festivals, City services, and much more. Many of these bulletin announcements are also posted in Spanish. Oxnard Citywatch Television also produces a wide variety of community outreach television and radio spots and public service announcements, in both English and Spanish, and develops original programming. These programs focus on news and information from the entire city, as well as up-to-date listings of arts & cultural events. Spotlight on Oxnard is a weekly half-hour television program covering some of the most compelling people and places right here in our own city. The show gives viewers a taste of Oxnard in an informative and entertaining way, with stories and segments culled from all over the city. The program reports on the latest news and information regarding city business such as Downtown happenings, street maintenance, special events, and community activities, including Oxnard Salsa Festival, Hometown Holiday Parade, The Water Exploratorium, Earth Day, Multicultural Festival, and much more. Citywatch staff videotapes, edits, and airs (on the channel and on the internet) an average of 50 to 60 segments a year, each segment averaging 8 to 10 minutes each. These segments are featured individually on Citywatch television and online, then compiled and aired as part of the weekly Spotlight on Oxnard program. The program airs every Friday at 6 p.m. and 9 p.m., and Saturdays and Sundays at 6 a.m. and 9 a.m. and 6 a.m. and 9 p.m. Production staff also is responsible for the maintenance and technical assistance and engineering of the Council Chambers. Staff prepares and helps to coordinate an average of 5 different meetings a week, for approximately 240 meetings a year. Staff also is asked to provide technical support for various community-related events such as special meetings/presentations, festivals, and more. Oxnard Citywatch Television works closely with the community and City departments to provide technical and multimedia service and assistance with a variety of special presentations and events. Such collaborations include projects with Recreation and Community Services Department, City Corps, Emergency Operations Center, the Police Department, Police Activities League, Oxnard Public Library, Public Works Department, etc. Some of these projects include Public Service Announcements (PSAs) for a wide range of City-related outreach programs. Many of these are created in video and/or audio form, and in English and Spanish. Staff produces an average of 6 different PSAs per month for a total of 288 a year. Oxnard Citywatch Television works closely with the Information Services Division to create the City’s first podcast as well as a multimedia page to include video and audio segments on important city related news and information. Oxnard Citywatch staff also collaborates and provides technical and engineering assistance to video production groups and projects including Oxnard College (O.C.) Advisory Board, Barrio Productions (youth video program in association with the Oxnard Resident Initiatives Program), and Oxnard City Corps.

%Change
City Manager Community Relations/Community Access TV
39
Expenses by Category
Expenses by Fund %Change
Personnel
2009-10Actual
2010-11Budget
2010-11Revised
2011-12Recommended
2012-13Proposed
2009-10Actual
2010-11Budget
2010-11Revised
2011-12Recommended
2012-13Proposed
2009-10Actual
2010-11Budget
2010-11Revised
2011-12Recommend
2012-13Proposed
Salaries and Benefits 182,761 177,399 179,521 179,824 179,8240.17%Other Expenses 36,769 34,624 34,624 19,890 19,890-42.55%Total Expenses 219,530 212,023 214,145 199,714 199,714-6.74%
General Fund 219,530 212,023 214,145 199,714 199,714-6.74%219,530 212,023 214,145 199,714 199,714-6.74%Total All Funds
Administrative Secretary I/II 1.00 1.00 1.00 1.00 1.00Community Outreach & Production Specialist 1.00 1.00 1.00 1.00 1.00
2.00 2.00 2.00 2.00 2.00Total Personnel

City Manager Legislative Affairs
Activities / Functions
40
The City of Oxnard’s Legislative Affairs efforts are centered out of the City Manager’s Office. In October 2007, the City Council adopted a Legislative Program which allowed staff to more efficiently carry out City Council direction with respect to a variety of critical areas of concern to the City, including water resources, transportation needs, and preservation of local control. This Legislative Program was readopted by City Council in March 2011, and positions the City well to respond to potential funding opportunities resulting from the federal “stimulus package.” Although the City Manager’s Office serves as the focal point of these efforts, the legislative program represents broad input from all City departments, from Public Works to the Library. This inclusive effort ensures that the City can respond expeditiously to legislation, or take advantage of a potential funding opportunity. Staff continues to maintain direct and consistent contact with contracted state and federal legislative advocates and monitor the League of California Cities’ Priority Focus, California Water Association, and other sources to identify pending legislation that may impact the City. Pending legislation not addressed by the Legislative Program or staff recommendations that differ from the Legislative Program would be placed on the agenda for City Council consideration.

%Change
City Manager Legislative Affairs
41
Expenses by Category
Expenses by Fund %Change
Personnel
2009-10Actual
2010-11Budget
2010-11Revised
2011-12Recommended
2012-13Proposed
2009-10Actual
2010-11Budget
2010-11Revised
2011-12Recommended
2012-13Proposed
2009-10Actual
2010-11Budget
2010-11Revised
2011-12Recommend
2012-13Proposed
Salaries and Benefits 69,514 69,215 27,579 100,900 100,900265.86%Other Expenses 22,476 189,486 189,486 186,101 186,101-1.79%Total Expenses 91,990 258,701 217,065 287,001 287,00132.22%
General Fund 91,990 90,701 49,065 119,001 119,001142.54%Air Pollution Buydown 0 168,000 168,000 168,000 168,0000.00%
91,990 258,701 217,065 287,001 287,00132.22%Total All Funds
Legislative Affairs Manager 0.50 0.50 0.50 1.00 1.000.50 0.50 0.50 1.00 1.00Total Personnel

City Manager Neighborhood Services
Activities / Functions
42
Neighborhood Services Program maintains and provides support for the Neighborhood Council Program. It assists in carrying out the priorities identified in each of the City’s 47 designated Neighborhood Councils. The Neighborhood Services Program serves as a problem-solving clearinghouse assuring neighborhood concerns are matched with the appropriate City programs and services to best respond to individual neighborhood issues. Neighborhood Services staff annually organizes over 200 off-site neighborhood meetings, produces more than 215,000 flyers, attends neighborhood meetings on a regular basis and assists neighborhood councils with specific problem resolution by coordinating appropriate city services, guest speakers and contacts, while encouraging participation in established neighborhoods, reactivating dormant neighborhood councils and looking to the future for the formation of new councils, as our community grows.
Neighborhood Services annually produces over 8,500 informational packets known as the “Weekly Packet” mailed to the Chairperson of each neighborhood council, City Councilmembers and key City staff involved in neighborhood issues. The packet containsagendas for City Council, Community Development Commission, Housing Authority, Planning Commission, Parks & Recreation Commission, Community Relations Commission, Homelessness Commission and Inter-Neighborhood Council Forum (INCF) meetings, as well as neighborhood meeting and cleanup flyers, and any other items that may be of special interest to our neighborhoods.
Neighborhood Services provides staff support to the Inter-Neighborhood Council Forum (INCF), which consists of members from each active neighborhood council. Staff coordinates monthly televised INCF general membership meetings, speakers, executive board meetings, special events, Community Call-In Program, Candidates Forum and provides training and resources for current and newly elected INCF and Neighborhood Council Officers.
Neighborhood Services has coordinated, and advertised 27 successful Neighborhood Cleanup Events.

%Change
City Manager Neighborhood Services
43
Expenses by Category
Expenses by Fund %Change
Personnel
2009-10Actual
2010-11Budget
2010-11Revised
2011-12Recommended
2012-13Proposed
2009-10Actual
2010-11Budget
2010-11Revised
2011-12Recommended
2012-13Proposed
2009-10Actual
2010-11Budget
2010-11Revised
2011-12Recommend
2012-13Proposed
Salaries and Benefits 208,463 218,945 209,330 221,558 221,5585.84%Other Expenses 79,328 70,645 70,645 45,035 45,035-36.25%Total Expenses 287,791 289,590 279,975 266,593 266,593-4.78%
General Fund 247,963 239,590 229,975 266,593 266,59315.92%CDBG Federal Entitlement 39,828 50,000 50,000 0 0-100.00%
287,791 289,590 279,975 266,593 266,593-4.78%Total All Funds
Administrative Secretary I/II 1.00 1.00 1.00 1.00 1.00Management Analyst III 0.40 0.40 0.40 0.40 0.40Neighborhood Services Coordinator 1.00 1.00 1.00 1.00 1.00
2.40 2.40 2.40 2.40 2.40Total Personnel

City Manager Enterprise Information Systems Management
Activities / Functions
44
The Enterprise Information Systems Management (EISM) program supports software solutions, facilitating the flow of vital information required by both City staff and the public community. Support includes the areas of strategic planning, application designand/or acquisition, application deployment, customization, scheduled maintenance, troubleshooting, periodic upgrades, and ongoing user training.
EISM consistently researches current industry standards and best practices, collaborates with other government agencies and private sector organizations. Strategic planning works to accomplish goals of guaranteeing that City software continues to meet the constantly evolving needs of staff and the public.
Once a need for a new software solution is identified, EISM evaluates the commercially available products to ensure any new software staff implements will accommodate the functionality the user has specified and can be smoothly integrated into existing enterprise-wide systems. If it is determined no suitable software product can be acquired from existing outside sources, then EISM staff can design and build custom applications to meet these needs “in-house.”
The steps to deployment of a new software application frequently include the installation of a database component on one of the database servers maintained by EISM, an application component on a dedicated application server, and a user interface installed on numerous user workstations to access information.
The EISM program also provides customization of applications to accommodate a specific City department need, as well as individual user requirements. As always, this customization includes security management, modification of the user interface, and the ability to create reports.
Disaster Recovery is a key component of EISM. To that end, backup copies of our City of Oxnard computer data are created and shipped to an offsite location daily. In addition, critical data is replicated to an offsite location on a real-time basis, insuring our ability to recover quickly in the event of a disaster. Other maintenance procedures followed include database optimization and the purging of obsolete data.
With the goal of predicting and eliminating potential problems, EISM diligently monitors our system’s performance. These actions prevent significant system downtime or problems which could be experienced by City users. Staff also promptly responds to reports of trouble from end users, correcting those problems in a timely manner.
EISM’s upgrades to City software are implemented on a scheduled or as needed basis, and in an effort to help the City obtain the maximum value from all its software solutions, EISM conducts valuable ongoing training of City staff.
In order to meet the comprehensive and growing needs of all City departments and the public, a number of software solutions are supported. Sungard’s Community Development, Utility Billing, and Financial modules comprise the core of the City’s enterprise information systems. These fully integrated components allow seamless sharing of information throughout the City. This system is supplemented by a variety of other large-scale applications, including Hansen Asset and Work Order Management System and Maximus Fleet Management products used by General Services, and the EMC/Documentum document imaging system used by many City departments. Numerous smaller scale products fill the needs of individual departments and divisions. These include the Chameleon product used by Animal Licensing and CUPA-DMS utilized by the Fire Department’s CUPA Division. Staff also supports the Interactive Voice Response, accessed by the public through the telephone, and Click 2 Gov systems providing e-government services and solutions to residents and businesses via the Internet website www.ci.oxnard.ca.us.
By supporting these software solutions through every phase of their lifecycle, Enterprise Information Systems Management ensures accurate and relevant information is available, in a clearly understandable format, to City staff and the public as they make daily business decisions that allow the City of Oxnard to prosper and grow.

%Change
City Manager Enterprise Information Systems Management
45
Expenses by Category
Expenses by Fund %Change
Personnel
2009-10Actual
2010-11Budget
2010-11Revised
2011-12Recommended
2012-13Proposed
2009-10Actual
2010-11Budget
2010-11Revised
2011-12Recommended
2012-13Proposed
2009-10Actual
2010-11Budget
2010-11Revised
2011-12Recommend
2012-13Proposed
Salaries and Benefits 457,829 445,661 445,661 460,240 460,2403.27%Other Expenses 764,947 857,557 857,557 788,923 788,923-8.00%Total Expenses 1,222,776 1,303,218 1,303,218 1,249,163 1,249,163-4.15%
Information Service 1,222,776 1,303,218 1,303,218 1,249,163 1,249,163-4.15%1,222,776 1,303,218 1,303,218 1,249,163 1,249,163-4.15%Total All Funds
Computer Operator 2.00 2.00 2.00 1.00 1.00Deputy City Manager 0.00 0.00 0.00 0.03 0.03Network Services Coordinator 1.00 1.00 1.00 1.00 1.00Programmer Analyst 1.00 1.00 1.00 1.00 1.00Systems Administrator 1.00 1.00 1.00 1.00 1.00
5.00 5.00 5.00 4.03 4.03Total Personnel

City Manager Geographic Information Systems
Activities / Functions
46
The Geographic Information Systems (GIS) program acquires and manages enterprise GIS data; develops related software solutionsfor data access and analysis; and provides GIS leadership, support and training for the benefit of City departments and the community. The City of Oxnard is a leading city in the County in GIS development known for having a comprehensive GIS database, for creatinga powerful application for accessing the Sungard HTE enterprise data, for being a full service GIS in a full service city, for the use of advanced and innovative GIS technology, for leading in the use of GIS for field applications, for developing the highest quality utilityatlases, for having Intranet map services available for all City personnel, and for providing the public with easy-to-use, Internet viewable maps and downloadable maps. With the acquisition of geo-referenced data, ortho-rectified imagery, LiDAR elevation data and parcel data, GIS is continuously enhancing the valuable GIS database by incorporating new data and improving the quality of existing data. Engineering drawings are also converted to a GIS format for atlas book production and for creating GIS base layers. In-house GIS data is complemented by online data. The City of Oxnard cross checks address and parcel data as part of a rigorous QC procedure. The ability of the City to provide comprehensive GIS data results in cost savings for Master Plans and consultant expenses. Additionally, having access to GIS data has proven value in regards to successful grant applications for the Library, Wastewater and Redevelopment. A core task of the GIS program is continual improvement with the integration of GIS with the Sungard HTE Municipal Management System and other City enterprise databases. In regard to the Sungard HTE system, this entails accessing Asset and Land Management information via GIS. Additionally, GIS began in 2009 to integrate with the Hansen 7 asset management system. GIS also provides a means to access scanned parcel and engineering drawings. General benefits include easier access to the wealth of information in the City’s enterprise databases by creating more accurate asset inventories, which, in turn, save time and cost by having vital information at staff’s fingertips. Intranet/Internet-based and desktop-based tools and methods have greatly improved access to GIS data for City staff and the public. The benefit to City employees include tools that are available for mapping complex data sets, making them much easier to analyze. For example, planners are able to research projects faster and provide better documentation using GIS. Planning’s MAPS GIS toolset was nominated for a local APA (American Planning Association) award. The GIS program has also developed Internet map services, and participates in a regional mapping collaborative in order to make GIS data more accessible to the public. PDF versions of maps are available for viewing and downloading by the public from the Internet. The advantage to this accessibility by the public for fundamental information results in fewer visits and phone calls to City Hall. High quality maps are produced by this program for the use of internal City departments and divisions. These maps are utilized for presentations, exhibits, and serve as working maps. These include utility atlases extensively used by the Public Works Department. GIS also supports other departments by creating electronic versions of maps available for presentations. In 2006 and 2008, the City’s maps were published in ESRI’s (Environmental Systems Research Institute) prestigious Map Book, a publication distributed at the ESRI International Conference which is world's largest gathering of GIS professionals. The GIS program provides many forms of ongoing training and education to City staff. Training is offered in the form of small classes and individual training sessions. An additional educational event is the larger IS Day, where City employees learn how GIS is integrated with Information Systems and about the newest GIS development for the City of Oxnard. As in all technologies, the products and services available from GIS are developing very quickly, and ongoing training and education is paramount to ensure GIS is utilized to the fullest. The benefits of GIS-related cost savings and service improvements cannot be overstated.

%Change
City Manager Geographic Information Systems
47
Expenses by Category
Expenses by Fund %Change
Personnel
2009-10Actual
2010-11Budget
2010-11Revised
2011-12Recommended
2012-13Proposed
2009-10Actual
2010-11Budget
2010-11Revised
2011-12Recommended
2012-13Proposed
2009-10Actual
2010-11Budget
2010-11Revised
2011-12Recommend
2012-13Proposed
Salaries and Benefits 653,237 611,216 611,216 609,433 609,433-0.29%Other Expenses 98,158 115,962 115,962 132,535 132,53514.29%Total Expenses 751,395 727,178 727,178 741,968 741,9682.03%
Information Service 751,395 727,178 727,178 741,968 741,9682.03%751,395 727,178 727,178 741,968 741,9682.03%Total All Funds
Deputy City Manager 0.00 0.00 0.00 0.03 0.03Geographic Information Systems Coordinator 1.00 1.00 1.00 1.00 1.00Geographic Information Systems Technician I/II 3.00 3.00 3.00 3.00 3.00Programmer Analyst 1.00 1.00 1.00 1.00 1.00Systems Analyst I 1.00 1.00 1.00 1.00 1.00
6.00 6.00 6.00 6.03 6.03Total Personnel

City Manager Personal Computer/Network Systems
Activities / Functions
48
The Personal Computer/Network Systems (PC/Net) program of Information Systems is responsible for the planning and operation of City resources allocated for the delivery and support of Personal Computer (PC) networking technology. These responsibilities include acquisition, maintenance, and repair of the network technical infrastructure, i.e., cabling, routers, switches, and 600 PCs/laptops, 50 servers, and their related technology devices. PC/Net creates and maintains network and email accounts for over 500 employees in addition to formulating the technology standards, policies, and procedures, ensuring our effective use of Information Technology. PC/Net is responsible for backing up and restoring data as well as providing network security against outside threats such as spam and viruses. The Information Systems Help Desk continues to provide end-user support in all areas of desktop computing with the goal of improving service delivery with faster response time and problem resolution. Information Systems has implemented remote management of PCs to diagnose and solve problems remotely. Centralize and increase the amount of data storage on the network. Creating a central repository of data storage will eliminate the need to purchase and maintain separate file servers in different locations. It will provide a foundation making it easier to increase our storage capacity in the future. Increase the number of network segments in the campus area. Creating separate virtual local area networks (VLANs) will reduce the amount of broadcast traffic, provide more security, and increase performance to network users on the campus area. Implement projects identified in the 4-year Information Systems Technology Master Plan, approved and adopted by the City Council on March 3, 2009.

%Change
City Manager Personal Computer/Network Systems
49
Expenses by Category
Expenses by Fund %Change
Personnel
2009-10Actual
2010-11Budget
2010-11Revised
2011-12Recommended
2012-13Proposed
2009-10Actual
2010-11Budget
2010-11Revised
2011-12Recommended
2012-13Proposed
2009-10Actual
2010-11Budget
2010-11Revised
2011-12Recommend
2012-13Proposed
Salaries and Benefits 494,750 684,982 684,982 617,823 617,823-9.80%Other Expenses 264,133 349,322 349,322 326,664 326,664-6.49%Total Expenses 758,883 1,034,304 1,034,304 944,487 944,487-8.68%
Information Service 758,883 1,034,304 1,034,304 944,487 944,487-8.68%758,883 1,034,304 1,034,304 944,487 944,487-8.68%Total All Funds
Computer Network Engineer I/II 2.00 2.00 2.00 2.00 2.00Computer Network Engineer III 2.00 2.00 2.00 2.00 2.00Computer Operator 1.00 1.00 1.00 2.00 2.00Deputy City Manager 0.00 0.00 0.00 0.03 0.03Systems Administrator 1.00 1.00 1.00 1.00 1.00Systems Analyst I 1.00 1.00 1.00 1.00 1.00Systems Analyst III 1.00 1.00 1.00 1.00 1.00
8.00 8.00 8.00 9.03 9.03Total Personnel

City Manager Document Publishing Services
Activities / Functions
50
The Document Publishing Services program provides professional document publishing and graphic design services to its internal customers. With a higher quality product and by consistently meeting deadlines, staff is constantly seeking to become the primary service provider of document publishing and graphic design within the City. Services include, but are not limited to: production of reports, memos, letters, labels, mass mailings, forms, job announcements, event calendars, lamination, book binding, scanning of images or text, tape transcription, and automated document folding. Graphic design services include: design and creation of brochures, manuals, flyers, PowerPoint presentations, invitations, signs, posters, banners, and newspaper and magazine advertisements; preparation of graphic files for outside vendors and service bureaus. The hardware resources available to Document Publishing Services include high-speed color and black and white prints/copies, and oversize color printing up to 42 inches wide. Document Publishing Services’ products allow City staff to provide professional-looking information to the public through print medium and the Internet. Document Publishing continues to provide the benchmark for quality customer service assistance in the City by providing day-to-day technical support for Word, Excel and PowerPoint users, and by being available to troubleshoot specific issues. Currently this program supports nearly 3,200 technical support calls each year and it is anticipated to maintain this level through the end of this budget cycle. Staff currently serves approximately 60 departments and divisions. This program proposes to attract new customers by continuing to offer high quality document production services and by expanding our graphic design and production services as requested. Through enhanced marketing tools, it is estimated by the end of the budget cycle, usage of its services by City staff will have increased to approximately 70 departments and divisions. Document Publishing Services provides ongoing telephone directory updates via our Citywide Intranet, and evaluates the need for hard copy updates annually. Information is currently updated approximately 125 times during the year and it is anticipated to maintain this level through the end of this budget cycle. This program optimizes customer service and support by continuing to take advantage of ongoing educational opportunities, affording the ability to stay current with the latest versions of desktop applications, as well as to broaden knowledge base and skill sets.

%Change
City Manager Document Publishing Services
51
Expenses by Category
Expenses by Fund %Change
Personnel
2009-10Actual
2010-11Budget
2010-11Revised
2011-12Recommended
2012-13Proposed
2009-10Actual
2010-11Budget
2010-11Revised
2011-12Recommended
2012-13Proposed
2009-10Actual
2010-11Budget
2010-11Revised
2011-12Recommend
2012-13Proposed
Salaries and Benefits 135,189 85,626 85,626 147,926 147,92672.76%Other Expenses 19,688 23,913 23,913 21,633 21,633-9.53%Total Expenses 154,877 109,539 109,539 169,559 169,55954.79%
Information Service 154,877 109,539 109,539 169,559 169,55954.79%154,877 109,539 109,539 169,559 169,55954.79%Total All Funds
Deputy City Manager 0.00 0.00 0.00 0.03 0.03Word Processor I/II 1.00 1.00 1.00 1.00 1.00Word Processor III 1.00 1.00 1.00 1.00 1.00
2.00 2.00 2.00 2.03 2.03Total Personnel

City Manager Telecommunications
Activities / Functions
52
The Telecommunications program of Information Systems is a clearinghouse for the installation, addition, or deletion of voice and data lines, phone systems and programming, purchasing of cellular phones, voice mail, paging and issues of connectivity Citywide. This program works with all departments as a resource for information regarding the latest telephony, including high bandwidth data connections, Voice over Internet Protocol (VoIP) technology and Call Center strategies. Telecommunications also administers the City of Oxnard external website www.ci.oxnard.ca.us and Citywide intranet “CityNet.” Telecommunications continues to assist departments in planning future needs and improved connectivity, which has resulted in greater savings and efficiencies in providing services. Expertise in aligning department and division visions with project planning and oversight allows for the smooth implementation of goals for enhanced connectivity. The installation of a robust new fiber network to the City’s offsite locations including Del Norte, the Water Division and Corporate Yard has proven to be a great success. This new network is used for our high speed Switched Ethernet Service (SES) and allows for enhanced broadband capabilities at speeds ten times faster than before, giving staff the ability to send increasingly large files efficiently throughout our City Departments. Always looking for ways to expand and increase the speed of our network, we are also exploring the use of high-speed fiber optics into a growing number of our buildings in conjunction with a major Traffic Division project. The installation of the off premise VoIP (Voice over Internet Protocol) based phone system throughout the City is now in place. The VoIP system affords the City the ability to employ automated call routing, call handling, and call center reporting and unified messaging. With the ongoing advancements in technology, Telecommunications has taken steps to ensure we are responsibly encompassing the latest applications and social networking tools into our City of Oxnard website www.ci.oxnard.ca.us. The newly developed, and very successful, Oxnard News section of our website allows residents and visitors to get the latest news regarding events in and around our City. The Recreation Division pages provide video segments, allowing residents and parents to view the Recreation sponsored athleticgames their children participate in, register for classes and read the Recreation Newsletter online. We have also incorporated the social networking tools Facebook and Twitter into the Oxnard News, Neighborhood Services, ongoing Road Construction site and into our Recreation pages, giving residents the ability to become more closely involved and heard. We continue to monitor and investigate all the latest applications which may benefit the residents of Oxnard and incorporate them into our City website. With the need to insure equal access to electronic and information technologies, the City’s website actively participates in ADA Compliancy. Just as environmental obstacles have inhibited individuals with disabilities, the Web poses an entirely new set of obstacles. In recognition of those individuals with visual, physical or developmental disabilities, the City of Oxnard has set goals to make government information accessible to all. Accessibility Standards are integrated into the City of Oxnard website, and will continue to evolve as new technologies and opportunities emerge. We continue with the ongoing updates to our Citywide Intranet which allows staff to access inner City of Oxnard information; from GIS map tools to City Clerk forms to Human Resources information and the Citywide telephone directory. Posting information from all departments and divisions enriches the database of valuable information available to all City staff.

%Change
City Manager Telecommunications
53
Expenses by Category
Expenses by Fund %Change
Personnel
2009-10Actual
2010-11Budget
2010-11Revised
2011-12Recommended
2012-13Proposed
2009-10Actual
2010-11Budget
2010-11Revised
2011-12Recommended
2012-13Proposed
2009-10Actual
2010-11Budget
2010-11Revised
2011-12Recommend
2012-13Proposed
Salaries and Benefits 98,419 97,259 97,259 104,937 104,9377.89%Other Expenses 1,029,389 830,041 830,041 850,939 850,9392.52%Total Expenses 1,127,808 927,300 927,300 955,876 955,8763.08%
Information Service 1,127,808 927,300 927,300 955,876 955,8763.08%1,127,808 927,300 927,300 955,876 955,8763.08%Total All Funds
Deputy City Manager 0.00 0.00 0.00 0.03 0.03Telecommunications Coordinator 1.00 1.00 1.00 1.00 1.00
1.00 1.00 1.00 1.03 1.03Total Personnel

City Manager Facilities Maintenance
Activities / Functions
54
Facilities Maintenance provides safe, functional workspace for City programs; supports the City’s efforts to become more open and inviting to the residents of Oxnard; and preserves the public investment in City facilities. There are two programs in Facilities Maintenance; they are the Custodial Program and the Maintenance Program. The Custodial Program, with a budgeted staff of 16, is responsible for cleaning approximately 147,000 square feet of office space while the Maintenance Program, with a staff of 18, is responsible for maintaining approximately 425,000 square feet of building space, the parking structure, and more than 900 street, walkway, parking lot, and navigation lights located throughout the city. The Custodial Program is responsible for the routine cleaning of offices, restrooms, lobbies, conference rooms, break rooms and other areas used by both City staff and the general public. Their work includes dusting, vacuuming, mopping, sanitizing, emptying trash receptacles, washing interior windows, and restocking of paper products in restrooms and break rooms. In order to minimize the impact on building occupants, the custodial staff works when buildings are closed, or at minimum staffing levels, as much as possible. They do, however, have staff available during the normal business hours for situations in need of immediate attention. The custodial staff’s duties range from cleaning the offices of the Mayor, City Council, and City management to cleaning the holding cells at the Public Safety Building. Due to this wide range of responsibilities, it is critical that our custodial staff not only be highly competent in their cleaning skills but also trustworthy as they have access to sensitive areas throughout City facilities. The Maintenance Program is responsible for the maintenance of City facilities including carpentry, electrical, plumbing, painting and heating, ventilating and air conditioning. The maintenance staff is comprised of specialists in the various maintenance and construction fields as well as several maintenance workers who have developed skills in a wide variety of trades. One of the most important aspects of this program is the preventative maintenance system. By providing scheduled preventative maintenance for building components, the life expectancy of the equipment is lengthened and unscheduled downtime for the equipment is minimized. This not only reduces replacement costs, it also provides a more productive working environment for City staff. In addition to providing routine and preventative maintenance services, this program also tackles the smaller remodeling projects within City buildings. The maintenance staff has the knowledge and expertise to handle virtually any assignment and pride themselves on their workmanship. Both programs within Facilities Maintenance successfully and conscientiously perform the duties assigned. However, a number of the City facilities are outdated and scheduled for rehabilitation making it difficult and often frustrating for both the custodial and maintenance staff to be unable to provide a working environment that we feel our customers deserve. Staff continues to work diligently to find ways to better the working conditions for staff in these areas until funds are made available for these facilities to be remodeled. The division is proud of its accomplishments, its reputation among its customers and its continual search for new and better ways to accomplish its mission.

%Change
City Manager Facilities Maintenance
55
Expenses by Category
Expenses by Fund %Change
Personnel
2009-10Actual
2010-11Budget
2010-11Revised
2011-12Recommended
2012-13Proposed
2009-10Actual
2010-11Budget
2010-11Revised
2011-12Recommended
2012-13Proposed
2009-10Actual
2010-11Budget
2010-11Revised
2011-12Recommend
2012-13Proposed
Salaries and Benefits 2,216,112 2,221,777 2,221,777 2,247,733 2,247,7331.17%Other Expenses 1,565,872 1,618,290 1,628,224 1,330,576 1,330,576-18.28%Total Expenses 3,781,984 3,840,067 3,850,001 3,578,309 3,578,309-7.06%
Facilities Maintenance 3,781,984 3,840,067 3,850,001 3,578,309 3,578,309-7.06%3,781,984 3,840,067 3,850,001 3,578,309 3,578,309-7.06%Total All Funds
Administrative Technician 0.10 0.10 0.10 0.10 0.10Construction Project Coordinator 1.00 1.00 1.00 1.00 1.00Custodial Supervisor 1.00 1.00 1.00 1.00 1.00Custodian 13.00 13.00 13.00 13.00 13.00Facilities Maintenance Supervisor 1.00 1.00 1.00 1.00 1.00Facilities Maintenance Worker I/II 6.00 6.00 6.00 6.00 6.00HVAC Technician 3.00 3.00 3.00 3.00 3.00Maintenance Carpenter 2.00 2.00 2.00 2.00 2.00Maintenance Electrician 2.00 2.00 2.00 2.00 2.00Maintenance Plumber 3.00 3.00 3.00 2.00 2.00Maintenance Services Manager 0.25 0.25 0.25 0.25 0.25Senior Custodian 2.00 2.00 2.00 2.00 2.00Senior Facilities Maintenance Worker 3.00 2.00 2.00 2.00 2.00
37.35 36.35 36.35 35.35 35.35Total Personnel

City Manager Fleet Services
Activities / Functions
56
Fleet Services is responsible for maintenance and management of the City’s 900+ vehicle and equipment fleet, valued at over $31 million. Services provided include preventive maintenance and comprehensive inspection, light and heavy repairs, fuel card management and billing, specification development for new vehicles, disposal of vehicles that have reached their service life, and overall fleet management. This program has 35 permanent employees, and 4 limited benefit employees which operate out of three facilities, with approximately 16,685 square feet of shop space. Fleet Services continues to improve its level of service and efficiency of operations and has received national recognition as one of the 100 Best Fleets in North America. In fact, the program was ranked as the number three best fleet out of the top 100 in the country. Significant factors quoted in the award were its use of technology, level of accountability, and high-trust culture. In the area of technology, Fleet Services recently implemented a wireless network system and use of laptop computers by its technicians. This system increases efficiency as technicians no longer wait in line for access to the maintenance data system and are also able to order parts, perform technical research, and access diagnostic software, all while working on or next to the vehicle that is being serviced. In terms of accountability, key performance measures have been developed and implemented that indicate (in 22 different areas) performance of the maintenance of the City’s fleet. These indicators are deployed to every technician and manager throughout the shop through dashboards on their individual computer systems. Additionally, Fleet Services is in the process of deploying them to its customers throughout the City. The high-trust culture is reflected in several significant ways. In the last year, a new “Pit Crew of the Quarter” team recognition award was introduced to recognize outstanding performance among the different maintenance crews. Additionally, the Shop Improvement Council is very active in supporting social events and morale. Environmentally, Fleet Services has made great strides, receiving recognition from the California State Environmental Protection Agency as a “Model Pollution Prevention Shop.” This award, also known as the “Green Shop” award, recognizes vehicle repair facilities in California that excel in pollution prevention. Fleet Services has the first governmental fleet operation in Ventura County to receive this recognition. To maximize the potential and value of its technicians, the Automotive Service Excellence (ASE) society’s “Blue Seal of Excellence” program is heavily emphasized, hallmarking technician certification. In 2006, the first ASE Blue Seal recognition was gained and is currently in its third year of this national recognition/certification program. Other areas for improvement include a more comprehensive management of the overall fleet to include development of comprehensive Citywide vehicle policies, overall fleet management, and central funding of the fleet for improved lifecycle management.

%Change
City Manager Fleet Services
57
Expenses by Category
Expenses by Fund %Change
Personnel
2009-10Actual
2010-11Budget
2010-11Revised
2011-12Recommended
2012-13Proposed
2009-10Actual
2010-11Budget
2010-11Revised
2011-12Recommended
2012-13Proposed
2009-10Actual
2010-11Budget
2010-11Revised
2011-12Recommend
2012-13Proposed
Salaries and Benefits 3,617,866 3,645,761 3,645,761 3,419,128 3,419,128-6.22%Other Expenses 5,731,175 4,545,818 4,764,313 5,395,580 5,395,58013.25%Total Expenses 9,349,041 8,191,579 8,410,074 8,814,708 8,814,7084.81%
Equipment Maintenance 9,349,041 8,191,579 8,410,074 8,814,708 8,814,7084.81%9,349,041 8,191,579 8,410,074 8,814,708 8,814,7084.81%Total All Funds
Administrative Assistant 1.00 1.00 1.00 1.00 1.00Fleet Services Manager 1.00 1.00 1.00 1.00 1.00Fleet Services Mechanic Supervisor 2.00 2.00 2.00 2.00 2.00Fleet Services Service Manager 1.00 1.00 1.00 1.00 1.00Fleet Services Worker/Mechanic I/II 23.00 23.00 23.00 23.00 23.00Maintenance Services Manager 0.00 0.00 0.00 0.20 0.20Senior Fleet Services Manager 6.00 6.00 6.00 6.00 6.00Tire Repairer 1.00 1.00 1.00 1.00 1.00
35.00 35.00 35.00 35.20 35.20Total Personnel

City Manager Graffiti Action Program
Activities / Functions
58
The mission of the Graffiti Action Program (GAP) is to provide a graffiti-free environment for the residents of Oxnard and to provide friendly, efficient, timely, and cost-effective customer service at all times. Graffiti vandalism threatens the beauty of our city. The most effective solution to this threat has been a timely response by the GAP. Each new residential and business development provides new opportunities for graffiti vandalism. GAP has met these challenges by adjusting the route schedules and by increasing efficiency. GAP is a key part of the City of Oxnard’s Graffiti Task Force and public awareness and participation have become a big part of the GAP program goals and objectives. Through neighborhood meetings, GAP has increased the public understanding of the techniques and capabilities to remove graffiti. Employee training has included public relations and its importance to the City and to GAP. GAP has contributed to a city that is noticeably more attractive to businesses and residents. Residents may expect a response within 48 hours of the report of a graffiti incident. Residents and businesses may remove graffiti themselves with a free Graffiti Action Kit (GAK) designed to empower individuals to eradicate small amounts of graffiti vandalism within their own neighborhoods. Today, more options exist to deal with the unsightly and offensive problem of illegal graffiti. The GAP will continue to use the latest state of the art technology to keep the city clean and its future bright.

%Change
City Manager Graffiti Action Program
59
Expenses by Category
Expenses by Fund %Change
Personnel
2009-10Actual
2010-11Budget
2010-11Revised
2011-12Recommended
2012-13Proposed
2009-10Actual
2010-11Budget
2010-11Revised
2011-12Recommended
2012-13Proposed
2009-10Actual
2010-11Budget
2010-11Revised
2011-12Recommend
2012-13Proposed
Salaries and Benefits 547,094 523,601 498,575 591,172 591,17218.57%Other Expenses 269,826 261,925 271,925 249,702 249,702-8.17%Total Expenses 816,920 785,526 770,500 840,874 840,8749.13%
General Fund 816,920 785,526 770,500 840,874 840,8749.13%816,920 785,526 770,500 840,874 840,8749.13%Total All Funds
Graffiti Action Coordinator 1.00 1.00 1.00 1.00 1.00Management Analyst III 0.00 0.00 0.00 0.30 0.30Office Assistant I/II 1.00 1.00 1.00 1.00 1.00Park Maintenance Supervisor 0.00 0.00 0.00 0.30 0.30
2.00 2.00 2.00 2.60 2.60Total Personnel

City Manager Parks and Facilities Development
Activities / Functions
60
The mission of Parks and Facilities Development is to provide all other City departments and divisions with a superior level of service through assistance with construction project development. This includes master planning, design development, bid process, construction project oversight, and management. The project engineering, architecture, and administrative functions are all interrelated and complex processes which directly affect the outcome of City projects. Employees in Parks and Facilities Development provide the oversight and coordination of these important project processes which results in the most efficient construction projects possible. Parks and Facilities Development is dedicated to ensuring quality City projects which contribute to an enhanced quality of life for the residents of Oxnard. There are five team members that pride themselves in providing the highest level of customer service.

%Change
City Manager Parks and Facilities Development
61
Expenses by Category
Expenses by Fund %Change
Personnel
2009-10Actual
2010-11Budget
2010-11Revised
2011-12Recommended
2012-13Proposed
2009-10Actual
2010-11Budget
2010-11Revised
2011-12Recommended
2012-13Proposed
2009-10Actual
2010-11Budget
2010-11Revised
2011-12Recommend
2012-13Proposed
Salaries and Benefits 285,093 205,571 205,571 207,856 207,8561.11%Other Expenses 32,931 25,077 25,077 29,889 29,88919.19%Total Expenses 318,024 230,648 230,648 237,745 237,7453.08%
General Fund 318,024 230,648 230,648 237,745 237,7453.08%318,024 230,648 230,648 237,745 237,7453.08%Total All Funds
Construction Project Coordinator 1.00 1.00 1.00 1.00 1.00Landscape Architect 2.00 2.00 2.00 0.00 0.00Project Manager 1.00 1.00 1.00 1.00 1.00
4.00 4.00 4.00 2.00 2.00Total Personnel

City Manager Parks and Public Grounds
Activities / Functions
62
The mission of Parks and Public Grounds is to enhance the quality of life to the residents of Oxnard by managing park systems and public grounds in a manner that provides our customers with safe, clean, and attractive outdoor open space. Parks and Public Grounds currently maintains 443 acres of landscaping. This includes general fund parks, beaches, all Central Business District landscaping and City-maintained County-owned areas at the Oxnard Harbor. Each area offers a host of amenities for our residents to enjoy. There are 30 ball diamonds, a mixture of 19 full and half basketball courts, 32 playgrounds, and 6 soccer fields, as well as other recreational opportunities such as horseshoe pits, picnic pavilions, jogging tracks and exercise stations. The Park staffing consists of 10.5 permanent staff and 54 limited benefited employees. Some of the duties performed include mowing and edging, weed and gopher abatement, irrigation repair, tree and shrub trimming, installation of plant material, litter abatement, fertilization, restroom maintenance, playground structure inspection and repair, and minor building repairs. This fiscal year, an additional 11 acres of new parkland will be acquired bringing the total maintained to 454 acres. Parks and Public Grounds is committed to providing the highest quality of outdoor recreational space to our residents through the maintenance of its neighborhood parks, fields and open spaces. These parks and fields are the heart of our neighborhoods and provide a sense of community. The City’s parklands enhance its safe, clean and attractive neighborhoods for all residents to enjoy.

%Change
City Manager Parks and Public Grounds
63
Expenses by Category
Expenses by Fund %Change
Personnel
2009-10Actual
2010-11Budget
2010-11Revised
2011-12Recommended
2012-13Proposed
2009-10Actual
2010-11Budget
2010-11Revised
2011-12Recommended
2012-13Proposed
2009-10Actual
2010-11Budget
2010-11Revised
2011-12Recommend
2012-13Proposed
Salaries and Benefits 2,421,792 2,319,097 2,279,123 2,467,572 2,467,5728.27%Other Expenses 2,337,347 2,318,907 2,406,247 2,163,024 2,163,024-10.11%Total Expenses 4,759,139 4,638,004 4,685,370 4,630,596 4,630,596-1.17%
General Fund 4,667,529 4,638,004 4,600,370 4,630,596 4,630,5960.66%2009 Lease Purchase Equipment 91,610 0 85,000 0 0-100.00%
4,759,139 4,638,004 4,685,370 4,630,596 4,630,596-1.17%Total All Funds
Administrative Secretary I/II 1.00 1.00 1.00 1.00 1.00Administrative Technician 0.70 0.70 0.70 0.70 0.70Groundsworker I/II 12.00 12.00 12.00 10.00 10.00Maintenance Services Manager 0.45 0.45 0.45 0.25 0.25Management Analyst III 0.00 0.00 0.00 0.20 0.20Office Assistant I/II 1.00 1.00 1.00 1.00 1.00Parks Maintenance Supervisor 1.00 1.00 1.00 1.00 1.00Parks Manager 1.00 1.00 1.00 1.00 1.00Senior Groundsworker 3.00 3.00 3.00 2.00 2.00Senior Tree Trimmer 1.00 1.00 1.00 0.00 0.00
21.15 21.15 21.15 17.15 17.15Total Personnel

City Manager River Ridge Golf Course
Activities / Functions
64
The River Ridge Golf Club mission is to provide the residents of Oxnard with an exceptional recreational facility offering country club quality at publicly affordable prices. The River Ridge Golf Club features two 18-hole championship golf courses, complete practice facilities including an all-grass driving range, two practice putting greens and two practice chipping greens. The original Vineyard Course is known for its spacious open fairways and perhaps the best poa annua greens in the county. The newer Victoria Lakes Course is a more strategic golf course with risk-reward options on every hole. With four sets of tees, both courses offer a wonderful challenge to golfers at every level and have spectacular panoramic views of the Pacific Ocean, Channel Islands, Oxnard Plain, and the surrounding Topa Topa mountain range. The golf course is open 365 days a year from daybreak until sunset, and the lighted driving range remains open each night. Last year, River Ridge served just under 80,000 golfers. Five PGA golf professionals offer lessons daily and the driving range and other practice facilities are open to the public every day of the year. The pro shop offers a wide variety of golf equipment and clothing and rents a fleet of 144 electric golf carts. The pro staff also provides year-round junior programs for children starting at age 5 and up through high school. River Ridge supports the four Oxnard High School golf teams, girls in the fall and boys in the spring. The course also hosts the Annual Strawberry Classic and the Oxnard City Championship. Both courses cover 384 acres of land, including the Santa Clara and Coastal Landfills, and 16 acres of water. They are maintained and operated by 36 full-time and 74 part-time employees, not including the volunteer marshals. Last year, the golf operation generated just under $4 million in revenue and is projecting $4.2 for FY 2011-2012. River Ridge was voted as the best golf course in the county in the Ventura County Star’s reader’s poll five out of the last six years. In addition to the golf course, River Ridge has a full catering and food and beverage operation that serves both the golfers and the community with wedding and banquet facilities. The banquet room seats up to 180 people and the wedding facility has the 18th green as a backdrop. The café is open for breakfast and lunch each day, primarily serving golfers, but also receiving walk-in guests. On weekends, the food and beverage department operates the on-course snack bar at Victoria Lakes, the outdoor barbecue facility and beverage carts on both courses. The catering department also rents meeting rooms in the clubhouse and had 135 meetings last year.

%Change
City Manager River Ridge Golf Course
65
Expenses by Category
Expenses by Fund %Change
Personnel
2009-10Actual
2010-11Budget
2010-11Revised
2011-12Recommended
2012-13Proposed
2009-10Actual
2010-11Budget
2010-11Revised
2011-12Recommended
2012-13Proposed
2009-10Actual
2010-11Budget
2010-11Revised
2011-12Recommend
2012-13Proposed
Salaries and Benefits 47,042 46,804 46,804 65,880 65,88040.76%Other Expenses 25,276,912 4,732,949 4,784,749 5,120,446 5,130,5687.02%Total Expenses 25,323,954 4,779,753 4,831,553 5,186,326 5,196,4487.34%
Golf Course 5,353,823 4,779,753 4,831,553 5,186,326 5,196,4487.34%Debt Service 19,970,131 0 0 0 0
25,323,954 4,779,753 4,831,553 5,186,326 5,196,4487.34%Total All Funds
Maintenance Services Manager 0.25 0.25 0.25 0.25 0.25Management Analyst III 0.00 0.00 0.00 0.15 0.15
0.25 0.25 0.25 0.40 0.40Total Personnel

City Manager Street Landscaping
Activities / Functions
66
The mission of Street Landscaping Districts is to provide the highest quality landscaping services at competitive prices in the open spaces within the City’s 59 landscape maintenance districts. These areas within the City’s neighborhoods provide for an aesthetically pleasing entrance to neighborhoods, enhance the beauty of the City with tree-lined streets and provide open space for residents to enjoy. In addition, there are five parks and two tot lot play structures within the landscape maintenance districts that are maintained by the districts. In the face of increasing costs to the City in all areas of operation, Landscape Maintenance Districts are no exception. The funding for the Landscape Maintenance Districts is provided by those who benefit from its existence and gives the City the means to maintain an environment, which adds beauty and can be appreciated by all its residents. Once a district is established, the maintenance begins with turf maintenance and tree trimming. The work continues with ongoing replacement and upgrading of irrigation and plant material. Crews are trained in specific areas where special needs exist. Of the 59 districts, the first 27 are maintained by in-house maintenance crews and the remaining districts are maintained under contract. Training has also focused on small equipment use, maintenance and care, as well as seeking to extend the life of our most used machinery. District personnel continually maximize the limited resources through training and cost effective planning. The dramatic effect of public landscaping can be seen with, lush parkways that parallel tree lined sidewalks throughout the city. With over 59 districts formed, it is apparent that Landscape Maintenance Districts are a viable and valuable component of our City’s landscape and open space future.

%Change
City Manager Street Landscaping
67
Expenses by Category
Expenses by Fund %Change
Personnel
2009-10Actual
2010-11Budget
2010-11Revised
2011-12Recommended
2012-13Proposed
2009-10Actual
2010-11Budget
2010-11Revised
2011-12Recommended
2012-13Proposed
2009-10Actual
2010-11Budget
2010-11Revised
2011-12Recommend
2012-13Proposed
Salaries and Benefits 714,885 776,260 776,260 663,408 663,408-14.54%Other Expenses 285,965 297,158 297,158 284,961 284,961-4.10%Total Expenses 1,000,850 1,073,418 1,073,418 948,369 948,369-11.65%
General Fund 1,000,850 1,073,418 1,073,418 948,369 948,369-11.65%1,000,850 1,073,418 1,073,418 948,369 948,369-11.65%Total All Funds
Administrative Technician 0.20 0.20 0.20 0.20 0.20Groundsworker I/II 0.00 0.00 0.00 3.00 3.00Maintenance Plumber 0.00 0.00 0.00 1.00 1.00Maintenance Services Manager 0.05 0.05 0.05 0.05 0.05Management Analyst I/II 1.00 1.00 1.00 0.00 0.00Management Analyst III 0.00 0.00 0.00 0.35 0.35Parks Maintenance Supervisor 2.00 2.00 2.00 1.70 1.70Senior Facilities Maintenance Worker 0.00 0.00 0.00 1.00 1.00Senior Groundsworker 2.00 2.00 2.00 3.00 3.00Senior Tree Trimmer 0.00 0.00 0.00 1.00 1.00
5.25 5.25 5.25 11.30 11.30Total Personnel

City Manager Street Lighting
Activities / Functions
68
The mission of the Street Lighting Program is to provide ample lighting to promote public safety at the least possible cost. The Street Lighting Program is responsible for overseeing roughly 10,000 Southern California Edison (SCE) owned and maintained street, alley, parking lot and walkway lights located throughout the city as well as maintaining over 900 City-owned street, parking lot, walkway and navigation lights. This is accomplished with oversight and maintenance services provided by the Facilities Maintenance Division. Divisions within the City that have responsibility for other street lights throughout the City are the Landscape Maintenance Districts Program, Community Facilities Districts Program and the Traffic Signal Maintenance and Repair Program. The Street Lighting Program participates in the California Street Lighting Association (Cal-SLA) and staff currently serves as the Executive Committee Chairman. Cal-SLA is a statewide organization of cities and counties throughout the state of California that addresses issues related to street lighting. In addition to providing resources and education regarding the latest technology in the industry, Cal-SLA, with the aid of its contract attorney and economist, lobby the California Public Utilities Commission (CPUC) on matters brought before it by the three Investor-Owned Utilities (IOUs). Cal-SLA has direct participation in the rate cases that set utility rates for the IOUs and works to ensure that the needs of cities and counties are voiced when rate increases are proposed. The Street Lighting Program also acts as a liaison between the general public and SCE to resolve issues related to the SCE-owned lighting within the city. The program works to keep the City-owned and maintained lighting functional and efficient through retrofitting existing lighting with energy-efficient alternatives.

%Change
City Manager Street Lighting
69
Expenses by Category
Expenses by Fund %Change
Personnel
2009-10Actual
2010-11Budget
2010-11Revised
2011-12Recommended
2012-13Proposed
2009-10Actual
2010-11Budget
2010-11Revised
2011-12Recommended
2012-13Proposed
2009-10Actual
2010-11Budget
2010-11Revised
2011-12Recommend
2012-13Proposed
Salaries and Benefits 0 0 0 0 0Other Expenses 1,424,359 1,125,786 1,127,786 1,368,483 1,368,48321.34%Total Expenses 1,424,359 1,125,786 1,127,786 1,368,483 1,368,48321.34%
General Fund 1,424,359 1,125,786 1,127,786 1,368,483 1,368,48321.34%1,424,359 1,125,786 1,127,786 1,368,483 1,368,48321.34%Total All Funds
No full-time equivalent positions budgeted 0.00 0.00 0.00 0.00 0.000.00 0.00 0.00 0.00 0.00Total Personnel

City Manager Street Trees and Medians
Activities / Functions
70
The mission of the Street Trees and Median Program is to provide the City with a superior level of maintenance of the trees, medians and landscape rights-of-way throughout the City, thus increasing the quality of life for the residents of the City of Oxnard, and to provide the highest level of customer service. The tree crew currently has four teams of two persons each (three permanent and six limited benefited) that maintain our Urban Forest comprising 26,000 trees. These individuals perform highly skilled tree pruning, tree removals, tree planting, inspection of trees, and applications of fungicide and pesticides. In the past twelve months, crews have trimmed more than 700 trees, planted 260 trees, removed 45 trees, and treated more than 359 trees for insects or fungus. The Tree Crew also works hand in hand with the Street Division to resolve issues regarding hardscape damage created by trees. The median crew currently has 12 employees (three permanent and nine limited benefited) that maintain 77 acres of rights-of-way, 40 acres of medians and 37 acres of being rights-of-way. The median employees are divided into special crews. Two employees form the irrigation crew, two more employees form the chemical spray crew, and there are two crews of four people to perform weed abatement, installation of irrigation, plant installation, and eradication of pests or fungus in our city’s landscaped areas. In the past 12 months, staff has upgraded the irrigation systems and plant material in thirteen areas. Out of 77 acres, 8.5 have been added in the past five years. In addition, tree and median crews are available to respond to downed trees and damage issues caused by weather and accidents through the city streets and medians. Beautifully landscaped medians and tree lined streets provide visual enhancements throughout the City. These valuable assets make the City and its neighborhoods more attractive to businesses and to it residents. The Street Treesand Medians Program continues to provide quality service throughout the City while maximizing limited resources

%Change
City Manager Street Trees and Medians
71
Expenses by Category
Expenses by Fund %Change
Personnel
2009-10Actual
2010-11Budget
2010-11Revised
2011-12Recommended
2012-13Proposed
2009-10Actual
2010-11Budget
2010-11Revised
2011-12Recommended
2012-13Proposed
2009-10Actual
2010-11Budget
2010-11Revised
2011-12Recommend
2012-13Proposed
Salaries and Benefits 955,474 1,073,088 1,012,577 1,058,152 1,058,1524.50%Other Expenses 480,704 579,827 585,427 547,576 547,576-6.47%Total Expenses 1,436,178 1,652,915 1,598,004 1,605,728 1,605,7280.48%
General Fund 1,436,178 1,652,915 1,598,004 1,605,728 1,605,7280.48%1,436,178 1,652,915 1,598,004 1,605,728 1,605,7280.48%Total All Funds
Groundsworker I/II 3.00 3.00 3.00 3.00 3.00Parks Maintenance Supervisor 1.00 1.00 1.00 1.00 1.00Senior Groundsworker 1.00 1.00 1.00 1.00 1.00Senior Tree Trimmer 1.00 1.00 1.00 1.00 1.00Tree Trimmer I/II 3.00 3.00 3.00 3.00 3.00
9.00 9.00 9.00 9.00 9.00Total Personnel


City Treasurer


%Change
Expenses by Category
City Treasurer Department Summary
73
%Change
%Change
Expenses by Fund
Expenses by Program 2009-10Actual
2010-11Budget
2010-11Revised
2011-12Recommended
2012-13Proposed
2009-10Actual
2010-11Budget
2010-11Revised
2011-12Recommended
2012-13Proposed
2009-10Actual
2010-11Budget
2010-11Revised
2011-12Recommended
2012-13Proposed
Salaries and Benefits 1,497,784 1,523,375 1,456,118 1,344,276 1,344,276-7.68%Other Expenses 1,093,750 1,098,027 1,099,227 1,298,981 1,298,98118.17%Total Expenses 2,591,534 2,621,402 2,555,345 2,643,257 2,643,2573.44%
General Fund 1,151,852 1,170,674 1,104,617 1,167,167 1,167,1675.66%Customers' Billing 1,439,682 1,450,728 1,450,728 1,476,090 1,476,0901.75%
2,591,534 2,621,402 2,555,345 2,643,257 2,643,2573.44%Total All Funds
City Treasurer 640,277 645,694 642,133 643,382 643,3820.19%Utility Customer/Licensing Services
1,951,257 1,975,708 1,913,212 1,999,875 1,999,8754.53%
2,591,534 2,621,402 2,555,345 2,643,257 2,643,2573.44%Total All Programs

City Treasurer City Treasurer
Activities / Functions
74
The City Treasurer is responsible for acceptance of all revenues due to the City and assuring safekeeping, availability, timely deposit, and investment of funds.
Acceptance of revenue:
• Centralized collection of all revenues takes place in the City Treasurer’s Department. Payments received include utility bills, business and animal licenses, permits, and all other funds due to the City.
• Counter staff interact personally with customers, including businesses, developers, and staff from other City divisions and departments. Utility payments account for the largest percentage of those transactions.
• Payment methods include cash and check in person and by mail. Credit cards are accepted for utility bills and licenses. Extended-hour phone and online payments may be made by check and credit card for utility payments; these new services are utilized by an average of more than 8,000 customers per month and usage is increasing.
Deposit of funds:
• Timeliness and accuracy are assured by daily reconciliation and deposit of all funds.
Safekeeping, Availability, and Investment:
• Early morning bank reconciliation on all business days, including closed Fridays, allows the City Treasurer to monitor cash flow needs and determine funds available for investment.
Training and cross-training of staff is essential to effective operations and excellent customer service.
Department Training:
• An average of at least 10 days per year per staff member is necessary.
City-Wide Training:
• Cash Handling Certification classes have been established to provide information and techniques to all employees receiving funds on behalf of the City. Classes will be ongoing to help ensure the security of public funds.
The City Treasurer has responsibility for ongoing review of legislation, technology, and methods of operation to ensure compliance and effectiveness of operations, banking relationships, and investment policy. Active participation with the California Municipal Treasurers’ Association (CMTA), its education workshops and interaction with other organizations are key to this accomplishment. Excellent customer service is the primary goal of the City Treasurer’s Department. This is accomplished on a daily basis through the dedication of very friendly, effective, and knowledgeable staff.

%Change
City Treasurer City Treasurer
75
Expenses by Category
Expenses by Fund %Change
Personnel
2009-10Actual
2010-11Budget
2010-11Revised
2011-12Recommended
2012-13Proposed
2009-10Actual
2010-11Budget
2010-11Revised
2011-12Recommended
2012-13Proposed
2009-10Actual
2010-11Budget
2010-11Revised
2011-12Recommend
2012-13Proposed
Salaries and Benefits 552,935 543,205 532,444 461,484 461,484-13.33%Other Expenses 87,342 102,489 109,689 181,898 181,89865.83%Total Expenses 640,277 645,694 642,133 643,382 643,3820.19%
General Fund 640,277 645,694 642,133 643,382 643,3820.19%640,277 645,694 642,133 643,382 643,3820.19%Total All Funds
Account Clerk I/II 2.75 2.75 2.75 2.75 2.75Account Clerk III 2.00 2.00 1.00 1.00 1.00Administrative Assistant 1.00 1.00 1.00 1.00 1.00City Treasurer 1.00 1.00 1.00 1.00 1.00Revenue Collection Technician 0.00 0.00 1.00 1.00 1.00
6.75 6.75 6.75 6.75 6.75Total Personnel

City Treasurer Utility Customer/Licensing Services
Activities / Functions
76
Utility Customer Services
• Maintain water, wastewater and refuse accounts • Prepare, audit and mail monthly billing statements • Prepare, audit and mail daily delinquency notifications and final notices • Receive and respond to customer inquiries over the phone, in person and online regarding utility accounts • Research and send delinquent accounts to collection on a monthly basis • Provide statistical reports and utility-related information to various departments and outside agencies
Licensing Services
• Implement the business tax requirements for new and existing businesses in the City. • Process new applications and issue tax certificates, renewals, delinquency letters and notices of violation to businesses in the
City. • Issue permits each year to dance, taxicab operators, taxicab drivers, vendors, massage parlors, massage technicians, adult
businesses, secondhand dealers, pawn brokers and concealable weapons sellers. • Coordinate with Animal Safety Division in the issuance of animal licenses, citations and collection of fees from known pet
owners within the City. • Provide support staff in processing payments for Wastewater Permits.

%Change
City Treasurer Utility Customer/Licensing Services
77
Expenses by Category
Expenses by Fund %Change
Personnel
2009-10Actual
2010-11Budget
2010-11Revised
2011-12Recommended
2012-13Proposed
2009-10Actual
2010-11Budget
2010-11Revised
2011-12Recommended
2012-13Proposed
2009-10Actual
2010-11Budget
2010-11Revised
2011-12Recommend
2012-13Proposed
Salaries and Benefits 944,849 980,170 923,674 882,792 882,792-4.43%Other Expenses 1,006,408 995,538 989,538 1,117,083 1,117,08312.89%Total Expenses 1,951,257 1,975,708 1,913,212 1,999,875 1,999,8754.53%
General Fund 511,575 524,980 462,484 523,785 523,78513.25%Customers' Billing 1,439,682 1,450,728 1,450,728 1,476,090 1,476,0901.75%
1,951,257 1,975,708 1,913,212 1,999,875 1,999,8754.53%Total All Funds
Assistant City Treasurer/Rev Accounting Mgr 1.00 1.00 1.00 1.00 1.00Code Compliance Inspector/Park Ranger I/II 1.00 1.00 1.00 1.00 1.00Customer Service Accounting Technician 2.00 2.00 2.00 2.00 2.00Customer Service Representative I/II 7.00 7.00 7.00 7.00 7.00Senior Customer Service Representative 1.00 1.00 1.00 1.00 1.00Treasury Supervisor 1.00 1.00 1.00 1.00 1.00
13.00 13.00 13.00 13.00 13.00Total Personnel


Community Development


%Change
Expenses by Category
Community Development Department Summary
79
%Change
%Change
Expenses by Fund
Expenses by Program 2009-10Actual
2010-11Budget
2010-11Revised
2011-12Recommended
2012-13Proposed
2009-10Actual
2010-11Budget
2010-11Revised
2011-12Recommended
2012-13Proposed
2009-10Actual
2010-11Budget
2010-11Revised
2011-12Recommended
2012-13Proposed
Salaries and Benefits 1,470,521 1,691,703 1,691,703 1,622,938 1,622,938-4.06%Other Expenses 20,292,111 11,219,347 20,774,970 14,972,479 15,533,925-27.93%Total Expenses 21,762,632 12,911,050 22,466,673 16,595,417 17,156,863-26.13%
General Fund 1,361,382 1,335,014 1,065,014 1,321,665 1,321,66524.10%CDBG Federal Entitlement 75,000 75,000 75,000 50,000 50,000-33.33%Central Bus. Dist. - CCRP 3,006,259 3,219,701 3,314,701 3,217,188 3,217,188-2.94%Central Bus. Dist. - Downtown 1,028,462 824,815 829,815 822,246 822,246-0.91%Southwinds 885,481 975,422 1,015,422 975,869 975,869-3.90%Ormond Beach 685,303 805,298 905,298 803,267 803,267-11.27%H.E.R.O. 9,999,436 2,492,511 4,925,576 5,385,881 5,791,9459.35%Housing Set-Aside 2,902,242 1,103,694 8,256,252 1,961,008 2,116,390-76.25%CDC Admin 1,819,067 2,079,595 2,079,595 2,058,293 2,058,293-1.02%
21,762,632 12,911,050 22,466,673 16,595,417 17,156,863-26.13%Total All Funds
Central Business District 4,034,721 4,044,516 4,144,516 4,039,434 4,039,434-2.54%Southwinds 885,481 975,422 1,015,422 975,869 975,869-3.90%Ormond Beach 685,303 805,298 905,298 803,267 803,267-11.27%HERO Project Area 9,999,436 2,492,511 4,925,576 5,385,881 5,791,9459.35%Special Projects/CDC Operations 2,315,501 2,549,661 2,279,661 2,515,010 2,515,01010.32%Economic Development 227,588 227,588 227,588 202,588 202,588-10.98%Convention and Visitors Bureau 712,360 712,360 712,360 712,360 712,3600.00%20% Set Aside Housing Fund 2,902,242 1,103,694 8,256,252 1,961,008 2,116,390-76.25%
21,762,632 12,911,050 22,466,673 16,595,417 17,156,863-26.13%Total All Programs

Community Development Central Business District
Activities / Functions
80
Functions
This program is responsible for the implementation of the Community Development Commission’s (“CDC”) redevelopment and affordable housing activities within the Downtown/Central City Revitalization Project (CCRP) area. The function of the Downtown/CCRP is to foster economic revitalization of the Downtown area by improving the infrastructure, promoting the existing retail and restaurant industries, enticing private investment in new commercial and housing development, managing and expanding parking facilities, and sustaining a state-of-the-art movie theater in the Downtown.
Activities Recent and ongoing activities include:
• Downtown street and sidewalk improvements • Meta Street infrastructure improvements • Downtown lighting and parking lot/alley revitalization • Park enhancements, such as walkways and landscaping • Downtown Façade and Paint Improvement Program to assist Downtown businesses in enhancing the exteriors of their
buildings, including: improved signage, painting, lighting, landscaping, awnings, and other building treatments • Affordable Housing Development
- HOME Corp. consisting of 24 affordable townhomes in the Meta District, estimated to be completed in 2011 Monitor housing deed restriction requirements for State & legal compliance
Administrative Duties:
• Monitor Disposition and Development Agreements for compliance • Parking structure maintenance fee collection • Oversight of Heritage Square programs, facility rentals, and property maintenance • Support of PBID (Property-based Business Improvement District) in its management efforts

%Change
Community Development Central Business District
81
Expenses by Category
Expenses by Fund %Change
Personnel
2009-10Actual
2010-11Budget
2010-11Revised
2011-12Recommended
2012-13Proposed
2009-10Actual
2010-11Budget
2010-11Revised
2011-12Recommended
2012-13Proposed
2009-10Actual
2010-11Budget
2010-11Revised
2011-12Recommend
2012-13Proposed
Salaries and Benefits 0 0 0 0 0Other Expenses 4,034,721 4,044,516 4,144,516 4,039,434 4,039,434-2.54%Total Expenses 4,034,721 4,044,516 4,144,516 4,039,434 4,039,434-2.54%
Central Bus. Dist. - CCRP 3,006,259 3,219,701 3,314,701 3,217,188 3,217,188-2.94%Central Bus. Dist. - Downtown 1,028,462 824,815 829,815 822,246 822,246-0.91%
4,034,721 4,044,516 4,144,516 4,039,434 4,039,434-2.54%Total All Funds
No full-time equivalent positions budgeted 0.00 0.00 0.00 0.00 0.000.00 0.00 0.00 0.00 0.00Total Personnel

Community Development Southwinds
Activities / Functions
82
Functions This program is responsible for the implementation of the Community Development Commission’s (“CDC”) redevelopment and housing activities within the Southwinds Project Area. The function of the Southwinds Project Area is to enhance the area by developing vacant and/or underutilized parcels, and to promote the rehabilitation of aging housing and commercial facilities.
Activities Recent and ongoing activities include:
• Street Reconstruction - Street, alleyways, curb and gutter repairs, lighted crosswalks for Haycox School, an ornamental security fence for
Haycox School, improvements to the Southwinds Park and new gateway street name signs • Residential Security Lighting and Fencing
- Installation of security lighting and security fencing in the Southwinds neighborhood
Administrative Duties:
• Ongoing monitoring of 1984 Southwinds Settlement Agreement. • Oversight of First Time Home Buyers and Affordable Rehabilitation Programs

%Change
Community Development Southwinds
83
Expenses by Category
Expenses by Fund %Change
Personnel
2009-10Actual
2010-11Budget
2010-11Revised
2011-12Recommended
2012-13Proposed
2009-10Actual
2010-11Budget
2010-11Revised
2011-12Recommended
2012-13Proposed
2009-10Actual
2010-11Budget
2010-11Revised
2011-12Recommend
2012-13Proposed
Salaries and Benefits 0 0 0 0 0Other Expenses 885,481 975,422 1,015,422 975,869 975,869-3.90%Total Expenses 885,481 975,422 1,015,422 975,869 975,869-3.90%
Southwinds 885,481 975,422 1,015,422 975,869 975,869-3.90%885,481 975,422 1,015,422 975,869 975,869-3.90%Total All Funds
No full-time equivalent positions budgeted 0.00 0.00 0.00 0.00 0.000.00 0.00 0.00 0.00 0.00Total Personnel

Community Development Ormond Beach
Activities / Functions
84
Functions This program is responsible for the implementation of the Community Development Commission’s (“CDC”) redevelopment and housing activities within the Ormond Beach Project Area. The primary function of the Ormond Beach Project Area is to retain and attract commercial and industrial development, improve and repair streets and public utilities, and to preserve the wetlands and the natural habitat exclusive to the area.
Activities
• Street Reconstruction - Reconstruction of streets, curbs, and gutters along Hueneme Road
• Wetlands Restoration
- Work to protect, restore, and enhance the wetlands and other coastal resources in Ormond Beach
• Industrial Property Preservation - Assist property owners in redeveloping and revitalizing aging industrial properties within the Ormond Beach Project
Area Administrative Duties:
• Ongoing monitoring of the Ormond Beach Pass-Through Agreement between the CDC, County of Ventura, and the Oxnard Union High School District for compliance
• Facilitation and oversight of contract with the Economic Development Corporation of Oxnard (EDCO) • Provide direct support for stimulation of job growth and capital investments in Ormond Beach and partner with EDCO in
their efforts to retain and attract commercial and industrial industries • Track all proposed remediation plans of the current property owner of the former Halaco site and work in cooperation with
the U.S. Environmental Protection Agency (“EPA”) for site reuse

%Change
Community Development Ormond Beach
85
Expenses by Category
Expenses by Fund %Change
Personnel
2009-10Actual
2010-11Budget
2010-11Revised
2011-12Recommended
2012-13Proposed
2009-10Actual
2010-11Budget
2010-11Revised
2011-12Recommended
2012-13Proposed
2009-10Actual
2010-11Budget
2010-11Revised
2011-12Recommend
2012-13Proposed
Salaries and Benefits 0 0 0 0 0Other Expenses 685,303 805,298 905,298 803,267 803,267-11.27%Total Expenses 685,303 805,298 905,298 803,267 803,267-11.27%
Ormond Beach 685,303 805,298 905,298 803,267 803,267-11.27%685,303 805,298 905,298 803,267 803,267-11.27%Total All Funds
No full-time equivalent positions budgeted 0.00 0.00 0.00 0.00 0.000.00 0.00 0.00 0.00 0.00Total Personnel

Community Development HERO Project Area
Activities / Functions
86
Functions This program is responsible for the implementation of the Community Development Commission’s (“CDC”) redevelopment and housing activities within the Historic Enhancement and Revitalization of Oxnard (“HERO”) Project Area. The primary function of the HERO Project Area is to retain and attract commercial and industrial development, and to improve public infrastructure and utilities.
Activities • Street reconstruction, including:
- Street and alley ways reconstruction, curb and gutter repairs/replacements along Saviers Road and the Blackstock North neighborhood
- Pavement resurfacing, sidewalk, curb and repair and the replacement of street name signs in the Cypress and Cal-Gisler neighborhoods, estimated to begin in the third quarter of 2012
• South Oxnard Median Improvements
- Construction on 57 medians along Saviers, Hueneme, and Pleasant Valley Roads
• Housing development - RiverPark/Aldersgate, consisting of 156 affordable for-sale units - RiverPark/ED & KOH, consisting of 28 affordable rental units - The Village at Wagon Wheel, consisting of 1,500 dwellings including live-work units and luxury high-rise
condominiums
• HERO Façade and Paint Improvement Program - Assist commercial property owners/merchants in upgrading their buildings to create an attractive commercial
office/retail environment
• Gateway Sign Program
- Installation of wayfinding signage and entry street monument signs at Vineyard Avenue, Del Norte Boulevard, and Esplanade Drive
Administrative Duties:
• Monitor Owner Participation Agreements (OPAs), Development Agreement (DAs), and loan agreements for compliance, including RiverPark, the Esplanade Shopping Center, and Fry’s Electronics
• Assist with entitlements

%Change
Community Development HERO Project Area
87
Expenses by Category
Expenses by Fund %Change
Personnel
2009-10Actual
2010-11Budget
2010-11Revised
2011-12Recommended
2012-13Proposed
2009-10Actual
2010-11Budget
2010-11Revised
2011-12Recommended
2012-13Proposed
2009-10Actual
2010-11Budget
2010-11Revised
2011-12Recommend
2012-13Proposed
Salaries and Benefits 0 0 0 0 0Other Expenses 9,999,436 2,492,511 4,925,576 5,385,881 5,791,9459.35%Total Expenses 9,999,436 2,492,511 4,925,576 5,385,881 5,791,9459.35%
H.E.R.O. 9,999,436 2,492,511 4,925,576 5,385,881 5,791,9459.35%9,999,436 2,492,511 4,925,576 5,385,881 5,791,9459.35%Total All Funds
No full-time equivalent positions budgeted 0.00 0.00 0.00 0.00 0.000.00 0.00 0.00 0.00 0.00Total Personnel

Community Development Special Projects/CDC Operations
Activities / Functions
88
Function
The function of Community Development Commission’s (“CDC”) Special Projects is to assist the City in facilitating City Council’s goals and objectives with projects, programs and activities that accelerate the City’s efforts toward economic and community development strategies.
Activities
• Community Outreach - Maintain a department web page to provide answers to typical redevelopment questions, provide updates on current
projects, outline future activities, and highlight development opportunities throughout the City - Create a quarterly newsletter that features current projects, future developments, activities, and accomplishments,
occurring in CDC project areas
• Retail Attraction /Retail Retention - Promote and market “oxnardretail.com” as part of the CDC’s ongoing retail attraction efforts - Provide ongoing retail attraction/retention activities including direct mailers, advertising, and City representation at
local, regional, and national retail trade shows
• Economic Development Collaborative-Ventura County - The Revolving Loan Fund provides long-term, low-payment financing for new and existing businesses for the
financing of fixed assets, working capital, leasehold improvements, and debt restructuring - The Business Enhancement Program is a business assistance and education program that provides employers access
to the latest business resources to sustain jobs and improve a company’s economic stability
• Five-Year Implementation Plan - Consistent with the requirements of California Redevelopment Law, coordinate the adoption of an Implementation
Plan to outline the agency’s goals and objectives for each project area, describe programs, and potential projects

%Change
Community Development Special Projects/CDC Operations
89
Expenses by Category
Expenses by Fund %Change
Personnel
2009-10Actual
2010-11Budget
2010-11Revised
2011-12Recommended
2012-13Proposed
2009-10Actual
2010-11Budget
2010-11Revised
2011-12Recommended
2012-13Proposed
2009-10Actual
2010-11Budget
2010-11Revised
2011-12Recommend
2012-13Proposed
Salaries and Benefits 1,022,290 1,231,777 1,231,777 1,254,068 1,254,0681.81%Other Expenses 1,293,211 1,317,884 1,047,884 1,260,942 1,260,94220.33%Total Expenses 2,315,501 2,549,661 2,279,661 2,515,010 2,515,01010.32%
General Fund 496,434 470,066 200,066 456,717 456,717128.28%CDC Admin 1,819,067 2,079,595 2,079,595 2,058,293 2,058,293-1.02%
2,315,501 2,549,661 2,279,661 2,515,010 2,515,01010.32%Total All Funds
Administrative Assistant 0.80 0.80 0.80 0.80 0.80Administrative Secretary I/II 1.00 1.00 1.00 1.00 1.00Administrative Secretary III 0.85 0.85 0.85 0.85 0.85Assistant City Manager 0.15 0.15 0.15 0.15 0.15City Manager 0.15 0.15 0.15 0.15 0.15Community Development Director 0.73 0.73 0.73 0.73 0.73Controller 0.15 0.15 0.15 0.00 0.00Drafting/Graphics Technician 0.25 0.25 0.25 0.25 0.25Housing Director 0.05 0.05 0.05 0.05 0.05Management Accountant/Auditor 0.15 0.15 0.15 0.15 0.15Management Analyst I/II 0.00 0.00 1.00 1.00 1.00Management Analyst III 0.00 0.00 0.00 0.50 0.50Redevelopment Project Manager 4.00 4.00 4.00 3.60 3.60Redevelopment Services Manager 1.00 1.00 1.00 1.00 1.00
9.28 9.28 10.28 10.23 10.23Total Personnel

Community Development Economic Development
Activities / Functions
90
Functions
Economic Development promotes business attraction activities, provides business assistance and facilitates business growth in the City of Oxnard including business outreach and assistance to existing businesses.
Activities
• Assist businesses in their relocation or expansion in Oxnard • Facilitate development-related permits through the City for businesses • Manage Workforce Assistance Program which consists of assisting companies in identifying qualified candidates to fill
existing positions, and workforce training reimbursement assistance • Provide site selection assistance to relocating and existing companies by identifying appropriate sites based on size, zoning,
parking, specifications • Provide up-to-date economic data for the Oxnard and Ventura County regions which includes information on employment,
wages, housing costs, Gross Domestic Product, and population characteristics • Prepare customized reports for relocation prospects and existing businesses • Implement new targeted attraction and retention activities for Downtown Oxnard • Target marketing to green-tech, bio-tech, and related companies

%Change
Community Development Economic Development
91
Expenses by Category
Expenses by Fund %Change
Personnel
2009-10Actual
2010-11Budget
2010-11Revised
2011-12Recommended
2012-13Proposed
2009-10Actual
2010-11Budget
2010-11Revised
2011-12Recommended
2012-13Proposed
2009-10Actual
2010-11Budget
2010-11Revised
2011-12Recommend
2012-13Proposed
Salaries and Benefits 0 0 0 0 0Other Expenses 227,588 227,588 227,588 202,588 202,588-10.98%Total Expenses 227,588 227,588 227,588 202,588 202,588-10.98%
General Fund 152,588 152,588 152,588 152,588 152,5880.00%CDBG Federal Entitlement 75,000 75,000 75,000 50,000 50,000-33.33%
227,588 227,588 227,588 202,588 202,588-10.98%Total All Funds
No full-time equivalent positions budgeted 0.00 0.00 0.00 0.00 0.000.00 0.00 0.00 0.00 0.00Total Personnel

Community Development Convention and Visitors Bureau
Activities / Functions
92
Function The function of the Oxnard Convention & Visitors Bureau (OCVB) is to promote leisure and business travel to effectively impact the City’s transient occupancy tax (TOT) and sales tax revenue into the general fund.
Activities
• Brand Project - Increases Oxnard’s visibility as a destination and boosts economic impact by attracting new business to the City
• Strategic Plan
- Outlines future goals, objectives, and courses of action for the organization
• Economic Tourism Impact Study - Provides visitor market data and measures the economic and fiscal contributions of Oxnard’s tourism industry,
which is useful for effective marketing, operations and development planning
• California Welcome Center - Increases statewide exposure for Oxnard due to inclusion in the California Visitors Guide, the state website at
www.visitcalifornia.com, network of 19 designated state centers, and international visibility through the state’s new tourism offices in 15 countries
• Oxnard City Tours
- Promote tours to highlight Oxnard’s growing industries and destinations
• Online Marketing - Launched new website for mobile devices and a new program on TripAdvisor and GoCalifornia.com

%Change
Community Development Convention and Visitors Bureau
93
Expenses by Category
Expenses by Fund %Change
Personnel
2009-10Actual
2010-11Budget
2010-11Revised
2011-12Recommended
2012-13Proposed
2009-10Actual
2010-11Budget
2010-11Revised
2011-12Recommended
2012-13Proposed
2009-10Actual
2010-11Budget
2010-11Revised
2011-12Recommend
2012-13Proposed
Salaries and Benefits 0 0 0 0 0Other Expenses 712,360 712,360 712,360 712,360 712,3600.00%Total Expenses 712,360 712,360 712,360 712,360 712,3600.00%
General Fund 712,360 712,360 712,360 712,360 712,3600.00%712,360 712,360 712,360 712,360 712,3600.00%Total All Funds
No full-time equivalent positions budgeted 0.00 0.00 0.00 0.00 0.000.00 0.00 0.00 0.00 0.00Total Personnel

Community Development 20% Set Aside Housing Fund
Activities / Functions
94
Functions The CDC is required to deposit not less than 20% of gross tax increment revenues derived within each Project Area into a LMIHF (Low and Moderate Income Housing Fund, commonly known as “Housing Set-Aside”). Such funds are expressly reserved for purposes of increasing, improving, and preserving the community’s supply of low and moderate income housing.
Activities Housing Set-Aside funds are expressly reserved for a broad array of activities including:
• Site assemblage, new construction and rehabilitation of affordable housing • Provision of loans and/or grants for the rehabilitation of existing homes and apartments • Down payment assistance for first time home purchases • Incentives for infill and mixed use projects

%Change
Community Development 20% Set Aside Housing Fund
95
Expenses by Category
Expenses by Fund %Change
Personnel
2009-10Actual
2010-11Budget
2010-11Revised
2011-12Recommended
2012-13Proposed
2009-10Actual
2010-11Budget
2010-11Revised
2011-12Recommended
2012-13Proposed
2009-10Actual
2010-11Budget
2010-11Revised
2011-12Recommend
2012-13Proposed
Salaries and Benefits 448,231 459,926 459,926 368,870 368,870-19.80%Other Expenses 2,454,011 643,768 7,796,326 1,592,138 1,747,520-79.58%Total Expenses 2,902,242 1,103,694 8,256,252 1,961,008 2,116,390-76.25%
Housing Set-Aside 2,902,242 1,103,694 8,256,252 1,961,008 2,116,390-76.25%2,902,242 1,103,694 8,256,252 1,961,008 2,116,390-76.25%Total All Funds
Administrative Assistant 0.20 0.20 0.20 0.20 0.20Administrative Secretary III 0.30 0.30 0.30 0.30 0.30Community Development Director 0.27 0.27 0.27 0.27 0.27Housing Director 0.10 0.10 0.10 0.10 0.10Housing Rehabilitation Program Manager 0.15 0.15 0.15 0.15 0.15Office Assistant I/II 0.15 0.15 0.15 0.15 0.15Redevelopment Project Manager 0.00 0.00 0.00 0.40 0.40Rehabilitation Construction Specialist I/II 0.15 0.15 0.15 0.15 0.15Rehabilitation Loan Assistant 0.15 0.15 0.15 0.15 0.15Rehabilitation Loan Specialist 0.15 0.15 0.15 0.15 0.15Senior Code Enforcement Inspector 1.00 1.00 1.00 1.00 1.00
2.62 2.62 2.62 3.02 3.02Total Personnel


Development Services


%Change
Expenses by Category
Development Services Department Summary
97
%Change
%Change
Expenses by Fund
Expenses by Program 2009-10Actual
2010-11Budget
2010-11Revised
2011-12Recommended
2012-13Proposed
2009-10Actual
2010-11Budget
2010-11Revised
2011-12Recommended
2012-13Proposed
2009-10Actual
2010-11Budget
2010-11Revised
2011-12Recommended
2012-13Proposed
Salaries and Benefits 5,435,766 5,435,650 5,152,175 5,424,397 5,424,3975.28%Other Expenses 3,221,148 2,688,732 2,694,262 2,751,674 2,779,2552.13%Total Expenses 8,656,914 8,124,382 7,846,437 8,176,071 8,203,6524.20%
General Fund 6,342,802 6,085,111 5,807,166 5,967,358 5,967,3582.76%Air Pollution Buydown 392,058 0 0 0 0State Gas Tax 90,023 72,436 72,436 91,832 91,83226.78%Traffic Safety 371,218 375,596 375,596 365,444 365,444-2.70%TDA/LTF 4 651,692 708,239 708,239 713,564 713,5640.75%Storm Drain Facility Fee 180,176 171,000 171,000 220,392 268,22828.88%Circulation Sys. Impr. Fees 628,945 712,000 712,000 817,481 797,22614.81%
8,656,914 8,124,382 7,846,437 8,176,071 8,203,6524.20%Total All Funds
Development Support 405,108 431,202 428,367 405,174 405,174-5.41%Building and Engineering 4,872,717 4,970,179 4,716,706 4,966,107 4,993,6885.29%Planning & Environmental Services
1,882,509 1,576,130 1,554,493 1,617,185 1,617,1854.03%
Traffic Eng. & Operations 452,830 438,632 438,632 474,041 474,0418.07%Transit Services 1,043,750 708,239 708,239 713,564 713,5640.75%
8,656,914 8,124,382 7,846,437 8,176,071 8,203,6524.20%Total All Programs

Development Services Development Support
Activities / Functions
98
Principle Development Support Division Activities:
• Provide oversight and administrative resources for the Development Services Department, including the Planning Division, Building & Engineering Division, Traffic Engineering Division, and Transit Services Division.
• Assist Development Services managers and staff in setting effective goals and objectives, developing policies, contract
management, budget analysis, and providing resources for day-to-day operations and special projects.
• Assist in the financial management of federal and state grants for various Development Services projects.

%Change
Development Services Development Support
99
Expenses by Category
Expenses by Fund %Change
Personnel
2009-10Actual
2010-11Budget
2010-11Revised
2011-12Recommended
2012-13Proposed
2009-10Actual
2010-11Budget
2010-11Revised
2011-12Recommended
2012-13Proposed
2009-10Actual
2010-11Budget
2010-11Revised
2011-12Recommend
2012-13Proposed
Salaries and Benefits 345,019 360,525 357,690 364,606 364,6061.93%Other Expenses 60,089 70,677 70,677 40,568 40,568-42.60%Total Expenses 405,108 431,202 428,367 405,174 405,174-5.41%
General Fund 405,108 431,202 428,367 405,174 405,174-5.41%405,108 431,202 428,367 405,174 405,174-5.41%Total All Funds
Administrative Technician 1.00 1.00 1.00 1.00 1.00Development Services Director 1.00 1.00 1.00 1.00 1.00Management Analyst II 0.00 0.00 0.00 0.50 0.50Management Analyst III 1.00 1.00 1.00 0.00 0.00Senior Administrative Secretary 1.00 1.00 1.00 0.00 0.00
4.00 4.00 4.00 2.50 2.50Total Personnel

Development Services Building and Engineering
Activities / Functions
100
Building Plan Check and Inspection Program:
• Responsible for ensuring safety of new development by verifying designs comply with building codes and City ordinances including access for physically disabled, energy conservation, and fire prevention. Review detailed architectural, structural,electrical, plumbing, and mechanical plans for new construction and tenant improvements.
• Calculate and collect permit and infrastructure fees including wastewater, water, storm drain, traffic, growth development, and utility line undergrounding fees.
• Provide next day AM-PM building inspection services and issue certificates of occupancy. • Provide time-certain plan check turnarounds ranging from one day for simple plans to 15 days for more complex commercial
and industrial buildings. Counter service provided within 20 minutes. • Ongoing document imaging of current and historic construction plans provides instant access to documents.
Development Engineering Program:
• Responsible for ensuring land development projects comply with EIR mitigations, specific plans requirements, City policies, and ordinances.
• Review drainage, sewer and water infrastructure studies and provide recommended conditions of approval. • Provide coordinated plan review process for grading, street, drainage, water and sewer improvement plans and stormwater
quality regulations. • Issue encroachment permits for curb cuts, utility connections, and other construction within City’s right-of-way. • Process reimbursement requests for the construction of master planned improvements and facilities by developers. • Provides 13-day plan check turnaround time for onsite improvements, grading and public improvement plans.

%Change
Development Services Building and Engineering
101
Expenses by Category
Expenses by Fund %Change
Personnel
2009-10Actual
2010-11Budget
2010-11Revised
2011-12Recommended
2012-13Proposed
2009-10Actual
2010-11Budget
2010-11Revised
2011-12Recommended
2012-13Proposed
2009-10Actual
2010-11Budget
2010-11Revised
2011-12Recommend
2012-13Proposed
Salaries and Benefits 3,443,841 3,413,588 3,155,665 3,371,853 3,371,8536.85%Other Expenses 1,428,876 1,556,591 1,561,041 1,594,254 1,621,8352.13%Total Expenses 4,872,717 4,970,179 4,716,706 4,966,107 4,993,6885.29%
General Fund 4,055,185 4,077,779 3,824,306 3,918,834 3,918,8342.47%State Gas Tax 8,411 9,400 9,400 9,400 9,4000.00%Storm Drain Facility Fee 180,176 171,000 171,000 220,392 268,22828.88%Circulation Sys. Impr. Fees 628,945 712,000 712,000 817,481 797,22614.81%
4,872,717 4,970,179 4,716,706 4,966,107 4,993,6885.29%Total All Funds
Administrative Secretary I 0.00 0.00 0.00 1.00 1.00Administrative Secretary III 3.00 3.00 3.00 1.00 1.00Assistant Civil Engineer 1.00 1.00 1.00 0.00 0.00Assistant Traffic Engineer 1.00 1.00 1.00 1.00 1.00Building/Construction Inspector I/II 7.00 7.00 7.00 6.18 6.18Civil Engineer 1.00 1.00 1.00 1.00 1.00Construction Inspector I/II 4.00 4.00 4.00 2.00 2.00Data Entry Operator I/II 1.00 1.00 1.00 1.00 1.00Deputy Building Official 2.00 2.00 2.00 2.00 2.00Development Services Manager 1.00 1.00 1.00 1.00 1.00Electrical Inspector 1.00 1.00 1.00 1.00 1.00Junior Civil Engineer 1.00 1.00 1.00 3.00 3.00Office Assistant I/II 3.00 3.00 3.00 6.00 6.00Permit Technician 3.00 3.00 3.00 3.00 3.00Plan Check Engineer 1.00 1.00 1.00 1.00 1.00Plans Examiner I/II 1.00 1.00 1.00 1.00 1.00Plumbing and Mechanical Inspector 1.00 1.00 1.00 0.00 0.00Project Manager 0.50 0.50 0.50 0.50 0.50Senior Building/Construction Inspector 1.00 1.00 1.00 1.00 1.00Senior Plans Examiner 1.00 1.00 1.00 0.00 0.00Supervising Building Inspector 1.00 1.00 1.00 1.00 1.00Supervising Civil Engineer 1.00 1.00 1.00 1.00 1.00
36.50 36.50 36.50 34.68 34.68Total Personnel

Development Services Planning & Environmental Services
Activities / Functions
102
Principle Planning Division Activities:
• Provide customer service to the general public responding to inquiries relating to land use/zoning. • Process a variety of land use entitlements, including ministerial and discretionary permits. • Conduct environmental analysis for all projects in compliance with the California Environmental Quality Act. • Maintain current knowledge on changing environmental laws and City/project compliance with such requirements. • Review building permit plan checks for conformity to approved planning permit approvals. Such review includes calculation
of fees for air quality and traffic impacts, Quimby or recreation impacts, public art requirements, and affordable housing requirements.
• Conduct site inspections for final building permit signoff. • Provide interagency review of development activities proposed in adjacent jurisdictions, for conformity with the City of
Oxnard General Plan. Subprogram Activities:
• Staff and support the Planning Commission (meetings twice monthly) – includes study session (also twice monthly) • Staff and support the Downtown Design Review Committee (weekly meetings) • Coordination of the Development Advisory Committee (weekly meetings) • Coordination of the Community Workshops (monthly meetings) • Coordination of the Street Naming Committee (meetings as necessary) • Representation on other important groups/committees including Façade Program, Downtown Streetscape, Wayfinding,
Neighborhood Conservation Task Force, South Oxnard Revitalization Committee, Colonia Task Force, Affordable Housing Team, Citywide Enhancement Program, Small Business Meetings, and Agenda Preparers Committee.
• Continue to enhance level of customer service at every opportunity. • Encourage opportunities for electronic and digital resources, such as availability of information on the Planning Division
webpage. Major Projects or Initiatives Underway:
• 2030 General Plan • Housing Element Update • Meta Street District Master Plan • Bicycle Master Plan Update, including connection into the countywide Santa Clara River Bike Trail • Zoning Ordinance review and update, including mixed-use, density bonus, and high-density issues • Ormond Beach EIR and Specific Plans • Sakioka Farms Specific Plan proposal • Redevelopment of the Carriage Square Shopping Center • Ongoing improvements at the Centerpoint Mall • Build-out of the RiverPark Specific Plan area, with focus on The Collection Shopping Center

%Change
Development Services Planning & Environmental Services
103
Expenses by Category
Expenses by Fund %Change
Personnel
2009-10Actual
2010-11Budget
2010-11Revised
2011-12Recommended
2012-13Proposed
2009-10Actual
2010-11Budget
2010-11Revised
2011-12Recommended
2012-13Proposed
2009-10Actual
2010-11Budget
2010-11Revised
2011-12Recommend
2012-13Proposed
Salaries and Benefits 1,177,214 1,183,331 1,160,614 1,197,682 1,197,6823.19%Other Expenses 705,295 392,799 393,879 419,503 419,5036.51%Total Expenses 1,882,509 1,576,130 1,554,493 1,617,185 1,617,1854.03%
General Fund 1,882,509 1,576,130 1,554,493 1,617,185 1,617,1854.03%1,882,509 1,576,130 1,554,493 1,617,185 1,617,1854.03%Total All Funds
Administrative Secretary III 1.00 1.00 1.00 1.00 1.00Assistant Planner 2.00 2.00 2.00 2.00 2.00Associate Planner 4.00 4.00 4.00 4.00 4.00Drafting/Graphics Technician I/II 0.75 0.75 0.75 0.75 0.75Junior Planner 1.00 1.00 1.00 1.00 1.00Office Assistant I/II 1.00 1.00 1.00 1.00 1.00Planning & Environmental Services Manager 1.00 1.00 1.00 1.00 1.00Principal Planner 1.00 1.00 1.00 2.00 2.00
11.75 11.75 11.75 12.75 12.75Total Personnel

Development Services Traffic Eng. & Operations
Activities / Functions
104
The mission of the Traffic Engineering Division is to provide for the safe and efficient flow of vehicular, bicycle, and pedestrian traffic throughout the City. With this goal as a foundation, the City’s Traffic Engineering staff performs numerous routine and important duties. For example, the Division routinely investigates locations with high numbers of reported traffic collisions or potential hazards. Staff then analyzes relevant data and makes responsive recommendations. The Traffic Engineering “toolbox” includes traffic-calming efforts, such as speed humps and bulb-outs. Minimizing traffic congestion is another important function especially as Oxnard’s population continues to grow. Staff routinely analyzes traffic volumes and patterns caused by new development and ambient growth. Based on the analysis, traffic signal timing is adjusted or engineering projects are proposed for design and construction. Staff reviews Environmental Impact Reports, Traffic Studies, Parking Studies, Specific Plans and other development-related documents. Staff also maintains the City’s traffic model and works with consultants regarding the scope of a projects traffic study. Staff constantly monitors and controls the broad and high-tech citywide traffic signal system to optimize performance. This is done in conjunction with CalTrans, the County of Ventura, and the City of Port Hueneme (including Naval Base Ventura County). TheDivision quickly responds to malfunctions and changing traffic patterns. The Traffic Engineering Division is in the process of designing and constructing an Intelligent Transportation System (ITS) for the City. This project will involve establishing communication to all City facilities, deployment of Global Positioning System (GPS) for emergency vehicle preemption at traffic signals and providing the Police Department with Closed Circuit Tele Vision (CCTV) monitoring capabilities. The ITS will also provide drivers with roadway and traffic information so they can evaluate and plan theirroutes efficiently. The Traffic Engineering Division is also tasked with minimizing the ongoing maintenance cost for traffic control devices through the use of low energy-consuming Light Emitting Diode (LED) signal lights and long lasting thermoplastic pavement markings. Additional energy savings are realized by converting internally illuminated street name signs at traffic signals to reflective metal signs. The Division communicates with the public routinely in regards to improving traffic safety with special emphasis on pedestrian and bicycle safety (especially with respect to children under 15 years of age). Speed reduction is also addressed through outreach inresidential neighborhoods in association with local law enforcement. This involves attending neighborhood council meetings and developing programs to address specific needs such as the Permit Parking Program, the Speed Hump Program, the On Street HandicapParking Program, and the Oversized Vehicle Ordinance. The Division cooperates with the Oxnard Police Department on related annual efforts such as the federal “Click It or Ticket” seatbelt campaign. Outside of working with other municipal agencies, staff also coordinates with contractors working in the public right-of-way. Staff’s intent is to ensure the safety of construction work zones and the general public. Staff reviews and is responsible for approving traffic control plans, traffic detour plans, and transportation routes for oversized loads. Staff also works with contractors constructing roadway improvements including traffic signal installations and modifications. When necessary, the Division’s expertise is employed to defend the City in traffic-related lawsuits. Staff can produce and provide documents, maps, and schematics to support the City in depositions and in court. Other duties involving the Traffic Engineering Division’s personnel include applying for grant funding to finance projects from local,state and federal sources; working with Gold Coast Transit (formerly SCAT) to facilitate bus routes; reviewing and updating the City’s 2030 General Plan and reviewing development engineering plans to enhance safety through the effective placement of trafficcontrol devices including traffic signal and street lamps. Lastly, the Traffic Engineering Division assists in the updating and maintenance of the City’s Standard Plates so that contractors build to the highest City standards, improving the City’s image. This involves the development of policies and guidelines pertaining totraffic related issues to ensure the City’s compliance with Federal and State guidelines.

%Change
Development Services Traffic Eng. & Operations
105
Expenses by Category
Expenses by Fund %Change
Personnel
2009-10Actual
2010-11Budget
2010-11Revised
2011-12Recommended
2012-13Proposed
2009-10Actual
2010-11Budget
2010-11Revised
2011-12Recommended
2012-13Proposed
2009-10Actual
2010-11Budget
2010-11Revised
2011-12Recommend
2012-13Proposed
Salaries and Benefits 330,660 340,158 340,158 343,348 343,3480.94%Other Expenses 122,170 98,474 98,474 130,693 130,69332.72%Total Expenses 452,830 438,632 438,632 474,041 474,0418.07%
General Fund 0 0 0 26,165 26,165State Gas Tax 81,612 63,036 63,036 82,432 82,43230.77%Traffic Safety 371,218 375,596 375,596 365,444 365,444-2.70%
452,830 438,632 438,632 474,041 474,0418.07%Total All Funds
Associate Traffic Design Engineer 1.00 1.00 1.00 1.00 1.00Traffic Engineer 1.00 1.00 1.00 1.00 1.00
2.00 2.00 2.00 2.00 2.00Total Personnel

Development Services Transit Services
Activities / Functions
106
The mission and goals of the Transit Services Division are to enhance and improve the public transportation system serving Oxnard residents, visitors, and businesses alike through the provision and availability of efficient and affordable public transportation. From this foundation, the City’s Transit Services Division: • Develops strategic plans for transit-related capital improvements. • Seeks new funding, including state, federal, and local grants, to maximize public transportation opportunities. • Seeks additional sources of transit funding through coordination with the staff of the Ventura County Transportation Commission
(VCTC) and staff of Gold Coast Transit (GCT) to optimize opportunities for improving Oxnard’s public transportation system. • Develops and maintains strong relationships with the City’s transit providers, managers, staff, and transit patrons. The division
partners with GCT, VCTC, Metrolink, Amtrak, and Ventura Intercity Service Transit Authority (VISTA) to optimize transit opportunities and provide the best public transit system possible.
• Manages all aspects of the Oxnard Transportation Center (OTC), ensuring the availability of safe, attractive, and comprehensive
public transportation. • Coordinates OTC activities and future development in accordance with the City’s proposed 2030 General Plan.
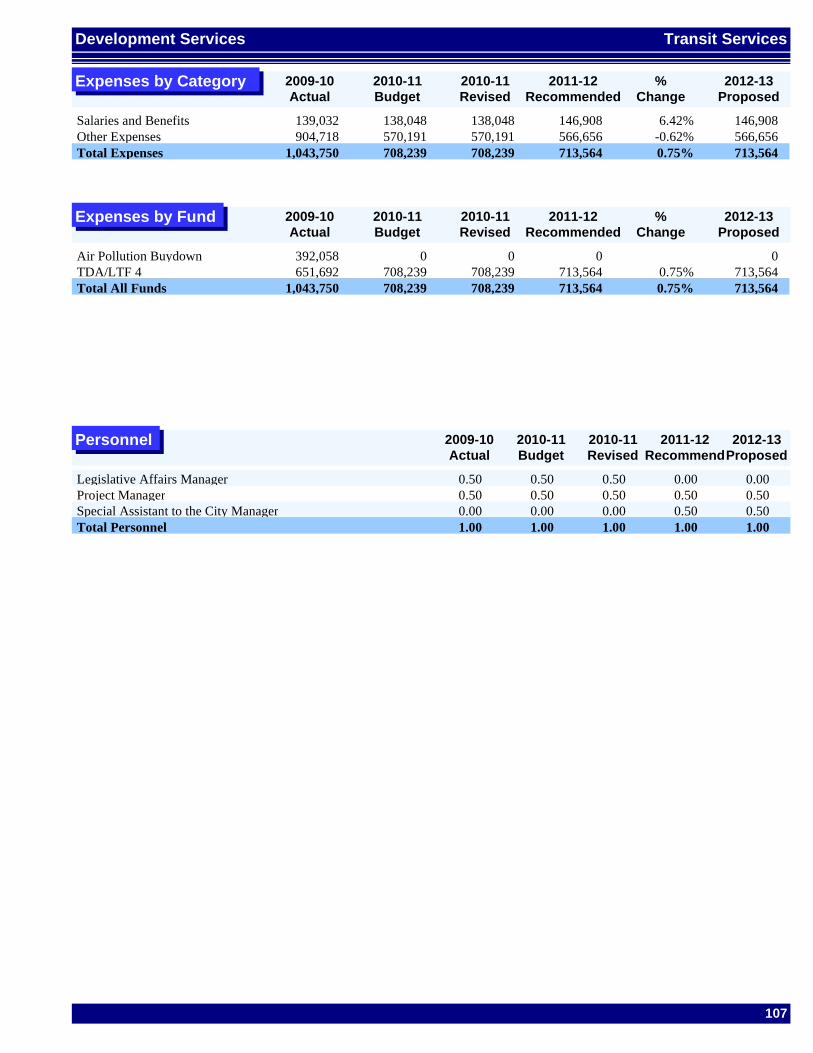
%Change
Development Services Transit Services
107
Expenses by Category
Expenses by Fund %Change
Personnel
2009-10Actual
2010-11Budget
2010-11Revised
2011-12Recommended
2012-13Proposed
2009-10Actual
2010-11Budget
2010-11Revised
2011-12Recommended
2012-13Proposed
2009-10Actual
2010-11Budget
2010-11Revised
2011-12Recommend
2012-13Proposed
Salaries and Benefits 139,032 138,048 138,048 146,908 146,9086.42%Other Expenses 904,718 570,191 570,191 566,656 566,656-0.62%Total Expenses 1,043,750 708,239 708,239 713,564 713,5640.75%
Air Pollution Buydown 392,058 0 0 0 0TDA/LTF 4 651,692 708,239 708,239 713,564 713,5640.75%
1,043,750 708,239 708,239 713,564 713,5640.75%Total All Funds
Legislative Affairs Manager 0.50 0.50 0.50 0.00 0.00Project Manager 0.50 0.50 0.50 0.50 0.50Special Assistant to the City Manager 0.00 0.00 0.00 0.50 0.50
1.00 1.00 1.00 1.00 1.00Total Personnel


Finance


%Change
Expenses by Category
Finance Department Summary
109
%Change
%Change
Expenses by Fund
Expenses by Program 2009-10Actual
2010-11Budget
2010-11Revised
2011-12Recommended
2012-13Proposed
2009-10Actual
2010-11Budget
2010-11Revised
2011-12Recommended
2012-13Proposed
2009-10Actual
2010-11Budget
2010-11Revised
2011-12Recommended
2012-13Proposed
Salaries and Benefits 2,340,805 2,365,150 2,172,304 2,310,139 2,310,1396.35%Other Expenses 3,721,726 5,066,479 5,070,079 5,084,314 5,084,3140.28%Total Expenses 6,062,531 7,431,629 7,242,383 7,394,453 7,394,4532.10%
General Fund 3,352,023 3,515,278 3,326,032 3,481,758 3,481,7584.68%CDBG Federal Entitlement -6,336 0 0 0 0Public Liability 2,716,844 3,916,351 3,916,351 3,912,695 3,912,695-0.09%
6,062,531 7,431,629 7,242,383 7,394,453 7,394,4532.10%Total All Funds
Administration 315,961 340,566 340,566 333,708 333,708-2.01%General Accounting 1,809,570 1,869,276 1,779,179 1,841,432 1,841,4323.50%Budget and Capital Improvement Projects
249,719 253,778 255,858 147,002 147,002-42.55%
Purchasing 424,851 438,247 431,159 446,052 446,0523.45%Financial Resources 227,409 305,256 224,882 250,984 250,98411.61%Liability Management 2,716,844 3,916,351 3,916,351 3,912,695 3,912,695-0.09%Grants Management 176,675 167,228 153,461 325,197 325,197111.91%Mail & Courier Services 141,502 140,927 140,927 137,383 137,383-2.51%
6,062,531 7,431,629 7,242,383 7,394,453 7,394,4532.10%Total All Programs

Finance Administration
Activities / Functions
110
The Finance Department provides for the financial management of City funds and supports the City Council, City Manager and Departments in providing City service to the community. Finance Administration includes funding for the Chief Financial Officer (CFO) and other administrative support. The CFO supervises Finance Department staff and oversees a wide range of functions including:
• General accounting and financial reporting
• Debt and risk management
• Purchasing and mail service
• Budget and grant management

%Change
Finance Administration
111
Expenses by Category
Expenses by Fund %Change
Personnel
2009-10Actual
2010-11Budget
2010-11Revised
2011-12Recommended
2012-13Proposed
2009-10Actual
2010-11Budget
2010-11Revised
2011-12Recommended
2012-13Proposed
2009-10Actual
2010-11Budget
2010-11Revised
2011-12Recommend
2012-13Proposed
Salaries and Benefits 312,086 305,949 305,949 313,582 313,5822.49%Other Expenses 3,875 34,617 34,617 20,126 20,126-41.86%Total Expenses 315,961 340,566 340,566 333,708 333,708-2.01%
General Fund 315,961 340,566 340,566 333,708 333,708-2.01%315,961 340,566 340,566 333,708 333,708-2.01%Total All Funds
Chief Financial Officer 1.00 1.00 1.00 1.00 1.00Senior Administrative Secretary (C) 1.00 1.00 1.00 1.00 1.00
2.00 2.00 2.00 2.00 2.00Total Personnel

Finance General Accounting
Activities / Functions
112
General Accounting is responsible for many of the basic financial accounting and reporting activities of the City as follows: General ledger and account activities include: • Preparation and posting of monthly journal vouchers. • Preparation of month-end and year-end closing. • Reconcile and maintain the general ledger and record cash receipts. • Maintenance of the City’s financial files including trial balances, balance sheets, and statements of revenues and expenditures. Audit activities include: • City financial audit. • Transportation Development Act (TDA). • Gas Tax. • Community Development Commission (CDC). • Single Audit. Financial reporting includes: • Comprehensive Annual Financial Report (CAFR) for City and Community Development Commission (CDC) and submission of
the CAFR to Government Finance Officers Association for an award for Excellence in Financial Reporting. • Annual State Controller’s Report. • City’s Financial Transaction Report. • Annual Street Report. • CDC Statement of Indebtedness. • Development Fees Report (AB1600). • Monthly Budget Report. Accounts Payable • Processes the City’s invoices for weekly payment. • Maintains warrant register and account payable reports. Accounts Receivable • Processes monthly billing requested by departments. • Reports delinquent accounts to City Attorney’s Office and Collection Agency for further collections. • Maintains monthly accounts receivable aging, trial balance, and open invoice list reports. Payroll activities include: • Processing the City’s biweekly payroll. • Preparing monthly, quarterly and annual payroll report for PERS, PARS retirement system, Federal and State Withholding Tax,
Medicare, State Disability, Unemployment, and W2s. • Coordinating payroll changes with Human Resources including new employees, terminations, benefits, deductions, and
compliance with the Memorandum of Understanding (MOU).

%Change
Finance General Accounting
113
Expenses by Category
Expenses by Fund %Change
Personnel
2009-10Actual
2010-11Budget
2010-11Revised
2011-12Recommended
2012-13Proposed
2009-10Actual
2010-11Budget
2010-11Revised
2011-12Recommended
2012-13Proposed
2009-10Actual
2010-11Budget
2010-11Revised
2011-12Recommend
2012-13Proposed
Salaries and Benefits 929,508 933,553 840,456 839,406 839,406-0.12%Other Expenses 880,062 935,723 938,723 1,002,026 1,002,0266.74%Total Expenses 1,809,570 1,869,276 1,779,179 1,841,432 1,841,4323.50%
General Fund 1,809,570 1,869,276 1,779,179 1,841,432 1,841,4323.50%1,809,570 1,869,276 1,779,179 1,841,432 1,841,4323.50%Total All Funds
Account Clerk I/II 2.00 2.00 2.00 2.50 2.50Account Clerk III 2.00 2.00 1.00 1.00 1.00Accountant I/II 3.00 3.00 2.00 2.00 2.00Accountant II (C) 0.00 0.00 1.00 1.00 1.00Accounting Manager 1.00 1.00 1.00 1.00 1.00Accounting Technician 1.00 1.00 2.00 2.00 2.00Controller 0.85 0.85 0.85 0.00 0.00Financial Analyst II 0.00 0.00 0.00 1.00 1.00Management Accountant/Auditor 2.35 2.35 2.35 0.85 0.85
12.20 12.20 12.20 11.35 11.35Total Personnel

Finance Budget and Capital Improvement Projects
Activities / Functions
114
Budget Management provides support to the City Manager’s Office and other City departments in all aspects of budget development, preparation, and monitoring through the following activities:
• Provide reliable and accurate budget information and reports
• Assist departments in reviewing budgets and preparing necessary adjustments and appropriation requests
• Maintain the budget in the financial system and implement approved budget changes throughout the fiscal year
• Monitor all CIP projects and assist project managers to effectively monitor their projects
• Improve City staff’s understanding of the budget through education and training
• Review City Council agenda items for financial impact

%Change
Finance Budget and Capital Improvement Projects
115
Expenses by Category
Expenses by Fund %Change
Personnel
2009-10Actual
2010-11Budget
2010-11Revised
2011-12Recommended
2012-13Proposed
2009-10Actual
2010-11Budget
2010-11Revised
2011-12Recommended
2012-13Proposed
2009-10Actual
2010-11Budget
2010-11Revised
2011-12Recommend
2012-13Proposed
Salaries and Benefits 231,456 231,751 233,231 126,877 126,877-45.60%Other Expenses 18,263 22,027 22,627 20,125 20,125-11.06%Total Expenses 249,719 253,778 255,858 147,002 147,002-42.55%
General Fund 249,719 253,778 255,858 147,002 147,002-42.55%249,719 253,778 255,858 147,002 147,002-42.55%Total All Funds
Accountant I/II 1.00 1.00 0.00 0.00 0.00Accounting Manager 1.00 1.00 0.50 0.50 0.50Financial Analyst II 0.00 0.00 1.00 0.50 0.50
2.00 2.00 1.50 1.00 1.00Total Personnel

Finance Purchasing
Activities / Functions
116
Purchasing supports City departments in the procurement of goods and services through the following activities:
• Provide assistance on bidding procedures and requirements, vendor sources, estimated costs of goods and services, proper use of account codes, cooperative purchasing with other public entities, requests for proposals, requests for qualifications, solicitation and evaluation, and the sale of surplus equipment.
• Review purchases for compliance with City policy and purchasing guidelines.
• Conduct purchasing training to ensure department staff understands purchasing procedures and regulations.
• Evaluate and enhance purchasing procedures by integrating e-purchasing systems and establishing/maintaining a vendor registration system to encourage more vendors to participate in bidding on City purchases with increased competition resulting in lower pricing.

%Change
Finance Purchasing
117
Expenses by Category
Expenses by Fund %Change
Personnel
2009-10Actual
2010-11Budget
2010-11Revised
2011-12Recommended
2012-13Proposed
2009-10Actual
2010-11Budget
2010-11Revised
2011-12Recommended
2012-13Proposed
2009-10Actual
2010-11Budget
2010-11Revised
2011-12Recommend
2012-13Proposed
Salaries and Benefits 368,434 370,572 363,484 374,964 374,9643.16%Other Expenses 56,417 67,675 67,675 71,088 71,0885.04%Total Expenses 424,851 438,247 431,159 446,052 446,0523.45%
General Fund 424,851 438,247 431,159 446,052 446,0523.45%424,851 438,247 431,159 446,052 446,0523.45%Total All Funds
Account Clerk III 1.00 1.00 1.00 1.00 1.00Accounting Manager 1.00 1.00 1.00 1.00 1.00Buyer 1.00 1.00 1.00 1.00 1.00Purchasing Clerk 1.00 1.00 1.00 1.00 1.00
4.00 4.00 4.00 4.00 4.00Total Personnel

Finance Financial Resources
Activities / Functions
118
Financial Resources is responsible for debt management, special districts, property management, and risk management (shownseparately under Liability Management). Debt management activities include:
• Managing the issuance of tax-exempt debt on a Citywide basis, including General Fund, Water, Wastewater, Solid Waste, Special Revenue Fund, Tax Allocation Financing, Assessment District and Community Facilities District debt issues.
• Providing financial analysis for potential bond issues, refunding opportunities, and alternative financing structures.
• Providing ongoing debt administration services for the City’s $455 million municipal debt portfolio, including debt service payments trustee account maintenance, State Controller Reporting (COFA), investor/Rating Agency relations, continuing disclosure obligations, and preparation and monitoring of arbitrage reports.
Special assessment district and Community Facilities District (CFD) activities include:
• Conduct formations of new Assessment Districts/Community Facilities Districts.
• Administer annual special assessment and special tax levy for CFDs and Special Assessment Districts, submitting over $13 million in annual assessments/taxes totaling 13,000 parcels to the County of Ventura.
• Manage delinquent assessments and administer foreclosure actions against properties with delinquent taxes/assessments.
• Provide special tax and assessment information to property owners, escrow companies, real estate brokers, and investors.
• Manage annual auto center assessment reimbursement program.
• Establish and submit the annual levy for the Public Safety Retirement Tax.
Property Management
• Manage the sale, purchase, and leasing of real property owned by the City.
• Prepare possessory interest tax report to the County of Ventura.
• Process payments of real property taxes on property owned outside of the City’s corporate boundaries.

%Change
Finance Financial Resources
119
Expenses by Category
Expenses by Fund %Change
Personnel
2009-10Actual
2010-11Budget
2010-11Revised
2011-12Recommended
2012-13Proposed
2009-10Actual
2010-11Budget
2010-11Revised
2011-12Recommended
2012-13Proposed
2009-10Actual
2010-11Budget
2010-11Revised
2011-12Recommend
2012-13Proposed
Salaries and Benefits 194,295 267,574 187,200 214,855 214,85514.77%Other Expenses 33,114 37,682 37,682 36,129 36,129-4.12%Total Expenses 227,409 305,256 224,882 250,984 250,98411.61%
General Fund 227,409 305,256 224,882 250,984 250,98411.61%227,409 305,256 224,882 250,984 250,98411.61%Total All Funds
Administrative Secretary III 1.00 1.00 0.00 0.00 0.00Administrative Technician 0.00 0.00 1.00 1.00 1.00Financial Analyst I/II/III 0.50 0.50 0.50 0.50 0.50Financial Services Manager 1.00 1.00 1.00 1.00 1.00
2.50 2.50 2.50 2.50 2.50Total Personnel

Finance Liability Management
Activities / Functions
120
Liability or risk management is provided by the Financial Resources Division as follows:
• Procure various lines of insurance coverage for the City including property & automobile, earthquake, boiler & machinery, marine liability, and excess workers’ compensation
• Represent the City in BICEP, an excess insurance Joint Powers Authority which provides excess liability coverage for the City
• Administer the City’s risk transfer program by ensuring all contractors, vendors, and permitees maintain appropriate insurance coverage
• Manage liability claims in conjunction with the City’s third party claims administrator
• Process and collect claims for damage done to City property caused by third parties.

%Change
Finance Liability Management
121
Expenses by Category
Expenses by Fund %Change
Personnel
2009-10Actual
2010-11Budget
2010-11Revised
2011-12Recommended
2012-13Proposed
2009-10Actual
2010-11Budget
2010-11Revised
2011-12Recommended
2012-13Proposed
2009-10Actual
2010-11Budget
2010-11Revised
2011-12Recommend
2012-13Proposed
Salaries and Benefits 92,453 54,758 54,758 58,146 58,1466.19%Other Expenses 2,624,391 3,861,593 3,861,593 3,854,549 3,854,549-0.18%Total Expenses 2,716,844 3,916,351 3,916,351 3,912,695 3,912,695-0.09%
Public Liability 2,716,844 3,916,351 3,916,351 3,912,695 3,912,695-0.09%2,716,844 3,916,351 3,916,351 3,912,695 3,912,695-0.09%Total All Funds
Financial Analyst III 0.50 0.50 0.00 0.00 0.000.50 0.50 0.00 0.00 0.00Total Personnel

Finance Grants Management
Activities / Functions
122
Coordinate, process and manage financial activities related to grant administration including: • Assist departments with budget reviews, analysis of grant-funded operations and setup. • Review and monitor grant regulations, policies, contracts, amendments, and other documents for both City departments and
nonprofit agencies to ensure compliance. • Ensuring capital projects with Caltrans-funded grants are in compliance proportionately (in terms of) phases of work,
reimbursement ratios, participating costs, and matching requirements. • Processing of invoices/claims for reimbursement, including any adjustments to ensure grant reconciliation and compliance. • Assist departments with filing of quarterly reporting as required by grant agencies, specifically American Recovery and
Reinvestment Act (ARRA) • Provide financial statements, schedules of revenues and expenditures, updated status reports and year-end grant reconciliation for
annual Single Audit. • Coordinate audits performed by various grantor agencies • Assist departments with submitting and processing grant applications. • Coordinate activities for reimbursements of State-mandated costs (SB90) by providing necessary data to ensure timely processing
of billings and collections. Other Functions:
Assist departments with quarterly reporting requirements, particularly ARRA funded grants to ensure compliance of minimum spending requirement and project milestones.

%Change
Finance Grants Management
123
Expenses by Category
Expenses by Fund %Change
Personnel
2009-10Actual
2010-11Budget
2010-11Revised
2011-12Recommended
2012-13Proposed
2009-10Actual
2010-11Budget
2010-11Revised
2011-12Recommended
2012-13Proposed
2009-10Actual
2010-11Budget
2010-11Revised
2011-12Recommend
2012-13Proposed
Salaries and Benefits 106,071 95,646 81,879 276,948 276,948238.24%Other Expenses 70,604 71,582 71,582 48,249 48,249-32.60%Total Expenses 176,675 167,228 153,461 325,197 325,197111.91%
General Fund 183,011 167,228 153,461 325,197 325,197111.91%CDBG Federal Entitlement -6,336 0 0 0 0
176,675 167,228 153,461 325,197 325,197111.91%Total All Funds
Accounting Manager 1.00 1.00 0.50 0.50 0.50Administrative Secretary III 0.00 0.00 1.00 1.00 1.00Administrative Technician 1.00 1.00 1.00 0.00 0.00Financial Analyst II 0.00 0.00 1.00 1.00 1.00Grants Coordinator 1.00 1.00 0.00 0.00 0.00Grants Specialist I/II 2.00 2.00 0.00 0.00 0.00
5.00 5.00 3.50 2.50 2.50Total Personnel

Finance Mail & Courier Services
Activities / Functions
124
Mail and Courier Services provide interoffice mail and postal services for City departments. Services include:
• Pickup and delivery of interoffice mail and packages at over 80 locations on a daily basis
• Ship and receive an estimated 615,000 items to/from the U.S. Postal Service, UPS, FedEx and other carriers
• Advise and assist in package and mailing needs.

%Change
Finance Mail & Courier Services
125
Expenses by Category
Expenses by Fund %Change
Personnel
2009-10Actual
2010-11Budget
2010-11Revised
2011-12Recommended
2012-13Proposed
2009-10Actual
2010-11Budget
2010-11Revised
2011-12Recommended
2012-13Proposed
2009-10Actual
2010-11Budget
2010-11Revised
2011-12Recommend
2012-13Proposed
Salaries and Benefits 106,502 105,347 105,347 105,361 105,3610.01%Other Expenses 35,000 35,580 35,580 32,022 32,022-10.00%Total Expenses 141,502 140,927 140,927 137,383 137,383-2.51%
General Fund 141,502 140,927 140,927 137,383 137,383-2.51%141,502 140,927 140,927 137,383 137,383-2.51%Total All Funds
Mail Clerk 2.00 2.00 2.00 2.00 2.002.00 2.00 2.00 2.00 2.00Total Personnel


Fire


%Change
Expenses by Category
Fire Department Summary
127
%Change
%Change
Expenses by Fund
Expenses by Program 2009-10Actual
2010-11Budget
2010-11Revised
2011-12Recommended
2012-13Proposed
2009-10Actual
2010-11Budget
2010-11Revised
2011-12Recommended
2012-13Proposed
2009-10Actual
2010-11Budget
2010-11Revised
2011-12Recommended
2012-13Proposed
Salaries and Benefits 17,233,609 17,051,238 16,902,370 17,955,471 17,955,4716.23%Other Expenses 2,973,798 1,941,046 3,126,219 1,870,008 1,870,008-40.18%Total Expenses 20,207,407 18,992,284 20,028,589 19,825,479 19,825,479-1.01%
General Fund 14,626,092 14,443,593 14,372,275 14,942,227 14,942,2273.97%Public Safety Retirement 3,705,441 3,653,255 3,524,128 4,157,318 4,157,31817.97%Other State Grants 193,029 0 236,750 0 0-100.00%2009 Lease Purchase Equipment 952,688 0 1,000,000 0 0-100.00%CUPA 730,157 895,436 895,436 725,934 725,934-18.93%
20,207,407 18,992,284 20,028,589 19,825,479 19,825,479-1.01%Total All Funds
Fire Suppression & Other Emergency Services
17,837,364 16,498,857 17,295,551 17,316,243 17,316,2430.12%
Fire Prevention 1,185,294 1,091,746 1,094,606 1,254,193 1,254,19314.58%Disaster Preparedness 250,355 262,911 357,496 302,392 302,392-15.41%Certified Unified Program Agency (CUPA)
934,394 1,138,770 1,280,936 952,651 952,651-25.63%
20,207,407 18,992,284 20,028,589 19,825,479 19,825,479-1.01%Total All Programs

Fire Fire Suppression & Other Emergency Services
Activities / Functions
128
The Fire Suppression Services Division of the Fire Department provides both emergency and non-emergency responses to calls for service from the residents of the City. A total of 84% of Fire Department staffing is assigned to this division. The Fire Suppression Division provides these emergency and nonemergency response services through seven strategically located fire stations throughout the City staffed by 28 firefighters on a 24-hour basis. Emergency responses account for the majority (93.5%) of the calls for service for the Fire Suppression Division. Emergency responses include: fire suppression to structural and wildland fires, emergency medical services (EMS), traffic accidents, surf rescue, abatement of hazardous conditions, responses to urban search and rescue incidents, and hazardous materials incidents. The Fire Suppression Division is a member of the Regional Hazardous Materials Response Team, which is a response team of all the fire agencies in Ventura County that handle hazardous materials incidents. The Fire Suppression Division also participates in the statewide Master Mutual Aid system that provides fire suppression services to other agencies for large scale fires such as wildland fires. The Mutual Aid/Automatic Aid system is also used to bring additional resources into the City to augment existing fire suppression resources. This type of call accounts for approximately 1% of the call volume. Nonemergency responses include providing assistance to residents in areas such as: assistance to elderly or handicapped residents from falls, removal of water due to leaking pipes in residential properties and vehicle or residential lockouts. The Fire Suppression Division also provides assistance to other agencies within the City such as the Police Department. A typical assistance call would be to provide ladders for access to roofs of buildings for police investigations. This type of call accounts for 1.5% of the call volume.

%Change
Fire Fire Suppression & Other Emergency Services
129
Expenses by Category
Expenses by Fund %Change
Personnel
2009-10Actual
2010-11Budget
2010-11Revised
2011-12Recommended
2012-13Proposed
2009-10Actual
2010-11Budget
2010-11Revised
2011-12Recommended
2012-13Proposed
2009-10Actual
2010-11Budget
2010-11Revised
2011-12Recommend
2012-13Proposed
Salaries and Benefits 15,191,961 14,910,333 14,704,779 15,815,500 15,815,5007.55%Other Expenses 2,645,403 1,588,524 2,590,772 1,500,743 1,500,743-42.07%Total Expenses 17,837,364 16,498,857 17,295,551 17,316,243 17,316,2430.12%
General Fund 13,447,469 13,293,486 13,219,308 13,665,746 13,665,7463.38%Public Safety Retirement 3,282,160 3,205,371 3,076,244 3,650,497 3,650,49718.67%Other State Grants 155,047 0 -1 0 0-100.00%2009 Lease Purchase Equipment 952,688 0 1,000,000 0 0-100.00%
17,837,364 16,498,857 17,295,551 17,316,243 17,316,2430.12%Total All Funds
Administrative Assistant (C) 1.00 1.00 1.00 1.00 1.00Administrative Secretary I/II 0.50 0.50 0.50 0.50 0.50Assistant Fire Chief 0.95 0.95 0.95 0.95 0.95EMS Coordinator 1.00 1.00 1.00 1.00 1.00Fire Battalion Chief 3.80 3.80 3.80 3.90 3.90Fire Captain 24.00 24.00 24.00 25.00 25.00Fire Chief 1.00 1.00 1.00 0.95 0.95Fire Engineer 24.00 24.00 24.00 24.00 24.00Firefighter 33.00 33.00 33.00 33.00 33.00
89.25 89.25 89.25 90.30 90.30Total Personnel

Fire Fire Prevention
Activities / Functions
130
The Oxnard Fire Prevention Division makes Oxnard a safer place to live, work, and visit through implementation of effective programs designed to increase fire, life, and environmental safety. Fire Prevention provides numerous services including new development plans review and approval, new construction and fire prevention inspections, fire and arson investigation, public education, and issuing of temporary use permits. Plan review and approval of new developments start with Fire Prevention members attending the Development Advisory Committee, Small Business Plan Check Committee, and meeting with contractors and developers. Plans are revised and submitted for approval. Once the plans are approved, they are inspected to verify correct installation. The Fire Prevention Division completed a reorganization of business fire prevention inspections because of major changes in the California Fire Code. Business fire inspections are conducted to help companies and their employees with fire education and safety. Uncorrected violations of the California Fire Code can result in a citation for each offense. The Fire Prevention Division is responsible for business, residential care facility, and temporary use permit inspections. The Fire Prevention Division completes fire and arson investigations only after Fire Suppression is unable to establish origin and cause, an injury has occurred, there is a large loss, or a crime has occurred. These investigations only account for a portion of the fires in the city. If a juvenile is responsible for a fire, they are counseled in the Juvenile Fire Setters Counseling Program. Oxnard has the only active Juvenile Fire Setters program in the county. Public Education is a large part of the Fire Prevention Division. Class topics range from school children learning home fire safety to training business employees in fire prevention and safety practices to informing the public of the duties of the Oxnard Fire Department. The Fire Prevention Division also provides assistance to other agencies within the City such as the Police Department, Development Services, Code Compliance, and the Water Resources Division. Typical assistance involves correcting building and safety violations, assisting in police investigations, and improving water distribution in the City.

%Change
Fire Fire Prevention
131
Expenses by Category
Expenses by Fund %Change
Personnel
2009-10Actual
2010-11Budget
2010-11Revised
2011-12Recommended
2012-13Proposed
2009-10Actual
2010-11Budget
2010-11Revised
2011-12Recommended
2012-13Proposed
2009-10Actual
2010-11Budget
2010-11Revised
2011-12Recommend
2012-13Proposed
Salaries and Benefits 1,065,247 978,785 978,785 1,125,996 1,125,99615.04%Other Expenses 120,047 112,961 115,821 128,197 128,19710.69%Total Expenses 1,185,294 1,091,746 1,094,606 1,254,193 1,254,19314.58%
General Fund 953,454 882,816 885,676 979,804 979,80410.63%Public Safety Retirement 231,840 208,930 208,930 274,389 274,38931.33%
1,185,294 1,091,746 1,094,606 1,254,193 1,254,19314.58%Total All Funds
Administrative Secretary I/II 0.50 0.50 0.50 0.50 0.50Assistant Fire Chief 0.05 0.05 0.05 0.00 0.00Fire Battalion Chief 1.00 1.00 1.00 1.00 1.00Fire Captain 1.00 1.00 1.00 1.00 1.00Fire Inspector 5.00 5.00 5.00 4.00 4.00Plans Examiner I/II 0.90 0.90 0.90 0.90 0.90
8.45 8.45 8.45 7.40 7.40Total Personnel

Fire Disaster Preparedness
Activities / Functions
132
The function of the Disaster Preparedness Division is to educate City residents and City employees of the realistic threat associated with both natural and manmade disasters, and to ensure that both groups know their personal and professional preparedness responsibilities, as well as methods to ensure their well-being. In the case of City employees, that includes preparing them to function as Disaster Service Workers, as defined by California Government Code. The Disaster Preparedness Division maintains the readiness of the city’s primary and alternate Emergency Operations Centers (EOC), as well as those who function therein during an emergency activation. A sampling of additional responsibilities includes: • Compliance with the National Incident Management System (NIMS), which ensures funding for pre- and post-disaster-related
expenses. • Development and maintenance of critical disaster partner agreements and relationships, • Administration of disaster tools such as WEB EOC and the REVERSE911 Notification System, • Choreographing Community Emergency Response Team (CERT) training programs, • Representing the city within the Operational area’s disaster preparedness community. The Disaster Preparedness Division works closely with all City departments and first responders to ensure enhanced response capabilities through joint training and customized disaster preparedness planning.

%Change
Fire Disaster Preparedness
133
Expenses by Category
Expenses by Fund %Change
Personnel
2009-10Actual
2010-11Budget
2010-11Revised
2011-12Recommended
2012-13Proposed
2009-10Actual
2010-11Budget
2010-11Revised
2011-12Recommended
2012-13Proposed
2009-10Actual
2010-11Budget
2010-11Revised
2011-12Recommend
2012-13Proposed
Salaries and Benefits 170,123 177,441 219,026 208,629 208,629-4.75%Other Expenses 80,232 85,470 138,470 93,763 93,763-32.29%Total Expenses 250,355 262,911 357,496 302,392 302,392-15.41%
General Fund 218,139 257,291 257,291 287,777 287,77711.85%Public Safety Retirement 5,606 5,620 5,620 14,615 14,615160.05%Other State Grants 26,610 0 94,585 0 0-100.00%
250,355 262,911 357,496 302,392 302,392-15.41%Total All Funds
Assistant Fire Chief 0.00 0.00 0.00 0.05 0.05Disaster Preparedness Coordinator 1.00 1.00 1.00 1.00 1.00Fire Battalion Chief 0.20 0.20 0.20 0.10 0.10Fire Captain 1.00 1.00 1.00 0.00 0.00Fire Chief 0.00 0.00 0.00 0.05 0.05
2.20 2.20 2.20 1.20 1.20Total Personnel

Fire Certified Unified Program Agency (CUPA)
Activities / Functions
134
The Certified Unified Program Agency (CUPA) is a local regulatory management program certified by the California Environmental Protection Agency. The CUPA program requires the administrative consolidation of six environmental program elements under one agency. The CUPA Program is under the direction of the CUPA Coordinator, whose immediate supervisor is the Fire Marshal. Regulatory inspections are conducted by four Fire Environmental Specialists (FES). The FES staff conducts routine inspections, public education, issues operating permits, and responds to hazardous materials incidents. The FES staff is responsible for the collection and coordinating disposal of the hazardous waste abandoned on City property. In addition, the CUPA program reviews development plans for new construction related to the storage and use of hazardous materials. The CUPA Program financially supports (10%) of the Fire Plans Examiner II position. The CUPA program elements consolidated under the Unified Program are as follows:
Hazardous Materials Business Plan
A business is required to establish and submit a business plan if the facility handles hazardous material equal to or greater than 55 gallons, 500 pounds or 200 cubic feet of any or applicable radioactive materials at any time during the year. The Business Plan chemical inventory reporting forms provide essential information to the City’s “first responders” of what hazardous materials are handled at the facility. Additionally, the establishment of a business plan satisfies both state and federal Community-Right-to-Know Act, which provides public access to what hazardous materials are handled in their community. There are currently 816 CUPA-permitted facilities in the City of Oxnard.
Hazardous Waste Generator Program
Businesses that generate, store or treat hazardous wastes in any amount are required to apply for a Hazardous Waste Generator Permit by completing the state-required forms. All generators must obtain an EPA number from the State Department of Toxic Substance Control. Waste is generally considered hazardous if it is ignitable, corrosive, toxic, reactive, or if it can be shown to be detrimental to health and/or the environment.
Tiered Permitting
If a business treats the onsite hazardous waste it generates by altering its physical, chemical or biological state, the business is subject to tiered permitting requirements. Businesses treating their hazardous waste may include plating shops, metal-etching shops, acid or alkaline chemical mixers, etc. Treatment methods include precipitation, evaporation, absorption, phase separation, distillation, neutralization, etc.
Underground Storage Tank Program
The CUPA inspects each underground hazardous materials storage tank facility annually to determine compliance with the state law. A storage tank system includes the tank itself, the associated piping, the monitoring system, and ancillary equipment. In addition to theannual CUPA operating permit, permits are also required to remove, install, or modify an UST system.
Aboveground Storage Tank Program
The Aboveground Petroleum Storage Act (APSA) includes the inspection of facilities subject to the Spill Prevention Countermeasure Control (SPCC) Plan. A facility is required to prepare a SPCC Plan if a single AST containing a petroleum-based product or the aggregate quantity of petroleum-based products in multiple ASTs exceeds 1,320 gallons. Examples of petroleum-based products are fuel, solvent, lubricants, used oil, etc.
California Accidental Release Prevention Program (CalARP)
The intent of the program is to prevent the release of materials that could cause harm to the public or the environment, and to ensure there are proper mitigation measures in place should a release occur. The regulated substances are either acutely toxic (such as chlorine, ammonia, sulfur dioxide, and hydrogen fluoride) or are highly flammable (such as propane, butane, hydrogen, and acetylene). A facility that utilizes over a specified threshold quantity of one of these regulated substances must prepare a Risk Management Plan (RMP).

%Change
Fire Certified Unified Program Agency (CUPA)
135
Expenses by Category
Expenses by Fund %Change
Personnel
2009-10Actual
2010-11Budget
2010-11Revised
2011-12Recommended
2012-13Proposed
2009-10Actual
2010-11Budget
2010-11Revised
2011-12Recommended
2012-13Proposed
2009-10Actual
2010-11Budget
2010-11Revised
2011-12Recommend
2012-13Proposed
Salaries and Benefits 806,278 984,679 999,780 805,346 805,346-19.45%Other Expenses 128,116 154,091 281,156 147,305 147,305-47.61%Total Expenses 934,394 1,138,770 1,280,936 952,651 952,651-25.63%
General Fund 7,030 10,000 10,000 8,900 8,900-11.00%Public Safety Retirement 185,835 233,334 233,334 217,817 217,817-6.65%Other State Grants 11,372 0 83,810 0 0-100.00%CUPA 730,157 895,436 895,436 725,934 725,934-18.93%
934,394 1,138,770 1,280,936 952,651 952,651-25.63%Total All Funds
CUPA Coordinator 1.00 1.00 1.00 1.00 1.00Fire Environmental Specialist I/II 5.00 5.00 5.00 4.00 4.00Plans Examiner I/II 0.10 0.10 0.10 0.10 0.10
6.10 6.10 6.10 5.10 5.10Total Personnel


Housing


%Change
Expenses by Category
Housing Department Summary
137
%Change
%Change
Expenses by Fund
Expenses by Program 2009-10Actual
2010-11Budget
2010-11Revised
2011-12Recommended
2012-13Proposed
2009-10Actual
2010-11Budget
2010-11Revised
2011-12Recommended
2012-13Proposed
2009-10Actual
2010-11Budget
2010-11Revised
2011-12Recommended
2012-13Proposed
Salaries and Benefits 6,023,666 7,051,137 7,081,975 7,001,877 7,001,877-1.13%Other Expenses 23,293,293 22,507,902 30,694,959 19,993,960 19,953,734-34.86%Total Expenses 29,316,959 29,559,039 37,776,934 26,995,837 26,955,611-28.54%
General Fund 283,893 267,194 267,194 248,696 248,696-6.92%State Housing Grants 94,500 0 1,440,000 0 0-100.00%Other State Grants 1,784,918 0 3,230,359 0 0-100.00%ARRA Grants 176,131 6,015 948,864 0 0-100.00%Emergency Shelter Grant 123,399 120,131 126,476 166,716 166,71631.82%HUD HOME Federal Entitlement 1,348,280 1,199,804 2,434,259 1,255,459 1,215,233-48.43%CDBG Federal Entitlement 865,305 1,037,340 1,037,340 970,460 970,460-6.45%Affordable Housing Assistance 417,384 0 1,363,887 0 0-100.00%HUD Housing 24,223,149 26,928,555 26,928,555 24,354,506 24,354,506-9.56%
29,316,959 29,559,039 37,776,934 26,995,837 26,955,611-28.54%Total All Funds
Public Housing 6,940,317 9,020,063 9,020,063 6,870,257 6,870,257-23.83%Rental Assistance 17,282,832 17,908,492 17,908,492 17,484,249 17,484,249-2.37%Affordable Housing Assistance 1,461,741 736,706 7,126,867 842,712 802,486-88.18%Housing Rehabilitation 2,385,261 875,351 1,667,945 825,000 825,000-50.54%Homeless Assistance 634,992 359,086 1,394,226 358,498 358,498-74.29%Mobilehome Rent Stabilization 139,710 141,922 141,922 138,395 138,395-2.49%Fair Housing 59,766 48,000 48,000 48,000 48,0000.00%Grants Administration 412,340 469,419 469,419 428,726 428,726-8.67%
29,316,959 29,559,039 37,776,934 26,995,837 26,955,611-28.54%Total All Programs

Housing Public Housing
Activities / Functions
138
This program provides decent, safe, attractive, sanitary, and well-maintained housing for eligible low- and very low-income families. Included in the overall program is grant funding for the modernization of the public housing units and for social service programs for the residents of public housing. Public Housing Program
• Administer, manage and maintain 780 units of public housing located throughout the City • Assess eligibility of prospective tenants from a waiting list of more than 2000 applications. Assessment includes criminal
background checks, home visits, and income verifications. • Leasing of units to eligible applicants • Annual review of family composition and income for every tenant • Monitor and assess community service requirement for eligible tenants • Inspection of all units annually for Uniform Physical Conditions Standards through annual onsite inspections • Administer the Family Self Sufficiency program which allows eligible participants to earn savings in an escrow account for
setting and achieving approved goals for economic sufficiency • Collect rents and enforce lease agreement provisions • Reporting as required by HUD • Monitor and adapt to changes in regulations and funding as required by Congress and Department of Housing and Urban
Development (HUD) • Coordinate and prepare for independent financial and compliance audits, as well as HUD financial and operational audits
Capital Fund Program
• Assess capital needs for the public housing • Plan and implement capital improvement projects • Reporting as required by HUD on a monthly, semiannually and annual basis • Prepare long-term assessment of Public Housing stock
Resident Initiatives
• Provide various economic self-sufficiency programs to public housing residents such as childcare licensing, build your own computer, GED programs, media internships, and many more
• Maintain and support resident computer labs located throughout the public housing locations • Operate Barrio Productions, a media internship program • Provide youth development programs such as after-school tutoring and support various youth organizations (Girl Scouts,
AYSO, etc.) These programs operate well, provided appropriate funding levels are established by Congressional appropriations and HUD allocation.

%Change
Housing Public Housing
139
Expenses by Category
Expenses by Fund %Change
Personnel
2009-10Actual
2010-11Budget
2010-11Revised
2011-12Recommended
2012-13Proposed
2009-10Actual
2010-11Budget
2010-11Revised
2011-12Recommended
2012-13Proposed
2009-10Actual
2010-11Budget
2010-11Revised
2011-12Recommend
2012-13Proposed
Salaries and Benefits 3,682,203 4,527,315 4,527,315 4,390,082 4,390,082-3.03%Other Expenses 3,258,114 4,492,748 4,492,748 2,480,175 2,480,175-44.80%Total Expenses 6,940,317 9,020,063 9,020,063 6,870,257 6,870,257-23.83%
HUD Housing 6,940,317 9,020,063 9,020,063 6,870,257 6,870,257-23.83%6,940,317 9,020,063 9,020,063 6,870,257 6,870,257-23.83%Total All Funds
Account Clerk I/II 1.05 1.05 2.00 2.00 2.00Account Clerk III 1.55 1.55 1.55 1.55 1.55Accountant I/II 1.00 1.00 1.05 1.05 1.05Administrative Secretary III 0.80 0.80 1.30 1.30 1.30Administrative Technician 1.00 1.00 1.00 1.00 1.00Computer Network Engineer III 0.75 0.75 0.72 0.72 0.72Facilities Maintenance Worker I/II 7.00 7.00 7.00 7.00 7.00Groundsworker I/II 5.00 5.00 4.00 4.00 4.00Housing Contract Administrator 1.00 1.00 1.00 1.00 1.00Housing Director 0.30 0.30 0.30 0.30 0.30Housing Engineer 1.00 1.00 1.00 1.00 1.00Housing Financial Officer 0.55 0.55 0.55 0.55 0.55Housing Maintenance Superintendent 1.00 1.00 1.00 1.00 1.00Housing Maintenance Supervisor 3.00 3.00 3.00 3.00 3.00Housing Modernization Superintendent 1.00 1.00 1.00 1.00 1.00Housing Program Supervisor 1.50 1.50 2.00 2.00 2.00Housing Programs Manager 0.55 0.55 1.00 1.00 1.00Housing Specialist I/II 5.00 5.00 6.00 6.00 6.00Management Accountant/Auditor 0.80 0.80 0.95 0.95 0.95Management Analyst I/II/III 3.85 3.85 2.35 2.35 2.35Office Assistant I/II 5.15 5.15 6.65 6.65 6.65Project Developer 1.00 1.00 0.00 0.00 0.00Resident Services Assistant 2.00 2.00 2.00 2.00 2.00Resident Services Coordinator 1.00 1.00 1.00 1.00 1.00Senior Groundsworker 1.00 1.00 1.00 1.00 1.00Senior Housing Maintenance Worker 2.00 2.00 2.00 2.00 2.00Senior Housing Specialist 3.00 3.00 3.00 3.00 3.00
52.85 52.85 54.42 54.42 54.42Total Personnel

Housing Rental Assistance
Activities / Functions
140
This program develops and promotes the availability of affordable, decent, safe, and sanitary housing for eligible low- and moderate-income persons through rental assistance. The regular activities and functions of the program include the following:
• Administer the rental assistance program for up to 1684 individuals and families in the private rental market • Assess eligibility of incoming participants from a waiting list of over 2000 applications. Assessment includes criminal
background checks, home visits and income verification • Determine reasonableness of rents to landlords through communitywide and neighborhood rent surveys • Perform annual review of family composition and income for every participating family • Inspection and assessment of Housing Quality Standards through annual onsite inspections • Administer the Family Self-Sufficiency program which allows eligible participants to earn savings in an escrow account for
setting and achieving approved goals for economic sufficiency • Process and pay over 600 landlords monthly • Monitor, pay, bill, and collect payments to/from other housing authorities for participants moving to/from other jurisdictions • Reporting as required by the Department of Housing and Urban Development (HUD) monthly, quarterly and annually • Monitor and adapt to changing requirements and funding of the program at the Congressional and Departmental (HUD) level• Coordinate and prepare for independent financial and compliance audits, as well as HUD financial and operational audits • Negotiate contracts with landlords that agree to lease units under the Section 8 program • Monitor compliance with Housing Assistance Payments Contract • Terminate participation from the program for noncompliance with program rules • Conduct administrative hearings for participants who have been terminated from the program • Work with District Attorney’s Office and the HUD Inspector General’s Office on program enforcement issues
This program operates well, provided appropriate funding levels are established by Congressional appropriations and HUD allocation.

%Change
Housing Rental Assistance
141
Expenses by Category
Expenses by Fund %Change
Personnel
2009-10Actual
2010-11Budget
2010-11Revised
2011-12Recommended
2012-13Proposed
2009-10Actual
2010-11Budget
2010-11Revised
2011-12Recommended
2012-13Proposed
2009-10Actual
2010-11Budget
2010-11Revised
2011-12Recommend
2012-13Proposed
Salaries and Benefits 1,347,800 1,485,152 1,485,152 1,569,708 1,569,7085.69%Other Expenses 15,935,032 16,423,340 16,423,340 15,914,541 15,914,541-3.10%Total Expenses 17,282,832 17,908,492 17,908,492 17,484,249 17,484,249-2.37%
HUD Housing 17,282,832 17,908,492 17,908,492 17,484,249 17,484,249-2.37%17,282,832 17,908,492 17,908,492 17,484,249 17,484,249-2.37%Total All Funds
Account Clerk I/II 0.95 0.95 0.00 0.00 0.00Account Clerk III 0.45 0.45 0.45 0.45 0.45Accountant I/II 1.00 1.00 0.95 0.95 0.95Administrative Secretary III 1.05 1.05 0.55 0.55 0.55Building Inspector I 0.00 0.00 0.82 0.82 0.82Compliance Services Manager 0.00 0.00 0.00 0.06 0.06Computer Network Engineer III 0.25 0.25 0.28 0.28 0.28Housing Director 0.55 0.55 0.55 0.55 0.55Housing Financial Officer 0.45 0.45 0.45 0.45 0.45Housing Inspector 2.00 2.00 1.00 1.00 1.00Housing Program Supervisor 1.50 1.50 1.00 1.00 1.00Housing Programs Manager 0.45 0.45 0.00 0.00 0.00Housing Specialist I/II 8.00 8.00 7.00 7.00 7.00Management Accountant Auditor 0.20 0.20 0.05 0.05 0.05Management Analyst III 0.15 0.15 0.15 0.15 0.15Office Assistant I/II 3.85 3.85 3.35 3.35 3.35Senior Housing Specialist 1.00 1.00 2.00 2.00 2.00
21.85 21.85 18.60 18.66 18.66Total Personnel

Housing Affordable Housing Assistance
Activities / Functions
142
This program administers the City and Community Development Commission (CDC) programs relating to homebuyer assistance and loans to nonprofit housing corporations for the development of sales and rental housing. It also administers various state-funded programs. Specific activity areas include: City Programs • Homebuyers Assistance Program (HOME) • Nonprofit gap financing (in-lieu fees/HOME) • CHDO Set-Aside (HOME) • CHDO Development (HOME) • Mobilehome Replacement (HOME) State Programs • Housing Trust Fund ($1 million pending) • BEGIN-River Park ($3 million pending) • CalHOME-Homeownership development ($1.4 million) CDC Programs • Southwinds Homebuyer’s Program • Mobilehome Replacement (Oxnard Mobilehome Lodge only) • AERO Homebuyers program Administration Duties • Accept and review applications for all programs • Approve/decline applications • Prepare and record loan documents (Deed, Note, Agreement) • Prepare and record Price and Refinancing Restrictions document • Request and wire grants • Approve/decline subordination requests • Process payoff demands • Prepare reconveyances • Provide pricing on restricted units • Process CalHOME Documents • Monitor and enforce compliance with program requirements • Prepare and submit grant applications • Monitor availability of fund • Work with Planning Division on payment of in-lieu fees or development of affordable units

%Change
Housing Affordable Housing Assistance
143
Expenses by Category
Expenses by Fund %Change
Personnel
2009-10Actual
2010-11Budget
2010-11Revised
2011-12Recommended
2012-13Proposed
2009-10Actual
2010-11Budget
2010-11Revised
2011-12Recommended
2012-13Proposed
2009-10Actual
2010-11Budget
2010-11Revised
2011-12Recommend
2012-13Proposed
Salaries and Benefits 70,729 114,636 114,636 23,000 23,000-79.94%Other Expenses 1,391,012 622,070 7,012,231 819,712 779,486-88.31%Total Expenses 1,461,741 736,706 7,126,867 842,712 802,486-88.18%
State Housing Grants 94,500 0 1,440,000 0 0-100.00%Other State Grants 59,442 0 2,940,558 0 0-100.00%HUD HOME Federal Entitlement 890,415 736,706 1,382,422 842,712 802,486-39.04%Affordable Housing Assistance 402,390 0 0 0 0
1,461,741 736,706 7,126,867 842,712 802,486-88.18%Total All Funds
Housing Rehabilitation Program Manager 0.60 0.60 0.05 0.05 0.05Office Assistant I/II 0.45 0.45 0.05 0.05 0.05Rehabilitation Construction Specialist I/II 0.05 0.05 0.05 0.05 0.05Rehabilitation Loan Assistant 0.45 0.45 0.05 0.05 0.05Rehabilitation Loan Specialist 0.45 0.45 0.05 0.05 0.05
2.00 2.00 0.25 0.25 0.25Total Personnel

Housing Housing Rehabilitation
Activities / Functions
144
This program administers the City and Community Development Commission (CDC) loan and grant programs relating to housing rehabilitation. Specific activity areas include: City Programs • Citywide Home Repair Program • Deferred Loan Program • Mobilehome Repair Program CDC Programs • Southwinds Rehabilitation Program • Southwinds Security Lighting and Fencing Program • HERO Rehabilitation Program Administration Duties • Accept and review applications for the repair and rehab programs • Approve/decline applications • Inspect rehabilitation and nonprofit units • Coordinate mobilehome installations • Provide quality control inspections for Section 8 units (approximately 30 per year) • Process applications through Loan Review Committee • Prepare and record loan documents (Deed, Note, Agreement) • Request funds and forward to escrow • Process payments through escrow • Approve/decline subordination requests • Process payoff demands • Prepare reconveyances

%Change
Housing Housing Rehabilitation
145
Expenses by Category
Expenses by Fund %Change
Personnel
2009-10Actual
2010-11Budget
2010-11Revised
2011-12Recommended
2012-13Proposed
2009-10Actual
2010-11Budget
2010-11Revised
2011-12Recommended
2012-13Proposed
2009-10Actual
2010-11Budget
2010-11Revised
2011-12Recommend
2012-13Proposed
Salaries and Benefits 312,238 330,950 343,200 428,556 428,55624.87%Other Expenses 2,073,023 544,401 1,324,745 396,444 396,444-70.07%Total Expenses 2,385,261 875,351 1,667,945 825,000 825,000-50.54%
Other State Grants 1,725,476 0 289,801 0 0-100.00%HUD HOME Federal Entitlement 291,469 410,351 913,144 360,000 360,000-60.58%CDBG Federal Entitlement 368,316 465,000 465,000 465,000 465,0000.00%
2,385,261 875,351 1,667,945 825,000 825,000-50.54%Total All Funds
Housing Rehabilitation Program Manager 0.25 0.25 0.80 0.80 0.80Management Analyst I/II 0.00 0.00 0.50 0.50 0.50Office Assistant I/II 0.40 0.40 0.80 0.80 0.80Rehabilitation Construction Specialist I/II 0.80 0.80 0.80 0.80 0.80Rehabilitation Loan Assistant 0.40 0.40 0.80 0.80 0.80Rehabilitation Loan Specialist 0.40 0.40 0.80 0.80 0.80
2.25 2.25 4.50 4.50 4.50Total Personnel

Housing Homeless Assistance
Activities / Functions
146
This program administers all federal and state grant funds received and dispersed to providers of homeless activities throughout the city, and other parts of the county, including Ventura and Camarillo; and prepares all annual reports accordingly. Grants received and monitored: • US Department of Housing and Urban Development Continuum of Care • HUD Emergency Shelter Grant • State CDBG • HUD Homeless Prevention and Rapid Re-housing Program (HPRP - 3 years) Agencies Monitored • Community Action of Ventura County One Stop • County of Ventura Human Services (RAIN Project and HPRP) • County of Ventura (Oxnard Homeless Outreach Program) • Khepera House • Project Understanding • United Way of Ventura County • Catholic Charities • St. Vincent de Paul (Winter Warming Shelter) • Turning Point Foundation • Community Action of Ventura County • City of Oxnard Family Investment Center Administration Duties • Complete Annual Continuum of Care Grant Application • Complete Annual Performance Reviews for each Continuum of Care sub-recipient • Complete Annual Performance Reviews for each Emergency Shelter Grant sub-recipient • Provide Technical Assistance to all sub-recipients • Review and approve all bills submitted to Grants Administration for eligible expenditures • Monitor each agency quarterly to ensure mandated activities are being carried out and goals are being met • Provide staff support to the City’s Commission on Homelessness • Prepare annual Requests for Proposals and review submitted applications with regards to federal and state funding notifications
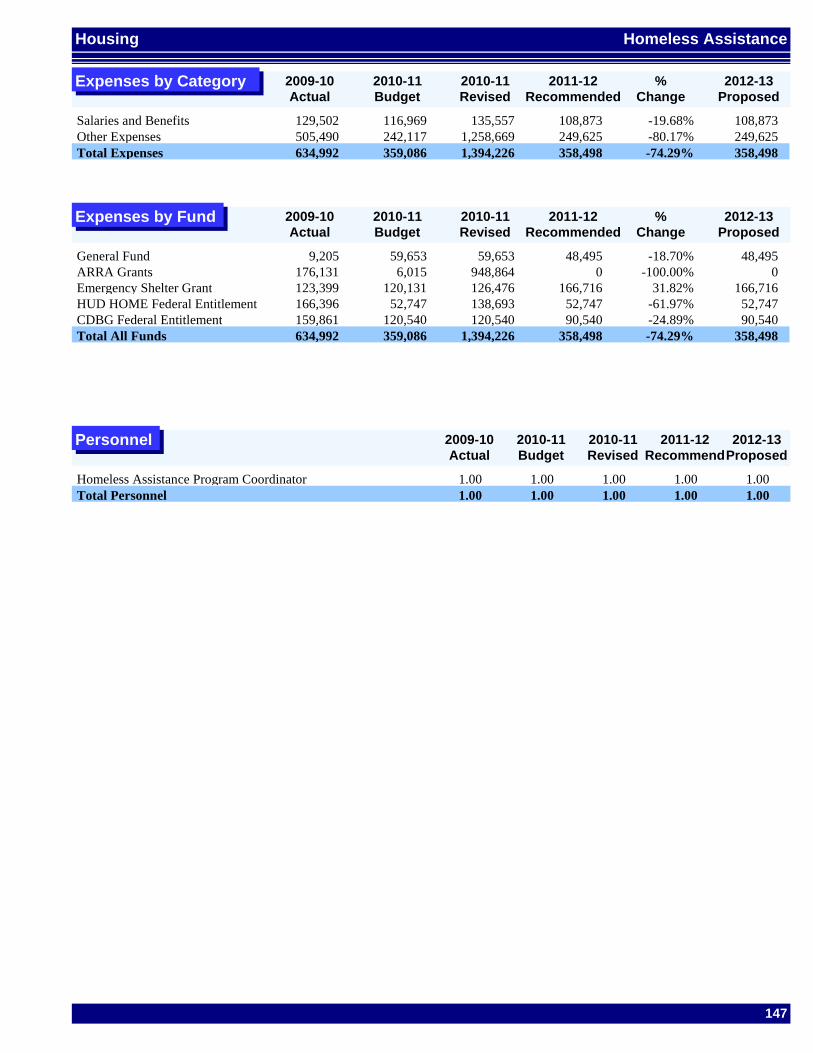
%Change
Housing Homeless Assistance
147
Expenses by Category
Expenses by Fund %Change
Personnel
2009-10Actual
2010-11Budget
2010-11Revised
2011-12Recommended
2012-13Proposed
2009-10Actual
2010-11Budget
2010-11Revised
2011-12Recommended
2012-13Proposed
2009-10Actual
2010-11Budget
2010-11Revised
2011-12Recommend
2012-13Proposed
Salaries and Benefits 129,502 116,969 135,557 108,873 108,873-19.68%Other Expenses 505,490 242,117 1,258,669 249,625 249,625-80.17%Total Expenses 634,992 359,086 1,394,226 358,498 358,498-74.29%
General Fund 9,205 59,653 59,653 48,495 48,495-18.70%ARRA Grants 176,131 6,015 948,864 0 0-100.00%Emergency Shelter Grant 123,399 120,131 126,476 166,716 166,71631.82%HUD HOME Federal Entitlement 166,396 52,747 138,693 52,747 52,747-61.97%CDBG Federal Entitlement 159,861 120,540 120,540 90,540 90,540-24.89%
634,992 359,086 1,394,226 358,498 358,498-74.29%Total All Funds
Homeless Assistance Program Coordinator 1.00 1.00 1.00 1.00 1.001.00 1.00 1.00 1.00 1.00Total Personnel

Housing Mobilehome Rent Stabilization
Activities / Functions
148
More than 2800 households in Oxnard reside in the 22 privately owned mobilehome parks in the City. Nearly all own the mobilehome and pay a monthly space rent to the owner of the park. In 1982, the City Council adopted the Mobilehome Rent Stabilization Ordinance, which has the twin goals to (1) protect mobilehome owners from excessive rents and protect their investment in their homes; and (2) provide a fair return to park owners. The Mobilehome Rent Stabilization Program implements this system of administrative law by:
• Processing applications for space rent increases. • Conducting evidentiary hearings when homeowners challenge space rent increases or when park owner audits are required. • Providing support to the five-member Mobilehome Park Rent Review Board. • Providing outreach and response to public inquiries from mobilehome park residents, managers, and owners.
Additionally, the program works closely with the Office of the City Attorney and Special Counsel to preserve the stability and integrity of the Rent Stabilization System, including civil litigation defense in those few cases when a decision of the Board is challenged in court.

%Change
Housing Mobilehome Rent Stabilization
149
Expenses by Category
Expenses by Fund %Change
Personnel
2009-10Actual
2010-11Budget
2010-11Revised
2011-12Recommended
2012-13Proposed
2009-10Actual
2010-11Budget
2010-11Revised
2011-12Recommended
2012-13Proposed
2009-10Actual
2010-11Budget
2010-11Revised
2011-12Recommend
2012-13Proposed
Salaries and Benefits 111,631 110,578 110,578 111,870 111,8701.17%Other Expenses 28,079 31,344 31,344 26,525 26,525-15.37%Total Expenses 139,710 141,922 141,922 138,395 138,395-2.49%
General Fund 139,710 141,922 141,922 138,395 138,395-2.49%139,710 141,922 141,922 138,395 138,395-2.49%Total All Funds
Compliance Services Manager 0.91 0.91 0.91 0.91 0.910.91 0.91 0.91 0.91 0.91Total Personnel

Housing Fair Housing
Activities / Functions
150
As a recipient of Community Development Block Grant (CDBG) funds, the City is required to implement a program to affirmatively further Fair Housing access for Oxnard residents and homeseekers. The Fair Housing program:
• Administers and monitors the City’s service contract with the Housing Rights Center.
• Coordinates response to resident inquiries related to landlord-tenant issues and potential housing discrimination claims.
• Provides support in the field of fair housing to Housing Department staff and programs by:
Training and case intake for recipients of housing assistance under the public housing and Section 8 rent subsidy programs
Monitoring compliance by the Housing Authority with Section 504 of the Housing and Community Development Act.
• The program also oversees the production of the HUD-mandated “Analysis of Impediments to Fair Housing,” which must be updated every five years. The most recent AI update was adopted by the Oxnard City Council in May 2010.

%Change
Housing Fair Housing
151
Expenses by Category
Expenses by Fund %Change
Personnel
2009-10Actual
2010-11Budget
2010-11Revised
2011-12Recommended
2012-13Proposed
2009-10Actual
2010-11Budget
2010-11Revised
2011-12Recommended
2012-13Proposed
2009-10Actual
2010-11Budget
2010-11Revised
2011-12Recommend
2012-13Proposed
Salaries and Benefits 12,193 12,137 12,137 12,278 12,2781.16%Other Expenses 47,573 35,863 35,863 35,722 35,722-0.39%Total Expenses 59,766 48,000 48,000 48,000 48,0000.00%
CDBG Federal Entitlement 59,766 48,000 48,000 48,000 48,0000.00%59,766 48,000 48,000 48,000 48,0000.00%Total All Funds
Compliance Services Manager 0.09 0.09 0.09 0.03 0.030.09 0.09 0.09 0.03 0.03Total Personnel

Housing Grants Administration
Activities / Functions
152
• Review and monitor grant regulations, policies, contracts, amendments and other documents to ensure compliance. • Prepare invoices/claims for reimbursement on a monthly/quarterly/semiannual basis and deposit reimbursements when received. • Prepare monthly adjusting journal entries to reflect eligible grant expenditures, appropriate match (if applicable) and grant revenue
recognition. • Prepare monthly grant fund/account reconciliations to ensure proper recording of grant revenue, expenditures, cash and grant
receivables. • Prepare grant financial statements, schedules, status reports and other miscellaneous documents as required by grantor agency. • Prepare analysis and worksheets in preparation for audit examination pursuant to Generally Accepted Accounting Principles
(GAAP) and Generally Accepted Auditing Standards (GAAS). • Participate in audits performed by various grantor agencies, provide information requested and coordinate with other staff as
necessary. • Coordinate the City’s compliance with Federal and State prevailing wage requirements for capital improvement projects including
consultant selection and monitoring of the agreement. • Prepare the multi-year Comprehensive and Annual Action Plans and the Consolidated Annual Performance and Evaluation Report.• Coordinate environmental review processing for HUD-issued grants including consultant selection, contract management and
nonprofit project clearances.

%Change
Housing Grants Administration
153
Expenses by Category
Expenses by Fund %Change
Personnel
2009-10Actual
2010-11Budget
2010-11Revised
2011-12Recommended
2012-13Proposed
2009-10Actual
2010-11Budget
2010-11Revised
2011-12Recommended
2012-13Proposed
2009-10Actual
2010-11Budget
2010-11Revised
2011-12Recommend
2012-13Proposed
Salaries and Benefits 357,370 353,400 353,400 357,510 357,5101.16%Other Expenses 54,970 116,019 116,019 71,216 71,216-38.62%Total Expenses 412,340 469,419 469,419 428,726 428,726-8.67%
General Fund 134,978 65,619 65,619 61,806 61,806-5.81%CDBG Federal Entitlement 277,362 403,800 403,800 366,920 366,920-9.13%
412,340 469,419 469,419 428,726 428,726-8.67%Total All Funds
Accounting Manager 0.00 0.00 1.00 1.00 1.00Grants Coordinator 0.00 0.00 1.00 1.00 1.00Grants Specialist I/II 0.00 0.00 1.00 1.00 1.00
0.00 0.00 3.00 3.00 3.00Total Personnel


Human Resources


%Change
Expenses by Category
Human Resources Department Summary
155
%Change
%Change
Expenses by Fund
Expenses by Program 2009-10Actual
2010-11Budget
2010-11Revised
2011-12Recommended
2012-13Proposed
2009-10Actual
2010-11Budget
2010-11Revised
2011-12Recommended
2012-13Proposed
2009-10Actual
2010-11Budget
2010-11Revised
2011-12Recommended
2012-13Proposed
Salaries and Benefits 1,279,687 1,334,671 1,236,436 1,341,404 1,341,4048.49%Other Expenses 8,854,002 6,292,200 6,352,403 6,249,098 6,249,098-1.63%Total Expenses 10,133,689 7,626,871 7,588,839 7,590,502 7,590,5020.02%
General Fund 1,178,700 1,244,938 1,146,703 1,171,903 1,171,9032.20%Workers Compensation 8,954,989 6,381,933 6,442,136 6,418,599 6,418,599-0.37%
10,133,689 7,626,871 7,588,839 7,590,502 7,590,5020.02%Total All Funds
Human Resources 1,178,700 1,244,938 1,146,703 1,171,903 1,171,9032.20%Workers' Compensation 8,730,534 6,026,644 6,026,644 6,069,886 6,069,8860.72%Safety Management 224,455 355,289 415,492 348,713 348,713-16.07%
10,133,689 7,626,871 7,588,839 7,590,502 7,590,5020.02%Total All Programs

Human Resources Human Resources
Activities / Functions
156
The Human Resources Department is dedicated to serve the City of Oxnard employees by providing excellent customer service in all areas, including Benefits, Training, Employee Relations, Labor Relations, Workers Compensation, Safety and Wellness. As well, the Human Resources Department shall continue to attract competent, effective and diverse staff.
Recruitment, Classification & Compensation
To provide an equitable compensation plan, a clear and market compatible classification plan and to recruit the best workforce possible to meet the City’s needs to best serve its residents.
• Align the City’s classification structure, which will update job descriptions for all employee groups. • Create a succession plan that aligns with the City’s vision, as well as organization and business needs. • Update current employee appreciation events to honor and acknowledge the service provided by the City’s excellent employees. • Research the current City compensation structure to determine both internal and external market positions.
Human Resources Benefit Program
The Human Resources Benefits Program is committed to providing exceptional customer service to all City of Oxnard employees. Our focus is to increase the accessibility of the benefits staff to all departments and to provide staff with the informative tools that will assist them in making more informed decisions regarding their Benefit Plans.
Develop a “Benefits Newsletter” that will provide staff with benefit updates and / or new legislative changes that may impact their benefits, Update Benefits intranet/ website, Coordinate Annual Wellness Fair.
Develop an Online Benefits Portal that will be located on the intranet that will provide Supervisors and Managers with one-stop centralized access to various benefit services such as:
• City of Oxnard Process for: • How to: • Resources: • Forms & Tools: • Policies & Guidelines
Develop an on online Training and Development catalog for Supervisors and staff i.e. Learn at lunch workshops, Wellness workshops and Required mandatory benefits training
Organizational Development & Training
The Human Resources Training program will provide a broad range of training tools to Managers and staff. These tools will focus on practical techniques that have a positive impact on City-wide organizational development and will serve to enhance the employee’s skills.
• Organizational Development: Developing quantifiable measures of the organization’s effectiveness, collaborating with Executives and Managers to identify areas of improvement and designing and implementing key interventions to enhance organizational performance.
• Skills Development: Assessing the developmental needs of Managers and employees, then providing learning activities to meet these needs.
• Train Managers on Understanding the MOU in the areas of: Performance Evaluations, Disciplinary, Actions, Response to Grievances, Progressive Discipline.
• Career Development: Providing career planning and career development activities for individuals and groups to maximize their professional development and value to the organization.
• Management Training: Provide Managers with an understanding of the American Disabilities Act; when it applies and the appropriate steps toward providing employees with Reasonable Accommodation.

%Change
Human Resources Human Resources
157
Expenses by Category
Expenses by Fund %Change
Personnel
2009-10Actual
2010-11Budget
2010-11Revised
2011-12Recommended
2012-13Proposed
2009-10Actual
2010-11Budget
2010-11Revised
2011-12Recommended
2012-13Proposed
2009-10Actual
2010-11Budget
2010-11Revised
2011-12Recommend
2012-13Proposed
Salaries and Benefits 910,230 961,384 863,149 928,133 928,1337.53%Other Expenses 268,470 283,554 283,554 243,770 243,770-14.03%Total Expenses 1,178,700 1,244,938 1,146,703 1,171,903 1,171,9032.20%
General Fund 1,178,700 1,244,938 1,146,703 1,171,903 1,171,9032.20%1,178,700 1,244,938 1,146,703 1,171,903 1,171,9032.20%Total All Funds
Administrative Secretary I/II (C) 2.00 2.00 2.00 2.00 2.00Administrative Technician (C) 1.00 1.00 1.00 0.00 0.00Assistant City Manager 0.20 0.20 0.20 0.20 0.20Employee Relations Coordinator 1.00 1.00 1.00 0.50 0.50Human Resources Director 1.00 1.00 1.00 1.00 1.00Human Resources Manager 1.00 1.00 1.00 1.00 1.00Human Resources Technician 1.00 1.00 1.00 1.00 1.00Recruitment Supervisor 1.00 1.00 1.00 1.00 1.00Sr. Benefits Coordinator 1.00 1.00 1.00 1.00 1.00
9.20 9.20 9.20 7.70 7.70Total Personnel

Human Resources Workers' Compensation
Activities / Functions
158
The City of Oxnard’s Workers’ Compensation Division is designed to giving exceptional customer service to the City’s injured workers and to provide them with prompt benefits as required under the California Worker’s Compensation Law. The Workers’ Compensation Division also has a fiduciary duty to the City to have a cost-efficient program and at the same time provide all benefits to cure and relieve the effects of an on-the-job injury. • Establish rapport with City employees who are injured by improving initial contact upon notification of an injury. Return calls to
employees within 24 hours whenever possible and provide educated explanation to their concerns. • Continue to scrutinize and analyze our administrator’s work to ensure we get the best service possible and to meet the mandated
deadlines required. Assist them in whatever way possible to keep our claims cost in check. Stress to our administrators the importance of constant communication with our injured worker so that they know how their claims are progressing and what is being done to help them get back to work.
• Train managers, supervisors, and employees on the importance of timely reporting of injuries to ensure that benefits are delivered
without delay. • Continue to strategize with our Attorneys, Administrators and Human Resources Director to develop the best, most efficient and
cost effective way to settle our claims. • Expand our Temporary Modified Duty Program to benefit all departments who may need workers who have been returned to
work with temporary restrictions. Our objective is to meet the needs of the injured worker in getting them back to work either in their own departments or with departments that could use some temporary assistance.

%Change
Human Resources Workers' Compensation
159
Expenses by Category
Expenses by Fund %Change
Personnel
2009-10Actual
2010-11Budget
2010-11Revised
2011-12Recommended
2012-13Proposed
2009-10Actual
2010-11Budget
2010-11Revised
2011-12Recommended
2012-13Proposed
2009-10Actual
2010-11Budget
2010-11Revised
2011-12Recommend
2012-13Proposed
Salaries and Benefits 276,532 280,310 280,310 318,166 318,16613.51%Other Expenses 8,454,002 5,746,334 5,746,334 5,751,720 5,751,7200.09%Total Expenses 8,730,534 6,026,644 6,026,644 6,069,886 6,069,8860.72%
Workers Compensation 8,730,534 6,026,644 6,026,644 6,069,886 6,069,8860.72%8,730,534 6,026,644 6,026,644 6,069,886 6,069,8860.72%Total All Funds
Administrative Technician (C) 1.00 1.00 1.00 2.00 2.00Employee Relations Coordinator 0.00 0.00 0.00 0.50 0.50Workers' Compensation Manager 1.00 1.00 1.00 1.00 1.00Workers' Compensation Specialist 1.00 1.00 1.00 1.00 1.00
3.00 3.00 3.00 4.50 4.50Total Personnel

Human Resources Safety Management
Activities / Functions
160
We are committed to provide employees with the best possible information and training so that employees will engage in safe and productive work habits. Our goal is to focus on creating a culture of “wellness” for all employees and to promote good health and good life habits. • Identify, develop, and track quality safety training to ensure continued compliance with CAL/OSHA regulations. • Create a Citywide Safety Manual with Safety policies and procedures to enhance the City’s Injury Illness Prevention Program
(IIPP). • Initiate onsite inspections and audits for safety hazards to City locations. • Enhance the new employee orientation training program to include mandated safety training to ensure the City remains compliant
with informing new employees of the City’s safety policies and procedures.

%Change
Human Resources Safety Management
161
Expenses by Category
Expenses by Fund %Change
Personnel
2009-10Actual
2010-11Budget
2010-11Revised
2011-12Recommended
2012-13Proposed
2009-10Actual
2010-11Budget
2010-11Revised
2011-12Recommended
2012-13Proposed
2009-10Actual
2010-11Budget
2010-11Revised
2011-12Recommend
2012-13Proposed
Salaries and Benefits 92,925 92,977 92,977 95,105 95,1052.29%Other Expenses 131,530 262,312 322,515 253,608 253,608-21.37%Total Expenses 224,455 355,289 415,492 348,713 348,713-16.07%
Workers Compensation 224,455 355,289 415,492 348,713 348,713-16.07%224,455 355,289 415,492 348,713 348,713-16.07%Total All Funds
Safety Specialist 1.00 1.00 1.00 1.00 1.001.00 1.00 1.00 1.00 1.00Total Personnel


Library


%Change
Expenses by Category
Library Department Summary
163
%Change
%Change
Expenses by Fund
Expenses by Program 2009-10Actual
2010-11Budget
2010-11Revised
2011-12Recommended
2012-13Proposed
2009-10Actual
2010-11Budget
2010-11Revised
2011-12Recommended
2012-13Proposed
2009-10Actual
2010-11Budget
2010-11Revised
2011-12Recommended
2012-13Proposed
Salaries and Benefits 3,680,021 3,731,926 3,388,310 3,376,850 3,376,850-0.34%Other Expenses 1,341,259 1,472,968 1,460,196 1,200,432 1,200,432-17.79%Total Expenses 5,021,280 5,204,894 4,848,506 4,577,282 4,577,282-5.59%
General Fund 5,000,590 5,204,894 4,732,212 4,577,282 4,577,282-3.27%Library Grant 20,690 0 116,294 0 0-100.00%
5,021,280 5,204,894 4,848,506 4,577,282 4,577,282-5.59%Total All Funds
Library Community Outreach 741,850 747,638 747,638 715,472 715,472-4.30%Library Circulation Services 1,111,740 1,210,447 1,210,447 1,160,434 1,160,434-4.13%Library Information/Reference Services
1,112,376 1,225,902 1,179,942 1,156,646 1,156,646-1.97%
Library Support Services 710,113 629,035 730,638 621,707 621,707-14.91%Library Branch Services 956,108 964,885 979,841 923,023 923,023-5.80%Carnegie Art Museum 389,093 426,987 0 0 0
5,021,280 5,204,894 4,848,506 4,577,282 4,577,282-5.59%Total All Programs

Library Library Community Outreach
Activities / Functions
164
The Library Community Outreach Division’s primary responsibility is to administer the Library Department’s divisions—Library Circulation Services, Library Information/Reference Services, Library Support Services and Library Branch Services. Community Outreach is responsible for budgeting, administration, personnel, supervision, and community outreach. Administrative support consists of budget development, purchasing, personnel, contracts, clerical support, and graphics. Graphics for all library programs are provided by the Community Outreach Division. Community Outreach advertises the library to the community and establishes partnerships that build community and financial support. Community Outreach also has two meeting rooms available for public, private, and other City departments’ meetings. This division supports the City of Oxnard Library Board of Trustees and the Oxnard Friends of the Library Foundation. Highlights: • Each year, the California Library Association hosts “Day in the District,” where library leaders meet with local legislators to
discuss library services and funding. • Collaborated with Information Systems’ webmaster to create a new, user-friendly website, www.oxnardlibrary.net, which is
updated and maintained by Community Outreach. The website provides access to electronic library resources and information about library events, services, collections, U.S. Passports, Friends of the Library Foundation and adult literacy. It also provides links to Internet resources for employment, businesses, education, and English as a Second Language.
• In 2010, the Oxnard Friends of the Library Foundation gave $40,000 to the Library to fund programs and services not covered by
general funds, such as the Summer Reading Program, movie events, a $2,500 scholarship and additional materials. For 2011, the Oxnard Friends of the Library Foundation has donated $45,000 to the Library which will enhance the Library’s programming as in previous years. The monies are raised through the thousands of hours donated by more than 100 volunteers who sell donated books, work in the Gift Shop or participate in the educational and entertaining trips to Southern California venues.
• Developed and created the Oxnard Public Library Strategic Plan of Service for 2010-2015 which was approved on November 23,
2009 by City Council.

%Change
Library Library Community Outreach
165
Expenses by Category
Expenses by Fund %Change
Personnel
2009-10Actual
2010-11Budget
2010-11Revised
2011-12Recommended
2012-13Proposed
2009-10Actual
2010-11Budget
2010-11Revised
2011-12Recommended
2012-13Proposed
2009-10Actual
2010-11Budget
2010-11Revised
2011-12Recommend
2012-13Proposed
Salaries and Benefits 456,729 452,827 452,827 429,078 429,078-5.24%Other Expenses 285,121 294,811 294,811 286,394 286,394-2.86%Total Expenses 741,850 747,638 747,638 715,472 715,472-4.30%
General Fund 741,850 747,638 747,638 715,472 715,472-4.30%741,850 747,638 747,638 715,472 715,472-4.30%Total All Funds
Administrative Assistant 1.00 1.00 1.00 1.00 1.00Library Aide III 1.00 1.00 1.00 1.00 1.00Library Director 1.00 1.00 1.00 1.00 1.00Office Assistant I/II 1.00 1.00 1.00 1.00 1.00
4.00 4.00 4.00 4.00 4.00Total Personnel

Library Library Circulation Services
Activities / Functions
166
The Library Circulation Services Division is responsible for the following areas in the Main Library: • Providing customer service by checking out and renewing materials; registering customers for library cards; accepting payments
for overdue, lost, and damaged materials; and obtaining materials from other libraries through interlibrary loans. • Providing information regarding applying for a U.S. Passport and serving as a qualified Agent accepting U.S. Passport
Applications. • Coordinating the Library Volunteer Program by recruiting, training, and supervising volunteers to shelve and shelf-read the
collection; process, clean, and repair materials, and assist students in the Homework Center. Highlights: • Revenues generated from the passport execution fees and photo service supported various library programs including the Literacy
Outreach Program and the Volunteer Recognition events. • Maintained the Main Library by providing a pleasant, clean, and safe environment. • Enhanced customer service through the automated self check-in service. • Received a Library Services and Technology Act grant to create the Main Library Homework Center which opened on
September 1, 2010. During the first six months, Homework Center volunteers and staff provided 2,300 tutoring sessions to students in 1st through 12th grades.

%Change
Library Library Circulation Services
167
Expenses by Category
Expenses by Fund %Change
Personnel
2009-10Actual
2010-11Budget
2010-11Revised
2011-12Recommended
2012-13Proposed
2009-10Actual
2010-11Budget
2010-11Revised
2011-12Recommended
2012-13Proposed
2009-10Actual
2010-11Budget
2010-11Revised
2011-12Recommend
2012-13Proposed
Salaries and Benefits 904,639 932,459 932,459 911,292 911,292-2.27%Other Expenses 207,101 277,988 277,988 249,142 249,142-10.38%Total Expenses 1,111,740 1,210,447 1,210,447 1,160,434 1,160,434-4.13%
General Fund 1,112,986 1,210,447 1,210,447 1,160,434 1,160,434-4.13%Library Grant -1,246 0 0 0 0
1,111,740 1,210,447 1,210,447 1,160,434 1,160,434-4.13%Total All Funds
Library Aide I/II 8.50 8.50 8.00 8.00 8.00Library Circulation Supervisor 1.00 1.00 1.00 1.00 1.00Office Assistant I/II 0.00 0.00 1.00 1.00 1.00
9.50 9.50 10.00 10.00 10.00Total Personnel

Library Library Information/Reference Services
Activities / Functions
168
The Library Information/Reference Services Division’s primary responsibility is to provide reference and information services to our community. Other services include providing computer training; providing access to word processing software and the Internet; providing cultural and educational programming; providing adult literacy tutoring; administering the Local History collection, test proctoring, and applying for state and federal grants which support public services. Highlights: • Received a Library Services and Technology Act grant to provide outreach and library services to the underserved Mixteco
population residing in the Oxnard area. • Electronic Job resources assist patrons with school and job practice exams, skill-building courses, and computer skill
enhancement training, and are available online through the library’ s website at www.oxnardlibrary.net and in printed form at the library.
• Usage of the computer lab and computer classes continue to be very popular with Oxnard residents. Public computers are heavily
used during all open library hours.

%Change
Library Library Information/Reference Services
169
Expenses by Category
Expenses by Fund %Change
Personnel
2009-10Actual
2010-11Budget
2010-11Revised
2011-12Recommended
2012-13Proposed
2009-10Actual
2010-11Budget
2010-11Revised
2011-12Recommended
2012-13Proposed
2009-10Actual
2010-11Budget
2010-11Revised
2011-12Recommend
2012-13Proposed
Salaries and Benefits 817,149 889,323 828,890 855,866 855,8663.25%Other Expenses 295,227 336,579 351,052 300,780 300,780-14.32%Total Expenses 1,112,376 1,225,902 1,179,942 1,156,646 1,156,646-1.97%
General Fund 1,112,376 1,225,902 1,179,942 1,156,646 1,156,646-1.97%1,112,376 1,225,902 1,179,942 1,156,646 1,156,646-1.97%Total All Funds
Computer Network Engineer I/II 1.00 1.00 0.00 0.00 0.00Librarian I/II 9.50 9.50 10.00 10.00 10.00Librarian III 1.00 1.00 1.00 1.00 1.00Library Services Supervisor 1.00 1.00 1.00 1.00 1.00Literacy Coordinator 1.00 1.00 1.00 1.00 1.00Office Assistant I/II 1.00 1.00 0.00 0.00 0.00
14.50 14.50 13.00 13.00 13.00Total Personnel

Library Library Support Services
Activities / Functions
170
The Library Support Services Division’s primary responsibility is to purchase library materials and technology for the department. Library Materials • Purchase, catalog, and process library books, CDs, DVDs, videos, cassette tapes, and reference items
• Install security devices to prevent theft
• Maintain computer database records for library catalog
• Repair books, CDs, or DVDs that have been damaged
• Maintain library materials funds accounting system for materials acquisition
Library Technology • Plan for future technology-based library services
• Provide access to library print and electronic resources through library catalog and website pages
• Develop new technology projects
• Maintain existing library computer software programs
• Develop three-year library technology plan to implement new technology systems that enhance customer service
• Provide broad major technology project management
• Apply for federal program funds to help defray costs
• Maintain software for the library catalog, library materials checkout, and inventory control computer system
• Plan and maintain library telephone systems in collaboration with Information Systems

%Change
Library Library Support Services
171
Expenses by Category
Expenses by Fund %Change
Personnel
2009-10Actual
2010-11Budget
2010-11Revised
2011-12Recommended
2012-13Proposed
2009-10Actual
2010-11Budget
2010-11Revised
2011-12Recommended
2012-13Proposed
2009-10Actual
2010-11Budget
2010-11Revised
2011-12Recommend
2012-13Proposed
Salaries and Benefits 493,156 466,656 473,965 472,792 472,792-0.25%Other Expenses 216,957 162,379 256,673 148,915 148,915-41.98%Total Expenses 710,113 629,035 730,638 621,707 621,707-14.91%
General Fund 688,177 629,035 614,344 621,707 621,7071.20%Library Grant 21,936 0 116,294 0 0-100.00%
710,113 629,035 730,638 621,707 621,707-14.91%Total All Funds
Computer Network Engineer I/II 0.00 0.00 2.00 2.00 2.00Library Aide I/II 3.50 3.50 3.50 3.50 3.50Library Aide III 1.00 1.00 1.00 1.00 1.00Systems Analyst III 1.00 1.00 1.00 1.00 1.00
5.50 5.50 7.50 7.50 7.50Total Personnel

Library Library Branch Services
Activities / Functions
172
Library Branch Services' primary responsibility is to provide customer-focused information and electronic services; select materials in English and Spanish of interest to the community; represent the library at community outreach events; and plan and implement events and programs at the South Oxnard Branch and the Colonia Branch libraries. Highlights: • Received a Library Services and Technology Act (LSTA) grant to create the South Oxnard Branch Library Family Place which
provides dedicated library space and services for newborns to 5-year-olds and their parents/caregivers. The Family Place opened on March 1, 2011.
• The South Oxnard Branch Library Homework Center had 4,473 tutoring sessions for 1st through 12th graders in FY 2010. As of
March 1, 2011, there have been 4,388 tutoring sessions and is on track for an estimated 32% increase in FY 2011. • The South Oxnard Branch Library offers computer classes on the Internet, Microsoft Word, keyboarding, e-mail, and job
searching. • Help Now! which provides online tutoring and is funded by an LSTA grant is available via the library’s website,
www.oxnardlibrary.net, and at all three Oxnard Public Library locations.

%Change
Library Library Branch Services
173
Expenses by Category
Expenses by Fund %Change
Personnel
2009-10Actual
2010-11Budget
2010-11Revised
2011-12Recommended
2012-13Proposed
2009-10Actual
2010-11Budget
2010-11Revised
2011-12Recommended
2012-13Proposed
2009-10Actual
2010-11Budget
2010-11Revised
2011-12Recommend
2012-13Proposed
Salaries and Benefits 755,506 700,169 700,169 707,822 707,8221.09%Other Expenses 200,602 264,716 279,672 215,201 215,201-23.05%Total Expenses 956,108 964,885 979,841 923,023 923,023-5.80%
General Fund 956,108 964,885 979,841 923,023 923,023-5.80%956,108 964,885 979,841 923,023 923,023-5.80%Total All Funds
Computer Network Engineer III 1.00 1.00 0.00 0.00 0.00Librarian I/II 3.00 3.00 3.00 3.00 3.00Librarian III 1.00 1.00 1.00 1.00 1.00Library Aide I/II 2.50 2.50 2.50 2.50 2.50Library Aide III 1.00 1.00 1.00 1.00 1.00Library Services Supervisor 1.00 1.00 1.00 1.00 1.00
9.50 9.50 8.50 8.50 8.50Total Personnel

Library Carnegie Art Museum
Activities / Functions
174
The Carnegie Art Museum’s primary responsibilities are to enhance the quality of life of residents and foster tourism by providing artistic and cultural enrichment opportunities through significant museum exhibits, education programs, arts events, and stewardship of the City’s permanent art collection. The permanent collection, with its focus on California art, was initially created through the donations of citizens in the 1920s. A key responsibility of the Museum is to preserve, manage, and enlarge this collection of 1600 objects containing both regionally and nationally reputed California artists. The collection’s current strengths are California Impressionism, photography, and Latino art. Effective July 2010, the budget of the Carnegie was shifted from Library to Non-Departmental. Highlights: • Organizes annually 8 to 12 changing exhibits of museum quality art from the permanent collection and/or art-on-loan for the
educational advancement of residents and visitors
• Offers a dynamic slate of curriculum-based education programs outreaching to students from kindergarten to college and to lifelong learners
• Partners with the Carnegie Art Museum Cornerstones, a volunteer 501(c)(3) nonprofit support group, to gain additional financial support for programming needs
• Operates highly efficiently and creatively to reach the community in comparison to other California museums of its size
• Attracts an average of 20,000 visitors annually
• Serves a minimum of 10,000 students annually, from kindergarten to college, through museum education programs
• Serves 85% of Oxnard schools through education programs including hands on art workshop tours and “Art Smart” program
• Serves other organizations such as the Oxnard Summer Camp, Migrant Education, City Corp, Ventura County Leadership Academy, Friends of Old Oxnard, and Oxnard Family Circle in presenting educational outreach programs
• Serves visiting students from Oxnard College, Ventura College and California State University Channel Islands with lectures and tours
• Offers 18 different educational outreach programs, nearly twice the mean for California museums of 9.7, as published in the “2006 California Association of Museums Survey.” Such programs include school tours with hands-on art workshops; classroom art presentations; writing and literature tours; children and teen weekend art classes; adult master art workshops; guest artist presentations to high schools; artist residencies; studio visits; Arcade Poetry Series; gallery talks; book club; exhibit receptions; art history lectures; performances; and Family Days.
• Hosts traveling exhibits from institutions with strict lending requirements, such as the Frederick R. Weisman Art Foundation
• Achieves exhibit excellence through increased publicity coverage, on line promotion and audience outreach with articles and promotions appearing in the Ventura County Star, VC Reporter, Artscene, Santa Barbara Independent, and Artltd

%Change
Library Carnegie Art Museum
175
Expenses by Category
Expenses by Fund %Change
Personnel
2009-10Actual
2010-11Budget
2010-11Revised
2011-12Recommended
2012-13Proposed
2009-10Actual
2010-11Budget
2010-11Revised
2011-12Recommended
2012-13Proposed
2009-10Actual
2010-11Budget
2010-11Revised
2011-12Recommend
2012-13Proposed
Salaries and Benefits 252,842 290,492 0 0 0Other Expenses 136,251 136,495 0 0 0Total Expenses 389,093 426,987 0 0 0
General Fund 389,093 426,987 0 0 0389,093 426,987 0 0 0Total All Funds
Cultural Arts Supervisor 1.00 1.00 1.00 1.00 1.00Event Attendant I/II/III 1.50 1.50 1.75 1.75 1.75Office Assistant I/II 1.00 1.00 0.75 0.75 0.75
3.50 3.50 3.50 3.50 3.50Total Personnel


Police


%Change
Expenses by Category
Police Department Summary
177
%Change
%Change
Expenses by Fund
Expenses by Program 2009-10Actual
2010-11Budget
2010-11Revised
2011-12Recommended
2012-13Proposed
2009-10Actual
2010-11Budget
2010-11Revised
2011-12Recommended
2012-13Proposed
2009-10Actual
2010-11Budget
2010-11Revised
2011-12Recommended
2012-13Proposed
Salaries and Benefits 53,411,728 54,105,816 52,043,809 52,732,744 52,732,7441.32%Other Expenses 8,110,072 7,456,816 13,257,077 7,131,624 7,131,624-46.21%Total Expenses 61,521,800 61,562,632 65,300,886 59,864,368 59,864,368-8.33%
General Fund 48,411,252 50,090,366 48,817,805 48,506,118 48,506,118-0.64%Post Reimbursement Training 152,387 94,816 94,816 94,816 94,8160.00%State Law Enforcement Grants 505,816 0 346,407 0 0-100.00%Public Safety Retirement 10,645,517 10,781,869 9,229,423 10,730,002 10,730,00216.26%Traffic Safety 349,118 318,959 318,959 313,432 313,432-1.73%Other State Grants 531,665 0 1,885,147 0 0-100.00%Federal Law Enforcement Grants 195,254 31,622 742,820 0 0-100.00%CDBG Federal Entitlement 222,689 245,000 245,000 220,000 220,000-10.20%2009 Lease Purchase Equipment 508,102 0 3,620,509 0 0-100.00%
61,521,800 61,562,632 65,300,886 59,864,368 59,864,368-8.33%Total All Funds
Code Compliance 1,307,190 1,477,931 1,419,296 1,445,015 1,445,0151.81%Community Patrol 39,604,403 40,155,043 41,041,487 39,480,725 39,480,725-3.80%Criminal Investigation 11,126,358 10,519,352 10,458,554 9,613,569 9,613,569-8.08%Police Support Services 6,838,752 6,581,512 9,782,280 6,559,403 6,559,403-32.95%Emergency Communications 2,645,097 2,828,794 2,599,269 2,765,656 2,765,6566.40%
61,521,800 61,562,632 65,300,886 59,864,368 59,864,368-8.33%Total All Programs

Police Code Compliance
Activities / Functions
178
FUNCTIONS Working with the community by providing solution-oriented enforcement for maintaining clean, safe, prosperous, and attractive neighborhoods.
ACTIVITIES • Perform inspections of residential and commercial properties to assure compliance with City Code. • Work with property owners to gain compliance by providing education on the Code requirements. • Attend neighborhood and INCF meetings to educate the community. • Work as part of the Police beat teams to address quality of life concerns in every neighborhood. • Conduct public awareness campaigns to increase voluntary compliance with City Code. • Door to door canvassing for Animal licensing in an effort to increase awareness and gain compliance. • When enforcement becomes necessary, utilize civil citations, abatement warrants, and criminal complaint filings to ultimately
achieve compliance. • Work within assigned areas proactively to address quality of life concerns without the need for a citizen to file a complaint. • Proactive enforcement of street vendors to address health and safety concerns. • Visit the parks within the City each day to ensure safe use of the grounds and equipment. Educate the public on City ordinances
and park policies. • Conduct late afternoon and evening inspections to ensure the park users have left at closing.

%Change
Police Code Compliance
179
Expenses by Category
Expenses by Fund %Change
Personnel
2009-10Actual
2010-11Budget
2010-11Revised
2011-12Recommended
2012-13Proposed
2009-10Actual
2010-11Budget
2010-11Revised
2011-12Recommended
2012-13Proposed
2009-10Actual
2010-11Budget
2010-11Revised
2011-12Recommend
2012-13Proposed
Salaries and Benefits 1,061,501 1,209,458 1,150,823 1,196,602 1,196,6023.98%Other Expenses 245,689 268,473 268,473 248,413 248,413-7.47%Total Expenses 1,307,190 1,477,931 1,419,296 1,445,015 1,445,0151.81%
General Fund 1,084,501 1,232,931 1,174,296 1,225,015 1,225,0154.32%CDBG Federal Entitlement 222,689 245,000 245,000 220,000 220,000-10.20%
1,307,190 1,477,931 1,419,296 1,445,015 1,445,0151.81%Total All Funds
Administrative Technician 1.00 1.00 1.00 1.00 1.00Code Compliance Inspector I/II 9.00 9.00 9.00 9.00 9.00Code Compliance Manager 1.00 1.00 1.00 1.00 1.00Office Assistant I/II 1.00 1.00 1.00 1.00 1.00Senior Code Compliance Inspector 1.00 1.00 1.00 1.00 1.00
13.00 13.00 13.00 13.00 13.00Total Personnel

Police Community Patrol
Activities / Functions
180
FUNCTIONS Provide initial response to emergency and routine calls for service and handle preliminary investigations. Provide the residents,business owners, and visitors to the City of Oxnard with a high degree of personalized customer service through prompt, courteous, and professional community policing.
ACTIVITIES Patrol Division • Respond to emergency and nonemergency calls for service; including criminal investigations, traffic collision investigations, and
disturbance interventions. • Work as part of a team to develop and implement timely strategies to deal with crime, traffic, and quality-of-life issues within
assigned beats. • Work full-time at the high schools, and part-time at the middle and elementary schools, to handle police issues on campus and to
break down police/youth barriers. Co-direct the Police Activities League. Patrol Support Division • Enforce the vehicle code, investigate major collisions, plan special events, oversee the school crossing guards, and handle parking
ordinance enforcement. • Process arrestees and, when appropriate, transport them to Ventura County Jail. Special Operations Division • Provide consistent and proactive gang enforcement. • Participate in prevention and intervention strategies. • Handle high-risk tactical incidents and provide less lethal and tactical decision-making training for all officers. • Use police service dogs to support patrol shifts in searching for and apprehending suspects and conducting narcotic searches.

%Change
Police Community Patrol
181
Expenses by Category
Expenses by Fund %Change
Personnel
2009-10Actual
2010-11Budget
2010-11Revised
2011-12Recommended
2012-13Proposed
2009-10Actual
2010-11Budget
2010-11Revised
2011-12Recommended
2012-13Proposed
2009-10Actual
2010-11Budget
2010-11Revised
2011-12Recommend
2012-13Proposed
Salaries and Benefits 34,757,810 35,721,785 34,233,486 35,198,722 35,198,7222.82%Other Expenses 4,846,593 4,433,258 6,808,001 4,282,003 4,282,003-37.10%Total Expenses 39,604,403 40,155,043 41,041,487 39,480,725 39,480,725-3.80%
General Fund 29,252,315 31,203,497 30,498,397 30,788,019 30,788,0190.95%Post Reimbursement Training 123,603 71,096 71,096 71,096 71,0960.00%State Law Enforcement Grants 247,859 0 47,718 0 0-100.00%Public Safety Retirement 8,368,693 8,529,869 6,977,423 8,308,178 8,308,17819.07%Traffic Safety 349,118 318,959 318,959 313,432 313,432-1.73%Other State Grants 156,894 0 1,103,338 0 0-100.00%Federal Law Enforcement Grants 0 0 34,221 0 0-100.00%2009 Lease Purchase Equipment 358,449 0 481,000 0 0-100.00%
39,604,403 40,155,043 41,041,487 39,480,725 39,480,725-3.80%Total All Funds
Administrative Secretary I/II 1.00 1.00 1.00 1.00 1.00Animal Safety Officer 3.00 3.00 3.00 3.00 3.00Assistant Police Chief 1.00 1.00 1.00 2.00 2.00Community Service Officer 9.00 9.00 10.00 10.00 10.00Crossing Guard 10.50 10.50 10.50 10.50 10.50Police Commander 6.00 6.00 6.00 6.00 6.00Police Officer I/II 149.00 149.00 147.00 147.00 147.00Police Officer III 16.00 16.00 15.20 15.20 15.20Police Sergeant 20.00 20.00 19.00 19.00 19.00Police Service Officer 8.00 8.00 8.00 8.00 8.00Senior Animal Safety Officer 1.00 1.00 1.00 1.00 1.00Senior Police Service Officer 1.00 1.00 1.00 1.00 1.00Senior Traffic Service Assistant 3.00 3.00 3.00 3.00 3.00Traffic Service Assistant I/II 15.00 15.00 15.00 15.00 15.00
243.50 243.50 240.70 241.70 241.70Total Personnel

Police Criminal Investigation
Activities / Functions
182
FUNCTION
Provide investigative, analytical, and crime victim services to the residents of Oxnard that maximize high quality, efficiency, and coordination with the criminal justice system. All efforts will focus on and promote the safety of our community and its residents.
ACTIVITIES
Major Crimes Investigations • Investigate homicides, suspicious deaths, and serious officer-involved incidents. This includes “cold case” homicides. • Work closely with the Ventura County District Attorney’s Office in the preparation of homicide cases for prosecution. • Work joint operations with other County, state and federal agencies including, but not limited to: California State Parole, DOJ,
FBI, US Marshal, and ICE. • Respond to crime scenes, collect, and preserve evidence relevant to investigations, including the processing of such materials. • Test fire, catalog, and compare ballistics data for investigative purposes.
Violent Crime Investigations • Investigate violent crimes against persons, including aggravated assaults, attempted murders, robberies, kidnappings, and gang-
related crimes. Graffiti offenses, which have shown an increased trend of violent behavior, are also investigated. • Collect, analyze, and disseminate information concerning the activities of organized criminal groups, emerging criminal groups,
hate-based organizations, and terrorist groups. • Maintain the City’s two gang injunctions against the Colonia Chiques and Southside Chiques gangs. • Develop reports on gang activity, and disseminate information to law enforcement resources. • Serve as a direct point of contact to the community for the purpose of addressing graffiti issues, as well as outreach to encourage
community participation in the anti-graffiti strategy.
Sexual Assault and Domestic Violence Investigations • Investigate crimes related to domestic violence and sexual assault, including but not limited to: spousal and domestic battery,
rape, attempted rape, sexual battery, child endangerment, child molestation, dependent elder abuse. • Provide intake services to victims of recent crime, and provide necessary referrals to a variety of victim assistance agencies.
Property Crimes Investigations • Investigate property crimes including: thefts; vehicle, commercial, and residential burglaries; fraud and forgery; and arson. • Provide outreach to owners and managers of local properties the opportunity to participate in the Crime Free Multi-Housing
Program, which seeks to encourage crime prevention strategies on properties in the Oxnard community, including crimeprevention through environmental design (CPTED) and a zero-tolerance approach towards criminal behaviour by tenants or theirguests.
Street Narcotics Detail and the Ventura County Combined Agencies Team (VCAT) • Conduct investigations into the sales, transportation, and distribution of illegal drugs within the City of Oxnard. • Interdict the flow of narcotics into Ventura County. • Investigate reports of narcotic activity based upon officer observations, informant information, or complaints from the
community. • Seize assets derived from the illegal sales of drugs. • Interact with other local, state and federal agencies to assist in narcotics investigations and the prosecution of these cases. • Dismantle clandestine drug laboratories encountered in Ventura County.
Crime Analysis • Provide statistical and analytical support to the investigators, special units, and patrol. • Respond to requests for information regarding criminal activity from the general public, outside agencies and members of the
Oxnard Police Department. Develop reports, maps, and graphs for use in the effective deployment of resources.Develop reports, maps, and graphs for use in the effective deployment of resources.
• Download and convert calls for service data from the Department’s computer aided dispatch system. • Statistical support for the gang injunctions, alcohol abatement, Weed and Seed projects, the GVS grant, and special projects. • Ensure compliance regarding sex registrants pursuant to California Penal Code Section 290.

%Change
Police Criminal Investigation
183
Expenses by Category
Expenses by Fund %Change
Personnel
2009-10Actual
2010-11Budget
2010-11Revised
2011-12Recommended
2012-13Proposed
2009-10Actual
2010-11Budget
2010-11Revised
2011-12Recommended
2012-13Proposed
2009-10Actual
2010-11Budget
2010-11Revised
2011-12Recommend
2012-13Proposed
Salaries and Benefits 9,666,142 9,182,795 9,117,520 8,386,307 8,386,307-8.02%Other Expenses 1,460,216 1,336,557 1,341,034 1,227,262 1,227,262-8.48%Total Expenses 11,126,358 10,519,352 10,458,554 9,613,569 9,613,569-8.08%
General Fund 9,204,966 8,625,506 8,564,708 7,580,364 7,580,364-11.49%Post Reimbursement Training 28,784 23,720 23,720 23,720 23,7200.00%Public Safety Retirement 1,892,608 1,870,126 1,870,126 2,009,485 2,009,4857.45%
11,126,358 10,519,352 10,458,554 9,613,569 9,613,569-8.08%Total All Funds
Assistant Police Chief 1.00 1.00 1.00 0.00 0.00Community Service Officer 1.00 1.00 1.00 1.00 1.00Crime Analysis Data Technician 1.00 1.00 1.00 1.00 1.00Crime Analyst I/II 2.00 2.00 2.00 2.00 2.00Criminalist 1.00 1.00 1.00 1.00 1.00Data Entry Operator I/II 0.50 0.50 0.50 0.50 0.50Evidence Technician I/II 2.00 2.00 2.00 2.00 2.00Missing Persons Specialist 1.00 1.00 1.00 1.00 1.00Police Commander 1.00 1.00 1.00 1.00 1.00Police Officer I/II 15.00 15.00 17.00 17.00 17.00Police Officer III 17.00 17.00 16.00 16.00 16.00Police Sergeant 5.00 5.00 6.00 6.00 6.00Sex Registrant Specialist 1.00 1.00 1.00 1.00 1.00Victim Services Specialist 1.00 1.00 1.00 1.00 1.00
49.50 49.50 51.50 50.50 50.50Total Personnel

Police Police Support Services
Activities / Functions
184
FUNCTIONS
• Provide quality customer service to the public, our employees and other agencies • Recruit and hire qualified personnel and provide continual training to them • Ensure the highest level of professionalism amongst our employees • Assure responsible stewardship and management of financial resources • Provide information systems that support Department operations • Receive and store all incoming property and efficiently manage all evidence • Adhere to existing laws that govern public records to ensure transparent operations
ACTIVITIES
Professional Standards • Develop and administer hiring processes for sworn and civilian applicants • Develop and maintain the Department’s training plan • Ensure the Department is meeting state and Department training requirements • Liaison with Human Resources to coordinate industrial injury cases involving Department personnel • Coordinate annual promotional processes • Investigate complaints of misconduct against employees • Conduct audits of Department processes to ensure best practices and policies are practiced
Business Office • Prepare budget deliverables and continuously monitor budget activity • Prepare and manage all reporting and processing of Public Safety grants • Provide oversight on asset forfeiture • Process purchase orders and requisitions • Provide payroll entry and overtime accounting
Records • Handle general public calls for nonemergency requests and requests for information • Gather, record and distribute information that is essential to the investigative, arrest, and judicial processes • Comply with DOJ policies, practices and procedures to ensure compliance with State mandates and audits • Process and distribute dictated police reports so that reports are readily accessible for case investigation • Provide on-line access to the general public to file and print police reports • Provide electronic access to traffic collision reports
Property/Evidence • Preserve all incoming property from contamination, theft or loss • Maintain chain of custody tracking information on all property and evidence received • Ensure all releases and dispositions of property are legal and properly documented • Conduct audits and inventories of property and evidence • Compile court packets on all subjects arrested and booked and ensures timeliness of filing
Information Technology • Computer Aided Dispatch – Provide public safety computer aided dispatch of emergency services for Police and Fire • Records Management System – Administer core investigation and analysis database for Police and Fire • Mobile Data Computers – Support mobile data access for field units • Internet – Develop the Department’s public-facing site for community involvement, crime stats, and daily webcasts • Department Intranet – Develops the portal through which all web-based enterprise systems are made accessible • Office Systems – Maintains over 350 Windows PCs, handheld computers, and numerous other peripherals and printers • Data Center – Operates ~40 servers and network infrastructure for connecting to storefronts, fire stations, and Ambulance • Office Systems – Maintains 344 Windows PCs, handheld computers, and numerous other peripherals and printers

%Change
Police Police Support Services
185
Expenses by Category
Expenses by Fund %Change
Personnel
2009-10Actual
2010-11Budget
2010-11Revised
2011-12Recommended
2012-13Proposed
2009-10Actual
2010-11Budget
2010-11Revised
2011-12Recommended
2012-13Proposed
2009-10Actual
2010-11Budget
2010-11Revised
2011-12Recommend
2012-13Proposed
Salaries and Benefits 5,434,749 5,384,519 5,165,566 5,403,075 5,403,0754.60%Other Expenses 1,404,003 1,196,993 4,616,714 1,156,328 1,156,328-74.95%Total Expenses 6,838,752 6,581,512 9,782,280 6,559,403 6,559,403-32.95%
General Fund 6,224,373 6,199,638 5,981,135 6,147,064 6,147,0642.77%State Law Enforcement Grants 0 0 10,917 0 0-100.00%Public Safety Retirement 384,216 381,874 381,874 412,339 412,3397.98%Federal Law Enforcement Grants 26,332 0 183,345 0 0-100.00%2009 Lease Purchase Equipment 149,653 0 3,139,509 0 0-100.00%
6,838,752 6,581,512 9,782,280 6,559,403 6,559,403-32.95%Total All Funds
Account Clerk I/II 2.00 2.00 2.00 2.00 2.00Administrative Assistant (C) 1.00 1.00 1.00 1.00 1.00Administrative Services Assistant 1.00 1.00 1.00 1.00 1.00Assistant Police Chief 1.00 1.00 1.00 1.00 1.00Community Affairs Manager 1.00 1.00 1.00 1.00 1.00Community Service Officer 2.00 2.00 1.00 1.00 1.00Computer Network Engineer III 3.00 3.00 3.00 3.00 3.00Data Entry Operator I/II 3.75 3.75 3.75 3.75 3.75Grants Specialist I/II 0.00 0.00 1.00 1.00 1.00Office Assistant I/II 1.00 1.00 1.00 1.00 1.00Police Chief 1.00 1.00 1.00 1.00 1.00Police Commander 1.00 1.00 1.00 1.00 1.00Police Financial Officer 1.00 1.00 1.00 1.00 1.00Police Records Manager 1.00 1.00 1.00 1.00 1.00Police Records Supervisor 1.00 1.00 1.00 1.00 1.00Police Records Technician I/II 15.75 15.75 15.75 15.75 15.75Police Records Technician III 3.00 3.00 3.00 3.00 3.00Police Sergeant 3.00 3.00 4.00 4.00 4.00Police Word Processor I/II 7.50 7.50 7.50 7.50 7.50Police Word Processor III 1.00 1.00 1.00 1.00 1.00Programmer Analyst 2.00 2.00 2.00 2.00 2.00Property and Evidence Custodian 1.00 1.00 1.00 1.00 1.00Senior Administrative Secretary 1.00 1.00 1.00 0.00 0.00Systems Analyst I/II/III 1.00 1.00 1.00 1.00 1.00
56.00 56.00 57.00 56.00 56.00Total Personnel

Police Emergency Communications
Activities / Functions
186
FUNCTION
Provide the community and all public safety personnel with the highest and most efficient communication and dispatch servicespossible. This service must be expedient, courteous, and professional.
ACTIVITIES
Receive Calls from the Public • Be an exemplary representative of both the Oxnard Police and Fire Departments through the use of positive customer service. • Receive emergency and nonemergency calls requesting police, animal control, code enforcement, fire, or medical services. • Answer 90 percent of all phone calls, including nonemergency, seven-digit emergency, wireless and 9-1-1 emergency lines,
within 10 seconds of receipt. • Determine the nature and location of requests while being an active listener, which includes remembering information already
provided by the caller. • Ask questions pertinent to the caller’s needs and make appropriate referrals and/or provide reasonable alternatives to callers. • Provide appropriate and accurate Emergency Medical Dispatch (EMD) instructions. • Control the conversation, follow a logical order of obtaining information, and keep the caller on the line when appropriate. • Enter necessary and complete information quickly and efficiently into the Computer Aided Dispatch (CAD) system. • Classify and prioritize calls properly, adjusting the priority as necessary if the situation changes. • Obtain enhanced information during critical events to insure the safety of responders and citizens. • Continuously update the radio dispatcher with any new information. • Respect the confidentiality of the caller and the information received.
Dispatch and Monitor First Responders • Dispatch, respond to, and manage the needs of Firefighters, Police Officers and other responders, such as Code Compliance and
Animal Safety, through the use of radio, computer, and telephone equipment. • Type while simultaneously performing other tasks (multitask) including handling multiple radio frequencies simultaneously. • Know city geography including police and fire beat boundaries and districts, landmarks and common streets. • Be able to hear and respond to other activity in the Communications Center while continuing to effectively monitor the radio. • Maintain current and correct documentation in CAD of all incident activity. • Monitor pending calls and those currently being handled by responders while prioritizing pending calls appropriately. • Assign the appropriate number of responders in a logical geographical deployment plan using both routine and alternate resources
while keeping in mind responder assignment responsibilities. • Have a flexible approach to the operations plan and adapt deployment as needed while maintaining responder safety. • Make decisions reflecting the need to upgrade response and provide resource acquisition and management based on individual
situations. • Maintain contact and keep an accurate status of all units on an assigned frequency. • Comprehend radio traffic using a variety of tactics including call sign identification, voice recognition and the ability to discern
who is talking when multiple units are transmitting simultaneously. • Take action appropriately to responder requests, including anticipating their needs in advance. • Appropriately answer every radio transmission, even if initially missed or only partially understood.
Perform Support Tasks • Retrieve information from a variety of computer sources relating to wanted persons, stolen vehicles, stolen personal property,
vehicle registrations, license status, and other information. • Understand and be able to read back and translate all computer returns quickly and accurately. • Provide nonemergency calls, such as ordering tow trucks, requesting standby public works emergency service, or contacting
appropriate agencies. • Relay information to and provide assistance to other police and fire agencies in response to mutual aid needs. • Promptly handle notification requests simultaneously with radio or phone duties. • Handle requests from other City employees and provide information or referrals.

%Change
Police Emergency Communications
187
Expenses by Category
Expenses by Fund %Change
Personnel
2009-10Actual
2010-11Budget
2010-11Revised
2011-12Recommended
2012-13Proposed
2009-10Actual
2010-11Budget
2010-11Revised
2011-12Recommended
2012-13Proposed
2009-10Actual
2010-11Budget
2010-11Revised
2011-12Recommend
2012-13Proposed
Salaries and Benefits 2,491,526 2,607,259 2,376,414 2,548,038 2,548,0387.22%Other Expenses 153,571 221,535 222,855 217,618 217,618-2.35%Total Expenses 2,645,097 2,828,794 2,599,269 2,765,656 2,765,6566.40%
General Fund 2,645,097 2,828,794 2,599,269 2,765,656 2,765,6566.40%2,645,097 2,828,794 2,599,269 2,765,656 2,765,6566.40%Total All Funds
Communications Manager 1.00 1.00 1.00 1.00 1.00Communications Training Coordinator 1.00 1.00 1.00 1.00 1.00Public Safety Dispatcher I/II 19.00 19.00 19.00 19.00 19.00Public Safety Dispatcher III 5.00 5.00 5.00 5.00 5.00
26.00 26.00 26.00 26.00 26.00Total Personnel


Public Works


%Change
Public Works Department Summary
Expenses by Category
%Change
Expenses by Fund
%Change
Expenses by Branch
189
2009-10Actual
2010-11Budget
2010-11Revised
2011-12Recommend
2012-13Proposed
2009-10Actual
2010-11Budget
2010-11Revised
2011-12Recommend
2012-13Proposed
2009-10Actual
2010-11Budget
2010-11Revised
2011-12Recommend
2012-13Proposed
Salaries and Benefits 23,744,973 22,718,710 22,676,317 21,353,469 21,336,896-5.83%Other Expenses 70,617,176 80,066,678 79,894,910 72,257,249 72,510,641-9.56%Total Expenses 94,362,149 102,785,388 102,571,227 93,610,718 93,847,537-8.74%
General Fund 3,012,326 3,195,391 3,195,391 2,572,922 2,572,922-19.48%State Gas Tax 2,194,168 3,471,028 3,485,964 3,252,048 3,252,048-6.71%Traffic Safety 311,709 280,061 280,061 271,965 271,965-2.89%TDA/LTF8-CIP Fund-99400a 1,428,201 0 0 3,016 3,0162009 Lease Purchase Equipment 0 0 152,000 0 0-100.00%Water Operating 27,889,945 37,880,254 36,603,648 32,342,286 32,325,713-11.64%Water Connection Fees 0 10,000 10,000 60,000 260,000500.00%Water Security 793,948 526,223 838,522 752,940 767,940-10.21%Wastewater Collection 6,164,668 5,848,397 5,940,868 5,445,913 5,445,913-8.33%W/W Treatment Operating 4,149,965 495,000 495,000 253,625 299,917-48.76%Wastewater Treatment 11,038,707 11,999,914 12,490,653 10,740,298 10,740,298-14.01%Solid Waste 37,378,512 38,989,620 38,989,620 37,860,705 37,852,805-2.90%Solid Waste Developer Fee 0 89,500 89,500 55,000 55,000-38.55%
94,362,149 102,785,388 102,571,227 93,610,718 93,847,537-8.74%Total All Funds
Administrative Services 694,089 751,012 751,012 595,446 595,446-20.71%Construction and Design Services 6,252,315 6,195,468 6,362,404 5,504,505 5,504,505-13.48%Utilities Services 87,415,745 95,838,908 95,457,811 87,510,767 87,747,586-8.33%
94,362,149 102,785,388 102,571,227 93,610,718 93,847,537-8.74%Total All Branches


%Change
Expenses by Category
Public Works Administrative Services Branch Summary
191
%Change
%Change
Expenses by Fund
Expenses by Program 2009-10Actual
2010-11Budget
2010-11Revised
2011-12Recommended
2012-13Proposed
2009-10Actual
2010-11Budget
2010-11Revised
2011-12Recommended
2012-13Proposed
2009-10Actual
2010-11Budget
2010-11Revised
2011-12Recommended
2012-13Proposed
Salaries and Benefits 469,628 568,926 526,533 529,304 529,3040.53%Other Expenses 224,461 182,086 224,479 66,142 66,142-70.54%Total Expenses 694,089 751,012 751,012 595,446 595,446-20.71%
General Fund 694,089 751,012 751,012 595,446 595,446-20.71%694,089 751,012 751,012 595,446 595,446-20.71%Total All Funds
Public Works Administration 694,089 751,012 751,012 595,446 595,446-20.71%694,089 751,012 751,012 595,446 595,446-20.71%Total All Programs

Public Works Administrative Services Public Works Administration
Activities / Functions
192
The Public Works Administration performs administrative, planning and financial, and services for the Public Works Department to include the divisions of Water, Wastewater, Environmental Resources, Engineering and Design, Construction Services, Surveying and Street Maintenance. Functional Areas
Administrative Support to Executive Staff Budget Development, Monitoring, and Control Process Improvement Purchasing, Procurement, and Contract Administration
Summary – The above functional areas provides the Public Works Department’s productivity and efficiency, enhance internal and
external customer service, effectuate long-term planning, and improve interagency working relationships. Administrative Support to Executive Staff – Provides administrative support such as scheduling meetings, processing Council agenda reports, processing service contracts, monitoring project information, handling phone messages, and performing day-to-day operations, communications and special projects for executive staff. Budget Development, Monitoring and Control - Provides ongoing budget development, monitoring and control for all divisionswithin the Public Works Department to include Water, Wastewater, Environmental Resources, Engineering and Design, ConstructionServices, Surveying and Street Maintenance. Process Improvement – Division staff provide enhanced levels of accountability and responsibility throughout the Public WorksDepartment. Constant evaluation of adopted processes is designed to improve, expand, and develop an efficient streamlined processfor such functions as contract change orders, Council agenda items, service agreements, and purchases. Purchasing, Procurement, and Contract Administration – The Public Works Administration provides a Centralized PaymentProcessing Center (CPPC) that maximizes use of human resources and eliminates duplication of effort in the Purchasing,Procurement, and Contract Administration functions across the Public Works Department. In conjunction with the City’s Purchasing Division, the CPPC is the only program in the City that processes payments electronically through the field purchase order system.The CPPC also handles the processing of project change orders, encumbrances for service contracts, and department purchase orders.

%Change
Public Works Administrative Services Public Works Administration
193
Expenses by Category
Expenses by Fund %Change
Personnel
2009-10Actual
2010-11Budget
2010-11Revised
2011-12Recommended
2012-13Proposed
2009-10Actual
2010-11Budget
2010-11Revised
2011-12Recommended
2012-13Proposed
2009-10Actual
2010-11Budget
2010-11Revised
2011-12Recommend
2012-13Proposed
Salaries and Benefits 469,628 568,926 526,533 529,304 529,3040.53%Other Expenses 224,461 182,086 224,479 66,142 66,142-70.54%Total Expenses 694,089 751,012 751,012 595,446 595,446-20.71%
General Fund 694,089 751,012 751,012 595,446 595,446-20.71%694,089 751,012 751,012 595,446 595,446-20.71%Total All Funds
Administrative Assistant 1.00 1.00 1.00 1.00 1.00Administrative Secretary III 1.00 1.00 1.00 1.00 1.00Administrative Services Manager 1.00 1.00 1.00 1.00 1.00Office Assistant I/II 0.00 0.00 1.00 1.00 1.00Public Works Director 1.00 1.00 1.00 1.00 1.00
4.00 4.00 5.00 5.00 5.00Total Personnel


%Change
Expenses by Category
Public Works Construction and Design Services Branch Summary
195
%Change
%Change
Expenses by Fund
Expenses by Program 2009-10Actual
2010-11Budget
2010-11Revised
2011-12Recommended
2012-13Proposed
2009-10Actual
2010-11Budget
2010-11Revised
2011-12Recommended
2012-13Proposed
2009-10Actual
2010-11Budget
2010-11Revised
2011-12Recommended
2012-13Proposed
Salaries and Benefits 4,079,270 4,059,504 4,059,504 3,691,085 3,691,085-9.08%Other Expenses 2,173,045 2,135,964 2,302,900 1,813,420 1,813,420-21.25%Total Expenses 6,252,315 6,195,468 6,362,404 5,504,505 5,504,505-13.48%
General Fund 2,318,237 2,444,379 2,444,379 1,977,476 1,977,476-19.10%State Gas Tax 2,194,168 3,471,028 3,485,964 3,252,048 3,252,048-6.71%Traffic Safety 311,709 280,061 280,061 271,965 271,965-2.89%TDA/LTF8-CIP Fund-99400a 1,428,201 0 0 3,016 3,0162009 Lease Purchase Equipment 0 0 152,000 0 0-100.00%
6,252,315 6,195,468 6,362,404 5,504,505 5,504,505-13.48%Total All Funds
Eng. Design & Contract Admin. 1,277,786 1,264,342 1,264,342 878,679 878,679-30.50%Const. Services - Streets 1,089,106 1,038,182 1,038,182 1,060,048 1,060,0482.11%Street Maintenance & Repair 3,356,011 3,241,525 3,408,461 2,945,344 2,945,344-13.59%Surveying Services 334,008 429,579 429,579 402,820 402,820-6.23%Parking Lots 195,404 221,840 221,840 217,614 217,614-1.90%
6,252,315 6,195,468 6,362,404 5,504,505 5,504,505-13.48%Total All Programs

Public Works Construction and Design Services Eng. Design & Contract Admin.
Activities / Functions
196
The function and purpose of the Engineering Design and Contract Administration Division is to provide comprehensive engineering, design, contract procurement, contract administration, and construction management support services for the improvement of theCity’s infrastructure systems through the implementation of capital improvement and rehabilitation projects. With these functions and principles in mind, the City’s Engineering Design and Contract Administration Division provides contract procurement and construction administration services for Capital Improvement Program (CIP) and other projects as required. TheDivision’s staff of professional civil engineers, consultants and staff routinely administer the contracts and tasks of contractedconsultants and provide oversight of consultant designs in accordance with the City’s goals, standards, and regulations. Working with intra-agencies, the Engineering Design and Contract Administration Division implements recommended capital projects identified in the adopted water, wastewater, storm drain and other master plans utilizing the experience and expertise of the City’sDesign, Contract Administration, Procurement, Survey, Landscape Architects, and Inspection staff. Outside of other City agencies and divisions, the Division provides extensive engineering services and assistance to consultants onspecific projects such as the Rice Avenue/Highway 101 interchange improvement project and the Oxnard Boulevard/Highway 101improvement project. These projects and others are completed in conjunction with other outside local, state, and federal agencies such as CalTrans and Gold Coast Transit (formerly SCAT) to ensure they are designed and engineered to the highest of safety andprofessional standards, as well as required city, state and federal standards. Given the Division’s experience and expertise, staff oversees and merges projects of different types into single projects to enhanceefficiency and has achieved and developed cost-savings through economies of scale through construction techniques such as the implementation of “curb-to-curb” design and subsequent construction. Additionally, as a component of the City’s overall CIP goals, the Engineering Design and Contract Administration Division completes the design of single- and multi-fiscal year capital improvement projects.

%Change
Public Works Construction and Design Services Eng. Design & Contract Admin.
197
Expenses by Category
Expenses by Fund %Change
Personnel
2009-10Actual
2010-11Budget
2010-11Revised
2011-12Recommended
2012-13Proposed
2009-10Actual
2010-11Budget
2010-11Revised
2011-12Recommended
2012-13Proposed
2009-10Actual
2010-11Budget
2010-11Revised
2011-12Recommend
2012-13Proposed
Salaries and Benefits 1,044,805 983,125 983,125 640,451 640,451-34.86%Other Expenses 232,981 281,217 281,217 238,228 238,228-15.29%Total Expenses 1,277,786 1,264,342 1,264,342 878,679 878,679-30.50%
General Fund 1,119,140 1,104,126 1,104,126 717,467 717,467-35.02%State Gas Tax 158,646 160,216 160,216 161,212 161,2120.62%
1,277,786 1,264,342 1,264,342 878,679 878,679-30.50%Total All Funds
Administrative Secretary III 1.00 1.00 0.00 0.00 0.00Assistant Civil Engineer 1.00 1.00 1.00 1.00 1.00Civil Engineer 1.00 1.00 0.00 0.00 0.00Construction & Maintenance Engineer 0.50 0.50 0.50 0.50 0.50Construction Project Coordinator 0.00 0.00 1.00 1.00 1.00Design & Construction Services Manager 1.00 1.00 1.00 1.00 1.00Engineering/Survey Technician I/II 2.00 2.00 2.00 2.00 2.00Junior Civil Engineer 0.00 0.00 1.00 1.00 1.00Senior Civil Engineer 2.00 2.00 2.00 2.00 2.00
8.50 8.50 8.50 8.50 8.50Total Personnel

Public Works Construction and Design Services Const. Services - Streets
Activities / Functions
198
The function and purpose of the Construction Services Division is to improve the quality of public works construction in Oxnard byproviding City programs, homeowners, businesses, developers and contractors with efficient, high-quality and timely public construction services. In accordance with these objectives, the City’s Construction Services Division has consistently improved the quality of publicinfrastructure constructed by and for the City through the efficient inspection of capital improvement and private development projects. Same day inspection services are also provided to contractors. To ensure that the public is aware of the Division’s activities and especially to reduce the impact of ongoing construction projects on commuters and the public in general, the Construction Services Division conducts extensive community outreach. This broadenedpublic awareness of construction activities and their (temporary) impact on the community includes advertising in local print media, local radio, and other outreach efforts. Recently, the Division produced public service announcements which were broadcast onKVTA (AM 1520) to inform the public of the ongoing downtown development project. Construction Services Staff also attend neighborhood council meetings and regularly provide current information for posting on the City website.

%Change
Public Works Construction and Design Services Const. Services - Streets
199
Expenses by Category
Expenses by Fund %Change
Personnel
2009-10Actual
2010-11Budget
2010-11Revised
2011-12Recommended
2012-13Proposed
2009-10Actual
2010-11Budget
2010-11Revised
2011-12Recommended
2012-13Proposed
2009-10Actual
2010-11Budget
2010-11Revised
2011-12Recommend
2012-13Proposed
Salaries and Benefits 769,923 721,769 721,769 745,709 745,7093.32%Other Expenses 319,183 316,413 316,413 314,339 314,339-0.66%Total Expenses 1,089,106 1,038,182 1,038,182 1,060,048 1,060,0482.11%
General Fund 572,003 562,572 562,572 564,259 564,2590.30%State Gas Tax 517,103 475,610 475,610 495,789 495,7894.24%
1,089,106 1,038,182 1,038,182 1,060,048 1,060,0482.11%Total All Funds
Construction & Maintenance Engineer 0.50 0.50 0.50 0.50 0.50Construction Inspector I/II 3.00 3.00 4.00 4.00 4.00Construction Project Coordinator 1.00 1.00 0.00 0.00 0.00Management Analyst II 1.00 1.00 0.50 0.50 0.50Public Works Construction Project Manager 1.00 1.00 1.00 1.00 1.00Senior Construction/Building Inspector 1.00 1.00 1.00 1.00 1.00
7.50 7.50 7.00 7.00 7.00Total Personnel

Public Works Construction and Design Services Street Maintenance & Repair
Activities / Functions
200
The Street Maintenance Division provides safe and usable streets, alleyways, and sidewalks within the public rights-of-way at a competitive rate and in a timely and professional manner. The Street Maintenance Division is currently comprised of five separate crews, performing asphalt maintenance, concrete work, signand markings maintenance, traffic signal maintenance, and the street keeper crew. In the last 12 months, the asphalt crew resolved 412 work orders, placed over 3,000 tons of asphalt and concrete and over 4,000 bags of cold patch material. The concrete crew resolved 132 work orders for curb and sidewalk repair. The signs and marking crew resolved 136 work orders for repairs to signs and markings, and replaced or repaired 128 signs as a result of route monitoring. The street keeper crew resolved 108 work orders for weed abatement, and provided immediate response to over 100 work orders for road debris, spills, and illegal dumping. The Street Maintenance Division works closely with the City’s Design and Construction Services Division in order to integrate streetmaintenance operations with street capital improvement projects. The Street Maintenance Division strives to maximize the resourcesavailable to provide safe streets and enhanced traffic flow.

%Change
Public Works Construction and Design Services Street Maintenance & Repair
201
Expenses by Category
Expenses by Fund %Change
Personnel
2009-10Actual
2010-11Budget
2010-11Revised
2011-12Recommended
2012-13Proposed
2009-10Actual
2010-11Budget
2010-11Revised
2011-12Recommended
2012-13Proposed
2009-10Actual
2010-11Budget
2010-11Revised
2011-12Recommend
2012-13Proposed
Salaries and Benefits 1,984,557 2,029,107 2,029,107 1,975,909 1,975,909-2.62%Other Expenses 1,371,454 1,212,418 1,379,354 969,435 969,435-29.72%Total Expenses 3,356,011 3,241,525 3,408,461 2,945,344 2,945,344-13.59%
General Fund 97,682 126,262 126,262 75,316 75,316-40.35%State Gas Tax 1,518,419 2,835,202 2,850,138 2,595,047 2,595,047-8.95%Traffic Safety 311,709 280,061 280,061 271,965 271,965-2.89%TDA/LTF8-CIP Fund-99400a 1,428,201 0 0 3,016 3,0162009 Lease Purchase Equipment 0 0 152,000 0 0-100.00%
3,356,011 3,241,525 3,408,461 2,945,344 2,945,344-13.59%Total All Funds
Account Clerk I/II 0.14 0.14 0.15 0.15 0.15Account Clerk III 0.14 0.14 0.00 0.00 0.00Administrative Secretary III 0.05 0.05 1.00 1.00 1.00Administrative Technician 1.00 1.00 1.00 1.00 1.00Data Entry Operator I/II 0.14 0.14 0.00 0.00 0.00Equipment Operator 6.00 6.00 6.00 6.00 6.00Office Assistant I/II 0.05 0.05 0.05 0.05 0.05Senior Street Maintenance Worker 4.00 4.00 4.00 4.00 4.00Street Maintenance Worker I/II 7.00 7.00 7.00 7.00 7.00Street Manager 0.00 0.00 1.00 1.00 1.00Traffic Safety Maintenance Worker 2.00 2.00 2.00 2.00 2.00Traffic Signal Repairer I/II 0.00 0.00 2.00 2.00 2.00Traffic Signal Technician 0.00 0.00 1.00 1.00 1.00
20.52 20.52 25.20 25.20 25.20Total Personnel

Public Works Construction and Design Services Parking Lots
Activities / Functions
202
The City’s Street Maintenance Division performs the maintenance in the City’s parking lots. Their mission is to provide safe, clean,well-maintained parking areas to attract residents, customers, and visitors to the City’s business and recreation areas. Currently, 63 public parking lots are maintained by the Parking Lot Program. As part of the downtown revitalization project, the 18parking lots in the downtown area are swept weekly with the other 45 public parking lots throughout the City being swept monthly. The Parking Lot program also maintains the striping and signage within these lots.

%Change
Public Works Construction and Design Services Parking Lots
203
Expenses by Category
Expenses by Fund %Change
Personnel
2009-10Actual
2010-11Budget
2010-11Revised
2011-12Recommended
2012-13Proposed
2009-10Actual
2010-11Budget
2010-11Revised
2011-12Recommended
2012-13Proposed
2009-10Actual
2010-11Budget
2010-11Revised
2011-12Recommend
2012-13Proposed
Salaries and Benefits 0 0 0 0 0Other Expenses 195,404 221,840 221,840 217,614 217,614-1.90%Total Expenses 195,404 221,840 221,840 217,614 217,614-1.90%
General Fund 195,404 221,840 221,840 217,614 217,614-1.90%195,404 221,840 221,840 217,614 217,614-1.90%Total All Funds
No full-time equivalent positions budgeted. 0.00 0.00 0.00 0.00 0.000.00 0.00 0.00 0.00 0.00Total Personnel

Public Works Construction and Design Services Surveying Services
Activities / Functions
204
The function and purpose of the Surveying Division is to improve the quality of Public Works projects in Oxnard by providing City programs, private surveyors, engineers, and contractors with professional, high quality, and timely survey services. To meet these goals, the City’s Surveyors provide a number of related services including map checking services for developers, design engineers, and contractors. This work is performed within established time frames including five-day design surveys; same-day construction staking and seven-day map-checking services. The City’s Surveyors also provide same-day research services to privatesurveyors, engineers, and property owners. The Surveying Division also improves the quality of public infrastructure constructed by and for the City through efficient surveying services of capital improvement and private development projects. As part of this goal, the prompt and accurate preparation of publicutilities and right-of-way easements is always a consideration for the Division. The Surveying Division’s dedicated staff strives to maintain its better than 98 percent track record when it comes to response times for survey requests, staking requests and the work products of the survey team. To maintain this high level of success and accuracy, the City’s Surveyors continue to invest in advanced and emerging technologies including laser equipment, GPS hardware and softwareand advanced computer technologies such as AutoCAD software and related equipment.

%Change
Public Works Construction and Design Services Surveying Services
205
Expenses by Category
Expenses by Fund %Change
Personnel
2009-10Actual
2010-11Budget
2010-11Revised
2011-12Recommended
2012-13Proposed
2009-10Actual
2010-11Budget
2010-11Revised
2011-12Recommended
2012-13Proposed
2009-10Actual
2010-11Budget
2010-11Revised
2011-12Recommend
2012-13Proposed
Salaries and Benefits 279,985 325,503 325,503 329,016 329,0161.08%Other Expenses 54,023 104,076 104,076 73,804 73,804-29.09%Total Expenses 334,008 429,579 429,579 402,820 402,820-6.23%
General Fund 334,008 429,579 429,579 402,820 402,820-6.23%334,008 429,579 429,579 402,820 402,820-6.23%Total All Funds
City Surveyor 1.00 1.00 1.00 1.00 1.00Engineering/Survey Technician II 1.00 1.00 1.00 1.00 1.00Senior Engineering Technician/Survey Chief 1.00 1.00 1.00 1.00 1.00
3.00 3.00 3.00 3.00 3.00Total Personnel


%Change
Expenses by Category
Public Works Utilities Services Branch Summary
207
%Change
%Change
Expenses by Fund
Expenses by Program 2009-10Actual
2010-11Budget
2010-11Revised
2011-12Recommended
2012-13Proposed
2009-10Actual
2010-11Budget
2010-11Revised
2011-12Recommended
2012-13Proposed
2009-10Actual
2010-11Budget
2010-11Revised
2011-12Recommended
2012-13Proposed
Salaries and Benefits 19,196,075 18,090,280 18,090,280 17,133,080 17,116,507-5.29%Other Expenses 68,219,670 77,748,628 77,367,531 70,377,687 70,631,079-9.03%Total Expenses 87,415,745 95,838,908 95,457,811 87,510,767 87,747,586-8.33%
Water Operating 27,889,945 37,880,254 36,603,648 32,342,286 32,325,713-11.64%Water Connection Fees 0 10,000 10,000 60,000 260,000500.00%Water Security 793,948 526,223 838,522 752,940 767,940-10.21%Wastewater Collection 6,164,668 5,848,397 5,940,868 5,445,913 5,445,913-8.33%W/W Treatment Operating 4,149,965 495,000 495,000 253,625 299,917-48.76%Wastewater Treatment 11,038,707 11,999,914 12,490,653 10,740,298 10,740,298-14.01%Solid Waste 37,378,512 38,989,620 38,989,620 37,860,705 37,852,805-2.90%Solid Waste Developer Fee 0 89,500 89,500 55,000 55,000-38.55%
87,415,745 95,838,908 95,457,811 87,510,767 87,747,586-8.33%Total All Funds
Water Procurement 21,653,330 31,295,507 30,189,681 7,979,707 7,979,707-73.57%Water Conservation & Education 307,407 710,031 638,151 383,238 383,238-39.95%Water Production 1,679,816 1,919,618 1,820,718 20,595,924 20,595,9241031.20%Water Distribution 4,121,209 3,855,401 3,855,401 2,755,449 2,755,449-28.53%Water Metering 0 -92,271 -92,271 446,000 446,000-583.36%Water Connection Fee 0 10,000 10,000 60,000 260,000500.00%Water Security & Contamination Prevention
793,948 526,223 838,522 752,940 767,940-10.21%
Source Control 1,656,540 1,592,231 1,592,231 1,586,154 1,586,154-0.38%Storm Water Quality Mgt. 960,790 1,246,091 1,039,213 838,092 838,092-19.35%Collection Syst. Maint. 2,884,292 2,267,574 2,592,613 2,391,645 2,391,645-7.75%Flood Control 608,445 658,250 632,560 550,771 550,771-12.93%Wastewater Coll. Connection 4,149,965 495,000 495,000 253,625 299,917-48.76%Laboratory Services 1,418,176 1,419,668 1,441,668 1,536,395 1,536,3956.57%Treatment Plant Operations 6,342,844 6,230,049 7,212,049 5,896,389 5,896,389-18.24%Treatment Plant Maint. 3,211,051 4,265,946 3,752,685 3,228,263 3,228,263-13.97%Environ. Res. Planning 1,938,376 1,827,029 1,717,029 2,231,650 2,223,75029.97%Waste Reduction & Education 347,077 501,918 501,918 345,927 345,927-31.08%Environ. Res. Residential 5,038,941 5,100,442 5,212,442 4,637,696 4,637,696-11.03%Environ. Res. Commercial 3,770,165 3,536,810 3,593,810 3,831,419 3,831,4196.61%Environ. Res. Industrial 1,549,179 1,944,276 1,949,276 1,190,931 1,190,931-38.90%Environ. Res. Processing 24,618,956 25,972,059 25,908,059 25,491,496 25,491,496-1.61%Public Information - Special Projects
365,238 557,056 557,056 527,056 510,483-5.39%
87,415,745 95,838,908 95,457,811 87,510,767 87,747,586-8.33%Total All Programs

Public Works Utilities Services Water Procurement
Activities / Functions
208
The Water Procurement Program provides long-range water resources planning and enterprise business administration, in order tominimize the loss of the City’s existing water supplies to competing uses and to advance the development of new water supplies, and to ensure stable long-term operations for the City’s water utility customers. The Water Procurement Program provides the planning and business functions of the City’s water enterprise. The Water ProcurementProgram negotiates and manages agreements with water wholesale agencies, environmental organizations and regulatory agencies, in order to protect and manage current supplies and to develop new water supplies. The program works to develop the City’s recycled water program, which will help to meet future water demands. The Water Procurement Program works closely with the Planning & Environmental Services, Building & Engineering, Capital Projects Management, Utility Billing, Finance, Water Production & Treatment, Water Distribution, Water Metering, Water Conservation and Education, and Water Quality and Cross-Connection ControlPrograms on business management issues to ensure long-term, stable operations for the City’s utilities customers.

%Change
Public Works Utilities Services Water Procurement
209
Expenses by Category
Expenses by Fund %Change
Personnel
2009-10Actual
2010-11Budget
2010-11Revised
2011-12Recommended
2012-13Proposed
2009-10Actual
2010-11Budget
2010-11Revised
2011-12Recommended
2012-13Proposed
2009-10Actual
2010-11Budget
2010-11Revised
2011-12Recommend
2012-13Proposed
Salaries and Benefits 480,916 470,139 470,139 494,084 494,0845.09%Other Expenses 21,172,414 30,825,368 29,719,542 7,485,623 7,485,623-74.81%Total Expenses 21,653,330 31,295,507 30,189,681 7,979,707 7,979,707-73.57%
Water Operating 21,653,330 31,295,507 30,189,681 7,979,707 7,979,707-73.57%21,653,330 31,295,507 30,189,681 7,979,707 7,979,707-73.57%Total All Funds
Account Clerk I/II 0.20 0.20 0.20 0.20 0.20Account Clerk III 0.20 0.20 0.00 0.00 0.00Administrative Secretary III 0.00 0.00 1.00 1.00 1.00Administrative Technician 0.33 0.33 0.33 0.33 0.33Data Entry Operator I/II 0.20 0.20 0.00 0.00 0.00Management Analyst I/II 0.00 0.00 0.50 0.50 0.50Management Analyst III 0.34 0.34 0.00 0.00 0.00Office Assistant I/II 1.30 1.30 0.30 0.30 0.30Public Works Construction Project Manager 2.00 2.00 1.00 1.00 1.00Utility Services Manager 0.33 0.33 0.33 0.33 0.33Water Programs Manager 0.50 0.50 1.00 1.00 1.00Water Resources Manager 0.50 0.50 0.50 0.50 0.50
5.90 5.90 5.16 5.16 5.16Total Personnel

Public Works Utilities Services Water Conservation & Education
Activities / Functions
210
The Water Conservation and Education Program protects future water resources through effective conservation practices by providingeducation and training, funding opportunities, and technical assistance to all City water customers. This Program provides for the planning, coordinating and implementation of efficient utilization of the City’s water resources. Activities include the review and analysis of Citywide water usage, preparation and dissemination of public information materials,providing follow-up and response to inquires and complaints, compiling and verifying data, providing incentives to local businesses and individuals to conserve water, and reporting of water conservation activities to state regulatory agencies. The Conservation Program works closely with other City programs, including developing standards for water-efficient landscaping, retrofitting of existing public buildings with water-efficient plumbing fixtures, and retrofitting of existing public parks and open spaces with water-efficient irrigation control systems. The Program also monitors and enforces the City Code requirements prohibiting water waste.

%Change
Public Works Utilities Services Water Conservation & Education
211
Expenses by Category
Expenses by Fund %Change
Personnel
2009-10Actual
2010-11Budget
2010-11Revised
2011-12Recommended
2012-13Proposed
2009-10Actual
2010-11Budget
2010-11Revised
2011-12Recommended
2012-13Proposed
2009-10Actual
2010-11Budget
2010-11Revised
2011-12Recommend
2012-13Proposed
Salaries and Benefits 203,994 225,731 225,731 227,362 227,3620.72%Other Expenses 103,413 484,300 412,420 155,876 155,876-62.20%Total Expenses 307,407 710,031 638,151 383,238 383,238-39.95%
Water Operating 307,407 710,031 638,151 383,238 383,238-39.95%307,407 710,031 638,151 383,238 383,238-39.95%Total All Funds
Water Conservation/Outreach Coordinator 1.00 1.00 1.00 1.00 1.00Water Conservation/Outreach Technician 2.00 2.00 2.00 2.00 2.00
3.00 3.00 3.00 3.00 3.00Total Personnel

Public Works Utilities Services Water Production
Activities / Functions
212
The Water Production and Treatment Program supplies the City’s almost 40,000 water customers with a reliable potable water supply that is both aesthetically pleasing and meets or exceeds current Federal and State drinking water standards. The Water Production and Treatment Program produces approximately 30% of the City’s water supply through City-owned water wells in three wellfields; removes dissolved minerals from water from one of the wellfields with reverse osmosis treatment; blends this locally produced water with water purchased from regional wholesale water agencies; treats the water; and transmits it to theCity’s water distribution system via five blending stations. Using a computerized system with remote monitoring devices and datacommunication equipment, the Program monitors the sources of supply, the treatment and blending operations at the Desalter and blending stations, and the operation of water distribution system. The Water Production and Treatment Program also maintains, repairs, rehabilitates, and replaces the assets associated with the three wellfields, the emergency power generation equipment, thetreatment systems, the blending stations, and the water system control and monitoring equipment. The Program will also operate the Recycled Water Distribution System, now under construction.

%Change
Public Works Utilities Services Water Production
213
Expenses by Category
Expenses by Fund %Change
Personnel
2009-10Actual
2010-11Budget
2010-11Revised
2011-12Recommended
2012-13Proposed
2009-10Actual
2010-11Budget
2010-11Revised
2011-12Recommended
2012-13Proposed
2009-10Actual
2010-11Budget
2010-11Revised
2011-12Recommend
2012-13Proposed
Salaries and Benefits 786,149 694,618 694,618 640,701 640,701-7.76%Other Expenses 893,667 1,225,000 1,126,100 19,955,223 19,955,2231672.06%Total Expenses 1,679,816 1,919,618 1,820,718 20,595,924 20,595,9241031.20%
Water Operating 1,679,816 1,919,618 1,820,718 20,595,924 20,595,9241031.20%1,679,816 1,919,618 1,820,718 20,595,924 20,595,9241031.20%Total All Funds
Chief Operator 1.00 1.00 1.00 1.00 1.00Senior Water Treatment Operator 1.00 1.00 1.00 1.00 1.00Water Treatment Operator I/II/III 5.00 5.00 5.00 5.00 5.00
7.00 7.00 7.00 7.00 7.00Total Personnel

Public Works Utilities Services Water Distribution
Activities / Functions
214
The Water Distribution Program provides operation of and maintenance and repairs to the City’s over 500 miles of water pipelines, inorder to provide high-quality, reliable, pressurized water service to the City’s approximately 40,000 water customers, in compliance with all regulatory requirements. The Water Distribution Program provides for the maintenance of the City’s 500 miles of pipelines, varying in diameter from 6-inch to 48-inch, in order to maintain water quality from the treatment plants and blending stations to every customer. The Program performs leak detection activities and makes repairs promptly, in order to minimize water losses, and also makes recommendations for capitalprojects to replace aging sections of pipeline. It also performs water distribution system flushing, in order to minimize the chances ofwater quality problems in the piping. The Water Distribution Program reviews and conditions proposed changes to the waterdistribution system, and plans and constructs some new customer connections. The Program maintains the City’s fire hydrants, in order to ensure that they are fully functional for fire suppression activities. The Water Distribution Program also provides operation of and maintenance and repairs to the City’s new recycled water distribution system, now under construction.

%Change
Public Works Utilities Services Water Distribution
215
Expenses by Category
Expenses by Fund %Change
Personnel
2009-10Actual
2010-11Budget
2010-11Revised
2011-12Recommended
2012-13Proposed
2009-10Actual
2010-11Budget
2010-11Revised
2011-12Recommended
2012-13Proposed
2009-10Actual
2010-11Budget
2010-11Revised
2011-12Recommend
2012-13Proposed
Salaries and Benefits 2,966,180 2,867,401 2,867,401 2,525,279 2,525,279-11.93%Other Expenses 1,155,029 988,000 988,000 230,170 230,170-76.70%Total Expenses 4,121,209 3,855,401 3,855,401 2,755,449 2,755,449-28.53%
Water Operating 4,121,209 3,855,401 3,855,401 2,755,449 2,755,449-28.53%4,121,209 3,855,401 3,855,401 2,755,449 2,755,449-28.53%Total All Funds
Chief Operator 1.00 1.00 1.00 1.00 1.00Engineer 0.00 0.00 1.00 1.00 1.00Meter Reader 9.00 9.00 9.00 9.00 9.00Meter Repair Worker 4.00 4.00 4.00 4.00 4.00Public Works Construction Project Manager 0.00 0.00 1.00 1.00 1.00Senior Meter Reader 1.00 1.00 1.00 1.00 1.00Senior Meter Repair Worker 1.00 1.00 1.00 1.00 1.00Senior Water Distribution Operator 2.00 2.00 2.00 2.00 2.00Water Distribution Operator I 10.00 10.00 8.00 8.00 8.00Water Distribution Operator II 3.00 3.00 5.00 5.00 5.00
31.00 31.00 33.00 33.00 33.00Total Personnel

Public Works Utilities Services Water Metering
Activities / Functions
216
The Water Metering Program provides accurate metering, leak detection and field customer service to the City’s over 40,000customers. The Water Metering Program provides for the installation, reading, testing, maintenance, and replacement of over 40,000 customer meters. The program improves meter reading accuracy and efficiency by utilizing a computerized radio reading system, and maximizes billable water usage and customer equity by actively replacing aging or malfunctioning water meters and equipment. The Program also conducts leak detection surveys, assists customers with correcting water leaks or inefficiencies in their private on-site plumbing systems, and coordinates closely with the Water Conservation Program. Program staff serves as the primary field contact with the City’s water, wastewater and new recycled water systems, and coordinates with the Utility Billing Program.

%Change
Public Works Utilities Services Water Metering
217
Expenses by Category
Expenses by Fund %Change
Personnel
2009-10Actual
2010-11Budget
2010-11Revised
2011-12Recommended
2012-13Proposed
2009-10Actual
2010-11Budget
2010-11Revised
2011-12Recommended
2012-13Proposed
2009-10Actual
2010-11Budget
2010-11Revised
2011-12Recommend
2012-13Proposed
Salaries and Benefits 0 -92,271 -92,271 36,000 36,000-139.02%Other Expenses 0 0 0 410,000 410,000Total Expenses 0 -92,271 -92,271 446,000 446,000-583.36%
Water Operating 0 -92,271 -92,271 446,000 446,000-583.36%0 -92,271 -92,271 446,000 446,000-583.36%Total All Funds

Public Works Utilities Services Water Connection Fee
Activities / Functions
218
The Water Connection Fees Program offsets the negative impacts of new water customers on the existing water supplies and existing water system through the development of new water resources and increases in water system capacity. The Program is funded through fees. The two sub-funds are the Water Resources Development Fund and the Water Capital Facilities Fund. The City’s existing water supplies, local groundwater and imported State Water Project water, will not be able to meet anticipated future increases in water demands by new customers. The Water Resources Development Fund, supported by the Water Resources Development fee, will pay for the development of new water sources, such as recycled water, which can offset drinking water demands, and water conservation projects, which can yield permanent reductions in water demand. The Water Capital Facilities Fund,supported by the Water Capital Facilities fee, will pay for master-planned capacity improvements to the City’s water system, such as addition of new production, treatment, storage, transmission and distribution facilities.

%Change
Public Works Utilities Services Water Connection Fee
219
Expenses by Category
Expenses by Fund %Change
Personnel
2009-10Actual
2010-11Budget
2010-11Revised
2011-12Recommended
2012-13Proposed
2009-10Actual
2010-11Budget
2010-11Revised
2011-12Recommended
2012-13Proposed
2009-10Actual
2010-11Budget
2010-11Revised
2011-12Recommend
2012-13Proposed
Salaries and Benefits 0 0 0 0 0Other Expenses 0 10,000 10,000 60,000 260,000500.00%Total Expenses 0 10,000 10,000 60,000 260,000500.00%
Water Connection Fees 0 10,000 10,000 60,000 260,000500.00%0 10,000 10,000 60,000 260,000500.00%Total All Funds

Public Works Utilities Services Water Security & Contamination Prevention
Activities / Functions
220
The Water Quality and Cross Connection Control Program provides monitoring of the quality of the City’s water supplies, fromsource to treatment to customers, minimizes the risk of customer activities leading to contamination of the water in the distribution system, and maintains security to water system facilities. The Water Quality and Cross Connection Control Program provides monitoring of water quality, management of the City’s watersecurity systems, and oversight of customers’ backflow prevention devices. The Program conducts sampling and analysis, manages contract laboratories, maintains records, and reports to regulatory agencies regarding the water quality of the City’s source waters,treated water at the blending stations, and water within the distribution system. The Program analyzes risks to the security of thewater system, and plans and carries out projects and programs to minimize those risks. The Program also oversees several thousand private backflow prevention devices, which prevent the activities of customers from causing contamination to the City’s waterdistribution system, including reviewing and conditioning development projects, inspecting installations, distributing test notices,maintaining records, and enforcing state and local regulations. The Water Quality and Cross Connection Control Program provides the monitoring of the City’s Recycled Water system, now under construction. The Program conducts sampling and analysis, maintains records and reports to regulatory agencies regarding the recycled water quality and cross-connection control of the recycled water distribution system. The Program conducts site visits to protect against cross connection with the potable water system, protection of overspray, proper signage, and review customer training.

%Change
Public Works Utilities Services Water Security & Contamination Prevention
221
Expenses by Category
Expenses by Fund %Change
Personnel
2009-10Actual
2010-11Budget
2010-11Revised
2011-12Recommended
2012-13Proposed
2009-10Actual
2010-11Budget
2010-11Revised
2011-12Recommended
2012-13Proposed
2009-10Actual
2010-11Budget
2010-11Revised
2011-12Recommend
2012-13Proposed
Salaries and Benefits 398,362 304,241 304,241 298,135 298,135-2.01%Other Expenses 395,586 221,982 534,281 454,805 469,805-14.88%Total Expenses 793,948 526,223 838,522 752,940 767,940-10.21%
Water Security 793,948 526,223 838,522 752,940 767,940-10.21%793,948 526,223 838,522 752,940 767,940-10.21%Total All Funds
Water Regulatory Compliance Coordinator 1.00 1.00 1.00 1.00 1.00Water Regulatory Compliance Technician I/II 2.00 2.00 2.00 2.00 2.00
3.00 3.00 3.00 3.00 3.00Total Personnel

Public Works Utilities Services Source Control
Activities / Functions
222
The Source Control Program provides regulatory compliance oversight to other City programs, the City’s industrial and business community, the Naval Base Ventura County, some unincorporated areas of Ventura County served by the City, and the City of Port Hueneme, including the Pretreatment Program, as required by the City’s National Pollutant Discharge Elimination System (NPDES)permit for the Wastewater System. The Source Control Program’s primary purpose is to protect the City’s Wastewater Collection System and Wastewater TreatmentPlant from potentially harmful discharges from the approximately 2,400 industrial and commercial customers, and to a lesser extent from residential customers. The Pretreatment Program, an important component of the Source Control Program, focuses on reducingthe level of pollutants discharged by industrial and other significant non-domestic wastewater sources into the City’s wastewater system. The goal is to prevent pollutants from these facilities from passing through the Wastewater Collection System and the Wastewater Treatment Plant and causing impacts to the Pacific Ocean; to protect the Collection System and Treatment Plant from potential damage from biological, explosive, flammable, and hazardous wastes; and, to improve the quality of effluents and sludges so that they can be used for beneficial purposes. The Source Control Program also includes inspections of restaurants and other foodservice facilities, in order to reduce discharges of grease to the Collection System and thereby reduce wastewater overflows and spills.

%Change
Public Works Utilities Services Source Control
223
Expenses by Category
Expenses by Fund %Change
Personnel
2009-10Actual
2010-11Budget
2010-11Revised
2011-12Recommended
2012-13Proposed
2009-10Actual
2010-11Budget
2010-11Revised
2011-12Recommended
2012-13Proposed
2009-10Actual
2010-11Budget
2010-11Revised
2011-12Recommend
2012-13Proposed
Salaries and Benefits 694,578 583,297 583,297 581,525 581,525-0.30%Other Expenses 961,962 1,008,934 1,008,934 1,004,629 1,004,629-0.43%Total Expenses 1,656,540 1,592,231 1,592,231 1,586,154 1,586,154-0.38%
Wastewater Collection 1,656,540 1,592,231 1,592,231 1,586,154 1,586,154-0.38%1,656,540 1,592,231 1,592,231 1,586,154 1,586,154-0.38%Total All Funds
Account Clerk I/II 0.16 0.16 0.00 0.00 0.00Account Clerk III 0.16 0.16 0.00 0.00 0.00Administrative Secretary III 0.65 0.65 0.00 0.00 0.00Data Entry Operator I/II 0.16 0.16 1.00 1.00 1.00Office Assistant I/II 0.15 0.15 0.00 0.00 0.00Senior Wastewater Environmental Specialist 1.00 1.00 1.00 1.00 1.00Source Control Inspector I/II 1.00 1.00 1.00 1.00 1.00Source Control Technician 0.75 0.75 0.75 0.75 0.75Technical Services Manager 0.50 0.50 0.50 0.50 0.50Wastewater Environmental Specialist 2.00 2.00 2.00 2.00 2.00
6.53 6.53 6.25 6.25 6.25Total Personnel

Public Works Utilities Services Storm Water Quality Mgt.
Activities / Functions
224
The Stormwater Quality Management Program provides services that emphasize coordination with other City programs andcompliance with the Countywide National Pollutant Discharge Elimination System (NPDES) Storm Water Permit. Stormwater discharges are generated by runoff from land and impervious areas, such as paved streets, parking lots, and building rooftops during rainfall events that often contain pollutants in quantities that could adversely affect water quality. Most storm water discharges are considered point sources and require coverage by an NPDES permit. The objectives of this Program is to enhance, protect and preserve water quality in the City of Oxnard water bodies using proactive and innovative ideas for preservation ofbiodiversity, ecological viability and human health. This Program works on a countywide team with other public agencies, privateenterprises, the environmental community, and the general public to locally implement Clean Water Act requirements.

%Change
Public Works Utilities Services Storm Water Quality Mgt.
225
Expenses by Category
Expenses by Fund %Change
Personnel
2009-10Actual
2010-11Budget
2010-11Revised
2011-12Recommended
2012-13Proposed
2009-10Actual
2010-11Budget
2010-11Revised
2011-12Recommended
2012-13Proposed
2009-10Actual
2010-11Budget
2010-11Revised
2011-12Recommend
2012-13Proposed
Salaries and Benefits 405,830 390,131 390,131 377,559 377,559-3.22%Other Expenses 554,960 855,960 649,082 460,533 460,533-29.05%Total Expenses 960,790 1,246,091 1,039,213 838,092 838,092-19.35%
Wastewater Collection 960,790 1,246,091 1,039,213 838,092 838,092-19.35%960,790 1,246,091 1,039,213 838,092 838,092-19.35%Total All Funds
Senior Wastewater Environmental Specialist 1.00 1.00 1.00 1.00 1.00Source Control Technician 0.25 0.25 0.25 0.25 0.25Technical Services Manager 0.50 0.50 0.50 0.50 0.50Utility Services Manager 0.05 0.05 0.00 0.00 0.00Wastewater Environmental Specialist 2.00 2.00 2.00 2.00 2.00
3.80 3.80 3.75 3.75 3.75Total Personnel

Public Works Utilities Services Collection Syst. Maint.
Activities / Functions
226
The Collection System Maintenance and Upgrades Program provides maintenance, repair and upgrade service for the City’swastewater collection system, including more than 400 miles of sewer lines and 15 lift stations, on both a routine and emergency basis in a cost-efficient, customer-oriented manner. This Program’s major maintenance activities fall into two basic categories – “Phase Cleaning” and “Grease Cutting.” Phase Cleaning is a hydro cleaning and vacuuming procedure, which removes accumulated material and debris from the interior of the wastewater piping, to keep them open and flowing to full capacity. By scheduling different sections of the system, the entire system receives ahigh-pressure flush at least once a year. Grease Cutting utilizes high-pressure to remove accumulated grease from wastewater pipes in areas of the City with larger concentrations of restaurants. Both of these activities minimize the possibility of blockages and wastewater overflows. The Program provides services to approximately 33,200 residential customers and 2,400 commercial and industrial customers. The Program also performs periodic video inspections and flow monitoring of the City’s wastewater collectionpiping, and performs point repairs to any piping or structures found to be deficient.

%Change
Public Works Utilities Services Collection Syst. Maint.
227
Expenses by Category
Expenses by Fund %Change
Personnel
2009-10Actual
2010-11Budget
2010-11Revised
2011-12Recommended
2012-13Proposed
2009-10Actual
2010-11Budget
2010-11Revised
2011-12Recommended
2012-13Proposed
2009-10Actual
2010-11Budget
2010-11Revised
2011-12Recommend
2012-13Proposed
Salaries and Benefits 1,035,820 959,239 959,239 842,344 842,344-12.19%Other Expenses 1,848,472 1,308,335 1,633,374 1,549,301 1,549,301-5.15%Total Expenses 2,884,292 2,267,574 2,592,613 2,391,645 2,391,645-7.75%
Wastewater Collection 2,884,292 2,267,574 2,592,613 2,391,645 2,391,645-7.75%2,884,292 2,267,574 2,592,613 2,391,645 2,391,645-7.75%Total All Funds
Account Clerk I/II 0.00 0.00 0.22 0.22 0.22Administrative Technician 0.00 0.00 0.17 0.17 0.17Civil Engineer 0.25 0.25 0.00 0.00 0.00Electrician/Instrumentation Technician 0.20 0.20 0.00 0.00 0.00Instrumentation Technician 0.15 0.15 0.00 0.00 0.00Management Analyst I/II 0.00 0.00 0.25 0.25 0.25Office Assistant I/II 0.00 0.00 0.15 0.15 0.15Senior Wastewater Collection Operator 1.00 1.00 1.00 1.00 1.00Senior Wastewater Mechanic 1.00 1.00 1.00 1.00 1.00Treatment Plant Electrician 0.50 0.50 0.25 0.25 0.25Utility Services Manager 0.09 0.09 0.17 0.17 0.17Wastewater Collection Operator I/II 4.00 4.00 5.00 5.00 5.00Wastewater Collection Supervisor 0.50 0.50 0.50 0.50 0.50Wastewater Maintenance Manager 0.25 0.25 0.50 0.50 0.50Wastewater Maintenance Supervisor 0.50 0.50 0.25 0.25 0.25Wastewater Mechanic I/II 0.00 0.00 1.00 1.00 1.00Water Programs Manager 0.25 0.25 0.00 0.00 0.00Water Resources Manager 0.25 0.25 0.25 0.25 0.25
8.94 8.94 10.71 10.71 10.71Total Personnel

Public Works Utilities Services Flood Control
Activities / Functions
228
The Flood Control Program provides maintenance, repair, upgrade and stormwater quality compliance service for the City’s storm water collection system, including its catch basins, stormwater lift stations, drainage pipes and ditches, on both a routine and emergency basis. The Flood Control Program operates, maintains, and upgrades over 3,500 catch basins, 4 stormwater lift stations, and 450 miles ofdrainage pipes and ditches that make up the City’s Stormwater Collection System. The Program also inspects, maintains and repairs 200 structural stormwater quality systems, in order to comply with Best Management Practices (BMPs) required by the CountywideStormwater Quality National Pollutant Discharge Elimination System (NPDES) permit. The Program also provides storm patrols during rainfall events to keep storm drainage systems working and to prevent or minimize localized flooding.

%Change
Public Works Utilities Services Flood Control
229
Expenses by Category
Expenses by Fund %Change
Personnel
2009-10Actual
2010-11Budget
2010-11Revised
2011-12Recommended
2012-13Proposed
2009-10Actual
2010-11Budget
2010-11Revised
2011-12Recommended
2012-13Proposed
2009-10Actual
2010-11Budget
2010-11Revised
2011-12Recommend
2012-13Proposed
Salaries and Benefits 224,356 213,423 213,423 180,644 180,644-15.36%Other Expenses 384,089 444,827 419,137 370,127 370,127-11.69%Total Expenses 608,445 658,250 632,560 550,771 550,771-12.93%
Wastewater Collection 608,445 658,250 632,560 550,771 550,771-12.93%608,445 658,250 632,560 550,771 550,771-12.93%Total All Funds
Wastewater Collection Operator I/II 2.00 2.00 2.00 2.00 2.00Wastewater Collection Supervisor 0.50 0.50 0.50 0.50 0.50Wastewater Maintenance Manager 0.25 0.25 0.00 0.00 0.00
2.75 2.75 2.50 2.50 2.50Total Personnel

Public Works Utilities Services Wastewater Coll. Connection
Activities / Functions
230
The Wastewater Connection Fees Program offsets the negative impacts of new wastewater customers on the existing wastewater collection system and wastewater treatment plant through increases in wastewater system capacity. The Program is funded through fees. The Wastewater Connection Fees Fund, supported by the Wastewater Connection fee, will pay for master-planned capacity improvements to the City’s wastewater system, such as addition of new collection, flow equalization, and treatment facilities.

%Change
Public Works Utilities Services Wastewater Coll. Connection
231
Expenses by Category
Expenses by Fund %Change
Personnel
2009-10Actual
2010-11Budget
2010-11Revised
2011-12Recommended
2012-13Proposed
2009-10Actual
2010-11Budget
2010-11Revised
2011-12Recommended
2012-13Proposed
2009-10Actual
2010-11Budget
2010-11Revised
2011-12Recommend
2012-13Proposed
Salaries and Benefits 0 0 0 0 0Other Expenses 4,149,965 495,000 495,000 253,625 299,917-48.76%Total Expenses 4,149,965 495,000 495,000 253,625 299,917-48.76%
W/W Treatment Operating 4,149,965 495,000 495,000 253,625 299,917-48.76%4,149,965 495,000 495,000 253,625 299,917-48.76%Total All Funds

Public Works Utilities Services Laboratory Services
Activities / Functions
232
The Laboratory Services Program provides laboratory analyses of biological and chemical constituents of wastewater, water, recycledwater, stormwater, biosolids and industrial wastewater. The Laboratory Services Program operates a state-certified environmental laboratory, analyzing nearly 25,000 samples per year. The Program’s fully equipped microbiology laboratory tests samples for coliform bacteria, and the metals laboratory tests for variousinorganic chemical contaminants. The Program is certified by the California Environmental Laboratories Assessment Program andmaintains strict quality control/quality assurance standards.

%Change
Public Works Utilities Services Laboratory Services
233
Expenses by Category
Expenses by Fund %Change
Personnel
2009-10Actual
2010-11Budget
2010-11Revised
2011-12Recommended
2012-13Proposed
2009-10Actual
2010-11Budget
2010-11Revised
2011-12Recommended
2012-13Proposed
2009-10Actual
2010-11Budget
2010-11Revised
2011-12Recommend
2012-13Proposed
Salaries and Benefits 421,479 419,238 419,238 486,099 486,09915.95%Other Expenses 996,697 1,000,430 1,022,430 1,050,296 1,050,2962.73%Total Expenses 1,418,176 1,419,668 1,441,668 1,536,395 1,536,3956.57%
Wastewater Treatment 1,418,176 1,419,668 1,441,668 1,536,395 1,536,3956.57%1,418,176 1,419,668 1,441,668 1,536,395 1,536,3956.57%Total All Funds
Chemist 1.00 1.00 1.00 1.00 1.00Laboratory Assistant 1.00 1.00 1.00 1.00 1.00Laboratory Supervisor 1.00 1.00 1.00 1.00 1.00Laboratory Technician 2.00 2.00 2.00 2.00 2.00Utility Services Manager 0.05 0.05 0.00 0.00 0.00Wastewater Operations Manager 0.25 0.25 0.25 0.25 0.25
5.30 5.30 5.25 5.25 5.25Total Personnel

Public Works Utilities Services Treatment Plant Operations
Activities / Functions
234
The Wastewater Treatment Plant Operations Program provides wastewater treatment services that emphasize dependable operations,regulatory compliance, reuse of biosolids, recycling of effluent, and stable user rates. This Program operates the City’s Wastewater Treatment Plant, which utilizes primary and secondary treatment and anaerobic sludgedigestion to treat approximately 25 million gallons of wastewater each day or 9 billion gallons each year. Treated effluent isdischarged to the Pacific Ocean, in compliance with the City’s National Pollutant Discharge Elimination System (NPDES) wastewaterpermit. The Treatment Plant handles incoming flows from approximately 33,200 residential customers and 2,400 commercial andindustrial customers of the Cities of Oxnard and Port Hueneme, the Naval Base Ventura County, the Channel Islands BeachCommunity Services District, naval bases, a portion of the City of Camarillo and some unincorporated areas of Ventura County. Inaddition, the Treatment Plant uses air scrubbers to remove odors from the treatment process to minimize adverse impacts tosurrounding businesses and residences and produces a significant amount of its electricity needs through on-site biogas cogeneration equipment.

%Change
Public Works Utilities Services Treatment Plant Operations
235
Expenses by Category
Expenses by Fund %Change
Personnel
2009-10Actual
2010-11Budget
2010-11Revised
2011-12Recommended
2012-13Proposed
2009-10Actual
2010-11Budget
2010-11Revised
2011-12Recommended
2012-13Proposed
2009-10Actual
2010-11Budget
2010-11Revised
2011-12Recommend
2012-13Proposed
Salaries and Benefits 2,322,742 1,932,297 1,932,297 1,895,171 1,895,171-1.92%Other Expenses 4,020,102 4,297,752 5,279,752 4,001,218 4,001,218-24.22%Total Expenses 6,342,844 6,230,049 7,212,049 5,896,389 5,896,389-18.24%
Wastewater Treatment 6,342,844 6,230,049 7,212,049 5,896,389 5,896,389-18.24%6,342,844 6,230,049 7,212,049 5,896,389 5,896,389-18.24%Total All Funds
Account Clerk I/II 0.16 0.16 0.00 0.00 0.00Account Clerk III 0.16 0.16 0.00 0.00 0.00Administrative Secretary I/II 1.00 1.00 1.00 1.00 1.00Administrative Secretary III 0.65 0.65 0.00 0.00 0.00Administrative Technician 0.34 0.34 0.00 0.00 0.00Civil Engineer 0.75 0.75 0.00 0.00 0.00Data Entry Operator I/II 0.16 0.16 0.00 0.00 0.00Management Analyst III 0.33 0.33 0.00 0.00 0.00Office Assistant I/II 0.15 0.15 0.00 0.00 0.00Power Production Operator II 2.00 2.00 2.00 2.00 2.00Senior Wastewater Operator 4.00 4.00 4.00 4.00 4.00Wastewater Operations Manager 0.75 0.75 0.75 0.75 0.75Wastewater Operator I/II 14.00 14.00 14.00 14.00 14.00Wastewater Operator III 2.00 2.00 2.00 2.00 2.00Water Programs Manager 0.25 0.25 0.00 0.00 0.00Water Resources Manager 0.25 0.25 0.00 0.00 0.00
26.95 26.95 23.75 23.75 23.75Total Personnel

Public Works Utilities Services Treatment Plant Maint.
Activities / Functions
236
The Treatment Plant Maintenance and Upgrades Program provides inspection, preventive and predictive maintenance services, onboth a routine and emergency basis, for the City’s Wastewater Treatment Plant in a cost-efficient, customer-oriented manner. This Program currently provides inspection, preventive and predictive maintenance and repair services for the equipment and systems of the Wastewater Treatment Plant, including treatment equipment, pumps, motors, electrical systems, instrumentation, controlsystems, emissions systems and buildings, in order to maintain compliance with the City’s National Pollutant Discharge Elimination System (NPDES) wastewater permit and Air Quality Management District permits. In addition to the Treatment Plant, the Program maintains and repairs the mechanical portion of 15 lift stations located throughout the City. The Program also maintains 59wastewater-related vehicles and support equipment.
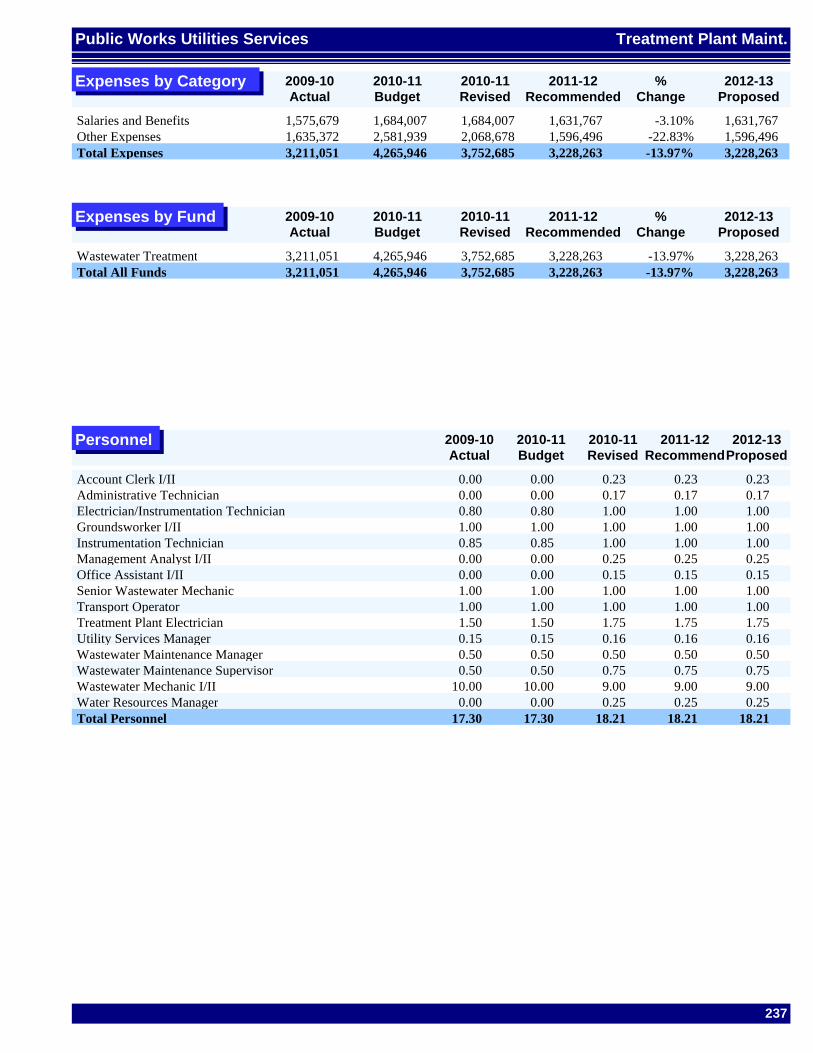
%Change
Public Works Utilities Services Treatment Plant Maint.
237
Expenses by Category
Expenses by Fund %Change
Personnel
2009-10Actual
2010-11Budget
2010-11Revised
2011-12Recommended
2012-13Proposed
2009-10Actual
2010-11Budget
2010-11Revised
2011-12Recommended
2012-13Proposed
2009-10Actual
2010-11Budget
2010-11Revised
2011-12Recommend
2012-13Proposed
Salaries and Benefits 1,575,679 1,684,007 1,684,007 1,631,767 1,631,767-3.10%Other Expenses 1,635,372 2,581,939 2,068,678 1,596,496 1,596,496-22.83%Total Expenses 3,211,051 4,265,946 3,752,685 3,228,263 3,228,263-13.97%
Wastewater Treatment 3,211,051 4,265,946 3,752,685 3,228,263 3,228,263-13.97%3,211,051 4,265,946 3,752,685 3,228,263 3,228,263-13.97%Total All Funds
Account Clerk I/II 0.00 0.00 0.23 0.23 0.23Administrative Technician 0.00 0.00 0.17 0.17 0.17Electrician/Instrumentation Technician 0.80 0.80 1.00 1.00 1.00Groundsworker I/II 1.00 1.00 1.00 1.00 1.00Instrumentation Technician 0.85 0.85 1.00 1.00 1.00Management Analyst I/II 0.00 0.00 0.25 0.25 0.25Office Assistant I/II 0.00 0.00 0.15 0.15 0.15Senior Wastewater Mechanic 1.00 1.00 1.00 1.00 1.00Transport Operator 1.00 1.00 1.00 1.00 1.00Treatment Plant Electrician 1.50 1.50 1.75 1.75 1.75Utility Services Manager 0.15 0.15 0.16 0.16 0.16Wastewater Maintenance Manager 0.50 0.50 0.50 0.50 0.50Wastewater Maintenance Supervisor 0.50 0.50 0.75 0.75 0.75Wastewater Mechanic I/II 10.00 10.00 9.00 9.00 9.00Water Resources Manager 0.00 0.00 0.25 0.25 0.25
17.30 17.30 18.21 18.21 18.21Total Personnel

Public Works Utilities Services Environ. Res. Planning
Activities / Functions
238
The Environmental Resources Planning Program creates innovative ways in meeting the needs for waste diversion and disposalamong residents and businesses, provides leadership in regional solid waste agency activities, utilizes budget and financial strategies to stabilize utility rates for users in the long-term, and effectively advocates favorable State legislation and public relations on solidwaste issues and services that best serve the community. Environmental Resources Planning provides for administrative and support functions including general supervision of all collection,disposal and recycling programs, liaison with all governmental agencies relating to solid waste activities, coordination of divisionalactivities such as budget preparation, refuse utility rates, contracts, strategic planning, safety, and training.

%Change
Public Works Utilities Services Environ. Res. Planning
239
Expenses by Category
Expenses by Fund %Change
Personnel
2009-10Actual
2010-11Budget
2010-11Revised
2011-12Recommended
2012-13Proposed
2009-10Actual
2010-11Budget
2010-11Revised
2011-12Recommended
2012-13Proposed
2009-10Actual
2010-11Budget
2010-11Revised
2011-12Recommend
2012-13Proposed
Salaries and Benefits 742,871 535,100 535,100 1,085,731 1,085,731102.90%Other Expenses 1,195,505 1,291,929 1,181,929 1,145,919 1,138,019-3.05%Total Expenses 1,938,376 1,827,029 1,717,029 2,231,650 2,223,75029.97%
Solid Waste 1,938,376 1,827,029 1,717,029 2,231,650 2,223,75029.97%1,938,376 1,827,029 1,717,029 2,231,650 2,223,75029.97%Total All Funds
Account Clerk I/II 0.34 0.34 0.20 0.20 0.20Account Clerk III 0.34 0.34 1.00 1.00 1.00Administrative Secretary III 1.35 1.35 1.00 1.00 1.00Administrative Technician 0.33 0.33 1.33 1.33 1.33Data Entry Operator I/II 0.34 0.34 0.00 0.00 0.00Management Analyst III 0.33 0.33 0.50 0.50 0.50Office Assistant I/II 0.35 0.35 0.35 0.35 0.35Solid Waste Equipment Operator II 0.00 0.00 2.00 2.00 2.00Solid Waste Superintendent 1.00 1.00 1.00 1.00 1.00Solid Waste Supervisor 1.00 1.00 4.00 4.00 4.00Utility Services Manager 0.33 0.33 0.34 0.34 0.34
5.71 5.71 11.72 11.72 11.72Total Personnel

Public Works Utilities Services Waste Reduction & Education
Activities / Functions
240
The Waste Reduction and Education Program enhances the City’s quality of life by providing resource recovery opportunities throughwaste reduction and education. Provides planning and development of resource recovery opportunities through waste reduction and education including compliance with the California Department of Resources Recycling and Recovery (CalRecycle) diversion requirements AB939; promoting and educating residents and businesses techniques in source reduction and prevention in areas of electronic waste, household hazardous waste, composting and other resource recovery practices; pursuing cooperative partnerships, resource recovery grants, corporateenvironmental collaborations to offset program costs. In calendar year 2009, Oxnard reduced its per capita disposal target of 11.6 pounds per person/day to 6.4 pounds. This meetsCalRecycle’s waste reduction mandate of AB939. Ongoing efforts to implement new recycling programs such as carpet and tirerecycling further enhance Oxnard’s compliance to AB939.

%Change
Public Works Utilities Services Waste Reduction & Education
241
Expenses by Category
Expenses by Fund %Change
Personnel
2009-10Actual
2010-11Budget
2010-11Revised
2011-12Recommended
2012-13Proposed
2009-10Actual
2010-11Budget
2010-11Revised
2011-12Recommended
2012-13Proposed
2009-10Actual
2010-11Budget
2010-11Revised
2011-12Recommend
2012-13Proposed
Salaries and Benefits 139,789 154,563 154,563 137,751 137,751-10.88%Other Expenses 207,288 347,355 347,355 208,176 208,176-40.07%Total Expenses 347,077 501,918 501,918 345,927 345,927-31.08%
Solid Waste 347,077 501,918 501,918 345,927 345,927-31.08%347,077 501,918 501,918 345,927 345,927-31.08%Total All Funds
Recycling Manager 1.00 1.00 1.00 1.00 1.001.00 1.00 1.00 1.00 1.00Total Personnel

Public Works Utilities Services Environ. Res. Residential
Activities / Functions
242
The Residential Collection Program provides exemplary customer service in residential solid waste, green waste, and recyclingcollection activities throughout the City to sustain a sanitary environment while maintaining a quality service at competitive rates for our customers. This program provides uninterrupted weekly collection and removal of solid waste, recyclables and green waste to approximately32,700 homes in the City to ensure a safe and sanitary environment. This program also provides special collection service of bulky and excessive amounts of solid waste, automated container maintenance and cleaning, inspection to ensure proper storage and containment, separation of recyclable and non-recyclable materials, maintaining control over health hazardous and illegal dumping,investigating customer concerns, and backup support for commercial and industrial programs. Carts are available at variable sizesbased on capacity needs. The Residential Collection Program collects and removes approximately 70,000 tons of solid waste, recyclables, and green waste each year. The City maintains a street sweeping program to comply with provisions of the federally mandated Clean Water Act. Street sweeping helps to remove pollutants that can potentially reach the ocean. Over 25,000 curb miles of streets and alleys are swept annually in order to reduce debris from entering the storm drains and polluting the ocean. Residential streets are swept on a weekly basis.

%Change
Public Works Utilities Services Environ. Res. Residential
243
Expenses by Category
Expenses by Fund %Change
Personnel
2009-10Actual
2010-11Budget
2010-11Revised
2011-12Recommended
2012-13Proposed
2009-10Actual
2010-11Budget
2010-11Revised
2011-12Recommended
2012-13Proposed
2009-10Actual
2010-11Budget
2010-11Revised
2011-12Recommend
2012-13Proposed
Salaries and Benefits 2,464,010 2,537,463 2,537,463 1,828,605 1,828,605-27.94%Other Expenses 2,574,931 2,562,979 2,674,979 2,809,091 2,809,0915.01%Total Expenses 5,038,941 5,100,442 5,212,442 4,637,696 4,637,696-11.03%
Solid Waste 5,038,941 5,037,942 5,149,942 4,597,696 4,597,696-10.72%Solid Waste Developer Fee 0 62,500 62,500 40,000 40,000-36.00%
5,038,941 5,100,442 5,212,442 4,637,696 4,637,696-11.03%Total All Funds
Solid Waste Compliance Specialist 4.00 4.00 4.00 4.00 4.00Solid Waste Equipment Operator II 22.00 22.00 20.00 20.00 20.00Solid Waste Supervisor 1.00 1.00 0.00 0.00 0.00
27.00 27.00 24.00 24.00 24.00Total Personnel

Public Works Utilities Services Environ. Res. Commercial
Activities / Functions
244
The Commercial Collection Program provides excellent customer service in residential refuse and recyclable collection to ensure a sanitary environment, to collect waste using innovative systems, and to maintain competitive rates for customers. This program provides uninterrupted weekly collection and removal of solid waste and recyclables to approximately 7,300commercial businesses and multi-family complexes to ensure a safe and sanitary environment. Two container sizes, 2 and 4 cubic yard, are provided based on capacity needs and served on a schedule convenient to the customer. This program also provides special collection service of bulky and excessive amounts of solid waste, container rental, inspection to ensure proper storage and containment, daily inspections of downtown and cleanup of illegal dumping, separation of recyclable and non-recyclable materials,maintaining control over health hazardous and illegal dumping, investigating customer concerns, container delivery and exchange, container maintenance, repair and parts inventory. The Commercial Collection Program collects and removes approximately 70,000tons of solid waste and recyclables each year.

%Change
Public Works Utilities Services Environ. Res. Commercial
245
Expenses by Category
Expenses by Fund %Change
Personnel
2009-10Actual
2010-11Budget
2010-11Revised
2011-12Recommended
2012-13Proposed
2009-10Actual
2010-11Budget
2010-11Revised
2011-12Recommended
2012-13Proposed
2009-10Actual
2010-11Budget
2010-11Revised
2011-12Recommend
2012-13Proposed
Salaries and Benefits 1,895,918 1,650,824 1,650,824 1,927,814 1,927,81416.78%Other Expenses 1,874,247 1,885,986 1,942,986 1,903,605 1,903,605-2.03%Total Expenses 3,770,165 3,536,810 3,593,810 3,831,419 3,831,4196.61%
Solid Waste 3,770,165 3,509,810 3,566,810 3,816,419 3,816,4197.00%Solid Waste Developer Fee 0 27,000 27,000 15,000 15,000-44.44%
3,770,165 3,536,810 3,593,810 3,831,419 3,831,4196.61%Total All Funds
Container Service Worker 2.00 2.00 2.00 2.00 2.00Solid Waste Equipment Operator II 17.00 17.00 21.00 21.00 21.00Solid Waste Supervisor 1.00 1.00 0.00 0.00 0.00
20.00 20.00 23.00 23.00 23.00Total Personnel

Public Works Utilities Services Environ. Res. Industrial
Activities / Functions
246
The Industrial Collection Program provides excellent customer service in residential refuse and recyclable collection to ensure asanitary environment, to collect waste using innovative systems, and to maintain competitive rates for customers. This program provides 13.4 and 30 cubic yard containers to approximately 140 industrial users on a collection schedule determined bythe user. This program also provides special collection service of bulky and excessive amounts of solid waste, container rental,inspection to ensure proper storage and containment, separation of recyclable and non-recyclable materials, maintaining control over health hazardous and illegal dumping, investigating customer concerns, container delivery and exchange, container maintenance, repair and parts inventory. This program conducts approximately 30 neighborhood cleanup events each year by providing residential neighborhoods an opportunity to discard bulky and excessive refuse items. The Industrial Collection Program collects and removes approximately 60,000 tons of solid waste and recyclables citywide each year.

%Change
Public Works Utilities Services Environ. Res. Industrial
247
Expenses by Category
Expenses by Fund %Change
Personnel
2009-10Actual
2010-11Budget
2010-11Revised
2011-12Recommended
2012-13Proposed
2009-10Actual
2010-11Budget
2010-11Revised
2011-12Recommended
2012-13Proposed
2009-10Actual
2010-11Budget
2010-11Revised
2011-12Recommend
2012-13Proposed
Salaries and Benefits 778,427 873,411 873,411 464,769 464,769-46.79%Other Expenses 770,752 1,070,865 1,075,865 726,162 726,162-32.50%Total Expenses 1,549,179 1,944,276 1,949,276 1,190,931 1,190,931-38.90%
Solid Waste 1,549,179 1,944,276 1,949,276 1,190,931 1,190,931-38.90%1,549,179 1,944,276 1,949,276 1,190,931 1,190,931-38.90%Total All Funds
Solid Waste Equipment Operator II 10.00 10.00 6.00 6.00 6.00Solid Waste Supervisor 0.50 0.50 0.00 0.00 0.00
10.50 10.50 6.00 6.00 6.00Total Personnel

Public Works Utilities Services Environ. Res. Processing
Activities / Functions
248
The Processing and Disposal Program provides excellence by using the Del Norte Regional Recycling and Transfer Station (Del NorteFacility) to diversify the City’s options for increasing recycling and decreasing the disposal of waste, support economic development, to meet State mandates for waste diversion while maintaining competitive utility rates for refuse and recycling services.
Diverting Oxnard's waste through recycling is just one example of the City’s efforts to conserve our natural resources and protect our environment. The City’s municipal solid waste program collects and processes more than 10,000 tons of recyclable materials and 15,000 tons of green waste from residential and commercial sectors that is diverted from landfills each year.
The City-owned Del Norte Facility also provides services for the processing and recovery of materials. The principal activity of the Del Norte Facility is to remove recoverable material before transferring the waste to a landfill. Each year the Del Norte Facility receives and processes approximately 250,000 tons of refuse and recyclable materials from Oxnard, other jurisdictions andunincorporated areas in Ventura County. Other services at the Del Norte Facility include a buyback center for dropping off recyclable materials such as aluminum cans and plastic beverage containers, electronics, and a recyclable household hazardous waste collection for residents to drop off antifreeze, batteries, used motor oil, latex paint, and e-waste.

%Change
Public Works Utilities Services Environ. Res. Processing
249
Expenses by Category
Expenses by Fund %Change
Personnel
2009-10Actual
2010-11Budget
2010-11Revised
2011-12Recommended
2012-13Proposed
2009-10Actual
2010-11Budget
2010-11Revised
2011-12Recommended
2012-13Proposed
2009-10Actual
2010-11Budget
2010-11Revised
2011-12Recommend
2012-13Proposed
Salaries and Benefits 1,326,103 1,309,022 1,309,022 1,093,334 1,093,334-16.48%Other Expenses 23,292,853 24,663,037 24,599,037 24,398,162 24,398,162-0.82%Total Expenses 24,618,956 25,972,059 25,908,059 25,491,496 25,491,496-1.61%
Solid Waste 24,618,956 25,972,059 25,908,059 25,491,496 25,491,496-1.61%24,618,956 25,972,059 25,908,059 25,491,496 25,491,496-1.61%Total All Funds
Solid Waste Supervisor 0.50 0.50 0.00 0.00 0.00Solid Waste Transfer Operator 13.00 13.00 13.00 13.00 13.00
13.50 13.50 13.00 13.00 13.00Total Personnel

Public Works Utilities Services Public Information - Special Projects
Activities / Functions
250
Collaborate with Public Works Department by meeting with key staff to identify projects, develop work plans, estimates, timelines, and prioritizations. Identify resources. Oversee scheduling of Public Works outreach projects, manage staff and coordinate projects. Recycling and hazardous waste outreach and education activities include managing and implementing 3-cart program, conservation grants including CalRecycle bottle and can recycling and Used Oil Recycling Block Grant Program, coordination of recycling, promotional and participation efforts throughout City events and festival; coordinate the sales and promotion of compost bin/worm bin. In addition, CPIO works with the Public Works Department on current and future construction projects requiring a community outreach component as part of the total funded project including coordination of notification and workshops for the community for construction projects, including the Ventura Road Utility Improvement project, Recycled Water Backbone System Project, Advances Water Purification Facility, Rice/101 Overpass, FEMA Floodplain Map/Insurance, Via Marina, Cabrillo, Rose Park, Southwinds, and all other street resurfacing projects; Septic-to-Sewer conversion project, among others.

%Change
Public Works Utilities Services Public Information - Special Projects
251
Expenses by Category
Expenses by Fund %Change
Personnel
2009-10Actual
2010-11Budget
2010-11Revised
2011-12Recommended
2012-13Proposed
2009-10Actual
2010-11Budget
2010-11Revised
2011-12Recommended
2012-13Proposed
2009-10Actual
2010-11Budget
2010-11Revised
2011-12Recommend
2012-13Proposed
Salaries and Benefits 332,872 378,406 378,406 378,406 361,8330.00%Other Expenses 32,366 178,650 178,650 148,650 148,650-16.79%Total Expenses 365,238 557,056 557,056 527,056 510,483-5.39%
Water Operating 128,183 191,968 191,968 181,968 165,395-5.21%Wastewater Collection 54,601 84,251 84,251 79,251 79,251-5.93%Wastewater Treatment 66,636 84,251 84,251 79,251 79,251-5.93%Solid Waste 115,818 196,586 196,586 186,586 186,586-5.09%
365,238 557,056 557,056 527,056 510,483-5.39%Total All Funds
No full-time equivalent positions budgeted 0.00 0.00 0.00 0.00 0.000.00 0.00 0.00 0.00 0.00Total Personnel


Recreation and Community Services


%Change
Expenses by Category
Recreation and Community Services Department Summary
253
%Change
%Change
Expenses by Fund
Expenses by Program 2009-10Actual
2010-11Budget
2010-11Revised
2011-12Recommended
2012-13Proposed
2009-10Actual
2010-11Budget
2010-11Revised
2011-12Recommended
2012-13Proposed
2009-10Actual
2010-11Budget
2010-11Revised
2011-12Recommended
2012-13Proposed
Salaries and Benefits 6,462,480 5,402,594 5,860,946 6,939,779 5,048,49918.41%Other Expenses 2,599,435 2,532,113 2,954,526 2,556,106 2,347,386-13.49%Total Expenses 9,061,915 7,934,707 8,815,472 9,495,885 7,395,8857.72%
General Fund 5,857,583 5,880,492 5,646,192 5,375,330 5,375,330-4.80%Public Safety Retirement 36,484 33,998 33,998 39,438 39,43816.00%Other State Grants 510,237 0 840,889 2,100,000 0149.74%ARRA Grants 279,749 0 98,949 0 0-100.00%Federal Term Grants Fund 170,326 109,743 95,552 0 0-100.00%RSVP 131,957 0 189,418 128,912 128,912-31.94%CDBG Federal Entitlement 380,762 414,255 414,255 369,829 369,829-10.72%2009 Lease Purchase Equipment 46,814 0 0 0 0P.A.C.C. 1,648,003 1,496,219 1,496,219 1,482,376 1,482,376-0.93%
9,061,915 7,934,707 8,815,472 9,495,885 7,395,8857.72%Total All Funds
Recreation Services 2,465,052 2,598,847 2,453,772 2,613,971 2,613,9716.53%Youth Development 3,684,530 2,673,307 3,604,031 4,492,285 2,392,28524.65%South Oxnard Center 213,504 199,331 199,331 190,284 190,284-4.54%Senior Services/Special Populations
1,050,826 967,003 1,062,119 716,969 716,969-32.50%
Performing Arts and Convention Center
1,648,003 1,496,219 1,496,219 1,482,376 1,482,376-0.93%
9,061,915 7,934,707 8,815,472 9,495,885 7,395,8857.72%Total All Programs

Recreation and Community Services Recreation Services
Activities / Functions
254
Program Description/Performance Outcomes
Number Served Per
Year Adult Sports Adult Sports provides opportunity for organized league play in slow-pitch softball and basketball. Softball
games are held on three fields at three sites. Basketball leagues are held at the Police Activities League (PAL) gym and Colonia Gym. Table tennis and badminton is offered at PAL as open play.
4,000
City Corps City Corps works with the local school districts and community based youth organizations to address the needs of at-risk youth by providing a variety of social services, recreation, and service learning opportunities. City Corps also works closely with neighborhood councils in the distribution of information and neighborhood cleanups. City Corps planned and implemented 2,714 projects and partnered with 83 agencies and organizations.
420 regular members & 5,197-area
youth
Colonia Boxing Center
The Colonia Boxing Center develops young people’s capacity to engage in positive behaviors and set personal goals to live successfully as adults. Participants are given the opportunity to compete in boxing shows throughout Southern California & Arizona. The Center is home to World, National and Olympic Champions. Trainers in the Center are former professional boxers that serve as positive role models for youth. The Center is open 5 days a week, serving 40-50 youth daily.
230
Grad Night For the 36th consecutive year, the department will organize “Grad Night 2011” which is offered to intermediate school students from the Oxnard, Rio, Hueneme and Oceanview School Districts.
1,200
Oxnard Tennis Center
The Oxnard Tennis Center is a full-service tennis club. Its eight fully lighted championship tennis courts are complimented by a clubhouse, pro shop, and a locker room facility. Club members take part in weekly tennis activities including leagues, challenge ladders, club tournaments, doubles nights, and other fun social events. The Center also offers professional tennis instruction for players of all ages and abilities by PTR/USPTA certified professionals.
250
Recreation Classes
A variety of Recreation Classes are offered year-round to preschool aged children, youth and adults. Preschool Classes include Smart Start Kids classes, which are designed to give students a jumpstart into school. Last year approximately 250 students attended preschool classes. In addition, classes such as parent ‘n me, zoo camp, pirate camp, little chefs, cartooning, cheer, dance, sports of all sorts, guitar, music and more are offered to youth. Over 1,500 registered for youth classes. Adult classes include zumba, ballroom dancing, Tai Chi Chin, Jazzercise, guitar, belly dancing, yoga, CPR/First Aid to name a few. Over 800 registered for adult classes in the past years.
2,550
Recreation Facilities
Various youth/adult community groups utilize our facilities for seasonal play in youth soccer, adult soccer, baseball, softball, girl’s slow pitch and fast pitch softball, and youth football. The department has 16 facilities available for rent including: Community Center West-Adair Field & Clark Field, Driffill Field, O’Brien Field at Beck Park, Del Sol Stadium, Southwest Community Park. Future RiverPark facilities include a gymnasium and six lighted youth ball fields.
927 Youth &Adult Soccer
Teams
Events The department collaborates with agencies in bringing in special events throughout the year including Santa Claus Float Tours, Breakfast with Santa, Strawberry Triathlon, Oxnard Film Festival, Dallas Cowboys Training Camp, Fun Fest, Multicultural Festival, Tamale Festival, Amigo Baby Christmas, Senior Softball-USA World Championship qualifiers, Amateur Softball Association “C” Western District Championship, Southern California Municipal Athletic Federation “C” Flag Football Championship & Adult Softball Spring “Recreation” Divisional Championship and many more.
Partners Some of Recreation’s partners include: Rotary Club, Kiwanis Club, Rusty’s Pizza Parlor, Boys & Girls Club, Oxnard Unified School District, Santa Clara Elementary School, River Ridge Golf Course, Ventura County Probation Agency, CARE-VC, Sam’s Club, Wal-Mart, McDonald’s, Seaside of Oxnard Girls Fast-Pitch Softball, Mermaid PONY Slow-Pitch Softball, Northside Youth PONY Baseball, Sunset, Eastside & South Oxnard Little Leagues, Youth football leagues, Youth Soccer Leagues, Oxnard Adult Soccer Leagues, Jr. NBA/WNBA Skills Basketball Challenge, USA Jr. Olympic Skills Competition, Major League Baseball/Aquafina Pitch, Hit & Run Competition, Aquafina Punt, Pass & Kick Skills Competition, Southern California Municipal Athletic Federation and more.

%Change
Recreation and Community Services Recreation Services
255
Expenses by Category
Expenses by Fund %Change
Personnel
2009-10Actual
2010-11Budget
2010-11Revised
2011-12Recommended
2012-13Proposed
2009-10Actual
2010-11Budget
2010-11Revised
2011-12Recommended
2012-13Proposed
2009-10Actual
2010-11Budget
2010-11Revised
2011-12Recommend
2012-13Proposed
Salaries and Benefits 1,466,471 1,573,222 1,428,147 1,624,488 1,624,48813.75%Other Expenses 998,581 1,025,625 1,025,625 989,483 989,483-3.52%Total Expenses 2,465,052 2,598,847 2,453,772 2,613,971 2,613,9716.53%
General Fund 2,418,238 2,598,847 2,453,772 2,613,971 2,613,9716.53%2009 Lease Purchase Equipment 46,814 0 0 0 0
2,465,052 2,598,847 2,453,772 2,613,971 2,613,9716.53%Total All Funds
Administrative Secretary III 0.50 0.50 0.50 0.50 0.50Administrative Technician 1.00 1.00 1.00 1.00 1.00Community Services Manager 1.00 1.00 1.00 1.00 1.00Leisure and Recreation Superintendent 0.50 0.50 1.00 1.00 1.00Management Analyst I/II 1.00 1.00 1.00 1.00 1.00Management Analyst III 0.30 0.30 0.30 0.30 0.30Office Assistant I/II 1.00 1.00 1.00 1.00 1.00Recreation Supervisor 0.50 0.50 0.50 0.50 0.50Recreation/Human Services Coordinator 5.50 5.50 5.50 5.50 5.50Recreation/Human Services Leader III 3.50 3.50 3.50 3.50 3.50
14.80 14.80 15.30 15.30 15.30Total Personnel

Recreation and Community Services Youth Development
Activities / Functions
256
Program Description/Performance Outcomes
Number Served Per
Year After School Program
The City of Oxnard, through its partnership with the Oxnard School District provides after school programming to 17 elementary school sites and 3 junior high school sties. The City provides the Fun for All Program, which offers structured recreation, skill-building and health-promoting activities to approximately 80-85 children daily.
1,400
Bedford Pinkard Skateboard Program
The Skateboard Program provides a place for local youth and adults to exercise and safely practice their sport of in-line skating or skateboarding. The mobile skatepark is available for special City events. The Skateboard Program serves approximately 75 participants daily and is open 7 days a week.
75
Colonia Pool The Colonia Community Pool is open during the summer months free of charge. The pool offers free supervised swimming for 70-80 participants daily. Senior aerobics classes are also offered.
600
Colonia Recreation Center
The Colonia Recreation Center offers youth enriching activities including homework help, a computer lab, excursions, and youth sports in flag football, basketball & soccer. The center serves over 75 children as part of the Summer Lunch Program. The center is open 5 days a week.
300
Colonia Veteran’s Memorial Gym
The Colonia Veteran’s Memorial Gym provides prevention youth development programs that target at-risk youth. These programs will help youth gain confidence and develop a positive self-image. Youth basketball and volleyball leagues are held throughout the year. In addition, clinics in basketball, soccer, and t-ball are held for youth. The gym also holds Special Olympics basketball training and open play for mentally disabled adults. Open play is also held for youth and adults daily.
3,500
Police Activities League
PAL provides crime prevention and intervention programs by providing youth enriching activities (educational, athletic and recreational) creating a safe environment for positive change. Activities include: Youth Council, All City Band, Mid-City Boxing, Multi-Media Production Projects, Jr. High/High School Dances, a Teen Center, and athletic leagues. PAL also partners with the Ventura Unified School District to provide the free summer lunch program. PAL has also increased fundraising efforts through various events and projects.
6,500
Seasonal Day Camp
Camp Serendipity provides a safe and fun environment for youth ages 5-12 during the summer and winter school breaks. Camp is offered at two sites, PAC Youth Center & Santa Clara Elementary School. It operates from 7 a.m. to 6 p.m., Monday through Friday. Campers participate in a variety of enriching activities including a reading program in partnership with the Oxnard Public Library, outdoor physical activities, water days, arts & crafts, guest speakers, and educational field trips. Partners include City Corps, the Oxnard Public Library, and the Santa Clara Elementary School.
800
SOC Youth/Senior Center
The South Oxnard Activity Center provides a dedicated space for seniors during the morning hours and open for the youth in the afternoon. The SOC Senior Center provides numerous senior-related activities and special events. The South Oxnard Youth Center offers youth enriching activities to local youth. Activities include indoor games, homework assistance, arts & crafts, excursions and much more.
125
Southwinds & Durley Center
The Southwinds and Durley Youth Centers offers youth enriching activities including indoor games, athletic leagues and homework help to local youth in the area 5 days a week. The free Summer Lunch Program is also offered at Southwinds in the summer.
650
Youth Enrichment Program
The Youth Enrichment Program, through a bid process, allocates CDBG Public Service funding to community-based organizations to provide a variety of services and programs including education enhancement; youth employment/vocational education and training; youth’s health and safety; parent/family intervention and support to youth that come from very low, low, and low to moderate-income homes.
2,500
Youth Sports Youth Sports provides elementary and junior high boys and girls an opportunity to participate in organized team leagues in football, basketball, volleyball, soccer and softball. Games are held at local high schools, City gyms and local parks.
2,094

%Change
Recreation and Community Services Youth Development
257
Expenses by Category
Expenses by Fund %Change
Personnel
2009-10Actual
2010-11Budget
2010-11Revised
2011-12Recommended
2012-13Proposed
2009-10Actual
2010-11Budget
2010-11Revised
2011-12Recommended
2012-13Proposed
2009-10Actual
2010-11Budget
2010-11Revised
2011-12Recommend
2012-13Proposed
Salaries and Benefits 3,130,115 2,127,219 2,668,024 3,813,671 1,922,39142.94%Other Expenses 554,415 546,088 936,007 678,614 469,894-27.50%Total Expenses 3,684,530 2,673,307 3,604,031 4,492,285 2,392,28524.65%
General Fund 2,479,298 2,225,054 2,215,940 1,983,018 1,983,018-10.51%Public Safety Retirement 36,484 33,998 33,998 39,438 39,43816.00%Other State Grants 330,000 0 458,250 2,100,000 0358.27%ARRA Grants 277,749 0 98,949 0 0-100.00%CDBG Federal Entitlement 380,762 414,255 414,255 369,829 369,829-10.72%
3,684,530 2,673,307 3,604,031 4,492,285 2,392,28524.65%Total All Funds
Administrative Secretary I/II 1.00 1.00 1.00 1.00 1.00Administrative Secretary III 0.50 0.50 0.50 0.50 0.50Leisure and Recreation Superintendent 0.50 0.50 0.00 0.00 0.00Management Analyst III 0.30 0.30 0.30 0.30 0.30Police Officer III 1.00 1.00 0.80 0.80 0.80Recreation Supervisor 1.50 1.50 1.50 1.50 1.50
4.80 4.80 4.10 4.10 4.10Total Personnel

Recreation and Community Services South Oxnard Center
Activities / Functions
258
Program Description/Performance Outcomes
Number Served Per
Year South Oxnard Center (SOC)
The SOC provides residents, businesses and service organizations a quality community center that affords a variety of recreational activities and community services in the south Oxnard area. The City will continue to provide the South Oxnard Center’s multipurpose room for special events such as wedding receptions, debuts/quinceañeras, baptismal receptions, birthdays, fundraisers, and neighborhood meetings.
72 Reservations
Child Development, Inc. (CDI) Center
The City currently contracts with CDI to provide a state preschool program at the center. CDI serves approximately 180 children in their preschool program.
180
Preschool To You Program
SOC provides office space for the Preschool To You Program. The Preschool to You Program is a “portable” preventive strategy in which a mobile unit, staffed with preschool teachers, visits 8-11 park sites weekly within the Oxnard Plains. Over 700 children and their caregivers have been served since its inception. The Preschool to You also provides to parents information about family issues such as domestic violence, pediatric diabetes and child safety.
250

%Change
Recreation and Community Services South Oxnard Center
259
Expenses by Category
Expenses by Fund %Change
Personnel
2009-10Actual
2010-11Budget
2010-11Revised
2011-12Recommended
2012-13Proposed
2009-10Actual
2010-11Budget
2010-11Revised
2011-12Recommended
2012-13Proposed
2009-10Actual
2010-11Budget
2010-11Revised
2011-12Recommend
2012-13Proposed
Salaries and Benefits 58,249 47,905 47,905 47,905 47,9050.00%Other Expenses 155,255 151,426 151,426 142,379 142,379-5.97%Total Expenses 213,504 199,331 199,331 190,284 190,284-4.54%
General Fund 213,504 199,331 199,331 190,284 190,284-4.54%213,504 199,331 199,331 190,284 190,284-4.54%Total All Funds
No full-time equivalent positions budgeted. 0.00 0.00 0.00 0.00 0.000.00 0.00 0.00 0.00 0.00Total Personnel

Recreation and Community Services Senior Services/Special Populations
Activities / Functions
260
Program Description/Performance Outcomes
Number Served Per
YearSenior Services and Special Populations
The Senior Services and Special Populations program will continue to provide services and opportunities that enrich and extend life to older adults and special population participants through City programming and partnerships with community organizations. Senior Services networks with various senior providers to ensure that all older adult’s needs are addressed and that high-quality programs, services and opportunities are available. The City of Oxnard offers three senior centers for adults 55 and older. The Wilson Senior Center, Colonia Senior Center and South Oxnard Senior Center Program. Seniors can participate in over 19 fitness, exercise and dance classes in addition to numerous educational, social and recreational programs such as senior excursions, a vegetable garden, lawn bowling, walking program and wellness clinics. A comprehensive adaptive program of services, opportunities, and weekly socialization and learning activities will also be provided to Oxnard’s developmentally disabled population.
200 Daily Avg.
Senior Nutrition Program
Seniors 60 years of age and older are served a daily hot nutritious meal at each of the three senior centers. Seniors are supplied one-third of their daily nutritional requirements from these meals. Homebound and physically disabled seniors receive weekly home-delivered meals. Five frozen, nutritious meals are delivered once a week.
200 Meals served per
day
Retired and Senior Volunteer Program
Volunteering has proven to help seniors age more successfully and continue contributing to their community longer. RSVP has approximately 600 seniors, 55 years of age and older providing volunteer services to more than 80 nonprofit and public organizations. Under the RSVP umbrella, Bone Builders, an Osteoporosis Exercise Program, trains older adults to lead twice weekly weight-bearing classes to seniors. Volunteer trainers work in pairs to conduct free ongoing classes open to anyone 60 years and older aimed at preventing or reversing osteoporosis. The RSVP Program has recorded over 75,500 volunteer hours.
600
Partners Some of the senior partners include: Grey Law, Braille Institute, St. John’s Regional Medical Center, AARP, Ventura County Area Agency on Aging, Alzheimer’s Association, Oxnard Adult Education, Health Insurance Counseling Advocacy Program, Food Share, South Coast Area Transit, and Arthritis Foundation.

%Change
Recreation and Community Services Senior Services/Special Populations
261
Expenses by Category
Expenses by Fund %Change
Personnel
2009-10Actual
2010-11Budget
2010-11Revised
2011-12Recommended
2012-13Proposed
2009-10Actual
2010-11Budget
2010-11Revised
2011-12Recommended
2012-13Proposed
2009-10Actual
2010-11Budget
2010-11Revised
2011-12Recommend
2012-13Proposed
Salaries and Benefits 609,538 594,795 657,417 402,505 402,505-38.77%Other Expenses 441,288 372,208 404,702 314,464 314,464-22.30%Total Expenses 1,050,826 967,003 1,062,119 716,969 716,969-32.50%
General Fund 746,543 857,260 777,149 588,057 588,057-24.33%ARRA Grants 2,000 0 0 0 0Federal Term Grants Fund 170,326 109,743 95,552 0 0-100.00%RSVP 131,957 0 189,418 128,912 128,912-31.94%
1,050,826 967,003 1,062,119 716,969 716,969-32.50%Total All Funds
Office Assistant I/II 1.00 1.00 1.00 1.00 1.00Recreation Supervisor 1.00 1.00 1.00 1.00 1.00Recreation/Human Services Coordinator 2.00 2.00 2.00 2.00 2.00Recreation/Human Services Leader III 2.75 2.75 2.75 2.75 2.75
6.75 6.75 6.75 6.75 6.75Total Personnel

Recreation and Community Services Performing Arts and Convention Center
Activities / Functions
262
A combination of distinctive features makes the Oxnard Performing Arts & Convention Center the ideal complex for business meetings, trade shows, seminars and many other events. With its spacious theater and eight additional meeting rooms, the Oxnard Performing Arts & Convention Center can easily handle the needs of any group up to 3,500 to 4,000 persons. The network of enclosed patios provides the perfect setting for private community events, including weddings, receptions, banquets and more. Free parking for approximately 500 vehicles is available immediately adjacent to the Oxnard Performing Arts & Convention Center. Limited additional parking is also available nearby. As one of the larger theaters in western Ventura County, the Oxnard Performing Arts & Convention Center provides outstanding entertainment opportunities to Ventura County residents and visitors. Consisting of 1,604 seats, the theater provides a convenient location for numerous cultural, educational, and entertainment opportunities. Since opening in March 1968, the Oxnard Performing Arts & Convention Center has hosted thousands of performances reaching more than 3 million people. Outstanding Broadway musicals, prominent guest speakers, the musical acts and plays have all graced the center’s stage.

%Change
Recreation and Community Services Performing Arts and Convention Center
263
Expenses by Category
Expenses by Fund %Change
Personnel
2009-10Actual
2010-11Budget
2010-11Revised
2011-12Recommended
2012-13Proposed
2009-10Actual
2010-11Budget
2010-11Revised
2011-12Recommended
2012-13Proposed
2009-10Actual
2010-11Budget
2010-11Revised
2011-12Recommend
2012-13Proposed
Salaries and Benefits 1,198,107 1,059,453 1,059,453 1,051,210 1,051,210-0.78%Other Expenses 449,896 436,766 436,766 431,166 431,166-1.28%Total Expenses 1,648,003 1,496,219 1,496,219 1,482,376 1,482,376-0.93%
P.A.C.C. 1,648,003 1,496,219 1,496,219 1,482,376 1,482,376-0.93%1,648,003 1,496,219 1,496,219 1,482,376 1,482,376-0.93%Total All Funds
Administrative Secretary I/II 1.00 1.00 1.00 1.00 1.00Community Facilities Manager 1.00 1.00 1.00 1.00 1.00Custodian 2.00 2.00 2.00 2.00 2.00Event Attendant I/II/III 3.50 3.50 3.50 3.50 3.50Event Coordinator 1.00 1.00 1.00 1.00 1.00Facilities Maintenance Worker I/II 1.00 1.00 1.00 1.00 1.00Senior Custodian 1.00 1.00 1.00 1.00 1.00
10.50 10.50 10.50 10.50 10.50Total Personnel


Measure O


%Change
Expenses by Category
Measure O Department Summary
265
%Change
%Change
Expenses by Fund
Expenses by Program 2009-10Actual
2010-11Budget
2010-11Revised
2011-12Recommended
2012-13Proposed
2009-10Actual
2010-11Budget
2010-11Revised
2011-12Recommended
2012-13Proposed
2009-10Actual
2010-11Budget
2010-11Revised
2011-12Recommended
2012-13Proposed
Salaries and Benefits 0 0 713,510 2,033,460 2,033,460184.99%Other Expenses 2,186 0 20,248,929 2,319,930 800,000-88.54%Total Expenses 2,186 0 20,962,439 4,353,390 2,833,460-79.23%
Half-Cent Sales Tax 2,186 0 20,962,439 4,353,390 2,833,460-79.23%2,186 0 20,962,439 4,353,390 2,833,460-79.23%Total All Funds
Parks & Open Space 0 0 14,271,446 0 0-100.00%Public Safety & Gang Prevention/Intervention
-8,820 0 825,000 4,353,390 2,833,460427.68%
Recreation & Youth Programming
0 0 715,000 0 0-100.00%
Traffic & Road Improvements 11,006 0 5,150,993 0 0-100.00%2,186 0 20,962,439 4,353,390 2,833,460-79.23%Total All Programs

Measure O Parks & Open Space
Activities / Functions
266
Functions Approved by voters in November 2008 to enhance services to the community, the half-cent sales tax or “Measure O” is a 20-year general purpose sales tax. Measure O provides protection, maintenance and enhancement of vital City services including police, fire and emergency response, increasing street paving/pothole repair to improve traffic flow, expanding youth recreation, after-school and anti-gang prevention programs, acquiring property for parks/open space preservation, upgrading stormwater drains, improving senior services, increasing code compliance, and other general services.
Activities Campus Park Phase I Phase I development of the 30-acre former Oxnard High School site (sports fields and more). Design was funded in Fiscal Year 2010-2011. Campus Park Phase II Phase II development of the 30-acre former Oxnard High School site (sports arena and more). Design was funded in Fiscal Year 2010-2011. College Park Project - Phase IC To complete College Park Phase 1 improvements included picnic shelters, existing skate park lights and attendant booth, south parking lot, main entry and existing buildings roof upgrades, traffic signal, bus stop, hardscape and landscape. The completion of Phase 1C will represent a multi-use community park with variety of activities, such as basketball, volleyball, soccer, play structures, wetland area viewing, walking paths, bicycle paths, picnic, and recreational areas for the community and youth. Del Sol Park Walking Track Construct an all-weather walking track at Del Sol Park. East Village Park Design Development of the 6-acre site in East Village (open space, walking track and more). Snack Bar - Community Center Park West Reconstruction and expansion of snack bar at Community Center Park West to meet Ventura County Health and Safety Code requirements and expand service capacity. Sports Park Design Development of the 20-acre site at Oxnard Boulevard and Gonzales Road (sports fields and more).

%Change
Measure O Parks & Open Space
267
Expenses by Category
Expenses by Fund %Change
Personnel
2009-10Actual
2010-11Budget
2010-11Revised
2011-12Recommended
2012-13Proposed
2009-10Actual
2010-11Budget
2010-11Revised
2011-12Recommended
2012-13Proposed
2009-10Actual
2010-11Budget
2010-11Revised
2011-12Recommend
2012-13Proposed
Salaries and Benefits 0 0 206,645 0 0-100.00%Other Expenses 0 0 14,064,801 0 0-100.00%Total Expenses 0 0 14,271,446 0 0-100.00%
Half-Cent Sales Tax 0 0 14,271,446 0 0-100.00%0 0 14,271,446 0 0-100.00%Total All Funds
No full-time equivalent positions budgeted 0.00 0.00 0.00 0.00 0.000.00 0.00 0.00 0.00 0.00Total Personnel

Measure O Public Safety & Gang Prevention/Intervention
Activities / Functions
268
Functions Approved by voters in November 2008 to enhance services to the community, the half-cent sales tax or “Measure O” is a general purpose sales tax. Measure O provides protection, maintenance, and enhancement of vital City services including police, fire and emergency response, anti-gang prevention programs, increasing building code compliance, response times, natural disasters, graffiti and other public safety.
Activities Alliance Safety Blueprint - Youth Development The purpose of the SAFETY Blueprint is to describe the range of elements needed to increase positive outcomes for young people, to also reduce violence, shift social norms, and promote safety for all. The Blueprint encompasses a broad range of objectives across the continuum of prevention, intervention, and suppression supported by strong community engagement. The program promotes positive youth development and address violence in Oxnard. City Corps Townkeeper Program Engage at-risk youth through programs that increase residents’ services and neighborhood cleanliness through focused and sustained enhancement activities. Enhanced Community Policing Addition of two beats, one each in District 1 and in District 2 would allow officers more time to proactively address problems in thebeats and better distribute the workload. Smaller areas of responsibility would shorten response times and allow for more problem-solving and directed enforcement, including gang suppression and traffic enforcement. These smaller beats will allow officers to better practice community policing philosophy. Fire Station Asphalt Replacement (Stations 1, 2 & 4) Replace asphalt at Fire Stations 1, 2 and 4 to ensure that response capabilities are not negatively impacted by deteriorated station driveways. Fire Station #8 at College Park Calls for service have increased by 46 percent in the last 10 years from 9,077 in 1999 to 13,211 in 2009. Fire Station #8 will enhance response times, getting closer to goal of 5 minutes. Anticipated cost of $8,514,000 will be financed through Lease Purchase. Police and Fire Department enhanced CAD-911/RMS/MDC systems Improve response times and public safety. TAGRS Graffiti Software System Automate graffiti photographic, information and reporting.

%Change
Measure O Public Safety & Gang Prevention/Intervention
269
Expenses by Category
Expenses by Fund %Change
Personnel
2009-10Actual
2010-11Budget
2010-11Revised
2011-12Recommended
2012-13Proposed
2009-10Actual
2010-11Budget
2010-11Revised
2011-12Recommended
2012-13Proposed
2009-10Actual
2010-11Budget
2010-11Revised
2011-12Recommend
2012-13Proposed
Salaries and Benefits 0 0 201,795 2,033,460 2,033,460907.69%Other Expenses -8,820 0 623,205 2,319,930 800,000272.26%Total Expenses -8,820 0 825,000 4,353,390 2,833,460427.68%
Half-Cent Sales Tax -8,820 0 825,000 4,353,390 2,833,460427.68%-8,820 0 825,000 4,353,390 2,833,460427.68%Total All Funds
No full-time equivalent positions budgeted 0.00 0.00 0.00 0.00 0.000.00 0.00 0.00 0.00 0.00Total Personnel

Measure O Recreation & Youth Programming
Activities / Functions
270
Functions Approved by voters in November 2008 to enhance services to the community, the half-cent sales tax or “Measure O” is a 20-year general purpose sales tax. Measure O provides protection, maintenance and enhancement of vital City services including police, fire and emergency response, increasing street paving/pothole repair to improve traffic flow, expanding youth recreation, after-school and anti-gang prevention programs, acquiring property for parks/open space preservation, upgrading stormwater drains, improving senior services, increasing code compliance, and other general services.
Activities Community Based Organization Contributions Support youth-at-risk through programs provided by community-based organizations. Oxnard Tennis Center Courts Resurfacing Repair and resurface the courts at the Oxnard Tennis Center to ensure the safety of players and enhance the enjoyment of the facility. PAL (Coaching/Soccer) Enhance Police Activities League in the areas of coaching and soccer. Preschool to You Program Enhancement Enhance the California League of Cities Helen Putnam Award for Excellence winning Preschool to You Program to provide significant outreach to underserved areas of the community. This program provides convenient access to high-quality preschool program including parent workshops and expanding the mobile preschool program into additional sites. South Oxnard Center Floor Replacement Repair and resurface the floor at the South Oxnard Center to ensure the safety of program participants and the full utilization and enjoyment of the facility.

%Change
Measure O Recreation & Youth Programming
271
Expenses by Category
Expenses by Fund %Change
Personnel
2009-10Actual
2010-11Budget
2010-11Revised
2011-12Recommended
2012-13Proposed
2009-10Actual
2010-11Budget
2010-11Revised
2011-12Recommended
2012-13Proposed
2009-10Actual
2010-11Budget
2010-11Revised
2011-12Recommend
2012-13Proposed
Salaries and Benefits 0 0 218,070 0 0-100.00%Other Expenses 0 0 496,930 0 0-100.00%Total Expenses 0 0 715,000 0 0-100.00%
Half-Cent Sales Tax 0 0 715,000 0 0-100.00%0 0 715,000 0 0-100.00%Total All Funds
No full-time equivalent positions budgeted 0.00 0.00 0.00 0.00 0.000.00 0.00 0.00 0.00 0.00Total Personnel

Measure O Traffic & Road Improvements
Activities / Functions
272
Functions
Approved by voters in November 2008 to enhance services to the community, the half-cent sales tax or “Measure O” is a 20-year general purpose sales tax. Measure O provides protection, maintenance and enhancement of vital City services including police, fire and emergency response, increasing street paving/pothole repair to improve traffic flow, expanding youth recreation, after-school and anti-gang prevention programs, acquiring property for parks/open space preservation, upgrading stormwater drains, improving senior services, increasing code compliance, and other general services.
Activities
Alley Reconstruction Reconstruct badly deteriorated alleys throughout the City that are not eligible for alternative funding. Intelligent Traffic System (ITS) Improve traffic movement and traffic signal synchronization at City intersections through the use of closed circuit television cameras. This project allows for real-time response to changing traffic patterns and can process, implement, and compute the most efficient timing plan. Roadway Repair Repair badly deteriorated sections of neighborhood and major City streets to avoid costlier reconstruction.

%Change
Measure O Traffic & Road Improvements
273
Expenses by Category
Expenses by Fund %Change
Personnel
2009-10Actual
2010-11Budget
2010-11Revised
2011-12Recommended
2012-13Proposed
2009-10Actual
2010-11Budget
2010-11Revised
2011-12Recommended
2012-13Proposed
2009-10Actual
2010-11Budget
2010-11Revised
2011-12Recommend
2012-13Proposed
Salaries and Benefits 0 0 87,000 0 0-100.00%Other Expenses 11,006 0 5,063,993 0 0-100.00%Total Expenses 11,006 0 5,150,993 0 0-100.00%
Half-Cent Sales Tax 11,006 0 5,150,993 0 0-100.00%11,006 0 5,150,993 0 0-100.00%Total All Funds
No full-time equivalent positions budgeted 0.00 0.00 0.00 0.00 0.000.00 0.00 0.00 0.00 0.00Total Personnel


Resolutions


City of Oxnard, California
Resolutions
277
CITY COUNCIL OF THE CITY OF OXNARD
RESOLUTION NO.
A RESOLUTION OF THE CITY COUNCIL OF THE CITY OF OXNARD APPROVING THE CITY OPERATING BUDGET AND CITY CAPITAL IMPROVEMENT BUDGET FOR THE FISCAL YEAR 2011-2012
WHEREAS, the City Manager submitted for the consideration of the City Council a proposed City Operating Budget and City Capital Improvement Budget for fiscal year 2011-2012including therein a budget for Community Development Block Grant Funds through June 30, 2011; and
WHEREAS, in accordance with City Code, Section 2-81, a public hearing on these budgets was duly scheduled, advertised and held, and there was an opportunity for all persons to be heard and for their suggestions or objections to be carefully considered.
NOW, THEREFORE, THE CITY COUNCIL OF THE CITY OF OXNARD HEREBY RESOLVES AS FOLLOWS:
1. The City Council has reviewed the proposed Operating Budget and Capital Improvement Budget and the funds included therein for the period of July 1, 2011 through June 30, 2012 and hereby finds that such budgets, as revised, are sound plans for the financing during fiscal year 2011-2012 of required City operations, services, and capital improvements. Such budgets are hereby adopted as follows:
GENERAL FUND FY 2011-2012 BudgetCity Attorney $ 1,336,917 City Clerk 353,311City Council 352,382City Manager 1,141,493
General Services 9,631,795Legislative Affairs 119,001Public Information 644,637
City Treasurer 1,167,167Community Development 1,321,665Development Services 5,967,358Finance 3,481,758Fire 14,942,227Housing 248,696Human Resources 1,171,903Library 4,577,282Police 48,506,118Public Works 2,572,922Recreation and Community Services 5,375,330 Subtotal $ 102,911,962
Non-DepartmentalGeneral Non-Departmental $ 1,015,881 Designated Reserves & Transfers 2,632,903

City of Oxnard, California
Resolutions
278
Resolution No.Page 2
FY 2011-2012 BudgetGeneral Debt Service 78,267Contribution to Carnegie Museum 426,987 Subtotal $ 4,154,038
TOTAL GENERAL FUND $ 107,066,000
INTERNAL SERVICE FUNDSPublic Liability & Property Damage $ 3,912,695 Workers' Compensation 6,418,599Utility Customer 1,476,090Information Systems 5,069,753Facilities Services 3,578,309Equipment Maintenance 8,814,708
TOTAL INTERNAL SERVICE PROGRAMS/FUNDS $ 29,270,154
SPECIAL FUNDS FY 2011-2012 BudgetAir Pollution Buydown Fee $ 168,000 Half-Cent Sales Tax 4,353,390Public Safety Fund 14,926,758Waterways Assessment District 570,157LMD #1 – Summerfield 35,764LMD #2 – CIBC Told 2,796LMD #3 – River Ridge 72,033LMD #4 – Beach Main Col/Hot 123,838LMD #9 – Strawberry Fields 37,312LMD #7 & #8 – Northfield Business 96,766LMD #10 – Country Club 70,121LMD #11 – St. Tropez 21,191LMD #12 – Standard Pacific 73,649LMD #14 – California Cove 34,278LMD #16 – Lighthouse 23,160LMD #13 – FD562-Le Village 54,608LMD #15 – Pelican Pointe 26,801LMD #17 – San Miguel 27,219LMD #20 – Volvo & Harbor 6,792LMD #18 – St. John’s Hospital 15,855LMD #19 – Shopping at the Rose 2,688LMD #21 – Cypress Point 2,688LMD #22 – McDonald’s Median 1,519LMD #23 – Greystone 15,870LMD #24 – Vineyards 51,694LMD #25 – The Pointe 66,516

City of Oxnard, California
Resolutions
279
Resolution No.Page 3
SPECIAL FUNDS FY 2011-2012 BudgetLMD #26 – Albertsons 10,903LMD #27 – Rose Island 40,198LMD #28 – Harborside 27,877LMD #29 – Mercy Charities 3,701LMD #30 – Haas Automation 18,178LMD #31 – Rancho De La Rosa 78,932LMD #32 – Oak Park 10,017LMD #33 – Rio Del Sol 36,439LMD #35 – MVS Commercial Center 6,812LMD #34 – Sunrise Pointe 47,344LMD #36 – Villa Santa Cruz 78,813LMD #37 – Pacific Breeze 13,872LMD #38 – Aldea Del Mar 61,959LMD #39 – El Sueno/Promesa 86,213LMD #39 – D.R. Horton 13,100LMD #40 – Cantada 18,450LMD #41 – Pacific Cove 41,042LMD #42 – Cantabria/Coronad 67,327LMD #43 – Greenbelt (PARCRO) 51,776LMD #44 – American Pacific Homes 17,961LMD #45 – Channel Point 6,546LMD #46 – Daily Ranch 91,537LMD #47 – Sycamore Place 35,963LMD #48 – Victoria Estates 86,637LMD #49 – Cameron Ranch 13,646LMD #50 – DV Senior Housing 15,755LMD #51 – Pfeiler 87,554LMD #52 – Wingfield Homes 56,771LMD #53 – Huff Court 2,955LMD #54 – Meadowcrest Villas 12,429LMD #55 – Wingfield West 22,845LMD #56 – The Cottages 6,186LMD #57 – Golden State Self Storage 10,010LMD #58 – Westwind 38,875LMD #59 – Orbela 12,634CFD #6 – Northshore Maintenance 68,670CFD #4 – Seabridge Maintenance 992,369CFD #5 – RiverPark Maintenance 3,673,382CFD #2 – Westport Maintenance 427,656CFD #1 – Westport 666,856CFD #3 Seabridge/Mandalay 1,928,950CFD #88-1 Oxnard Town Center 248,456CFD #2000-3 Oxnard Blvd/Highway 101 744,205AD 96-1 Rose / 101 734,732

City of Oxnard, California
Resolutions
280
Resolution No.Page 4
SPECIAL FUNDS FY 2011-2012 BudgetAD 2000-1 Oxnard Blvd/Highway 101 184,348AD 2001-1 Rice / Highway 101 1,108,168State Gas Tax Fund 5,069,155Traffic Safety Fund 950,841TDA – Local Transportation Fund - 4 713,564TDA – Local Transportation Fund - 8 3,016Community Development Block Grant Funds 3,622,746Federal Law Enforcement Grants 94,816HUD Federal Grants 1,422,175Parks and Recreation State Grants 2,100,000RSVP Federal Grant 128,912Quimby Fee Reserve Fund 60,604Storm Drain Fee 220,392Circulation System Improvement Fee 817,481Capital Growth Fees – Residential 1,496,082Capital Growth Fees – Non-Residential 406,099CUPA 725,934TOTAL SPECIAL FUNDS $ 50,722,329
ENTERPRISE FUNDS FY 2011-2012 BudgetEnvironmental Resources Fund $ 42,454,209 Water Fund 48,195,461Wastewater Fund 27,614,171Golf Course Operation 5,186,326Performing Arts Center Fund 1,482,376TOTAL ENTERPRISE FUNDS $124,932,543
TOTAL ALL FUNDS $311,991,026
Less: Internal Service Funds/Programs (29,270,154) Loans to Other City Agencies (1,030,560)
Net Adjusted Appropriations $281,690,312
2. To the extent funds are available, any unused appropriations at the end of fiscal year 2010-2011 in active Capital Improvement Projects are hereby reappropriated for continued use in fiscal year 2011-2012.
3. Any remaining balances in approved grant programs and improvement assessment district projects at the end of fiscal year 2010-2011, except for balances reallocated as part of the budget process, are hereby reappropriated for continuing use in fiscal year 2011-2012 and all estimated revenues from such approved grants and assessment districts projects for 2010-2011 that are not realized by year end are authorized to be continued.

City of Oxnard, California
Resolutions
281
Resolution No.Page 5
4. To the extent funds are available, all General Fund encumbrances at the close of fiscal year 2010-2011 are carried forward and corresponding appropriations are also carried forward.
5. All General Fund revenues in excess of expenditures and encumbrances at the close of fiscal year 2010-2011, not otherwise provided for in City Council budget policies or reappropriated above, are hereby appropriated to the General Fund Operating Reserve on June 30, 2011.
6. Staff is directed to ensure that the final adopted budget documents containing the Operating Budget and the Capital Improvement Budget for fiscal year 2011-2012shall contain all revisions made by the City Council prior to final budget adoption.
PASSED AND ADOPTED on this day of , 2011, by the following vote:
AYES:
NOES:
ABSENT:
Dr. Thomas E. Holden, Mayor
ATTEST:
Daniel Martinez, City Clerk
APPROVED AS TO FORM:
Alan Holmberg, City Attorney

City of Oxnard, California
Resolutions
282
CITY COUNCIL OF THE CITY OF OXNARD
RESOLUTION NO.
A RESOLUTION OF THE CITY COUNCIL OF THE CITY OF OXNARD AUTHORIZING FULL-TIME EQUIVALENT POSITIONS IN THE CITY SERVICE EFFECTIVE JULY 1, 2011 IN ACCORDANCE WITH THE OPERATING BUDGET FOR THE 2011-2012 FISCAL YEAR
NOW THEREFORE, the City Council of the City of Oxnard hereby resolves that the following classifications and positions are hereby authorized as provided for in the Operating Budget for fiscal year 2011-2012.
CATEGORY, GROUP, PROGRAM CLASSIFICATION TITLE
HOME PROGRAM FULL-TIME EQUIVALENT POSITIONS
CARNEGIECarnegie Art Museum Cultural Arts Supervisor 1 Event Attendant I/II/III 1.75 Office Assistant I/II .75 Carnegie Art Museum Total 3.50
CITY ATTORNEY City Attorney Administrative Legal Assistant (C) 1 Administrative Legal Secretary I/II (C) 1 Administrative Legal Secretary III (C) 1 Assistant City Attorney 3 City Attorney 1 Deputy City Attorney I/II 1 Law Office Manager 1
Total 9 Collection Services Paralegal (C) 1
Total 1 City Attorney Total 10 CITY CLERK City Clerk Administrative Assistant 1 Assistant City Clerk 1 City Clerk 1 Office Assistant I/II 1 City Clerk Total 4 CITY COUNCIL City Council City Councilmember 4 Executive Assistant II .30 Mayor 1 City Council Total 5.30 CITY MANAGER City Manager Administrative Assistant (C) 1 Assistant City Manager .65 City Manager .85 Deputy City Manager .85 Executive Assistant II 1.70 Management Analyst III 1 Special Assistant to City Manager .5
Total 6.55 Public Information Outreach/Education Specialist 2 Public Information Officer 1
Total 3 Community Relations/Community Access TV Administrative Secretary I/II 1 Community Outreach & Production Specialist 1
Total 2

City of Oxnard, California
Resolutions
283
Resolution No.Page 2
Legislative Affairs Legislative Affairs Manager 1
Total 1
Neighborhood Services Administrative Secretary I/II 1 Management Analyst III .40 Neighborhood Services Coordinator 1
Total 2.40 Enterprise Information Systems Management Computer Operator 1 Deputy City Manager .03 Network Services Coordinator 1 Programmer Analyst 1 Systems Administrator 1
Total 4.03 Geographic Information Systems Deputy City Manager .03 Geographic Information Systems Coordinator 1 Geographic Information Systems Technician I/II 3 Programmer Analyst 1 Systems Analyst I 1
Total 6.03 Personal Computer/Network Systems Computer Network Engineer I/II 2 Computer Network Engineer III 2 Computer Operator 2 Deputy City Manager .03 Systems Administrator 1 Systems Analyst I 1 Systems Analyst III 1
Total 9.03 Document Publishing Services Deputy City Manager .03 Word Processor I/II 1 Word Processor III 1
Total 2.03 Telecommunications/Web Development Deputy City Manager .03 Telecommunications Coordinator 1
Total 1.03 Facilities Maintenance Administrative Technician .10 Construction Project Coordinator 1 Custodial Supervisor 1 Custodian 13 Facilities Maintenance Supervisor 1 Facilities Maintenance Worker I/II 6 HVAC Technician 3 Maintenance Carpenter 2 Maintenance Electrician 2 Maintenance Plumber 2 Maintenance Services Manager .25 Senior Custodian 2 Senior Facilities Maintenance Worker 2
Total 35.35 Fleet Services Maintenance Administrative Assistant 1 Fleet Services Maintenance Worker/Mechanic I/II (or Maintenance Worker) Trainee) 23 Fleet Services Mechanic Supervisor 2 Fleet Services Manager 1 Fleet Services Operations Manager 1 Maintenance Services Manager .20 Senior Fleet Services Mechanic 6

City of Oxnard, California
Resolutions
284
Resolution No.Page 3
Tire Repairer 1Total 35.2
Graffiti Action Program Graffiti Action Coordinator 1 Management Analyst III .3 Office Assistant I/II 1 Parks Maintenance Supervisor .3
Total 2.6 Park & Facility Development Construction Project Coordinator 1 Project Manager 1
Total 2 Parks, Public Grounds & Open Space Administrative Secretary I/II 1 Administrative Technician .70 Groundsworker I/II (or Maintenance Worker Trainee) 10 Maintenance Services Manager .25 Management Analyst III .2 Office Assistant I/II 1 Parks Maintenance Supervisor 1 Parks Manager 1 Senior Groundsworker 2
Total 17.15 River Ridge Golf Course Maintenance Services Manager .25 Management Analyst III .15
Total .40 Street Landscaping Administrative Technician .20 Groundsworker I/II (or Maintenance Worker Trainee) 3 Maintenance Plumber 1 Maintenance Services Manager .05 Management Analyst III .35 Parks Maintenance Supervisor 1.7 Senior Facilities Maintenance Worker 1 Senior Groundsworker 3 Senior Tree Trimmer 1
Total 11.3 Street Trees & Medians Groundsworker I/II (or Maintenance Worker Trainee) 3 Parks Maintenance Supervisor 1 Senior Groundsworker 1 Senior Tree Trimmer 1 Tree Trimmer I/II (or Maintenance Worker Trainee) 3
Total 9 City Manager Total 150.10 CITY TREASURER City Treasurer Account Clerk I/II 2.75 Account Clerk III 1 Administrative Assistant 1 Revenue Collection Technician 1 City Treasurer 1
Total 6.75 Utility Customer/Licensing Services Assistant City Treasurer/Revenue Accounting Manager 1 Code Compliance Inspector I/II 1 Customer Service Accounting Technician 2 Customer Service Representative I/II 7 Senior Customer Service Representative 1 Treasury Supervisor 1
Total 13 City Treasurer Total 19.75

City of Oxnard, California
Resolutions
285
Resolution No.Page 4
COMMUNITY DEVELOPMENT COMMISSION Special Projects/CDC Operations Administrative Assistant .8 Administrative Secretary I/II 1 Administrative Secretary III .85 Assistant City Manager .15 City Manager .15 Community Development Director .73 Drafting/Graphics Technician .25 Housing Director .05 Management Accountant/Auditor .15 Management I/II 1 Management III .5 Redevelopment Project Manager 3.6 Redevelopment Services Manager 1
Total 10.23 20% Housing Set-Aside Administrative Assistant .2 Administrative Secretary III .3 Community Development Director .27 Housing Director .1 Housing Rehabilitation Program Manager .15 Office Assistant I/II .15 Redevelopment Project Manager .4 Rehabilitation Construction Specialist I/II .15 Rehabilitation Loan Assistant .15 Rehabilitation Loan Specialist .15 Senior Code Compliance Inspector 1
Total 3.02 Community Development Commission Total 13.25 DEVELOPMENT SERVICES Development Support and Public Project Contracts Administrative Technician 1 Development Services Director 1 Management Analyst I/II .5
Total 2.5 Building & Engineering Services Administrative Secretary I/II 1 Administrative Secretary III 1 Assistant Traffic Engineer 1 Building Inspector I/II 6.18 Civil Engineer 1 Construction Inspector I/II 2 Data Entry Operator I/II 1 Deputy Building Official 2 Development Services Manager 1 Electrical Inspector 1 Junior Civil Engineer 3 Office Assistant I/II 6 Permit Technician 3 Plan Check Engineer 1 Plans Examiner I/II 1 Project Manager .50 Senior Construction Inspector 1 Supervising Building Inspector 1 Supervising Civil Engineer 1
Total 34.68 Planning and Environmental Services Administrative Secretary III 1 Assistant Planner 2 Associate Planner 4 Drafting/Graphics Tech. I/II .75 Junior Planner 1 Office Assistant I/II 1 Planning and Environmental Services Manager 1

City of Oxnard, California
Resolutions
286
Resolution No.Page 5
Principal Planner 2Total 12.75
Traffic Engineering & Operations Associate Traffic Design Engineer 1 Traffic Engineer 1
Total 2 Transit Services Project Manager .50 Special Assistant to City Manager .50
Total 1 Development Services Total 52.93
FINANCE Administration Chief Financial Officer 1 Senior Administrative Secretary (C) 1
Total 2 General Accounting Account Clerk I/II 2.5 Account Clerk III 1 Accountant I/II 2 Accountant II (C) 1 Accounting Manager 1 Accounting Technician 2 Financial Analyst II 1 Management Accountant/Auditor .85
Total 11.35 Budget/Capital Improvement Projects Accounting Manager .5 Financial Analyst II .5
Total 1 Purchasing Account Clerk III 1 Accounting Manager 1 Buyer 1 Purchasing Clerk 1
Total 4 Financial Resources Administrative Technician 1 Financial Analyst I/II .50 Financial Services Manager 1
Total 2.50 Grants Management Accounting Manager .5 Administrative Secretary III 1 Financial Analyst I/II 1
Total 2.5 Mail and Courier Services Mail Clerk 2
Total 2 Finance Total 25.35
FIRE Fire Suppression and Other Emergency Services Administrative Assistant (C) 1 Administrative Secretary I/II .50 Assistant Fire Chief .95 Emergency Medical Services Coordinator 1 Fire Battalion Chief 3.90 Fire Captain 25 Fire Chief .95 Fire Engineer 24 Firefighter 33
Total 90.3

City of Oxnard, California
Resolutions
287
Resolution No.Page 6
Fire Prevention Administrative Secretary I/II .50 Fire Battalion Chief 1 Fire Captain 1 Fire Inspector 4 Plans Examiner I/II .90
Total 7.4 Disaster Preparedness Assistant Fire Chief .05 Disaster Preparedness Coordinator 1 Fire Battalion Chief .10 Fire Chief .05
Total 1.2 Certified Unified Program Agency (CUPA) CUPA Coordinator 1 Fire Environmental Specialist I/II 4 Plans Examiner I/II .10
Total 5.10 Fire Total 104
HOUSING Public Housing Account Clerk I/II 2 Account Clerk III 1.55 Accountant I/II 1.05 Administrative Secretary III 1.3 Administrative Technician 1 Computer Network Engineer III .72 Facilities Maintenance Worker I/II 7 Groundsworker I/II (or Maintenance Worker Trainee) 4 Housing Contract Administrator 1 Housing Director .30 Housing Engineer 1 Housing Financial Officer .55 Housing Maintenance Superintendent 1 Housing Maintenance Supervisor 3 Housing Modernization Superintendent 1 Housing Program Supervisor 2 Housing Programs Manager 1 Housing Specialist I/II 6 Management Accountant/Auditor .95 Management Analyst I/II 1 Management Analyst III 1.35 Office Assistant I/II 6.65 Project Developer 0 Resident Services Assistant 2 Resident Services Coordinator 1 Senior Groundsworker 1 Senior Housing Maintenance Worker 2 Senior Housing Specialist 3
Total 54.42 Rental Assistance Account Clerk III .45 Accountant I/II .95 Administrative Secretary III .55 Building Inspector I .816 Compliance Services Manager .06 Computer Network Engineer III .28 Housing Director .55 Housing Financial Officer .45 Housing Inspector 1 Housing Program Supervisor 1 Housing Specialist I/II 7 Management Accountant/Auditor .05 Management Analyst I/II/III .15 Office Assistant I/II 3.35

City of Oxnard, California
Resolutions
288
Resolution No.Page 7
Senior Housing Specialist 2 Total 18.656
Affordable Housing Assistance Housing Rehabilitation Program Manager .05 Office Assistant I/II .05 Rehabilitation Construction Specialist I/II .05 Rehabilitation Loan Assistant .05 Rehabilitation Loan Specialist .05
Total .25 Housing Rehabilitation Housing Rehabilitation Program Manager .8 Management Analyst I/II .5 Office Assistant I/II .80 Rehabilitation Construction Specialist I/II .80 Rehabilitation Loan Assistant .80 Rehabilitation Loan Specialist .80
Total 4.50 Homeless Assistance Homeless Assistance Program Coordinator 1
Total 1 Mobilehome Rent Stabilization Compliance Services Manager .91
Total .91 Fair Housing Compliance Services Manager .03
Total .03 Grant Administration Accounting Manager 1 Grant Coordinator 1 Grant Specialist I/II 1
Total 3 Housing Total 82.766
HUMAN RESOURCES Human Resources Administrative Secretary I/II (C) 2 Assistant City Manager .20 Employee Relations Coordinator (C) .5 Human Resources Director 1 Human Resources Manager 1 Human Resources Technician (C) 1 Recruitment Supervisor 1 Senior Benefits Coordinator (C) 1
Total 7.70 Workers’ Compensation Administrative Technician (C) 2 Employee Relations Coordinator (C) .5 Workers’ Compensation Manager 1 Workers’ Compensation Specialist (C) 1
Total 4.5 Safety Management Safety Specialist (C) 1
Total 1 Human Resources Total 13.20
LIBRARYLibrary Community Outreach Administrative Assistant 1 Library Aide III 1 Library Director 1 Office Assistant I/II 1
Total 4 Library Circulation Services Library Circulation Supervisor 1 Library Aide I/II 8 Office Assistant I/II 1
Total 10

City of Oxnard, California
Resolutions
289
Resolution No.Page 8
Library Branch Services Librarian I/II 3 Librarian III 1 Library Aide I/II 2.50 Library Aide III 1 Library Services Supervisor 1
Total 8.50 Library Information/Reference Services Librarian I/II 10 Librarian III 1 Library Services Supervisor 1 Literacy Coordinator 1
Total 13.00 Library Support Services Computer Network Engineer III 2 Library Aide I/II 3.50 Library Aide III 1 Systems Analyst III 1
Total 7.50 Library Total 43
POLICE Code Compliance Administrative Technician 1 Code Compliance Inspector I/II 9 Code Compliance Manager 1 Office Assistant I/II 1 Senior Code Compliance Inspector 1
Total 13.00 Community Patrol Administrative Secretary II 1 Animal Safety Officer 3 Assistant Police Chief 2 Community Service Officer 10 Crossing Guard 10.50 Police Commander 6 Police Officer I/II 147 Police Officer III 15.2 Police Sergeant 19 Police Service Officer 8 Senior Animal Safety Officer 1 Senior Police Service Officer 1 Senior Traffic Service Assistant 3 Traffic Service Assistant I/II 15
Total 241.7 Criminal Investigation Community Service Officer 1 Crime Analysis Data Technician 1 Crime Analyst I/II 2 Criminalist 1 Data Entry Operator I/II .50 Evidence Technician I/II 2 Missing Persons Specialist 1 Police Commander 1 Police Officer I/II 17 Police Officer III 16 Police Sergeant 6 Sex Registrant Specialist 1 Victim Services Specialist 1
Total 50.5 Police Support Services Account Clerk I/II 2 Administrative Assistant (C) 1 Administrative Services Assistant 1 Assistant Police Chief 1 Community Affairs Manager 1

City of Oxnard, California
Resolutions
290
Resolution No.Page 9
Community Service Officer 1 Computer Network Engineer III 3 Data Entry Operator I/II 3.75 Grants Specialist I/II 1 Office Assistant I/II 1 Police Chief 1 Police Commander 1 Police Financial Manager 1 Police Records Manager 1 Police Records Supervisor 1 Police Records Technician I/II 15.75 Police Records Technician III 3 Police Sergeant 4 Police Word Processor I/II 7.50 Police Word Processor III 1 Programmer Analyst 2 Property & Evidence Custodian 1 Systems Analyst I/II/III 1
Total 56 Emergency Communications Communications Manager 1 Communications Training Coordinator 1 Public Safety Dispatcher I/II 19 Public Safety Dispatcher III 5
Total 26 Police Total 387.2
PUBLIC WORKS ADMINISTRATIVE SERVICES Public Works Administration Administrative Assistant 1 Administrative Secretary III 1 Administrative Services Manager 1 Office Assistant II 1 Public Works Director 1
Total 5 PUBLIC WORKS CONSTRUCTION AND DESIGN SERVICES Engineering Design & Contract Admin Assistant Civil Engineer 1 Construction & Maintenance Engineer .50 Construction Project Coordinator 1 Design & Construction Services Manager 1 Junior Civil Engineer 1 Engineering/Survey Technician I/II 2 Senior Civil Engineer 2
Total 8.50 Construction Services - Streets Construction Inspector I/II 4 Construction & Maintenance Engineer .50 Management Analyst I/II .50 Public Works Construction Project Manager 1 Senior Construction Inspector 1
Total 7.0 Street Maintenance & Repair Account Clerk I/II .15 Administrative Secretary III 1 Administrative Technician 1 Equipment Operator 6 Office Assistant I/II .05 Senior Street Maintenance Worker 4 Street Maintenance Worker I/II (or Maintenance Worker Trainee) 7 Streets Manager 1 Traffic Safety Maintenance Worker 2 Traffic Signal Repairer I/II 2 Traffic Signal Technician 1
Total 25.2

City of Oxnard, California
Resolutions
291
Resolution No.Page 10
Survey Services City Surveyor 1 Engineering/Survey Technician I/II 1 Senior Engineering Technician/Survey Chief 1
Total 3 PUBLIC WORKS UTILITIES SERVICES Water Procurement Account Clerk I/II .20 Administrative Secretary III 1 Administrative Technician .33 Management Analyst II .5 Office Assistant I/II .30 Public Works Construction Project Manager 1 Utility Services Manager .33 Water Programs Manager 1 Water Resources Manager .50
Total 5.16 Water Conservation & Education Water Conservation/Outreach Coordinator 1 Water Conservation/Outreach Technician 2
Total 3 Water Production Chief Operator 1 Senior Water Treatment Plant Operator 1 Water Treatment Operator I/II/III 5
Total 7 Water Distribution Chief Operator 1 Engineer 1 Meter Reader 9 Meter Repair Worker 4 Public Works Construction Project Manager 1 Senior Meter Reader 1 Senior Meter Repair Worker 1 Senior Water Distribution Operator 2 Water Distribution Operator I 8 Water Distribution Operator II 5
Total 33 Water Security & Contamination Prevention Water Regulatory Compliance Coordinator 1 Water Regulatory Compliance Coordinator Technician I/II 2
Total 3 Source Control Data Entry Operator I/II 1 Senior Wastewater Environmental Specialist 1 Source Control Inspector I/II 1 Source Control Technician .75 Technical Services Manager .50 Wastewater Environmental Specialist 2
Total 6.25 Storm Water Quality Management Senior Wastewater Environmental Specialist 1.00 Source Control Technician .25 Technical Services Manager .50 Wastewater Environmental Specialist 2
Total 3.75 Collection System Maintenance and Upgrades Account Clerk I/II .22 Administrative Technician .17 Management Analyst I/II .25 Office Assistant I/II .15 Senior Wastewater Collection Operator 1 Senior Wastewater Mechanic 1 Treatment Plant Electrician .25 Utility Services Manager .17

City of Oxnard, California
Resolutions
292
Resolution No.Page 11
Wastewater Collection Operator I/II 5 Wastewater Collection Supervisor .50 Wastewater Maintenance Manager .50 Wastewater Maintenance Supervisor .25 Wastewater Mechanic I/II 1 Water Resources Manager .25
Total 10.71 Flood Control Wastewater Collection Operator I/II 2 Wastewater Collection Supervisor .50
Total 2.5 Laboratory Services Chemist 1 Laboratory Assistant 1 Laboratory Technician 2 Laboratory Supervisor 1 Wastewater Operations Manager .25
Total 5.25 Treatment Plant Operations Administrative Secretary I/II 1 Power Production Operator II 2 Senior Wastewater Operator 4 Wastewater Operations Manager .75 Wastewater Operator I/II 14 Wastewater Operator III 2
Total 23.75 Treatment Plant Maintenance & Upgrades Account Clerk I/II .23 Administrative Technician .17 Electrician/Instrumentation Technician 1 Groundsworker I/II 1 Instrumentation Technician 1 Management Analyst I/II .25 Office Assistant I/II .15 Senior Wastewater Mechanic 1 Transport Operator 1 Treatment Plant Electrician 1.75 Utility Services Manager .16 Wastewater Maintenance Manager .50 Wastewater Maintenance Supervisor .75 Wastewater Mechanic I/II 9 Water Resources Manager .25
Total 18.21 Environmental Resources Planning Account Clerk I/II .2 Account Clerk III 1 Administrative Secretary III 1 Administrative Technician 1.33 Management Analyst III .5 Office Assistant I/II .35 Solid Waste Equipment Operator II 2 Solid Waste Supervisor 4 Solid Waste Superintendent 1 Utility Services Manager .34
Total 11.72 Waste Reduction and Education Recycling Manager 1
Total 1 Environmental Resources Residential Collection Solid Waste Equipment Operator II 20 Solid Waste Compliance Specialist 4
Total 24

City of Oxnard, California
Resolutions
293
Resolution No.Page 12
Environmental Resources Commercial Collection Container Service Worker 2 Solid Waste Equipment Operator II 21
Total 23 Environmental Resources Industrial Collection Solid Waste Equipment Operator II 6
Total 6 Environmental Resources Processing & Disposal Solid Waste Transfer Operator 13
Total 13 Public Works Total 249 RECREATION AND COMMUNITY SERVICES Recreation Services Administrative Secretary III .5 Administrative Technician 1 Community Services Manager 1 Leisure and Recreation Superintendent 1 Management Analyst I/II 1 Management Analyst III .30 Office Assistant I/II 1 Recreation/Human Services Coordinator 5.50 Recreation/Human Services Leader I/II/III 3.50 Recreation Supervisor .50
Total 15.3 Youth Development Administrative Secretary I/II 1 Administrative Secretary III .50 Management Analyst III .30 Police Officer III .8 Recreation Supervisor 1.50
Total 4.1 Senior Services/Special Populations Office Assistant I/II 1 Recreation/Human Services Coordinator 2 Recreation/Human Services Leader I/II/III 2.75 Recreation Supervisor 1
Total 6.75 Performing Arts and Convention Center Administrative Secretary I/II 1 Community Facilities Manager 1 Custodian 2 Event Attendant I/II/III 3.5 Event Coordinator 1 Facilities Maintenance Worker I/II 1 Senior Custodian 1
Total 10.50 Recreation and Community Services Total 36.65
CITY TOTAL 1200.00

City of Oxnard, California
Resolutions
294
Resolution No.Page 13
PASSED AND ADOPTED on this day of , 2011, by the following vote:
AYES:
NOES:
ABSENT:
ABSTAIN:
Dr. Thomas E. Holden, Mayor
ATTEST:
Daniel Martinez, City Clerk
APPROVED AS TO FORM:
Alan Holmberg, City Attorney

City of Oxnard, California
Resolutions
295
CITY COUNCIL OF THE CITY OF OXNARD
RESOLUTION NO.
A RESOLUTION OF THE CITY COUNCIL OF THE CITY OF OXNARD APPROVING CHANGES IN SECTION XII OF THE PERSONNEL RULES AND REGULATIONS
WHEREAS, the City Manager has submitted for the consideration of the City Council of the City of Oxnard an updated Classification and Salary Schedule; and
WHEREAS, the City Council has carefully reviewed the Classification and Salary Schedule submitted by the City Manager and finds that the recommended Classification and Salary Schedule is desirable in the interest of maintaining an efficient municipal organization.
NOW, THEREFORE, THE CITY COUNCIL OF THE CITY OF OXNARD RESOLVES that Section XII of the Personnel Rules and Regulations shall remain in force and effect and is amended as set forth in the attached Classification and Salary Schedule as of July 1, 2011.
PASSED AND ADOPTED on this ________ day of , 2011, by the following vote:
AYES:
NOES:
ABSENT:
Dr. Thomas E. Holden, Mayor
ATTEST:
Daniel Martinez, City Clerk
APPROVED AS TO FORM:
Alan Holmberg, City Attorney

City of Oxnard, California
Resolutions
296
Resolution No.Page 2 CITY OF OXNARD
CLASSIFICATION AND SALARY SCHEDULE EFFECTIVE JULY 1, 2011
Class Title Class Title SalaryRange
SalaryRange
Account Clerk I A 14Account Clerk II A 20Account Clerk III A 27Accountant I A 63Accountant II A 80Accounting Manager M 48Accounting Technician A 45Administrative Assistant A 61Administrative Assistant (C) C 70Administrative Legal Assistant (C) C 70Administrative Legal Secretary I C 25Administrative Legal Secretary II C 35Administrative Legal Secretary III C 50Administrative Secretary I A 12Administrative Secretary I (Conf) C 15Administrative Secretary II A 19Administrative Secretary II (Conf) C 30Administrative Secretary III A 26Administrative Secretary III (Conf) C 40Administrative Services Assistant A 61Administrative Services Manager M 66Administrative Technician A 36Administrative Technician (C) C 60Animal Safety Officer B 74.00Assistant City Attorney M 88Assistant City Clerk M 11Assistant City Manager E 11Assistant City Treasurer/Revenue Accounting Manager
M 48
Assistant Civil Engineer A 93Assistant Fire Chief P S2Assistant Planner A 69Assistant Police Chief P S6Assistant Traffic Design Engineer A 93Assistant Traffic Engineer A 93Associate Planner A 83Associate Traffic Design Engineer A 97Battalion Chief P S1Building Inspector I B 104.50Building Inspector II B 114.50Buyer A 40Chemist A 72Chief Financial Officer E 8Chief Operator M 32City Attorney Contract
City Clerk E 3City Council Member OrdinanceCity Manager Contract City Surveyor M 34City Treasurer E 3Civil Engineer A 97Code Compliance Inspector I B 96.00Code Compliance Inspector II B 106.00Code Compliance Manager M 40Communications Manager M 36Communications Training Coordinator P 76Community Affairs Manager M 38Community Development Director E 8Community Facilities Manager M 48Community Outreach & Production Specialist M 22Community Service Officer A 34Community Services Manager M 29Compliance Services Manager M 29Computer Network Engineer I A 32Computer Network Engineer II A 49Computer Network Engineer III A 78Computer Operator A 49Construction & Maintenance Engineer M 66Construction Inspector I B 104.50Construction Inspector II B 114.50Construction Project Coordinator A 61Container Service Worker B 74.00Controller M 62Crime Analysis Data Technician A 34Crime Analyst I A 48Crime Analyst II A 64Criminalist A 91Crossing Guard A 00Cultural Arts Supervisor M 11CUPA Coordinator M 44Custodial Supervisor M 14Custodian B 48.00Customer Service Accounting Technician A 45Customer Service Representative I A 14Customer Service Representative II A 20Data Entry Operator I A 14Data Entry Operator II A 20Deputy Building Official M 74Deputy City Attorney I M 48Deputy City Attorney II M 62

City of Oxnard, California
Resolutions
297
Resolution No.Page 3 CITY OF OXNARD
CLASSIFICATION AND SALARY SCHEDULE EFFECTIVE JULY 1, 2011
Class Title SalaryRange Class Title
SalaryRange
Deputy City Manager E 8Design & Construction Services Manager M 83Development Services Director E 9Development Services Manager M 87Disaster Preparedness Coordinator M 38Drafting/Graphics Technician I A 41Drafting/Graphics Technician II A 57Electrical Inspector B 126.50Electrician/Instrumentation Technician B 112.25Emergency Medical Services Coordinator M 44Employee Relations Coordinator (C) C 67Engineer A 97Engineering Technician I/Survey Crew A 41Engineering Technician II/Survey Crew A 57Engineering Technician I A 41Engineering Technician II A 57Equipment Operator B 79.00Event Attendant II (P) A 06Event Attendant III (P) A 36Event Coordinator A 46Evidence Technician I A 53Evidence Technician II A 68Executive Assistant I C 80Executive Assistant II C 85Facilities Maintenance Worker I B 62.00Facilities Maintenance Worker II B 72.00Facilities Maintenance Supervisor M 19Financial Analyst I M 14Financial Analyst II M 22Financial Analyst III M 29Financial Services Manager M 48Fire Captain F 124.00Fire Chief E 10Fire Engineer F 109.00Fire Environmental Specialist I F 96.00Fire Environmental Specialist II F 109.00Fire Inspector F 109.00Firefighter F 96.00Firefighter Trainee Flat Rate Fleet Services Maintenance Worker B 61.00Fleet Services Manager M 44Fleet Services Mechanic I B 99.00Fleet Services Mechanic II B 104.00Fleet Services Mechanic Supervisor M 16Fleet Services Operations Manager M 19
Geographic Information Systems Coordinator M 51Geographic Information Systems Technician I A 50Geographic Information Systems Technician II A 70Graffiti Action Coordinator B 99Grants Specialist I A 63Grants Specialist II A 80Grants Coordinator M 36Groundsworker I B 60.00Groundsworker II B 70.00Homeless Assistance Program Coordinator M 29Housing Contract Administrator A 61Housing Director E 8Housing Engineer A 89Housing Financial Officer M 48Housing Inspector B 79.00Housing Maintenance Superintendent M 38Housing Maintenance Supervisor M 14Housing Modernization Superintendent M 38Housing Programs Manager M 51Housing Program Supervisor M 29Housing Rehabilitation Program Manager M 38Housing Specialist I A 44Housing Specialist II A 59Housing Specialist Trainee A 33Human Resources Director E 8Human Resources Manager M 66Human Resources Technician (C) C 70HVAC Technician B 89.00Instrumentation Technician B 112.25Junior Civil Engineer A 85Junior Planner A 52Laboratory Assistant A 40Laboratory Supervisor M 26Laboratory Technician A 56Landscape Architect A 89Law Office Manager M 19Legislative Affairs Manager M 40Leisure and Recreation Superintendent M 48Librarian I A 47Librarian II A 62Librarian III A 79Library Aide I A 15Library Aide II A 21Library Aide III A 28Library Circulation Supervisor M 14

City of Oxnard, California
Resolutions
298
Resolution No.Page 4 CITY OF OXNARD
CLASSIFICATION AND SALARY SCHEDULE EFFECTIVE JULY 1, 2011
Class Title SalaryRange Class Title
SalaryRange
Library Director E 6Library Services Supervisor M 26Literacy Coordinator A 47Mail Clerk A 15Maintenance Carpenter B 88.00Maintenance Electrician B 89.00Maintenance Plumber B 88.00Maintenance Services Manager M 85Maintenance Worker Trainee B 45.00Management Accountant/Auditor M 29Management Analyst I M 14Management Analyst II M 22Management Analyst III M 29Mayor OrdinanceMeter Reader B 70.00Meter Repair Worker B 75.00Missing Persons Specialist A 34Neighborhood Services Coordinator A 61Network Services Coordinator M 14Office Assistant I A 10Office Assistant I (Conf) C 10Office Assistant II A 15Office Assistant II (Conf) C 20Outreach/Education Specialist A 61Paralegal C 75Parks Maintenance Supervisor M 14Parks Manager M 44Permit Technician A 55Planning & Environmental Services Manager M 81Plan Check Engineer A 97Plans Examiner I A 66Plans Examiner II A 81Plumbing & Mechanical Inspector B 126.50Police Chief E 11Police Commander P S5Police Financial Manger M 48Police Officer I P 91.00Police Officer II P 91.00Police Officer III P 99.00Police Records Manager M 29Police Records Supervisor M 11Police Records Technician I A 11Police Records Technician II A 17Police Records Technician III A 24Police Sergeant P 106.00
Police Service Officer P 72.00Police Word Processor I A 23Police Word Processor II A 30Police Word Processor III A 38Power Production Operator I B 85.25Power Production Operator II B 95.25Principal Planner M 44Programmer Analyst A 86Project Manager M 40Property & Evidence Custodian A 68Public Information Officer M 38Public Safety Dispatcher I P 49.00Public Safety Dispatcher II P 59.00Public Safety Dispatcher III P 76.00Public Safety Trainee Flat RatePublic Works Construction Project Manager M 38Public Works Director E 10Purchasing Clerk A 20Recreation/Human Services Coordinator A 42Recreation/Human Services Leader II A 01Recreation/Human Services Leader III A 21Recreation Supervisor M 19Recruitment Supervisor M 29Recycling Manager M 36Redevelopment Project Manager M 40Redevelopment Services Manager M 74Rehabilitation Construction Specialist I B 101.00Rehabilitation Construction Specialist II B 111.00Rehabilitation Loan Assistant A 33Rehabilitation Loan Specialist A 74Resident Services Assistant A 59Resident Services Coordinator A 74Revenue Collection Technician A 45Safety Specialist (C) C 72Senior Administrative Legal Secretary C 65Senior Administrative Secretary A 35Senior Administrative Secretary (C) C 55Senior Animal Safety Officer B 84.00Senior Benefits Coordinator (C) C 75Senior Civil Engineer A 99Senior Code Compliance Inspector B 116.00Senior Construction Inspector B 124.50Senior Custodian B 58.00Senior Customer Service Representative A 27Senior Engineering Technician A 76

City of Oxnard, California
Resolutions
299
Resolution No.Page 5 CITY OF OXNARD
CLASSIFICATION AND SALARY SCHEDULE EFFECTIVE JULY 1, 2011
Class Title SalaryRange Class Title
SalaryRange
Senior Engineering Technician/Survey Chief A 76Senior Fleet Services Mechanic B 109.00Senior Facilities Maintenance Worker B 99.00Senior Groundsworker B 80.00Senior Housing Maintenance Worker B 92.00Senior Housing Specialist A 74Senior Meter Reader B 80.00Senior Meter Repair Worker B 85.00Senior Planner M 32Senior Plans Examiner A 87Senior Police Service Officer P 77.00Senior Street Maintenance Worker B 86.00Senior Traffic Service Assistant A 16Senior Tree Trimmer B 86.00Senior Wastewater Collections Operator B 86.00Senior Wastewater Environmental Specialist B 116.00Senior Wastewater Mechanic B 104.00Senior Wastewater Operator B 105.25Senior Water Distribution Operator B 80.00Senior Water Treatment Operator B 106.00Sex Registrant Specialist A 34Solid Waste Compliance Specialist B 94.00Solid Waste Equipment Operator II B 74.00Solid Waste Superintendent M 66Solid Waste Supervisor M 19Solid Waste Transfer Operator B 84.00Source Control Inspector II B 100.50Source Control Technician B 99.00Special Assistant to City Manager M 66Street Maintenance Worker I B 59.00Street Maintenance Worker II B 69.00Streets Manager M 44Student Trainee Flat Rate Supervising Building Inspector M 40Supervising Civil Engineer M 74Systems Administrator M 62Systems Analyst I M 29Systems Analyst II M 40Systems Analyst III M 51Technical Services Manager M 44Telecommunications Coordinator M 29Tire Repairer B 61Traffic Engineer M 59Traffic Safety Maintenance Worker B 69.00Traffic Service Assistant I A 13
Traffic Service Assistant II A 18Traffic Signal Repairer I B 79.00Traffic Signal Repairer II B 89.00Traffic Signal Technician B 112.00Transport Operator B 99.00Treasury Supervisor M 11Treatment Plant Electrician B 99.00Tree Trimmer I B 66.00Tree Trimmer II B 76.00Utility Services Manager M 88Victim Services Specialist A 59Wastewater Collections Operator I B 69.00Wastewater Collections Operator II B 79.00Wastewater Collections Supervisor M 14Wastewater Environmental Specialist B 111.00Wastewater Maintenance Manager M 32Wastewater Maintenance Supervisor M 19Wastewater Mechanic I B 89.00Wastewater Mechanic II B 99.00Wastewater Operations Manager M 32Wastewater Operations Supervisor M 19Wastewater Operator-In-Training B 67.00Wastewater Operator I B 82.00Wastewater Operator II B 92.00Wastewater Operator III B 97.00Water Conservation/Outreach Coordinator B 114.50Water Conservation/Outreach Technician B 59.00Water Distribution Operator I B 64.00Water Distribution Operator II B 74.00Water Programs Manager A 51Water Regulatory Compliance Coordinator B 114.50Water Regulatory Compliance Technician I B 94.00Water Regulatory Compliance Technician II B 104.00Water Resources Manager M 66Water Treatment Operator I B 86.00Water Treatment Operator II B 91.00Water Treatment Operator III B 96.00Word Processor I A 23Word Processor II A 30Word Processor III A 38Workers’ Compensation Specialist (C) C 69Workers’ Compensation Manager M 48

City of Oxnard, California
Resolutions
300
CITY COUNCIL OF THE CITY OF OXNARD
RESOLUTION NO.
A RESOLUTION OF THE CITY COUNCIL OF THE CITY OF OXNARD ESTABLISHING AN APPROPRIATION LIMIT FOR THE FISCAL YEAR 2011-2012
WHEREAS, Government Code section 7900 provides for the implementation of Article XIIIB of the California Constitution; and
WHEREAS, Government Code sections 7901 through 7914 provide that each year the City Council shall, by resolution, establish its proceeds of taxes appropriation limit at a regularly scheduled meeting; and
WHEREAS, all documentation used in the determination of the proceeds of taxes appropriation limit has been and will continue to be available to the public from the Chief Financial Officer of the City of Oxnard as required by law; and
WHEREAS, the proceeds of taxes appropriation limit for the fiscal year 2011-2012 is calculated by adjusting the “base year,” fiscal year 1978-79; and
WHEREAS, the four factors are: 1. change in the population of the County = 0.83% 2. change in the population of the City = 0.92% 3. change in the per capita income in California = 2.51% 4. change in nonresidential construction = -120.28%; and
WHEREAS, the formula provides that the City can use the greater of either factors 1 or 2, plus the greater of either factors 3 or 4; and
WHEREAS, the City’s fiscal year 2011-2012 appropriation limit for proceeds of taxes is determined to be $255,426,408 using factors 2 and 3;
NOW, THEREFORE, THE CITY COUNCIL OF THE CITY OF OXNARD resolves as follows:
The proceeds of taxes appropriation limit for the fiscal year 2011-2012 is established as $255,426,408 and the “proceeds of taxes” revenue subject to this limitation is $116,688,068, an amount well below the established limit. Documentation used in the determination of the proceeds of taxes appropriation limit is available to the public at the City of Oxnard Finance Department, 300 West Third Street, Oxnard, CA 93030.

City of Oxnard, California
Resolutions
301
Resolution No.Page 2
PASSED AND ADOPTED on this day of , 2011, by the following vote:
AYES:
NOES:
ABSENT:
Dr. Thomas E. Holden, Mayor ATTEST:
Daniel Martinez, City Clerk
APPROVED AS TO FORM:
Alan Holmberg, City Attorney

City of Oxnard, California
Resolutions
302
COMMUNITY DEVELOPMENT COMMISSION OF THE CITY OF OXNARD
RESOLUTION NO.
A RESOLUTION OF THE COMMUNITY DEVELOPMENT COMMISSION OF THE CITY OF OXNARD APPROVING THE COMMUNITY DEVELOPMENT COMMISSION’S OPERATING AND CAPITAL IMPROVEMENT BUDGET FOR FISCAL YEAR 2011-2012
WHEREAS, the Executive Secretary submitted for the consideration of the Community Development Commission of the City of Oxnard the proposed Operating and Capital Improvement Budgets for the fiscal year 2011-2012; and
WHEREAS, in accordance with law, a public hearing on this budget was duly scheduled, advertised and held and there was an opportunity for all persons to be heard and for their suggestions or objections to be carefully considered.
NOW, THEREFORE, THE COMMUNITY DEVELOPMENT COMMISSION OF THE CITY OF OXNARD HEREBY RESOLVES AS FOLLOWS:
1. Having reviewed the proposed Operating and Capital Improvement Budgets and the funds included therein for the period of July 1, 2011 through June 30, 2012, the Community Development Commission hereby adopts the budget and appropriations for fiscal year 2011-2012 summarized as follows:
FY 2011-2012 Budget Central City Revitalization Project Area $3,217,188R-108 Project Area 822,246Southwinds Project Area 975,869Ormond Beach Project Area 803,267HERO Project Area 22,153,88120% Set Aside Housing Fund 1,961,008CDC Administration Fund 2,058,293
Total Cost $31,991,752
2. Staff is directed to ensure that the final adopted budget document containing the Community Development Commission’s operating budget for fiscal year 2011-2012shall contain all revisions made by the Community Development Commission prior to final budget adoption.
3. Any unused appropriations at the end of fiscal year 2010-2011 in active Capital Improvement Projects are hereby reappropriated for continued use in the fiscal year 2011-2012 budget.
4. Remaining balances in approved grant programs at the end of fiscal year 2010-2011,except for balances reallocated as part of the budget process, are hereby reappropriated for continuing use in fiscal year 2011-2012 and all estimated revenues from such approved grants for fiscal year 2010-2011 that are not realized by year end are hereby authorized to be continued.

City of Oxnard, California
Resolutions
303
Resolution No.Page 2
5. The Commission has reviewed the amount of money budgeted for planning and general administrative activities associated with the development, improvement, and preservation of low- and moderate- income housing within the 20% Set Aside Housing Fund (“Administrative Expenses”) and determined that these Administrative Expenses are (a) proportionate to the total amount of money budgeted within the 20% Set Aside Fund and (b) necessary for the production, improvement, or preservation of low- and moderate-income housing within the Commission’s jurisdiction.
PASSED AND ADOPTED on this day of , 2011, by the following vote:
AYES:
NOES:
ABSENT:
Dr. Thomas E. Holden, Chairman
ATTEST:
Daniel Martinez, Secretary Designate
APPROVED AS TO FORM:
Alan Holmberg, General Counsel

City of Oxnard, California
Resolutions
304
HOUSING AUTHORITY OF THE CITY OF OXNARD
RESOLUTION NO.
A RESOLUTION OF THE HOUSING AUTHORITY OF THE CITY OF OXNARD APPROVING THE HOUSING AUTHORITY'S OPERATING AND CAPITAL IMPROVEMENT BUDGETS FOR FISCAL YEAR 2011-2012
WHEREAS, the Executive Secretary submitted for the consideration of the Housing Authority of the City of Oxnard a proposed Operating and Capital Improvement Budget for the City fiscal year 2011-2012; and
WHEREAS, in accordance with law, a public hearing on this budget was duly scheduled, advertised and held and there was an opportunity for all persons to be heard and for their suggestions or objections to be carefully considered.
NOW, THEREFORE, THE HOUSING AUTHORITY OF THE CITY OF OXNARD HEREBY RESOLVES AS FOLLOWS:
1. Having reviewed the proposed Operating and Capital Improvement Budget, and the funds included therein for the period of July 1, 2011 through June 30, 2012, the Housing Authority hereby adopts the budget and appropriations for fiscal year 2011-2012summarized as follows:
Programs FY 2011-2012 Budget Public Housing $ 6,870,257 Rental Assistance – Section 8 17,484,249 Total Cost $24,354,506
2. Staff is directed to ensure that the final adopted budget document containing the Housing Authority's operating budget for fiscal year 2011-2012 shall contain all revisions made by the Housing Authority prior to final budget adoption.
PASSED AND ADOPTED on this day of , 2011, by the following vote:
AYES:
NOES:
ABSENT:
Dr. Thomas E. Holden, Chairman ATTEST:
Daniel Martinez, Secretary Designate
APPROVED AS TO FORM:
Alan Holmberg, General Counsel

City of Oxnard, California
Resolutions
305
CITY COUNCIL OF THE CITY OF OXNARD
RESOLUTION NO.
A RESOLUTION OF THE CITY COUNCIL OF THE CITY OF OXNARD ESTABLISHING FINANCIAL MANAGEMENT POLICIES
WHEREAS, the City Council wishes to establish financial management policies to be followed in the development and implementation of the City budget.
NOW, THEREFORE, the City Council of the City of Oxnard hereby resolves that the following policies will guide the development and implementation of the City’s Operating and Capital Improvement Project Budgets.
I. BUDGET POLICIES
A. Budget Guidelines
1. The City Council will approve a multi-year revenue and expenditure forecast, which will provide parameters for the budget development process.
2. The budget process will include the development of a balanced two-year budget. The two-year budget will include an approach that City Council approves appropriations for a one-year operating budget and capital improvement plan.
3. The budget will be organized in a department/service level format.
4. The budget development process will include the identification and evaluation of policy options for service levels. However, the adopted budget will include only those policy options approved by City Council.
B. Appropriation Priorities
1. In evaluating the level of appropriations for department enhancements, or expense reductions, staff will apply the following principles in the priority order given:
a. Essential services that provide for the health and safety of residents.
b. Adequate ongoing maintenance of facilities and equipment.
c. All other services.
2. When reductions in personnel are necessary to reduce expenditures, to the greatest extent possible this will be accomplished through normal attrition.

City of Oxnard, California
Resolutions
306
Resolution No.Page 2
C. Supplemental Services
The City Council may budget for certain services that may also be provided by other governmental agencies or the private sector. The provision of these services will be based on a demonstrated community need or benefit over time. When appropriate, these services will be supported in whole or in part by user fees.
D. Appropriation Changes
1. Changes to the City Council adopted budget for the fiscal year shall occur as follows:
2. By City Council action for all changes that either increase or decrease fund appropriations adopted in the annual budget appropriation resolution.
3. By the City Manager for appropriation transfers between departments within a fund.
4. By the Department Director for appropriation transfers between programs, as long as funding is available in the department as a whole.
II. CAPITAL IMPROVEMENT PROGRAM POLICIES
A. Capital Planning Period
1. Staff will budget all capital improvements in accordance with an adopted Capital Improvement Project (CIP) Plan.
2. The City’s long-range capital planning period will be a minimum of five years, or longer where appropriate.
3. The Five-Year Capital Improvement Project Plan will be reviewed and approved by City Council every other year or as needed based on economic and funding outlooks. City Council will approve appropriations annually. Appropriation changes will be in accordance with Section I.D.
4. The CIP Plan will be in conformance with and support the City’s major planning documents: the most current General Plan, project specific plans, and Citywide master plans for related infrastructure improvements.
5. Staff will prepare strategic plans and master plans for major infrastructure and utility improvements with a 10- or 20-year planning horizon when appropriate.

City of Oxnard, California
Resolutions
307
Resolution No.Page 3
B. Capital Project Priorities
1. Staff will evaluate and prioritize each proposed capital project against the following criteria:
a. Linkage with community needs as identified in the City’s major planning documents.
b. Cost/benefit analysis identifying all financial and community impacts of the project.
c. Identification of available funding resources.
2. Staff will develop the CIP Plan with funding priorities in the following order:
a. Projects that maintain and preserve existing facilities.
b. Projects that replace existing facilities which no longer meet the needs of the community or that can no longer be maintained cost effectively.
c. Projects that provide new and expanded services to the community.
C. Capital Project Management
1. Capital projects will be managed in a phased approach. The project phases will become a framework for appropriate decision points and reporting. The phasing will consist of:
a. Conceptual/schematic proposal b. Preliminary design and cost estimate c. Engineering and final design d. Bid administration e. Acquisition/constructionf. Project closeout
2. Each capital improvement project will have a project manager who will prepare the project proposal, ensure that required phases are completed on schedule, authorize payment of expenditures approved as required by the City’s Purchasing Manual, ensure that all regulations and laws are observed, periodically report project status, track project expenditures and perform the project closeout according to current procedures.

City of Oxnard, California
Resolutions
308
Resolution No.Page 4
III. REVENUE POLICIES
A. Maintenance of Revenues
1. The City Council will attempt to maintain a diversified and stable revenue base to shelter the City from short-term fluctuations in any one revenue source.
2. The City Council will promote an increase in the City’s revenue base through economic development programs that maintain and enhance a vigorous local economy.
3. The City Council will seek to supplement the City’s revenue base through the identification of and application for State and federal grant funds, which will support identified needs.
B. User Fees and Rates
1. The City Council will attempt to recover the costs of services providing a private benefit to users through the imposition of user fees and charges.
2. The City Council will establish all user fees and charges at a level related to the direct and indirect costs of providing services and the degree of public versus private benefit.
3. Staff will recalculate annually the full costs of activities supported by user fees and rates to identify the impact of inflation and other cost increases.
4. The City Council will set fees and user rates for each enterprise fund (e.g., water, wastewater, solid waste) at a level that fully supports the total direct and indirect costs of the activity.
C. Revenue Collection
1. Staff will take all cost-effective actions available to collect revenues.
2. Staff will grant use fee waivers and debt forgiveness under the following conditions:
a. All requests will be approved or disapproved by the City Council on a case-by-case basis.
b. Each request will be considered and City Council action will be by resolution.
City of Oxnard, California
Resolutions
309
Resolution No.Page 5
c. All categorical fee waivers will be subject to a sunset provision as determined by the City Council.
3. Staff will not grant development and permit fee waivers.
D. Interest Earnings
1. Staff will assign interest earnings to the appropriate fund based on available cash balances.
2. Investment policies will be reviewed annually by the Investment Review Committee and the City Council.
IV. FUND BALANCE POLICIY
This Fund Balance Policy establishes the procedures for reporting unrestricted fund balance in the General Fund financial statements. Certain commitments and assignments of fund balance will help ensure that there will be adequate financial resources to protect the City against unforeseen circumstances and events such as revenue shortfalls and unanticipated expenditures. The policy also authorizes and directs the Chief Financial Officer to prepare financial reports which categorize fund balance inn accordance with Governmental Accounting Standards Board (GASB) Statement No. 54, Fund Balance Reporting and Governmental Fund Type Definitions.
A. Procedures
Fund balance is essentially the difference between the assets and liabilities reported in a governmental fund. There are five separate components of fund balance, each of which identifies the extent to which the City is bound to honor constraints on the specific purposes for which amounts can be spent.
Nonspendable fund balance Restricted fund balance Committed fund balance Assigned fund balance Unassigned fund balance
The first two components listed above are not addressed in this policy due to the nature of their restrictions. An example of nonspendable fund balance is a prepaid item. Restricted fund balance is either imposed by law or constrained by grantors, contributors, or laws or regulations of other governments. This policy is focused on financial reporting of unrestricted fund balance, or the last three componenets listed above. These three components are further defined below.

City of Oxnard, California
Resolutions
310
Resolution No.Page 6
B. Committed Fund Balance
The City Council, as the City’s highest level of decision-making authority, may commit fund balance for specific purposes pursuant to constraints imposed by formal actions taken, such as ordinance or resolution. These committed amounts cannot be used for any other purposes unless the City Council removes or changes the specified use by taking the same type of action it employed to commit those amounts. City Council action to commit fund balance should occur within the fiscal reporting period; however the amount can be determined in the subsequent period.
C. Assigned Fund Balance
1. Amounts that are constrained by the City’s intent to be used for specific purposes, but are neither restricted nor committed, should be reported as assigned fund balance.
2. This policy hereby designates the authority to assign amounts to be used for specific purposes to the Chief Financial Officer for the purpose of reporting these amounts in the annual financial statements.
D. Unassigned Fund Balance
These are residual positive net resources of the general fund in excess of what can be properly classified in one of the other four categories.
V. RESERVE POLICIES
A. Adequate reserves will be maintained for all known liabilities, including payable employee leave balances, workers’ compensation, and self-insured retention limits.
B. The City Council will endeavor to maintain an operating reserve equal to 18 percent of the General Fund operating budget. The operating reserve shall be available to: cover cash flow requirements; meet unanticipated revenue shortfalls; take advantage of unexpected opportunities; invest in projects with a rapid payback; ensure against physical or natural disasters; and provide interest earnings.
C. The City Council will endeavor to maintain operating reserves in the Water and Wastewater Utility Enterprise Funds equal to 25 percent of the operating budgets, and reserves in the Solid Waste Enterprise Fund equal to 9 percent of the operating budget.

City of Oxnard, California
Resolutions
311
Resolution No.Page 7
VI. DEBT POLICIES
A. Use of Debt
1. Any tax and revenue anticipation borrowing will be consistent with State and federal laws and regulations.
2. The City Council will review the issuance of long-term debt only for:
a. Construction and acquisition of land, capital improvements, or equipment when the useful life of the asset is equal to or greater than the term of the debt.
b. The creation of contractually-required reserves.
c. The payment of judicial awards or settlements or the establishment of actuarial reserves to pay such awards.
3. Debt financing will not be appropriate for current operating or maintenance expenses or for any recurring purposes.
B. Conditions of Use
1. The City Council will use long-term debt to finance a major equipment acquisition, a capital project, or reserve only if a cost/benefit analysis establishes that the financial and community benefits of the financing exceed the costs.
2. Benefits can include, but are not limited to, the following:
a. Present value benefit: The current cost plus the financing cost is less than the future cost of the project or acquisition.
b. Maintenance value benefit: The financing cost is less than the maintenance cost of deferring the project or acquisition.
c. Equity benefit: Financing provides a method of spreading the cost of a project or acquisition back to the users of the project or acquisition over time.
d. Community benefit: Debt financing of the project or acquisition enables the City Council to meet an immediate community need.
3. Debt financing will be used only when project revenues or other identified revenue sources are sufficient to service the debt.
4. The City Council by resolution will periodically establish industry standard bond debt ratios to assess maximum debt carrying capacity and will apply these ratios to each proposed debt.

City of Oxnard, California
Resolutions
312
Resolution No.Page 8
5. When the City obtains debt financing on behalf of or benefiting a third party (as with assessment districts) such debt will be issued in conformance with existing City Council priorities and policies without contingent liability of the City and with all costs of issuance and administration fully reimbursed by the third party.
C. Methods
1. Staff will retain the following contract advisors for the issuance of debt:
a. Bond Counsel - To be selected by RFP periodically.
b. Special Counsel - To be selected by RFP periodically to protect the City’s interest in complex negotiations and document review.
c. Financial Advisor - To be selected by RFP periodically to assist the City in assessing financing opportunities and options, selection of underwriters, preparation of all required financing documents, and other financial advisory assistance as required.
d. Underwriters - To be selected periodically by RFP for negotiated financings. For bond issues that are competitively bid, underwriter will be selected on the basis of lowest true interest cost (TIC).
2. The City Council’s preference is to issue fixed-rate long-term debt with level debt service, but variable rate debt or other debt service structure may be considered if an economic advantage is identified for a particular project.
3. Bond proceeds will be held by an independent bank acting as trustee or fiscal agent.
4. The City Council’s bond rating objective for the City for all debt issues is a Standard & Poor’s rating of AA. Credit enhancements will be used to achieve higher ratings when there is an economic benefit.
VII. ACCOUNTING POLICIES
A. Accounting Standards
1. The City’s accounting systems and procedures will comply with the Generally Accepted Accounting Principles (GAAP) and standards promulgated by the Financial Accounting Standards Board (FASB) and the Governmental Accounting Standards Board (GASB) to the extent necessary to achieve an unqualified audit opinion and adequate internal controls.

City of Oxnard, California
Resolutions
313
Resolution No.Page 9
2. The City will adopt the Historical Cost method of fixed asset reporting to comply with GASB and the capitalization policy will be $5,000 or more.
3. Staff will prepare regular monthly, quarterly, and annual financial reports to present a summary of financial performance and position.
4. Staff will provide full disclosure in the annual financial statements and bond representations.
5. The City’s budgetary system will be integrated and compatible with the accounting system.
B. Independent Auditor
1. The City will retain an independent certified auditing firm to annually conduct an audit of the financial records in accordance with all State and federal requirements.
2. The selection of the City’s audit firm will be by an RFP submitted to a limited number of qualified audit firms with recognized credentials in municipal auditing.
3. In order to promote continuity in the audit process, the engagement of the audit firm will be for a minimum period of three years. Such three-year engagement may be extended on an annual basis at the option of the City Manager.
VIII. RISK MANAGEMENT POLICIES
A. The City will maintain a risk management program for public liability, workers’ compensation, and loss of property exposures. This program will emphasize avoidance of risk, whenever possible, funding for losses which cannot be avoided, and transfer of risk to third parties whenever appropriate.
B. The risk management process will include the systematic and continuous identification of loss perils and exposures, the analysis of these perils and exposures in terms of frequency and severity probabilities, the application of sound risk control procedures and the financing of risk consistent with the City’s financial resources.
C. If the loss potential in dollars for a particular risk is substantial and cannot be absorbed within the City’s annual operating budget, the staff will develop and maintain a program of purchased insurance, funded self-insurance, or debt.
D. Staff will endeavor to promptly settle justified claims but will vigorously defend claims which are doubtful, frivolous, or unsupported.

City of Oxnard, California
Resolutions
314
Resolution No.Page 10
E. Staff will maintain separate self-insurance funds to identify and segregate the financial resources necessary to cover insurance premiums and self-insured retentions.
1. Revenues into the insurance funds will be generated by charges to operating programs allocated to reflect loss experience.
2. Resources will be established at the end of each year to fund liability for open claims, incurred but not reported claims, and a catastrophic loss reserve as periodically recommended by an independent actuarial consultant, or as authorized for GAAP.
F. To assist in the overall administration of the risk management program, the City Council will utilize the following consultants:
1. Claims adjuster for workers’ compensation and public liability/property damage.
2. Claims auditor, actuarial consultant, and risk management program auditor.
3. Insurance broker of record.
PASSED AND ADOPTED on this day of , 2011, by the following vote:
AYES:
NOES:
ABSENT:
Dr. Thomas E. Holden, Mayor
ATTEST:
Daniel Martinez, City Clerk
APPROVED AS TO FORM:
Alan Holmberg, City Attorney

Capital Improvement plan


City of Oxnard, California
Capital Improvement Plan
317
CAPITAL IMPROVEMENT PROGRAM
INTRODUCTION
The Capital Improvement Program (CIP) categorizes and lists the major public improvements to the City’s infrastructure over the next five budget cycles. In general, the CIP includes new projects and upgrades to existing facilities that cost more than $100,000. The CIP is prepared in conjunction with the two-year budget. Projects are compiled by each department in the City, submitted to the Budget Team for review before being presented as the Recommended CIP to City Council. Capital Improvement Projects to be funded by Measure ‘O’ half cent sales tax revenues will be presented to City Council separate from this Capital Improvement Program document.
The FY 2011-12 and 2012-13 CIP was built around the following components:
ADMINISTRATIVE AND POLICY FRAMEWORK FOR THE CIP PROCESS
A capital improvement project is defined as any major expenditure for capital assets of government with an estimated cost in excess of $100,000 and a useful life of five years or more such as:
Costs for acquisition of land or interests in land
Construction of buildings or other such structures including additions, major alterations or rehabilitation
Construction or reconstruction of streets or utility lines
Acquisition and/or installation of fixed equipment
Studies requiring the employment of outside professional consultants which are expected to result in the acquisition of capital items
Landscaping and design work relating directly to an individual project
As adopted by the City Council on June 11, 1991, Resolution No. 10,188 established three standards to be used in the development of the CIP budget, as follows:
1) The City will evaluate proposed capital projects against the following criteria:
Linkage with community needs as identified in the City’s major planning documents
Cost/benefit analysis identifying all economic or financial impacts of the project
Identification of available funding resources
2) The City will develop its capital improvement program with funding priorities in the following order:
Projects which maintain and preserve existing facilities
Projects which replace existing facilities which can no longer be maintained

318 City of Oxnard, California
Capital Improvement Plan
Projects which provide new and expanded services to the community
3) The City will prioritize projects based on a comprehensive cost/benefit analysis which identifies all financial impacts and community benefits.
REVENUES AVAILABLE FOR CAPITAL IMPROVEMENTS
The City of Oxnard finances its capital budget through a combination of local revenues, development mitigation fees, State and Federal grants, and Community Development Commission (redevelopment) funds.
FY 2011-12 FY 2012-13Grant Funds
CDBG Entitlement 2,012,457$ -$Total Grant Resources 2,012,457$ -$
Local FundsQuimby Fees & Interest 60,604$ -$Total Local Resources 60,604$ -$
Internal Service FundsInformation Systems 1,008,700$ -$Total Internal Service Fund Resources 1,008,700$ -$
Community Development Commission Funds 16,768,000$ -$
Total All CIP Funds 19,849,761$ -$

City of Oxnard, California
Capital Improvement Plan
319
Outlined below is a brief description of the various revenue sources used to finance CIP projects that are projected to be available to support FY 2011-12 and 2012-13 CIP projects.
A. GRANT FUNDS
1. Community Development Block Grant (CDBG)
As an entitlement community, the City of Oxnard receives Federal CDBG funds annually based on a formula involving population, unemployment, and median family income. CDBG funds may be used for the acquisition, construction, reconstruction, rehabilitation or installation of public improvements or facilities except for buildings for the general conduct of government. Projects must benefit low- and moderate-income residents, eliminate slums and blight, or meet an urgent need as defined by the Department of Housing and Urban Development (HUD).
B. LOCAL FUNDS
1. Quimby Fees & Interest
As a condition of approval of any residential subdivision map, developers must pay Quimby Fees. Fees collected from this source must be used to fund a neighborhood park or, if the neighborhood park was funded by other means, a community or City park that serves the residents of the subdivision from which the fees were collected. Interest is also earned on Quimby Fees on deposit throughout the year and may be used for the construction and acquisition of parks and recreation projects Citywide.
Quimby Fees and interest are only appropriated in the fiscal year following collection of these revenue sources. No revenue estimate is yet available for FY 2012-13 due to the uncertainty of development activity.
C. INTERNAL SERVICE FUNDS
1. Information Systems Internal Service Fund
The Information Systems Fund derives its revenues from charges for services it provides to departments of the City. This fund can accumulate funding for the purpose of investing in information technology capital projects
D. COMMUNITY DEVELOPMENT COMMISSION FUNDS
The Community Development Commission (“CDC”) uses four major sources of funds for its capital projects: (1) tax increment revenues generated within redevelopment project areas; (2) proceeds from tax allocation bonds, which are repaid with tax increment revenues; (3) proceeds from short-term loans from the City; and (4) miscellaneous operating income which includes interest income, rental income from CDC-owned property, payments on CDC rehabilitation loans, and payments due under development agreements.

320 City of Oxnard, California
Capital Improvement Plan
RECOMMENDED PROJECTS - FY 2011-12 and FY 2012-13
FY 2011-12 FY 2012-13GRANT FUNDS
CDBG Entitlement $2,012,457 $0Blackstock South Neighborhood ResurfacingCampus Park Remodel - Phase IILemonwood Park Improvements & Phase II
LOCAL FUNDS
Quimby Fund Fees $60,604 $0Oxnard Beach Park
INTERNAL SERVICE FUNDS
Information Systems Internal Service Fund $1,008,700 $0Data Center RenovationUpgrade Version of Microsoft Office
COMMUNITY DEVELOPMENT COMMISSION FUNDS
Community Development Commission Funds $16,768,000 $0Campus Park - Phase ICampus Park Remodel - Phase II
Total All CIP Projects $19,849,761 $0

City of Oxnard, California
Capital Improvement Plan
321
DESCRIPTION OF PROJECTS RECOMMENDED FOR FY 2011-12
GRANT FUNDS Community Development Block Grant (CDBG) Projects
Blackstock South Neighborhood Resurfacing
This project consists of the resurfacing of the Blackstock South Neighborhood. The project boundaries are La Canada Avenue, the Ventura County Watershed District Channel, Bard Road, and Saviers Road. The streets in this area have been identified in the City’s Pavement Maintenance System as having deteriorated to the point of needing repaving and/or reconstruction.
Campus Park Remodel - Phase II
The Campus Park Remodel - Phase II project includes remodeling of the interior, exterior, entry, restrooms, individual rooms, and east wings of the gymnasium, and improves landscaping.
Lemonwood Park Improvements & Phase II
This park project will result in design and installation of a security lighting system, improvement to the park irrigation system, construction of a walking path and covered barbeque shelter, and landscaping upgrades to Lemonwood Park. In addition, the project will incorporate ADA upgrades to the restroom building and playground facilities.
LOCAL FUNDS
Quimby Fees
Oxnard Beach Park
This project consists of an allocation of Quimby funds received in the Oxnard Shores Neighborhood that will provide for a future redesign of the walking path and additional security lighting within Oxnard Beach Park.
INTERNAL SERVICE FUNDS
Information Systems Internal Service Fund
Data Center Renovation
This project consists of the rehabilitation of the City’s existing data center. The main data center, located on the 2nd floor of the Administrative Annex building at 300 West Third Street, was built over 22 years ago to support 100 users. At that time, the City had just one single mainframe computer with related peripherals. There have been no data center improvements made since that time. This renovation will include new lighting and

322 City of Oxnard, California
Capital Improvement Plan
acoustics, expansion of the raised flooring, new fire suppression equipment, additional physical security, and complete re-cabling of the data center. This project will safeguard the integrity of the City’s networks and the investment already made to technology capital outlay projects.
Upgrade Version of Microsoft Office
Information Systems currently supports the Microsoft Office 2003 suite of software. This software was introduced in November 2003. The current version of Microsoft Office is Office 2010. Computer users are experiencing compatibility issues with documents created in the higher versions of Microsoft Office, which includes Word, Excel, Access, and PowerPoint. In addition, computers with 64 bit processors have incompatibilities with this version. Microsoft Office 2010, released in June 2010, will support a greater collaborative experience as mobile processing and productivity extends into smart phones, tablets, mobile devices, and the Web. In addition to the upgrade, City staff will need to be trained in usage of Microsoft Office 2010.
COMMUNITY DEVELOPMENT COMMISSION RESOURCES
Campus Park Phase I
This project consists of the development of Campus Park, including new soccer fields, baseball fields, utility upgrades, parking lot, a tot lot, and the addition of a snack bar and restrooms.
Campus Park Phase II
The Campus Park Phase II includes the addition of a skate park, basketball court, covered recreation area, snack bar, restroom, soccer/track complex, fitness area, parking lot and maintenance facility.
DESCRIPTION OF PROJECTS RECOMMENDED FOR FY 2012-13
Capital Improvement Projects are not proposed for Fiscal Year 2012-13 at this time due to: (1) uncertainty as to funding levels from various sources (e.g., CDBG funding, Quimby Fees), (2) significant levels of existing CIP projects in certain enterprise funds (e.g., Water and Wastewater), and (3) uncertainty as to timing/necessity of certain proposed CIP projects. CIP Projects for Fiscal Year 2012-13 will be presented for City Council approval during the adoption phase of the Fiscal Year 2012-13 budget.


