Transportation Enhancements Spending Report FY 1992 - FY 2010

National Renewable Energy Laboratory Innovation for Our Energy Future
A national laboratory of the U.S. Department of EnergyOffice of Energy Efficiency & Renewable Energy
NREL is operated by Midwest Research Institute ● Battelle Contract No. DE-AC36-99-GO10337
FY 2005 Final Report: Solar Radiometry and Metrology Task PVC57301 D.R. Myers, T.L. Stoffel, A.M. Andreas, S.M. Wilcox, I.M. Reda, M. Anderberg, P. Gotseff, and B.A. Kay National Renewable Energy Laboratory
A. Bowen School of Engineering and Computer Science Baylor University Waco, Texas
Technical Report NREL/TP-560-38917 November 2005

FY 2005 Final Report: Solar Radiometry and Metrology Task PVC57301 D.R. Myers, T.L. Stoffel, A.M. Andreas, S.M. Wilcox, I.M. Reda, M. Anderberg, P. Gotseff, and B.A. Kay National Renewable Energy Laboratory
A. Bowen School of Engineering and Computer Science Baylor University Waco, Texas
Prepared under Task No. PVC5.7301
Technical Report NREL/TP-560-38917 November 2005
National Renewable Energy Laboratory 1617 Cole Boulevard, Golden, Colorado 80401-3393 303-275-3000 • www.nrel.gov
Operated for the U.S. Department of Energy Office of Energy Efficiency and Renewable Energy by Midwest Research Institute • Battelle
Contract No. DE-AC36-99-GO10337

NOTICE
This report was prepared as an account of work sponsored by an agency of the United States government. Neither the United States government nor any agency thereof, nor any of their employees, makes any warranty, express or implied, or assumes any legal liability or responsibility for the accuracy, completeness, or usefulness of any information, apparatus, product, or process disclosed, or represents that its use would not infringe privately owned rights. Reference herein to any specific commercial product, process, or service by trade name, trademark, manufacturer, or otherwise does not necessarily constitute or imply its endorsement, recommendation, or favoring by the United States government or any agency thereof. The views and opinions of authors expressed herein do not necessarily state or reflect those of the United States government or any agency thereof.
Available electronically at http://www.osti.gov/bridge
Available for a processing fee to U.S. Department of Energy and its contractors, in paper, from:
U.S. Department of Energy Office of Scientific and Technical Information P.O. Box 62 Oak Ridge, TN 37831-0062 phone: 865.576.8401 fax: 865.576.5728 email: mailto:[email protected]
Available for sale to the public, in paper, from: U.S. Department of Commerce National Technical Information Service 5285 Port Royal Road Springfield, VA 22161 phone: 800.553.6847 fax: 703.605.6900 email: [email protected] online ordering: http://www.ntis.gov/ordering.htm
Printed on paper containing at least 50% wastepaper, including 20% postconsumer waste

Preface This report documents technical detail for work performed in the Solar Radiometry and Metrology Task PVC57301 in the period from October 1 2004 to September 30 2005. The Task has conducted improved broadband and spectral calibrations, measurements, and modeling activities supporting NREL’s Photovoltaic Systems Engineering Project, and Photovoltaic Measurements and Characterization Projects. Throughout the entire fiscal year, the task accomplished the following:
• Conducted intercomparison of absolute cavity radiometers to assure the stable maintenance of the World Radiometric Reference at NREL.
• Completed preparations for travel to the World Radiation Data Center, Davos, Switzerland, to transfer the World Radiometric Reference to NREL reference absolute cavity radiometers, in compliance with International Standards Organization ISO standard 17025 requirements for traceability of NREL's solar measurements.
• Calibrated nine spectroradiometer systems used to classify and characterize continuous and pulsed solar simulators for NREL and PV industry partners. These instruments were used to acquire and use data to correct for deviations from standard reporting condition reference spectra.
• Developed specifications for purchasing a new spectrometer to replace obsolete spectroradiometers used in Reference Photovoltaic Cell Calibrations
• Conducted detailed studies of thermal offsets in pyranometers and pyrheliometers; a significant source of measurement error in broadband radiometers measuring total hemispherical and direct beam solar radiation.
• Updated, revised, and submitted for consensus ballot three new standard methods for calibrating broadband solar radiometers for the American Society for Testing and Materials.
• Installed and tested new, more accurate data acquisition system upgrades for broadband radiometer calibrations and successfully integrated them into existing Radiometer Characterization and Calibrations software.
• Tested an indoor pyranometer calibration system and associated control and data acquisition software and compared results with outdoor calibration results.
• Improved the Solar Radiation Research Laboratory web-accessible data ensemble, permitting hourly summary data to be generated from any data collection station accessible through the site.
• Responded to a total of 225 (including 135 in the first half of FY 05) technical exchanges with photovoltaic industry, academic, other national laboratories, and individuals.
• Published nine peer reviewed and conference papers describing radiometer offset correction schemes, uncertainty issues in solar radiation measurements and modeling, and optical radiometry in renewable energy research.
iii
Acronyms AOP annual operating plan
ARM Atmospheric Radiation Measurement Program
ASTM American Society for Testing and Materials
BB blackbody
BMS baseline measurement system
BORCAL Broadband Outdoor Radiometer Calibration
BSRN baseline surface measurement network
DC direct current
DOE U.S. Department of Energy
EMI electromagnetic interference
EOS Earth Observing System
FSEC Florida Solar Energy Center
FY fiscal year
GUM guide to measurement uncertainty
HIPPS high intensity pulse solar simulator
ICS indoor calibration system
IPC international pyrheliometer comparisons
MIDC Measurements and Instrumentation Data Center
NASA National Aeronautics and Space Administration
NIST National Institute of Standards and Technology
nm nanometer
NOAA National Oceanic and Atmospheric Administration
NPC pyrleliometer comparison
NREL National Renewable Energy Laboratory
OL optronic laboratory
OMB Office of Management and Budget
OTF Outdoor Test Facility
PASS pulse analysis spectroadiometer system
PMOD Physical Meteorology Observatory, Davos
PV photovoltaic
RADCAL Radiometric Calibration and Characterization
iv

RH relative humidity
SI international system
SRBB Solar Radiation Research Branch
SRRL Solar Radiation Research Laboratory
SULI summer undergraduate laboratory intern
TSG Transfer Standard Group
V volt
WMO World Meteorological Organization
WRR World Radiometric Reference
WSG World Standard Group
v
vi
Contents
Preface................................................................................................................................ iii Acronyms........................................................................................................................... iv Contents ............................................................................................................................. vi List of Figures ................................................................................................................... vii List of Tables ................................................................................................................... viii 1.0 Introduction................................................................................................................... 1
1.1 Background and Objectives ...................................................................................... 2 1.2 Major FY 2005 Milestones and Deliverables ........................................................... 2
2.0 Spectroradiometric Calibrations and Measurements .................................................... 3 2.1 Spectroradiometer Upgrades and Improvements...................................................... 4 2.2 Spectroradiometer Calibrations ................................................................................ 5 2.3 Spectral Calibration Uncertainty Analysis................................................................ 7 2.4 Example Spectral Measurement Results................................................................... 9
2.4.1 NREL Simulator Measurements ........................................................................ 9 2.4.2 Simulator Measurements for PV Industry. ...................................................... 13
2.5 Updating NREL Spectroradiometer Systems ......................................................... 15 3.0 Broadband Calibrations and Research........................................................................ 16
3.1 WRR Traceability: NPC 2004 ................................................................................ 17 3.2 WRR Traceability, Participation in IPC X ............................................................. 18 3.3 Characterizing Solar Radiometer Uncertainty and Performance............................ 20
3.3.1 Introduction...................................................................................................... 20 3.3.2 Thermal Offsets in Thermopile Pyranometers................................................. 20 3.3.3 Other Spectral Errors ....................................................................................... 21 3.3.4 Longwave Responsivity of Shortwave Radiometers ...................................... 22 3.3.5 Geometric, Environmental, and Equipment Uncertainty................................. 23 3.3.6 Responsivity Functions.................................................................................... 25 3.3.7 Pyranometer Corrections from Field Data....................................................... 26 3.3.8 Pyrheliometer Studies ...................................................................................... 26 3.3.9 Revisions to ASTM Radiometer Calibration Standards .................................. 32
3.4 Upgrade of NREL Radiometer Calibration System................................................ 34 3.5 Evaluation of Indoor Calibration System (ICS) for Pyranometers......................... 36
4.0 Upgrades to the Measurement and Instrumentation Team Website ........................... 42 5.0 Solar Radiometric Metrology Interactions—Second Half of FY 2005 ...................... 44 6.0 Major Publications ...................................................................................................... 47 7.0 Conclusion .................................................................................................................. 48 8.0 References................................................................................................................... 49

vii
List of Figures Figure 2.1: Improved throughput of PASS spectroradiometer input optic, ratio of signal through new spectrolon sphere to old barium sulfate sphere.............................................. 5 Figure 2.2. Ratio (center line) of new to previous calibration showing changes in responsivity of the test spectrometer. Top and bottom envelopes are uncertainty limits for measured data. The difference at 1400 and 1900nm region is due to the 6% difference in relative humidity between calibrations (24% vs 30% for previous calibration)................. 6 Figure 2.3. AIM database entry for spectroradiometer calibrations. ASCII versions of calibration files and report documents are accessed though links at the bottom of the frame. .................................................................................................................................. 7 Figure 2.4. Flash simulator pulse shapes measured in FY 05. Right to left: Spheral Solar 13 ms (long flat top), Spheral Solar 0.25 ms, NREL Russian 1 to 42 sun, NREL HIPSS, Spire Model 460, Spire Model 350i, Spire Model 240, and Spire Model 660. For clarity, the pulse shapes have been shifted in time by 0, 1.5, 3, 5, 7.5, 8.5, 10.5, and 14 ms, respectively. ...................................................................................................................... 11 Figure 2.5 Spectral distribution measurements of NREL Spire 240A flash solar simulator from 2003 to 2005............................................................................................................. 11 Figure 2.6 NREL HIPSS normalized pulse shapes as a function of wavelength. Pulse shape variation shown to be minimal from 400 nm to 1400 nm. Noise in 1400 nm pulse is due to decreasing signal within the pulses at longer wavelengths................................... 12 Figure 2.7. Russian pulse solar simulator pulse shapes at various wavelengths. ............ 13 Figure 2.8. Russian pulse solar simulator spectral distribution at 1 and 45 suns ............. 13 Figure 2.9 Report and ISO17025 compliant calibration certificate for FSEC Spire 660 flash solar simulator. Such reports are generated for every simulator characterization provided by the task. ......................................................................................................... 14 Figure 2.10. “Long pulse” flash profile for Spire prototype flash simulator under development (left) and Spire 350i spectral distribution compared with ASTM G-173 standard spectrum. ............................................................................................................ 15 Figure 3.1 Pyrheliometers for measuring direct-normal solar radiation........................... 16 Figure 3.2 Pyranometer for measuring global-hemispherical radiation. .......................... 16 Figure 3.3 IPC meeting site, WRC/PMOD Davos, Switzerland, (left) and World Standard Group (WSG) of absolute cavity radiometers (including NREL TMI 67814)................. 19 Figure 3.4 Solar radiation measurement instruments and the components they measure. 20 Figure 3.5. Pyranometer responsivity versus solar zenith angle. Dotted lines are +4% and -4% away from mean Rs(45°). ......................................................................................... 25 Figure 3.6. Raw Rs varies daily and yearly due to variations in zenith angle throughout the day and year respectively (dark jagged curve). Fit of Rs function of cos(Z), cos(2 πD/365) shown as smooth gray curve. ............................................................................. 26 Figure 3.7 Pyrheliometer calibration data showing the variation in responsivity (ratio of signal to reference irradiance) throughout several days. Calibration factor may be computed several ways: average of all data, or average of data over selected interval or zenith angle range. ............................................................................................................ 27 Figure 3.8. Pyrheliometers in three shaded configurations for studying environmental influences on pyrheliometer offset errors. ........................................................................ 28

viii
Figure 3.9. Histograms of pyrheliometer zero offsets for measured (top left) shaded window pyrheliometer, and 5 models. Numbers is parenthesis are mean and standard deviation of the data sets, and the green double line is a normal distribution with the same mean and standard deviation............................................................................................. 29 Figure 3.10 Outdoor pyrheliometer wind speed test with high speed fan. ....................... 30 Figure 3.11. Response of unshaded pyrheliometer to increased air flow of 6 ms-1 to 7 ms-1 from nearby fan................................................................................................................. 31 Figure 3.12. One-minute (dotted line) and hourly average (X in box) difference in irradiance between two pyrheliometers, one ventilated at hourly intervals, the other undisturbed........................................................................................................................ 31 Figure 3.13 ASTM Ballot website screen image showing three standards revised under the leadership of this task.................................................................................................. 33 Figure 3.14 DataProof low thermal voltage scanner, which is the basis of the new RCC data collection system. Note low voltage bias of less than 1.0 microvolts....................... 34 Figure 3.15 New 100 channel custom NREL RCC high quality voltage measurement system configured for operational testing and control software development. ................ 35 Figure 3.16 Individual deviations in responsivity (in percent) between new and old data acquisition system results for NREL radiometer calibrations. Distribution of differences shown in histogram along right vertical axis. ................................................................... 36 Figure 3.17. The ICS with test and reference instruments installed on the turntable. ...... 37 Figure 3.18. Spectral distribution of natural sunlight and ICS lamp source..................... 40 Figure 4.1 Daily clear sky Langley (sunphotometer calibration) plots for narrow band channels of Atmospheric Optical Calibration System now available at Measurement and Instrumentation Data Center (MIDC) website. 500 nm channel shown for September 17, 2005................................................................................................................................... 43
List of Tables Table 1.1 Fiscal Year 2005 Annual Operating Plan Task Description............................... 1 Table 1.2. FY 2005 Task PVC57301 Milestones and Deliverables ................................... 3 Table 2.1. NREL Spectrometer Systems ............................................................................ 4 Table 2.2. NIST specified uncertainty in standards of spectral irradiance. ........................ 6 Table 2.3. Uncertainties for 95% confidence interval, spectroradiometer calibration ....... 8 Table 2.4 Solar Spectral Measurement Requests, FY 2005.............................................. 10 Table 3.1. Summary Results for NPC 2004 NREL Reference Cavity Radiometers. ...... 18 Table 3.2 History of NREL Participation in IPC Events. ................................................. 18 Table 3.3 Uncertainty for Pyranometer Responsivity 95% confidence interval ............. 24 Table 3.4. Uncertainty for Pyrehliometer Responsivities 95% confidence interval....... 27 Table 3.5. Model performance for five models estimating pyrheliometer zero offset voltage............................................................................................................................... 29 Table 3.6. Comparison of BORCAL responsivities to ICS PSP responsivities ............... 39 Table 3.7. Comparison of BORCAL and ICS Li-Cor responsivities * ............................ 39 Table 5.1 Industrial Academic, National an International Laboratory interactions ......... 44

1.0 Introduction The Solar Radiometry and Metrology Task is a component of the Photovoltaic Systems Engineering Project at the National Renewable Energy Laboratory (NREL) that provides traceable optical radiometric calibrations and measurements to photovoltaic (PV) researchers and the PV industry. The task is described in more detail in the fiscal midyear progress report [1] Table 1.1 shows the task description prepared for fiscal year 2005 Solar Program Annual operating Plan.
Table 1.1 Fiscal Year 2005 Annual Operating Plan Task Description
Task Title Organization Task Description FY 2005 Budget ($K)
Solar Radiometry & Metrology
NREL
This task provides world-class and traceable solar radiometric measurements, instrumentation, and metrology required by the PV Systems Engineering Project and other projects.
625
The task maintains reference standards, expertise, and capability for calibration (metrology) and optical radiation measurements supporting the needs of DOE and industry research and manufacturing groups. This capability includes nine spectroradiometer systems, periodically calibrated against National Institute of Standards and Technology (NIST) sources, and used to perform measurements of natural sunlight and solar simulators in compliance with the ISO 17025 [2] accreditation of NREL Secondary Solar Reference Cell Calibrations. The spectral distributions of continuous and pulsed solar simulators are used to compute PV performance with respect to standard reporting conditions. NREL broadband solar radiometers are calibrated to the World Radiometric Reference (WRR) through periodic (every five year) participation in World Meteorological Organization (WMO) International Pyrheliometer Comparisons (IPC) conducted at the WMO World Radiation Center at Davos, Switzerland [3] . Four NREL absolute cavity radiometers maintain the WRR at NREL, and are the reference for the calibration of about 300 broadband radiometers by the task per year. The NREL reference cavity radiometers will participate in the tenth IPC at Davos, Switzerland, in October, 2005. Task researchers calibrate ten spectral radiometers and more than 200 broadband radiometers every year. In addition, we characterize pyranometer and pyrheliometer thermal offset errors with laboratory and spectral modeling tools, investigate environmental effects upon pyrheliometers for measuring direct normal solar radiation, and measure detailed spectral distributions of the NREL and industry solar simulators. By participating in the American Society for Testing and Materials (ASTM), in accordance
1
with Office of Management and Budget (OMB) circular A-1191, we updated three standard methods for calibrating solar radiometers reflecting present state-of-the-art knowledge. Optical metrology functions have been integrated into the NREL quality system and audited for ISO 17025 compliance.
1.1 Background and Objectives The major activity and thrust of this project is the near-term and long-term performance monitoring, characterization, and modeling of emerging-technology, small (< 5 kWp), grid-connected, prototype systems installed and operating at NREL’s Outdoor Test Facility (OTF). Critical to this effort is a supporting task that provides world-class and traceable measurements and instrumentation for solar radiometry. The precision and accuracy of PV system (and module) performance measurements is determined by the quality, precision, and accuracy of the measurements of the incident (on the PV arrays) solar irradiance (i.e. “power in”). We support the development of industry-consensus/adopted codes and standards that address radiometric components in testing PV devices and systems. This project is integral to the Solar Energy Technologies Program Multi-year Technical Plan, and provides credible/independent data, analyses, and assessments of the performance and reliability metrics that are required to benchmark the candidate technologies and support the systems-driven-approach to R&D management. The next section summarizes the task deliverables described in the FY 2005 AOP for this task.
1.2 Major FY 2005 Milestones and Deliverables The major expected FY 2005 accomplishments of the task include:
• Continued world-class solar radiometric, and therefore PV system performance, measurements, and instrumentation
• Reporting research progress in technical reports and journal articles. Table 1.2 summarizes the deliverables described in the FY 2005 AOP. NREL Technical report NREL/TP-560-37594 reported on progress to March, 2005. The rest of this report describes key research and measurement accomplishments in the last six months of FY 2005 that support the above deliverables.
1 see http://www.whitehouse.gov/omb/circulars/a119/a119.html
2

Table 1.2. FY 2005 Task PVC57301 Milestones and Deliverables
Milestone or Deliverable Task No.
Due Date
Priority Level
Status
Complete mid-year and annual summary report of NIST traceable/ISO 17025 compliant optical calibrations of NREL and PV industry radiometers.
2 03/31/05
09/30/05 4
This Report
Complete proposed revised ASTM pyranometer calibration standards 2 03/31/05 5
Accomplished
1/15/05
Complete technical & logistical preparations for WMO International Pyrheliometer Comparison, Davos, Switzerland
2
08/31/05
5
Preparations complete and travel to Davos commenced on Sep 24, 2005
Select spectroradiometer and verify integration in PV Reference Cell calibration procedures.
2 08/31/05 4 Spectrometer selected and
order placed; awaiting delivery. See section 2.5
2. 0 Spectroradiometric Calibrations and Measurements Spectral distribution of the optical radiation used while testing PV devices either in the laboratory or outdoors is needed to properly correct test data to standard reporting conditions[4] , or assess observed variation in long term PV array and system performance. The Solar Radiometry and Metrology task manages a collection of spectroradiometer systems to assist NREL researchers and PV industry partners in identifying spectral issues with performance data. A subset of these instruments is used in calibrating secondary PV reference cells. Part of the ISO accreditation is the requirement for traceability of all calibrations and measurements to the International System (SI) of units. Table 2.1 lists the spectroradiometer systems, useful wavelength range, and main applications.
3
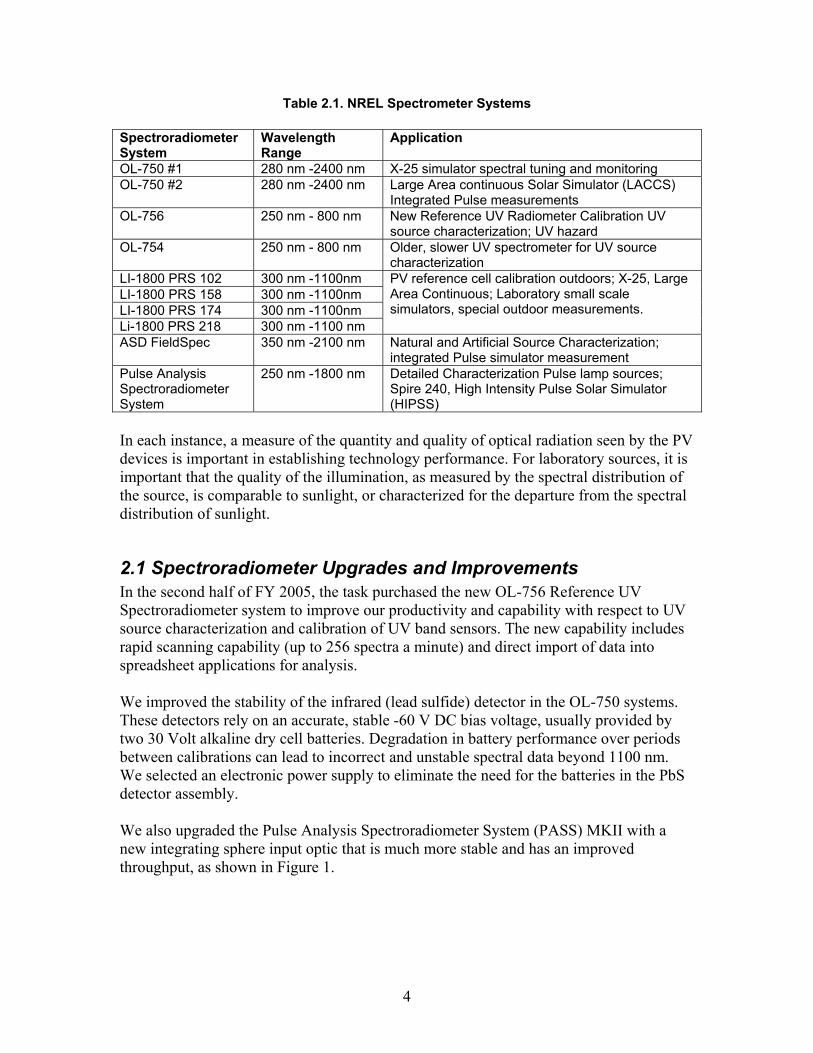
Table 2.1. NREL Spectrometer Systems Spectroradiometer System
Wavelength Range
Application
OL-750 #1 280 nm -2400 nm X-25 simulator spectral tuning and monitoring OL-750 #2 280 nm -2400 nm Large Area continuous Solar Simulator (LACCS)
Integrated Pulse measurements OL-756 250 nm - 800 nm New Reference UV Radiometer Calibration UV
source characterization; UV hazard OL-754 250 nm - 800 nm Older, slower UV spectrometer for UV source
characterization LI-1800 PRS 102 300 nm -1100nm LI-1800 PRS 158 300 nm -1100nm LI-1800 PRS 174 300 nm -1100nm Li-1800 PRS 218 300 nm -1100 nm
PV reference cell calibration outdoors; X-25, Large Area Continuous; Laboratory small scale simulators, special outdoor measurements.
ASD FieldSpec 350 nm -2100 nm Natural and Artificial Source Characterization; integrated Pulse simulator measurement
Pulse Analysis Spectroradiometer System
250 nm -1800 nm Detailed Characterization Pulse lamp sources; Spire 240, High Intensity Pulse Solar Simulator (HIPSS)
In each instance, a measure of the quantity and quality of optical radiation seen by the PV devices is important in establishing technology performance. For laboratory sources, it is important that the quality of the illumination, as measured by the spectral distribution of the source, is comparable to sunlight, or characterized for the departure from the spectral distribution of sunlight.
2.1 Spectroradiometer Upgrades and Improvements In the second half of FY 2005, the task purchased the new OL-756 Reference UV Spectroradiometer system to improve our productivity and capability with respect to UV source characterization and calibration of UV band sensors. The new capability includes rapid scanning capability (up to 256 spectra a minute) and direct import of data into spreadsheet applications for analysis. We improved the stability of the infrared (lead sulfide) detector in the OL-750 systems. These detectors rely on an accurate, stable -60 V DC bias voltage, usually provided by two 30 Volt alkaline dry cell batteries. Degradation in battery performance over periods between calibrations can lead to incorrect and unstable spectral data beyond 1100 nm. We selected an electronic power supply to eliminate the need for the batteries in the PbS detector assembly. We also upgraded the Pulse Analysis Spectroradiometer System (PASS) MKII with a new integrating sphere input optic that is much more stable and has an improved throughput, as shown in Figure 1.
4
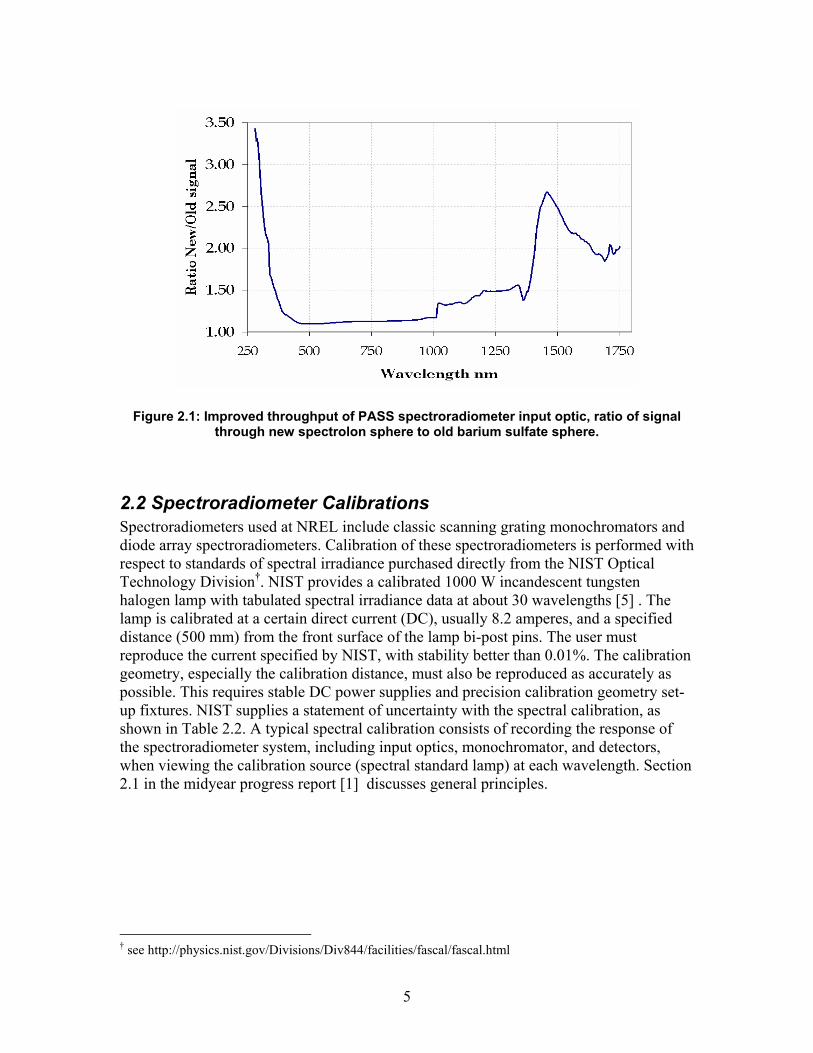
Figure 2.1: Improved throughput of PASS spectroradiometer input optic, ratio of signal through new spectrolon sphere to old barium sulfate sphere.
2.2 Spectroradiometer Calibrations Spectroradiometers used at NREL include classic scanning grating monochromators and diode array spectroradiometers. Calibration of these spectroradiometers is performed with respect to standards of spectral irradiance purchased directly from the NIST Optical Technology Division†. NIST provides a calibrated 1000 W incandescent tungsten halogen lamp with tabulated spectral irradiance data at about 30 wavelengths [5] . The lamp is calibrated at a certain direct current (DC), usually 8.2 amperes, and a specified distance (500 mm) from the front surface of the lamp bi-post pins. The user must reproduce the current specified by NIST, with stability better than 0.01%. The calibration geometry, especially the calibration distance, must also be reproduced as accurately as possible. This requires stable DC power supplies and precision calibration geometry set-up fixtures. NIST supplies a statement of uncertainty with the spectral calibration, as shown in Table 2.2. A typical spectral calibration consists of recording the response of the spectroradiometer system, including input optics, monochromator, and detectors, when viewing the calibration source (spectral standard lamp) at each wavelength. Section 2.1 in the midyear progress report [1] discusses general principles.
† see http://physics.nist.gov/Divisions/Div844/facilities/fascal/fascal.html
5

Table 2.2. NIST Specified Uncertainty in Standards of Spectral Irradiance.
Wavelength (nm) Typical Values (W/cm-3) Relative Expanded Uncertainty, k=2 (%)
250 0.2 1.8 350 7.0 1.1 655 170 0.9 900 215 1.1 1600 115 1.4 2400 40 4.4
Additional sources of uncertainty in the local laboratory calibrations, and in various measurement scenarios must be accounted for, as described in the next section. During the first (October) and second (March) quarter of FY 05, we calibrated nine of the ten spectroradiometer systems listed in Table 2.1. Calibration results, reports, and data are recorded in an electronic data base (Atmospheric Radiation Measurement [ARM] program Instrument Management system, or AIM) accessible at http://www.nrel.gov/aim/database.html. Each calibration consists of a wavelength check by measuring emission sources of known wavelength. After taking corrective action regarding wavelength test results that are out of tolerance, the spectroradiometer responsivity is generated using a NIST lamp. The same lamp is then measured as an unknown, to assure the calibration response was properly generated. Finally, the new calibration is compared with the last calibration to provide information on radiometer drift with time. Figure 2.2 shows the ratio of a new to old calibration.
Figure 2.2. Ratio (center line) of new to previous calibration showing changes in responsivity of the test spectrometer. Top and bottom envelopes are uncertainty limits for
measured data. The difference at 1400 and 1900nm region is due to the 6% difference in relative humidity between calibrations (24% vs 30% for previous calibration).
The final new calibration file and a calibration report are entered into the AIM database. The report is used to elucidate any special problems or issues with the spectroradiometer system. Figure 2.3 is an example AIM database record for one of the spectroradiometers used to monitor the Spectrolab X-25 solar simulator—the Large Area Continuous Solar Simulator, or outdoor data during PV reference cell calibrations.
6

Figure 2.3. AIM database entry for spectroradiometer calibrations. ASCII versions of
ll NREL spectrometers are calibrated at nearly the same time (within 1 week of each
ue
esides posting calibration results in the AIM database, new calibration files and reports
t
, we
),
2.3 Spectral Calibration Uncertainty Analysis ed, and is incomplete
e
calibration files and report documents are accessed though links at the bottom of the frame.
Aother) to prevent the possibility of differing times between calibrations becoming an isswhen the same source is measured by several spectrometers with disparate results. Bare posted on a secure internal NREL server for use by the PV Measurements Group for easy access to historical data and reports, in case questions arise during new measuremenactivities. Calibration intervals have been set at six-month intervals because changes such those shown in Figure 2.2 can be seen over this interval. Longer intervals between calibrations can result in greater drift and the need for larger corrections. In additionperformed research that shows that calibration files are sensitive to atmospheric water vapor (relative humidity, RH) in the laboratory (as indicated in the caption to Figure 2.2so we schedule calibrations at times (spring, fall) when the relative humidity in the NREL Optical Metrology Laboratory is consistent with the expected RH in measurement laboratories at NREL.
Each measurement only approximates the quantity being measurwithout a quantitative uncertainty. Every element of a measurement system contributeselements of uncertainty. Historically, uncertainty analysis treated sources of uncertainty in terms of “random” and “bias” types. Random sources of uncertainty were related to th
7

2...
2 )(Xii Xi
eRU ∑ ⋅∂=
and Measures is presently the accepted guide for measurement uncertainty[6, 7] . The GUM defines Type A uncertainty values as derived from statistical methods, and Typesources as evaluated by “other means”, such as scientific judgment, experience, specifications, comparisons, or calibration data. The GUM defines the concept of“standard uncertainty” for each uncertainty type, which is an estimate of an “equivalstandard deviation (of a specified distribution). The GUM replaces the historical factor of two with a “coverage factor”, k (dependent upon the known or assumed statistical distribution of uncertainties), and U
standard deviation or variance of measured data sets. Biases were estimates of deviations from a “true value.” Total uncertainty, U, was computed from: U2 = Σ (Bias)2 + Σ(2*Random)2. The factor of 2 in the random term was necessary to “inflate” the component to provide approximately a 95% confidence interval for the computed U.
random
he Guide to Measurement Uncertainty (GUM) of the International Bureau of Weights
B
a ent”
<20)
ally a
a t
s detailed in the midyear progress report [1] , in the first quarter of FY 05, we revisited
Table 2.3. Uncertainties for 95% Confidence Interval, Spectroradiometer Calibration
YPE A (Statistical) UNC (%) STD UNC (%)
T
2 = Σ (Type B) 2 + Σ (k* Type A)2. For small (nsamples from a normal distribution, k may be selected from the student’s t-distribution [8] U is the “Expanded Uncertainty”, and k is usually in the range of 2 to 3, for confidence intervals of 95% and 99%, respectively. When a result, R, is functiondependent upon several i=1,...,n variables, xi, the familiar propagation of error formul
is used. U is the uncertainty in the resultant, exi, and is the estimated ble xuncertainty in vari i, and ∂xiR is the partial derivative of the response R with respec
to variable xi, called the sensitivity function for variable xi. Aour calibration and measurement uncertainty analysis for the Optronic Laboratory OL-750 and OL-754 spectrometer systems, which are critical reference spectrometers, as shown in Table 2.3
T
OTAL UNCERT (%) STD UNCERT (%)
TYPE B UNC (%) STD UNC (%)
5
FFECTIVE DEG. OF FREEDOM >100
%
Distance (2/500 mm) 0.80 0.400 Wavelength Precision 0.01 0.005
%Power current (Irr dI/di )*0.20 0.200 NIST Lamp Precision 1.13 0.565 Detector Sig/Noise 1.0e-4 5.0e-5 Sig Detection Sys 1.00 0.500
Temp sensitivity 1.00 0.500 Observed Noise (% reading) 3.00 1.500 T Type A 3.600 1.808 Type B 2.001 1.015 COMBINED 4.154 2.077
NIST Transfer 1.82 0.910 Distance 0.8 0.400
Stray Light 1e-4 0.0000Lamp Alignment 0.10 0.050 Power Current *0.20 0.200 Shunt Bias 0.04 0.020
Wavelength 0.01 0.005 ECOVERAGE FACTOR (k) 2 CONFIDENCE INTERVAL 95
Y EXPANDED UNCERTAINT 4.147%
he test of the quality of an uncertainty analysis is that no measured values fall outside
Tthe expected range of uncertainty. Repeated measurements of several spectral irradiancestandard lamps using a spectroradiometer system calibrated using a single lamp, show the
8
actual range of measurement results are within the bounds computed in Table 2.3, as discussed in section 2.2 of the midyear progress report. Measurements conducted under different conditions, and of significantly different spectral distributions, will have differences in the uncertainty envelope related to differences between the calibration spectral distribution and the distribution being measured (the effect of slit scattering function), stability of the spectroradiometer system, differing environmental conditions, etc. which need to be evaluated and combined with the calibration uncertainty on a case by case basis.
2.4 Example Spectral Measurement Results Using the systems described above, we accomplished several measurements of note in the first half of FY 2005. These accomplishments were detailed in the midyear progress report (section 2.4). Table 2.4 is a comprehensive list of spectral measurements accomplished during FY 05. Figure 2.4 is a plot of the various flash simulator pulse shapes measured this fiscal year. Reading right to left, these are the Canadian custom 13 ms pulse simulator (long flat top), a Canadian 1/4 ms wide custom simulator, a Russian 5 ms wide variable intensity flash simulator, the NREL High Intensity Pulse Solar Simulator (HIPSS), Shell Solar Spire model 460, Spire Model 350i, NREL Spire 240A, and Florida Solar Energy Center (FSEC) Spire Model 660. For clarity, the pulse shapes have been shifted in time by 0, 1.5, 3, 5, 7.5, 8.5, 10.5, and 14 ms, respectively.
2.4.1 NREL Simulator Measurements Repeated measurements of the NREL SPIRE 240A flash solar simulator since 2003 are shown in Figure 2.5. Long term stability of individual lamps and consistency in the flash simulator spectrum when new lamps are installed are verified with these measurements.
9

Table 2.4 Solar Spectral Measurement Requests, FY 2005
Requestor/Date Simulator Measurement Objective Florida Solar Energy Center (FSEC) Coca, FL. Oct 2004
Spire 660 ASTM E-927 Classification
FSEC Oct 2004 VORTEK 10 kW Continuous
Spectral Distribution and ASTM E-927 Classification
NREL OTF Jan 2005 Russian Ioffe Physics Institute Pulse Solar Simulator
Pulse shape, spectral content, ASTM E-927 Classification (1 to 42 suns)
NREL OTF Feb 2005 Large Area Continuous (LACSS)
ASTM E-927 Classification before relamping
Shell Solar, Camarillo CA
Two Spire 240, Spire 460, Large Area Pulse Solar Simulator (LAPSS)
Comparative spectral distribution differences and ASTM E-927 Classification. Resolve mismatched PV module differences in performance
NREL OTF May 2005 LACSS ASTM E-927 Classification after re-lamping
NREL OTF Jun 2005 Atlas 260 Chamber UV Irradiance monitor calibration
NREL OTF Jun 2005 Atlas 1600 Chamber UV Irradiance monitor calibration
NREL OTF Aug 2005 SPIRE 240A ASTM E-927 Classification (Pulse) Establish consistency (new lamp)
NREL OTF Sep 2005 High Intensity Pulse Solar Simulator (HIPSS)
Characterize spectral distribution changes with respect to lamp flash voltage and inter-flash interval procedures (on going)
SPIRE Corp., Bedford MA Sep 2005
Two Production SPIRE 350i flash simulators
ASTM E-927 Classification; provide comparative data for Spire prototype spectrometer measurements.
10

Figure 2.4. Flash simulator pulse shapes measured in FY 05. Right to left: Spheral Solar 13
ms (long flat top), Spheral Solar 0.25 ms, NREL Russian 1 to 42 sun, NREL HIPSS, Spire Model 460, Spire Model 350i, Spire Model 240, and Spire Model 660. For clarity, the pulse
shapes have been shifted in time by 0, 1.5, 3, 5, 7.5, 8.5, 10.5, and 14 ms, respectively.
Figure 2.5 Spectral distribution measurements of NREL Spire 240A flash solar simulator from 2003 to 2005.
11
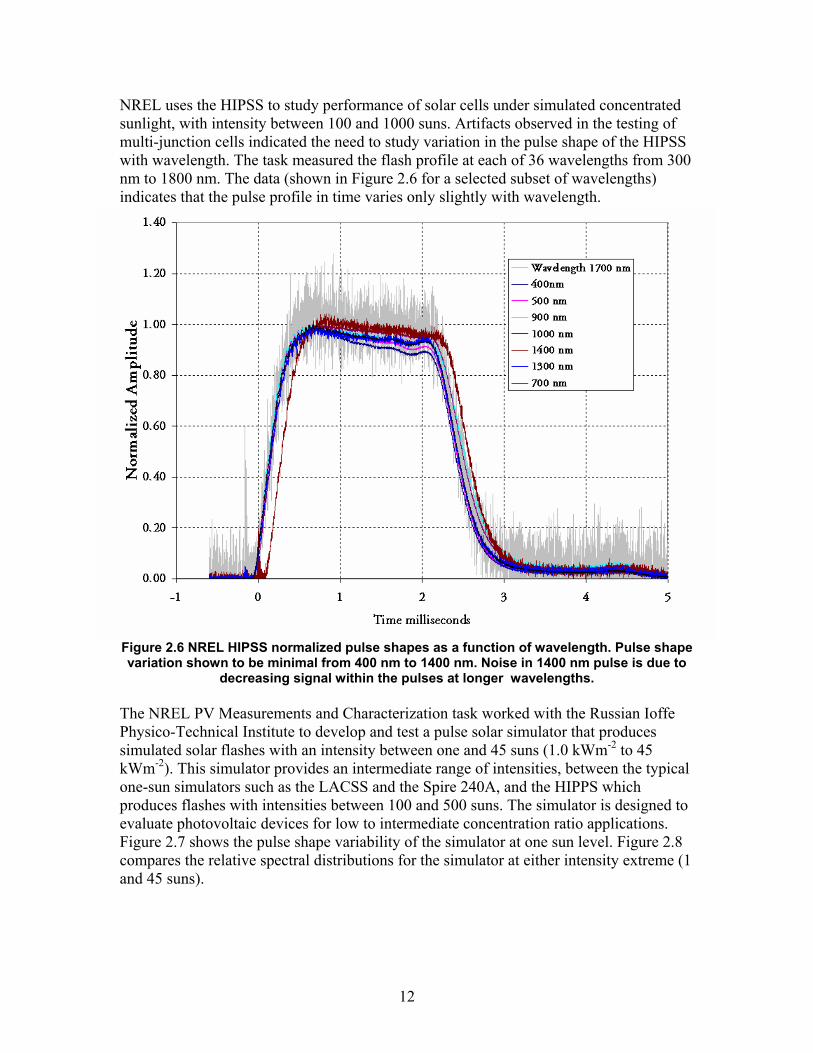
NREL uses the HIPSS to study performance of solar cells under simulated concentrated nlight, with intensity between 100 and 1000 suns. Artifacts observed in the testing of ulti-junction cells indicated the need to study variation in the pulse shape of the HIPSS ith wavelength. The task measured the flash profile at each of 36 wavelengths from 300 m to 1800 nm. The data (shown in Figure 2.6 for a selected subset of wavelengths) dicates that the pulse profile in time varies only slightly with wavelength.
Figure 2.6 NREL HIPSS normalized pulse shapes as a function of wavelength. Pulse shape variation shown to be minimal from 400 nm to 1400 nm. Noise in 1400 nm pulse is due to
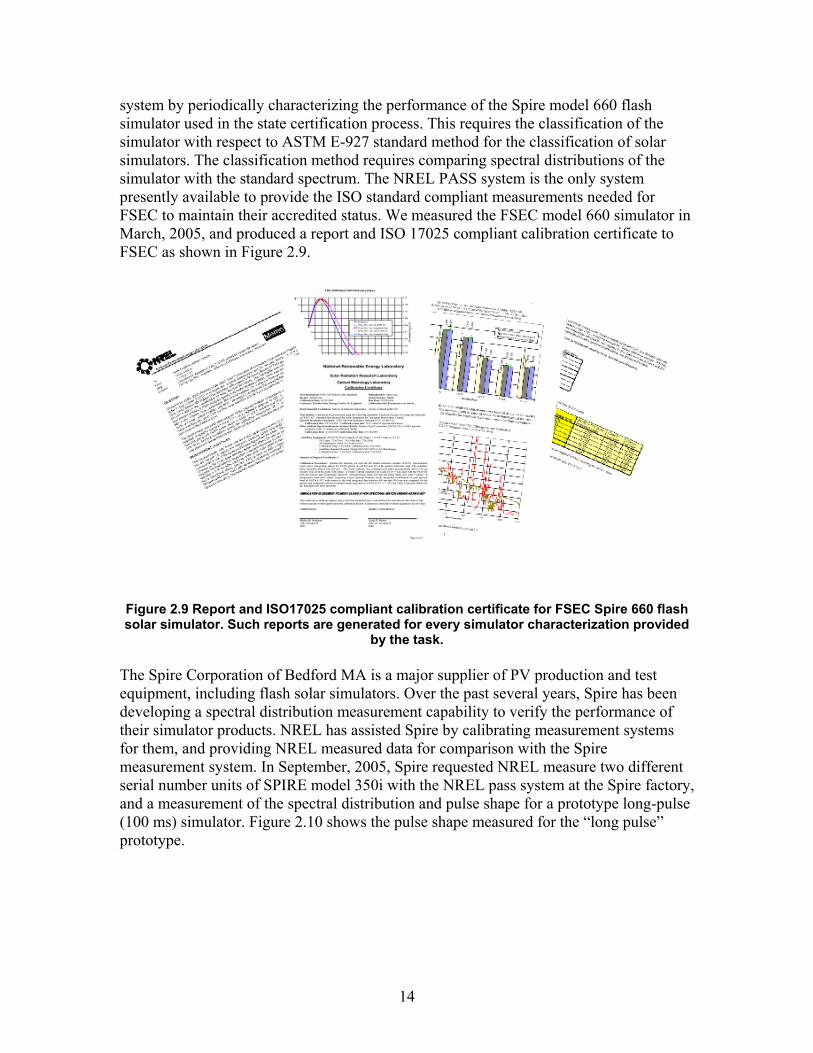
decreasing signal within the pulses at longer wavelengths. The NREL PV Measurements and Characterization task worked with the Russian Ioffe Physico-Technical Institute to develop and test a pulse solar simulator that produces simulated solar flashes with an intensity between one and 45 suns (1.0 kWm-2 to 45 kWm-2). This simulator provides an intermediate range of intensities, between the typical one-sun simulators such as the LACSS and the Spire 240A, and the HIPPS which produces flashes with intensities between 100 and 500 suns. The simulator is designed to evaluate photovoltaic devices for low to intermediate concentration ratio applications. Figure 2.7 shows the pulse shape variability of the simulator at one sun level. Figure 2.8 compares the relative spectral distributions for the simulator at either intensity extreme (1 and 45 suns).
sumwnin
12
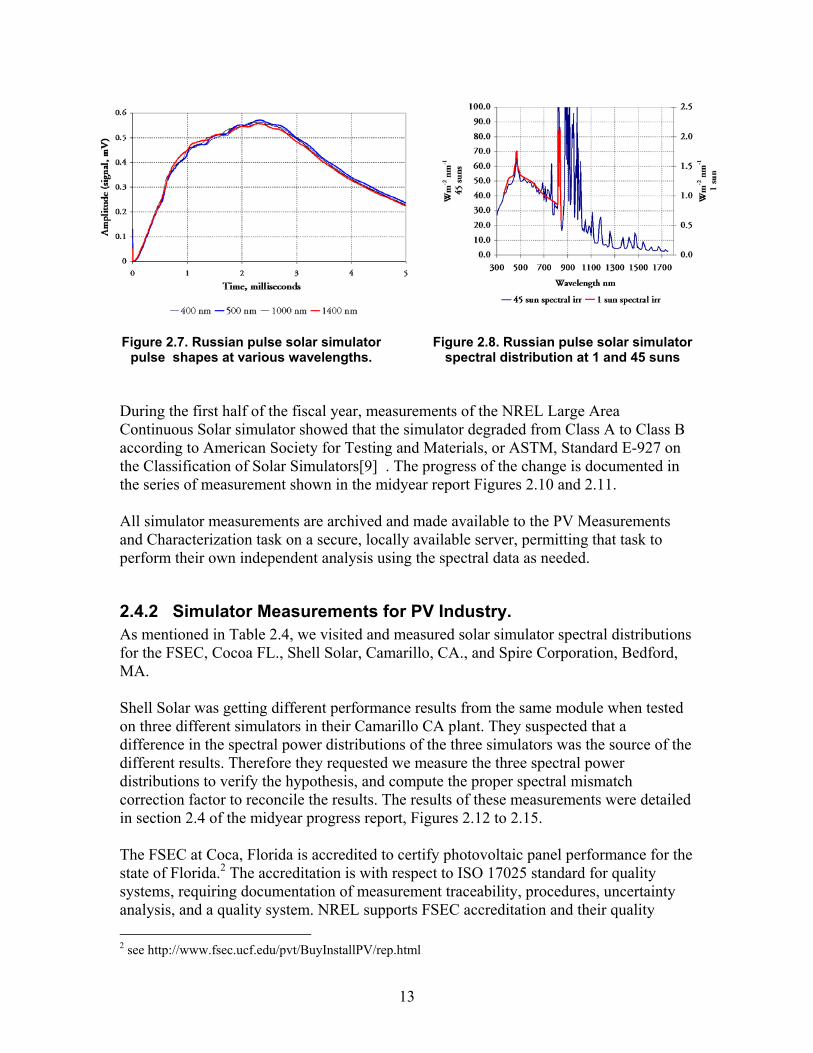
Figure 2.7. Russian pulse solar simulator
pulse shapes at various wavelengths. Figure 2.8. Russian pulse solar simulator
spectral distribution at 1 and 45 suns During the first half of the fiscal year, measurements of the NREL Large Area Continuous Solar simulator showed that the simulator degraded from Class A to Class B according to American Society for Testing and Materials, or ASTM, Standard E-927 on the Classification of Solar Simulators[9] . The progress of the change is documented in the series of measurement shown in the midyear report Figures 2.10 and 2.11. All simulator measurements are archived and made available to the PV Measurements and Characterization task on a secure, locally available server, permitting that task to erform their own independent analysis using the spectral data as needed. p
ions
verify the hypothesis, and compute the proper spectral mismatch orrection factor to reconcile the results. The results of these measurements were detailed section 2.4 of the midyear progress report, Figures 2.12 to 2.15.
The FSEC at Coca, Florida is accredited to certify photovoltaic panel performance for the state of Florida.2 The accreditation is with respect to ISO 17025 standard for quality systems, requiring documentation of measurement traceability, procedures, uncertainty analysis, and a quality system. NREL supports FSEC accreditation and their quality
2.4.2 Simulator Measurements for PV Industry. As mentioned in Table 2.4, we visited and measured solar simulator spectral distributfor the FSEC, Cocoa FL., Shell Solar, Camarillo, CA., and Spire Corporation, Bedford, MA. Shell Solar was getting different performance results from the same module when tested on three different simulators in their Camarillo CA plant. They suspected that a difference in the spectral power distributions of the three simulators was the source of the different results. Therefore they requested we measure the three spectral power istributions tod
cin
2 see http://www.fsec.ucf.edu/pvt/BuyInstallPV/rep.html
13
14
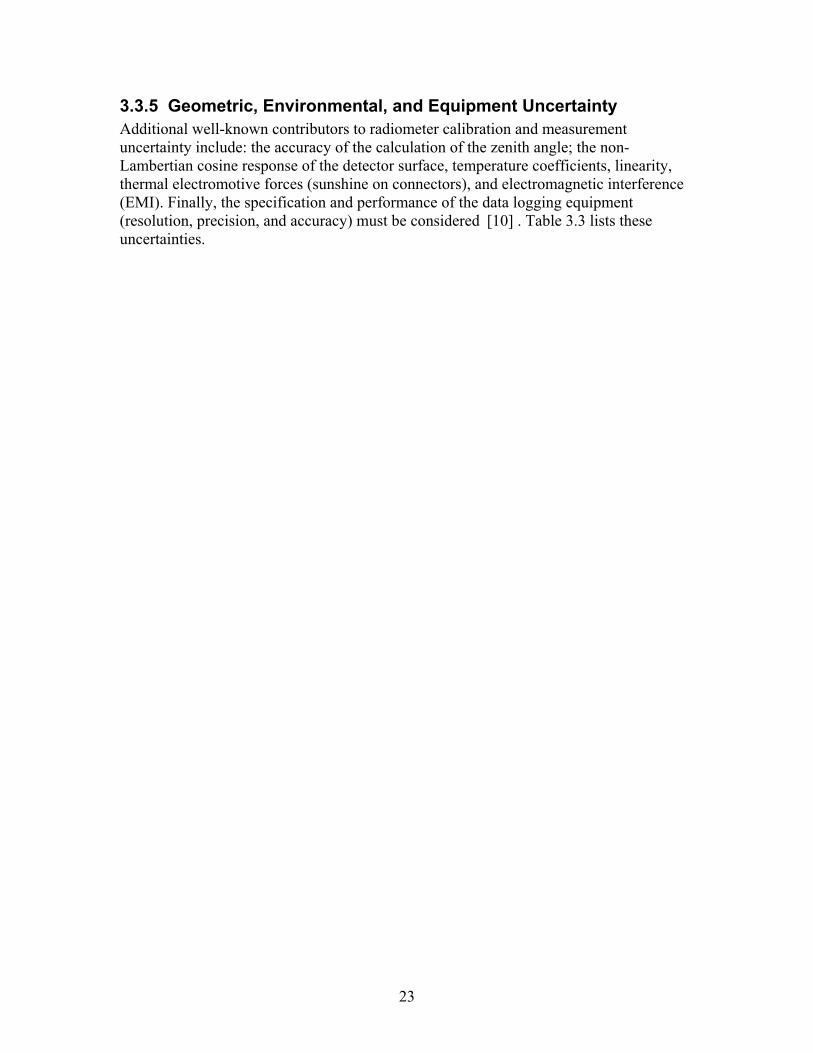
system by periodically characterizing the performance of the Spire model 660 flash simulator used in the state certification process. This requires the classification of the simulator with respect to ASTM E-927 standard method for the classification of solar simulators. The classification method requires comparing spectral distributions of the simulator with the standard spectrum. The NREL PASS system is the only system presently available to provide the ISO standard compliant measurements needed for FSEC to maintain their accredited status. We measured the FSEC model 660 simulator in March, 2005, and produced a report and ISO 17025 compliant calibration certificate to FSEC as shown in Figure 2.9.
Figure 2.9 Report and ISO17025 compliant calibration certificate for FSEC Spire 660 flash solar simulator. Such reports are generated for every simulator characterization provided
by the task. The Spire Corporation of Bedford MA is a major supplier of PV production and test equipment, including flash solar simulators. Over the past several years, Spire has been developing a spectral distribution measurement capability to verify the performance of their simulator products. NREL has assisted Spire by calibrating measurement systems for them, and providing NREL measured data for comparison with the Spire measurement system. In September, 2005, Spire requested NREL measure two different serial number units of SPIRE model 350i with the NREL pass system at the Spire factory, and a measurement of the spectral distribution and pulse shape for a prototype long-pulse (100 ms) simulator. Figure 2.10 shows the pulse shape measured for the “long pulse” prototype.

Figure 2.10. “Long pulse” flash profile for Spire prototype flash simulator under
development (left) and Spire 350i spectral distribution compared with ASTM G-173 standard spectrum.
For all of measurement cases above, it is important to note that while the classification of the simulator conveys a certain amount of information, knowledge of the actual measured spectral distribution can be used to mathematically translate the result of measurements under each source to standard reporting conditions. It is this critical spectral data information, above and beyond the classification, that permits the transformation to Standard Reporting Conditions to be accomplished.
2.5 Updating NREL Spectroradiometer Systems As described in the midyear progress report, the Li-Cor, Inc., LI-1800 spectroradiometer systems have been the workhorse spectral measurement systems at NREL for over 20 years. Recently, Li-Cor announced that they would no longer manufacture the systems, as certain electronic components were no longer available. Li-Cor also felt it was not cost-effective for their small company to invest in upgrading or re-designing this instrument, so Li-Cor removed it from their product line. As this instrument is tightly integrated into the PV Measurement Group process for calibration of primary and secondary PV reference cells, it is critical that a suitable replacement for the Li-1800 systems be found efore a major failure in one or any of the systems. Several diode array spectrometer
cated a system with milar bandpass options, and better
.
bsystems were evaluated and found to be unsatisfactory substitutes for the Li-1800.
flexibility, siFurther research looptical performance than the Li-1800 system. Extensive review of specifications and discussions with various suppliers of spectroradiometer systems lead to the selection of a classical scanning grating system candidate replacement from Instruments Systems, Inc. Model SP320 model 1143. A request for quote, and a purchase request for this unit as a capital equipment item were prepared, and the order for the unit placed in August, 2005In the coming fiscal year, the task will calibrate the unit and integrate it into the periodic calibration cycle for all NREL solar program spectrometers, under the ISO17025 compliant quality system in place for the PV Reference Cell and PV Reference Module scope of the NREL accreditation for these activities.
ttp://www.instrumentsystems.com/Products/spectro320.pdf 3 h
15

3.0 Broadband Calibrations and Research Evaluating photovoltaic (PV) cells, modules, arrays, and systems performance relies on accurately measuring the available solar radiation resources for conversion. Pyrheliometers (Figure 3.1) measure the shortwave (0.3 micrometer to 2.5 micrometer wavelength) solar radiation direct-beam radiation within a 5° field of view around the solar disk. Pyranometers (Figure 3.2) measure the total shortwave solar radiation, also called global or hemispherical solar radiation, in a hemispherical (2π steradian) field of vte
iew. Pyranometer measurements are used to characterize performance of flat-plate PV chn
coll
r RCAL
ve radiation calibrations and easurements
ologies, and pyrheliometer measurements are important for concentrating solar ector technologies.
Figure 3.1 Pyrheliometers for measuring
direct-normal solar radiation. Figure 3.2 Pyranometer for measuring
global-hemispherical radiation.. The ratio between the pyranometer output signal (measured in microvolts) and the intensity of the solar power flux (measured in watts per square meter) is known as the calibration factor. NREL's Measurements and Instrumentation Team developed Broadband Outdoor Radiometer Calibration (BORCAL) procedures to characterize and calibrate pyrheliometers and pyranometers. These procedures refined and improved ou
adiometric Calibration (RADCAL) techniques. The vehicle for implementing BORdata collection, reporting, and data archiving is our Radiometer Calibration and Characterization (RCC) software, developed by the Measurements and InstrumentationTeam [10-15] . Members of the Measurements and Instrumentation Team have worked with the U.S. Department of Energy (DOE) Atmospheric Radiation Measurement Program (ARM), National Aeronautics and Space Administration (NASA) Earth Observing System (EOS) Validation Program, World Meteorological Organization (WMO) Baseline Surface Measurement Network (BSRN), and National Oceanic and Atmospheric Administration (NOAA) Solar Radiation Research Branch (SRRB) to identify, characterize, and reduce ources of error and uncertainty in broadband shortwas
m
16

3.1 WRR Traceability: NPC 2004 As reported in the Midyear Progress report, we supported the NREL Pyrheliometer
ipating d
,
om the data collected over the period of the 2004 NPC and used to produce ISO-compliant calibration certif s for all participants. The writing of a final report fully documenting the NPC was in progress as of March 2005. The finaversion of the formal report will be posted on the Solar Radiation Research Laboratory overview website page when completed. A summary of the World Radiation Reference reduction factors derived for all participants is shown in Table 3.1 of the midyear progress report. Table 3.1 below summarizes the results for the NREL TSG and Reference cavity radiometers.
In short, the standard deviations of the mean WRR reduction factors for all participants (excepting AHF30494) were less than 0.08%, and the 95% confidence interval for the uncertainty in the transfer of WRR to parti equal to ±0.35% with r HF304
Comparison (NPC) September 23 - October 3, 2004 to confirm the stability of NREL reference radiometers for broadband calibrations, and transfer WRR to particradiometers, according to WMO protocols [16-18] . Individual instruments are compareto a transfer standard group (TSG) of absolute cavity radiometers that participated directly in IPCs, sponsored by the WMO. Twenty-seven cavity radiometers participatedincluding instruments for the FSEC, U.S. DOE ARM, NASA Langley Research Center, and NOAA. Pooled standard deviation of the TSG radiometers (with four from NREL) was 0.06%, confirming excellent stability of the NREL solar radiometric references.
Results were deduced fricate
l
cipants was less than orespect to SI units, with the exception of A 94 (at 0.46%).
17

Table 3.1. Summary Results for NPC 2004 NREL Reference Cavity Radiometers.
ce y
Cavity Serial WRR Transfer
Factor % Standard Deviation
Number of readings
95% confidenUncertaint
AHF28968* 0.99870 0.00 1180 0.32 AHF29220* 0.99865 0.03 1180 0.32 AHF30713* 0.99856 0.04 1180 0.32 TMI68018* 0.99830 0.06 1180 0.32 AHF23734° 0.99886 0.03 1169 0.33
ATMI68017^ 1.00043 0.07 618 0.35 ATM69036^ 1.00161 0.05 548 .034
* NPC 2004 NREL Transfer Standard Reference Group Participated in WMO IPC IX. ° NREL NCPV National Center for Photovoltaics Reference Cavity Radiometer Test & Measurements Group A NREL automated Technical Measurements Instruments radiometer check standards
3.2 WRR Traceability, Participation in IPC X In order to maintain traceability of NREL reference cavity radiometers to the WRR, we participate in the WMO International Pyrheliometer Comparisons, conducted everyears at the World Radiation Center (WRC) in Davos, Switzerland. Table 3.2 summarizes the IPC events NR
y 5
EL has participated in since 1980 (IPC V). After the 1985
Table 3.2 History of NREL Participation in IPC Events.
IPC Event NREL Reference Radiometer(s) Performance
IPC VI, the NREL TMI 67814 was put on permanent loan to WRC as a representative instrument for Technical Measurements Inc. manufacturer, and it became a member of the World Standard Group (WSG) of cavity radiometers defining the WRR scale.
IPC V 1980 TMI 67814 , TMI 68018 Std Dev 0.04%
IPC VI 1985 TMI 67814 Std Dev 0.09%
IPC VII 1990 TMI 68018, TMI69036, [TMI 67814]*
Mean Std. Dev. all NREL Instruments 0.095%
IPC VIII 1995 TMI68018, HF28968; HF29220, [TMI 67814]*
Mean Std dev all NREL instruments 0.10%
IPC IX 2000 HF 28968, HF 29220, HF 30713^ ,TMI 68018, [TMI 67814]*
Mean Std dev of all NREL Instruments 0.06%
* As of IPC VII, TMI 67814 on permanent loan to WRC as part of World Standard Group (WSG) of cavity radiometers constituting the definition of the World Radiometric Reference Scale
18

19
art of the task actarticipation and p 19, 2005 in a k contribu t of shipping d
travel expenses, in conjunction with an NRDOE ARM program, and the ogy Task. We prepTr s in August, 2005 fo ber-October 2005 travconducted an intercomparison of the cavity radiometers before packing them, and packed and shipped the radiometers a to Davos. Tancillary equipment, and measurem rived in Davos Sept begin participating in the he typicath teorologic ) where thare and the WSG g ometers emb
Figure 3.3 IPC meeting site, WRC/PMOD Davos, Switzerland, (left) and World Standard Group (WSG) of absolute cavity radiometers (including NREL TMI 67814) P ivities identified at the end of FY 05 was to obtain approval for
repare for IPC X, to be held September 29 to October pD vos. The tas tes approximately 1/3 of the cos instruments an
EL Technical Partnership aginternal NREL Metrol
reement with the ared Foreign
avel Request r the Septem el period,
nd ancillary equipment he radiometers, ember 27th, 2005 toents team ar
comparison. Figure 3.3 shows tal Obser (PMOD
l participation setup at e intercomparisons e Physical Me vatory, Davos
conducted, roup of reference radi odying the WRR.

3.3 Characterizing Solar Radiometer Uncertainty and Performance
3.3.1 Introduction
Figure 3.4 Solar radiation measurement instruments and the components they measure.
everal types of detectors are used for pyrheliometer and pyranometer instruments ce
ding
e of
d a
3.3.2 Thermal Offsets in Thermopile Pyranometers Responsivity (Rsd) of a diffuse-measuring reference pyranometer is derived in a shade-unshade calibration using Rsd = (U-S)/[B*Cos(z)], where U and S are the unshaded and shaded output voltages from the sensor, z is the zenith angle, and B is measured by an ACR (shown schematically in Figure 3.5. Procedures for this calibration are described in ASTM G-167 [20] . NREL developed shade-unshade pyranometer calibrations using an average responsivity at 45° zenith angle for three instrument azimuth angles to integrate over geometric response variations. This procedure was modified to include a continuously shaded, or control pyranometer, and reduce the azimuth rotation angles to 60°. One may then fit responsivities to the zenith angle, Rs(z), to compute six Rs(45°).
S(shown in Figure 3.4), including silicon cells and thermal detectors such as resistanthermometers and thermopiles. We conducted research leading to a revised understanof the sources of uncertainty in instruments based upon thermopiles, under quartz or Schott WG295 glass domes that transmit shortwave radiation from 295 nm to 2800 nm. We also conducted a year-long study of the influence of environmental conditions (temperature fluctuations, wind speed, irradiance fluctuations) on the performancnormal incidence pyrheliometers. We characterized the performance of an Indoor Calibration System (ICS) for pyranometer calibrations, and designed and integratenew data acquisition system for broadband outdoor radiometer calibrations into NREL. We incorporated new knowledge into revisions of the ASTM standard methods for calibrating solar radiometers, and submitted the revisions for ASTM Ballot action. [19, 20] .
20

The mean of these responsivities is used for the shaded pyranometer in thesummation calibration technique [13] .
component
n instrumentation in climate research, as in the World Climate characterized thermal “zero offsets” in
thermopile pyranometers with all-black sensors measuring diffuse radiation. Offsets produce negative engineering data at night, and clear sky diffuse irradiances lower than pure Rayliegh scattering theory predicts. The offsets occur as cold junctions of the thermopile are in a different thermal environment than the absorbing junctions.[14, 21-23] In section 3.2 of the midyear progress report, we reported experimental and model results that characterize the relationship of shortwave (less than 2800 nm in wavelength) solar radiometer responsivity to longwave (infrared radiation greater then 3000 nm, or 3 microns, in wavelength). We used the MODTRAN [24] atmospheric spectral radiative transfer code to compute shortwave and longwave (infrared, 3000 nm to 10000 nm) direct beam and sky (diffuse) radiation. The IR signal beyond 3000 nm is present in both the shaded and unshaded state of a pyranometer. The thermal exchange between the sky and sensor/domes cannot be the same for shaded and unshaded conditions. For black-a
ermal environment. These radiometers have lower (~1 to 2 W/m ) offsets and produce
0 nal.
n
RAN spectral model was used with varying total precipitable water vapor lobal total and diffuse
e r
Studies of solar radiatioChange Research Program BSRN and others
nd-white sensors, the reference and absorbing thermopile junctions are in a similar 2th
more accurate diffuse measurements.
3.3.3 Other Spectral Errors There is an additional spectral affect on the shade-unshade calibration in the diffuse. The diffuse sky radiation has very little energy in the shortwave region from 1000 nm to 2800nm, while the direct beam has significant energy in that region (see Figure 3.8). Therefore, nothing affecting the direct beam total irradiance between 1000 nm and 280nm, such as variations in atmospheric water vapor, affects the shaded pyranometer sigFor the several different direct normal irradiances, the same shaded signal is possible from the pyranometer. MODTRAN modeling of this “spectral mismatch” effect results ierrors of about 0.5% in Rs, for total precipitable water vapor varying from 0.5 atm-cm to3.5 atm-cm. The MODTover a reasonable range of 0.5 atm-cm to 3.5 atm-cm, to produce gspectra shown in Figure 3.8. The light areas between the global irradiance plots shows thdifference between the low and high water vapor conditions (dark gray=3.5 atm-cm watevapor and white=0.5 atm-cm water vapor filled curves). The changes in the diffuse spectral distribution (bottom white=3.5 atm-cm and gray=0.5 atm-cm filled curves) are minimal. For essentially the same diffuse radiation, varying water vapor content results inchanges of up to 0.5% in shaded-unshade responsivities for both all-black and black-and-white detector pyranometers with respect to the global reference spectrum. We also discussed previously the “spectral mismatch” error [25] resulting from differingsolar spectra under calibration and field measurement conditions. For a given reference
21

spectrum Eref (λ), reference spectral response Sref(λ), test spectrum Etest(λ), and device spectral response s(λ), the spectral mism
22
( ) ( )( ) ( ) ( ) ( )∫ ∫
∫∫∗⋅∗
∗⋅∗=
λλλλλλλλλλλλ
dsEdSEdSEdsE
Mrefreftest
refreftest
..)(.)(
(1)
atch factor resulting from the deviations of the st device response and the reference spectrum is given by:
or the pyranometer calibrations, at each condition (high and low values of water vapor),
ral
anometers with all-black sensors [14] ith respect to the NET-IR for
raight line fit is the BB responsivity of the
te
FEref is the global (unshaded) spectrum and Etest is the diffuse (shaded) spectrum. Low water vapor case produces an M of 1.002; while the high water vapor case produces an Mof 1.007; giving the relative difference of 100 *(1.007-1.002)/1.002 = 0.5%. If spectconditions deviate significantly from a chosen reference spectrum (say high altitude location with respect to a sea level location), the spectral error may become site-dependant.
3.3.4 Longwave Responsivity of Shortwave Radiometers Experiments conducted with an NREL blackbody (BB) source to characterize thermal “zero offset” signals in thermopile pyrdemonstrated that the radiometer output voltage is linear wall pyranometers. The slope of the stpyranometer, RSbb,
NET
TP
Cbb
TPBB W
VEE
VRs =
−= (2)
where: - VTP is the thermopile output voltage of the pyranometer, in microvolt
WNET is the NET-IR, in W/m2
t is e
e for ORCAL during FY 2006.
- - Ebb is the BB radiation, in W/m2 = σ * T 4
bb , where σ = 5.6697x10⁻⁸-8 Wm-2K-4, and Tbb is the BB temperature, in Kelvin
- Ec is the pyranometer case radiation, in W/m2 = σ * T 4 c , where Tc is the pyranometer
case temperature, in Kelvin. This temperature is measured by either a thermistor thafitted in the pyranometer case, or a thermistor inside the aluminum mounting plate for thpyranometer. These results will be incorporated into a revision of the NREL RCC softwarB
3.3.5 Geometric, Environmental, and Equipment Uncertainty Additional well-known contributors to radiometer calibration and measurement uncertainty include: the accuracy of the calculation of the zenith angle; the non-
ambertian cosine response of the detector therma
ormance of the dat logging equiesolution, precision, and accuracy) must be considered [10] . Table 3.3 lists these ncertainties.
L surface, temperature coefficients, linearity, l electromotive forces (sunshine on connectors), and electromagnetic interference
(EMI). Finally, the specification and perf(r
a pment
u
23

Table 3.3 Uncertainty for Pyranometer Responsivity, 95% Confidence Interv
al
TYPE A (Statistical) UNC(%) STD UNC (%) WRR Transfer *0.200 0.200 Cos(z) (2° Z bin) 0.010 0.005 Dif (2.5% D=>0.25% Ref.) 0.125 0.063 Temperature (2° Z bin) 0.100 0.050 Data Logger Precision 0.005 0.0025 ACR (wind, T) 0.025 0.013 Temp Chg (10° C) 0.250 0.125 Diff Offset B&W 0.125 0.063 UUT IR OFFSET 0.250 0.125 EMI/Thermal EMF 0.010 0.005 TOTAL UNCERT STD UNCERT TYPE A 0.455 0.286 TYPE B 0.910 0.872 COMBINED 1.017 0.918
C(%)TYPE B UNC(%) STD UN
Diff Offset B&W 0.125 0.063 UUT IR OFFSET *0.625 0.625 Spectral error *0.500 0.250 EMI/Thermal EMF 0.010 0.005 EFFECTIVE DEG. OF FREEDOM >100 COVERAGE FACTOR (k) 2 EXPANDED UNCERTAINTY 1.84%
Logger Bias (9 uV/10 mv) *0.090 0.090 WRR Std U95 *0.300 0.300 Cos(z) Z< 89 deg; 2° bin 0.010 0.005 Temperature (2° Z bin) 0.100 0.050 ACR Bias (M,wind, T) 0.025 0.013 Temp B (event to event) 10°C 0.250 0.125
24
3.3.6 Responsivity Functions
( )∑=
=•=
46
0/)(
i
i
iiPMAM zCosazRs
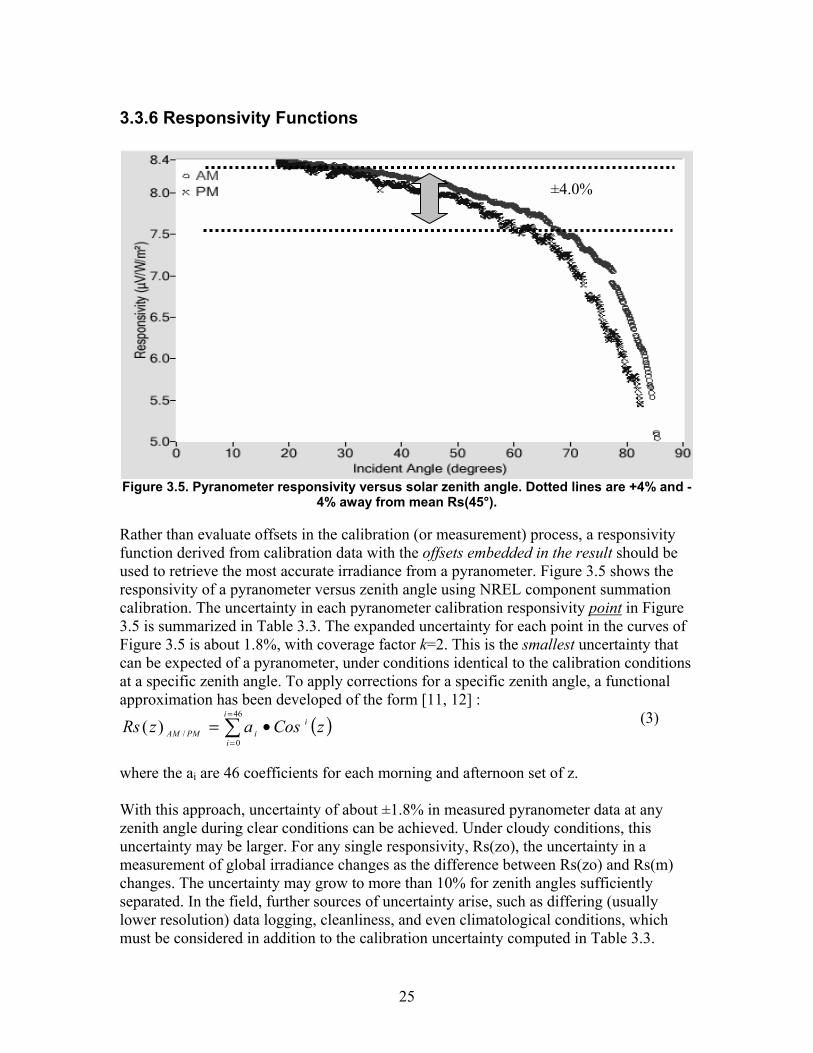
Figure 3.5. Pyranometer responsivity versus solar zenith angle. Dotted lines are +4% and -4% away from mean Rs(45°).
Rather than evaluate offsets in the calibration (or measurement) process, a responsivity function derived from calibration data with the offsets embedded in the result should be used to retrieve the most accurate irradiance from a pyranometer. Figure 3.5 shows the responsivity of a pyranometer versus zenith angle using NREL component summation calibration. The uncertainty in each pyranometer calibration responsivity point in Figure 3.5 is summarized in Table 3.3. The expanded uncertainty for each point in the curves of Figure 3.5 is about 1.8%, with coverage factor k=2. This is the smallest uncertainty that can be expected of a pyranometer, under conditions identical to the calibration conditions at a specific zenith angle. To apply corrections for a specific zenith angle, a functional approximation has been developed of the form [11, 12] :
(3)
where the ai are 46 coefficients for each morning and afternoon set of z. With this approach, uncertainty of about ±1.8% in measured pyranometer data at any zenith angle during clear conditions can be achieved. Under cloudy conditions, this uncertainty may be larger. For any single responsivity, Rs(zo), the uncertainty in a measurement of global irradiance changes as the difference between Rs(zo) and Rs(m) changes. The uncertainty m grow to more than 10% for zenith angles sufficiently separated. In the field, further sources of uncertainty arise, such as differing (usually lower resolution) data logging, cleanliness, and even climatological conditions, which must be considered in addition to the calibration uncertainty computed in Table 3.3.
ay
±4.0%
25
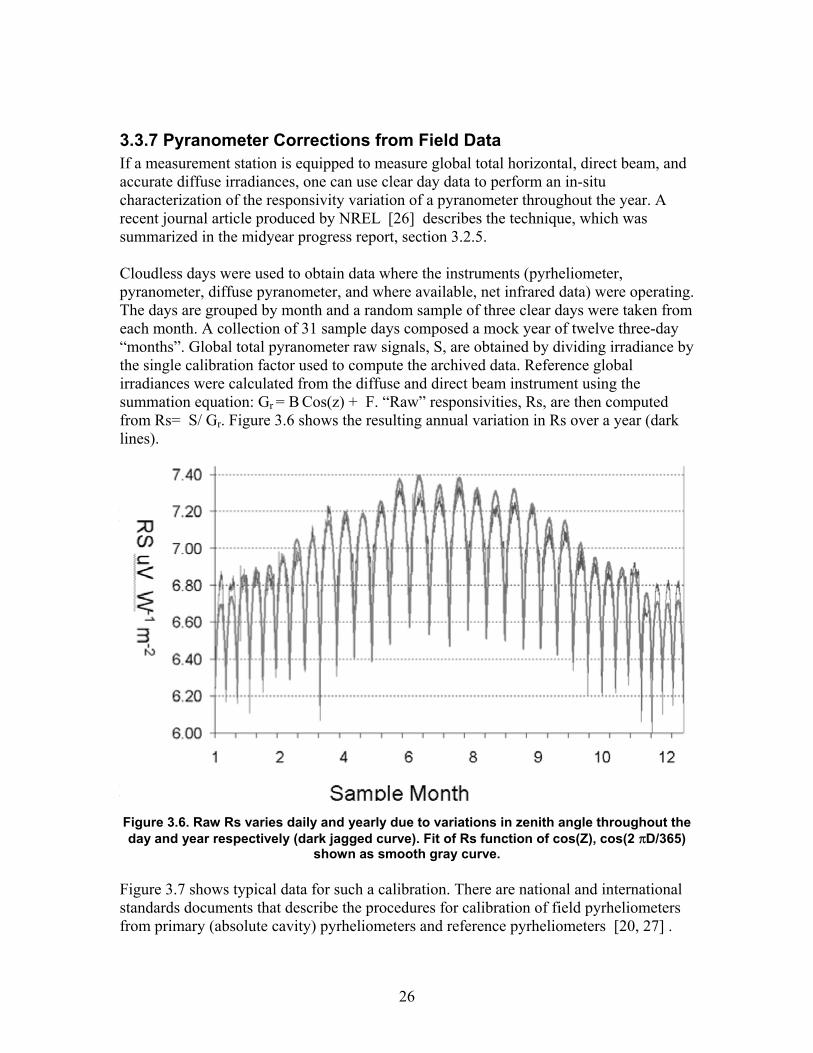
3.3.7 Pyranometer Corrections from Field Data If a measurement station is equipped to measure global total horizontal, direct beam, and accurate diffuse irradiances, one can use clear day data to perform an in-situ characterization of the responsivity variation of a pyranometer throughout the year. A recent journal article produced by NREL [26] describes the technique, which was summarized in the midyear progress report, section 3.2.5. Cloudless days were used to obtain data where the instruments (pyrheliometer, pyranometer, diffuse pyranometer, and where available, net infrared data) were operating. The days are grouped by month and a random sample of three clear days were taken from each month. A collection of 31 sample days composed a mock year of twelve three-day “months”. Global total pyranometer raw signals, S, are obtained by dividing irradiance by the single calibration factor used to compute the archived data. Reference global irradiances were calculated from the diffuse and direct beam instrument using the summation equation: Gr = B Cos(z) + F. “Raw” responsivities, Rs, are then computed from Rs= S/ Gr. Figure 3.6 shows the resulting annual variation in Rs over a year (dark lines).
yrgeometer, were used as reg function giving the
sets (night-time data ~ ±1.0 W m ), so some contributions to total , there are new contributions to unce ty: the pyrheliometers have windows for ontinuous outdoor operation, and the ACR has no window. This may lead to spectral
and yrheliometer must be pointed at the sun, so tracking errors may arise.
365)
nal s
Independent variables of cosine of the zenith angle, cos(Z), the cosine of the "day angle" of the year, DΘ = (Day number * 2*π)/365, and net-infrared, IR, measured with a
ression variables to produce apappropriate responsivity Rs(Z, DΘ, IR) for each data point through the year. The smoothgray curve in Figure 3.6 is such an Rs function. Using the Rs functions to compute irradiance values and comparing with the "old" single Rs irradiance and the reference irradiance showed that the error in original data (-30 W/m2 to 40 W/m2) is generally twoto three times the data calculated using the Rs function (-10 W/m2 to 20 W/m2).
3.3.8 Pyrheliometer Studies As pyrheliometer signals are compared directly with the ACR signals, there are no concerns with geometric response, or apparent thermal off
-2 uncertainty listed in Table 3.3 disappear. Howeverrtain
ceffects similar to those seen with respect to pyranometer domes. The ACRp
Figure 3.6. Raw Rs varies daily and yearly due to variations in zenith angle throughout the day and year respectively (dark jagged curve). Fit of Rs function of cos(Z), cos(2 πD/
shown as smooth gray curve.
Figure 3.7 shows typical data for such a calibration. There are national and internatiostandards documents that describe the procedures for calibration of field pyrheliometerfrom primary (absolute cavity) pyrheliometers and reference pyrheliometers [20, 27] .
26
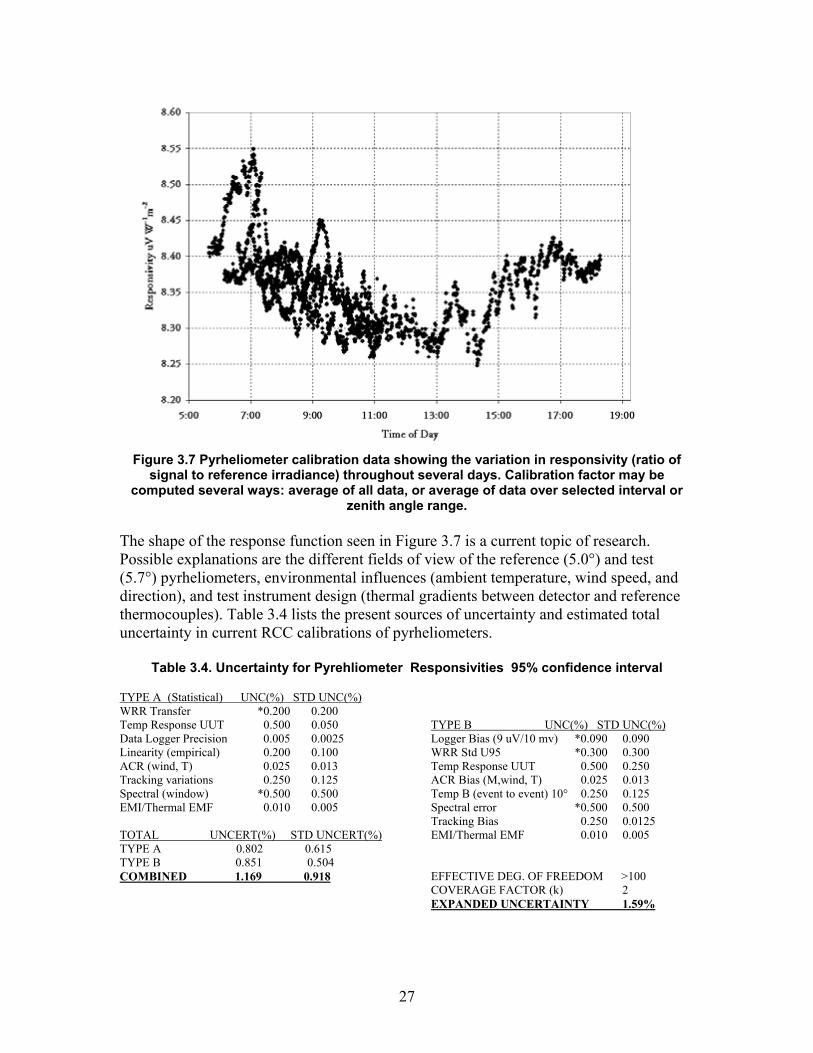
Figure 3.7 Pyrheliometer calibration data showing the variation in responsivity (ratio of
al or
otal uncertainty in current RCC calibrations of pyrheliometers.
signal to reference irradiance) throughout several days. Calibration factor may be computed several ways: average of all data, or average of data over selected interv
zenith angle range. The shape of the response function seen in Figure 3.7 is a current topic of research. Possible explanations are the different fields of view of the reference (5.0°) and test (5.7°) pyrheliometers, environmental influences (ambient temperature, wind speed, and direction), and test instrument design (thermal gradients between detector and reference hermocouples). Table 3.4 lists the present sources of uncertainty and estimated tt
Table 3.4. Uncertainty for Pyrehliometer Responsivities 95% confidence interval
TYPE A (Statistical) UNC(%) STD UNC(%) WRR Transfer *0.200 0.200 Temp Response UUT 0.500 0.050 Data Logger Precision 0.005 0.0025 Linearity (empirical) 0.200 0.100 ACR (wind, T) 0.025 0.013 Tracking variations 0.250 0.125 Spectral (window) *0.500 0.500
TYPE B UNC(%) STD UNC(%) Logger Bias (9 uV/10 mv) *0.090 0.090 WRR Std U95 *0.300 0.300 Temp Response UUT 0.500 0ACR Bias (M,wind, T) 0.025 0Temp B (event to event) 10°
.250
.013 0.250 0.125
Spectral error *0.500 0.500 EMI/Thermal EMF 0.010 0.005
TTracking Bias 0.250 0.0125 EMI/Thermal EMF 0.010 0.005
OTAL UNCERT(%) STD UNCERT(%)
0.802 0.615 .504
TYPE A TYPE B 0.851 0 COMBINED 1.169 0.918
EFFECTIVE DEG. OF FREEDOM >100 COVERAGE FACTOR (k) 2 EXPANDED UNCERTAINTY 1.59%
27

With deployment to the field, pyrheliometer data becomes subject to additional tracking and window (cleanliness) issues, differing data logger specifications, etc., requiring additional analysis specific to the deployment to arrive at a total measurement uncertainty.
Figure 3.8. Pyrheliometers in three shaded configurations for studying environmental
influences on pyrheliometer offset errors.
Osh setup where one pyrheliometer ha perture shaded (bottom left),
only
) were nve
to try and estimate the pyrheliometer zero drift (B), Wind speed, (W), andnutes ]. The
f Z vs e, (b) multilin a aytime , and
i wind/day loistograms below (Figure 3.9) are of the zero drift data for the six month period of the
for ls. Ththe me ured offset data (top left panel) are the mposit shows
e mean bias error for each model, indicating th s the best, in rms of mean bias error, by at least a factor of 1
ne investigation involves looking at pyrheliometers with different configurations of aded physical elements and recording the “dark” signals. Figure 3.8 is a photograph of
s only the window/aaanother has the entire front flange of the pyrheliometer shaded (right) and a third hasthe flange shaded, with an aperture to allow the direct beam to reach the receiver (topleft). As described in the midyear progress report, the “window only” shaded pyrheliometer has a considerably larger offset (5 microvolts to 20 microvolts) than the “flange+ window” shaded instrument (1 to 5 microvolts). Correlations of the window shaded only offset signals with environmental data (direct beam irradiance, B; rate of hange of ambient temperature per ten minute interval, ∆T; and wind speed, Wc
i stigated throughout FY 2005.
Five different models were constructed(Z) as a function of beam irradiance rate of change of temperature (DT or D 10 m/Dt) [f t= i models incl d (a) independent udeparametric fits o each variabl ear regression with and (c) without constant term, and (d) a 2-component – d / nighttime – multilinear regression(e) a 3-compone httim day hnt –nig e/ w wind regression del. The mohtest, and of the MODELED zero drift signal each of the mode e two best candidates to replicate the distribution of as“combined” model (top right) and the “co e” model (bottom right). Table 3.5 th e composite model performte 0.
28
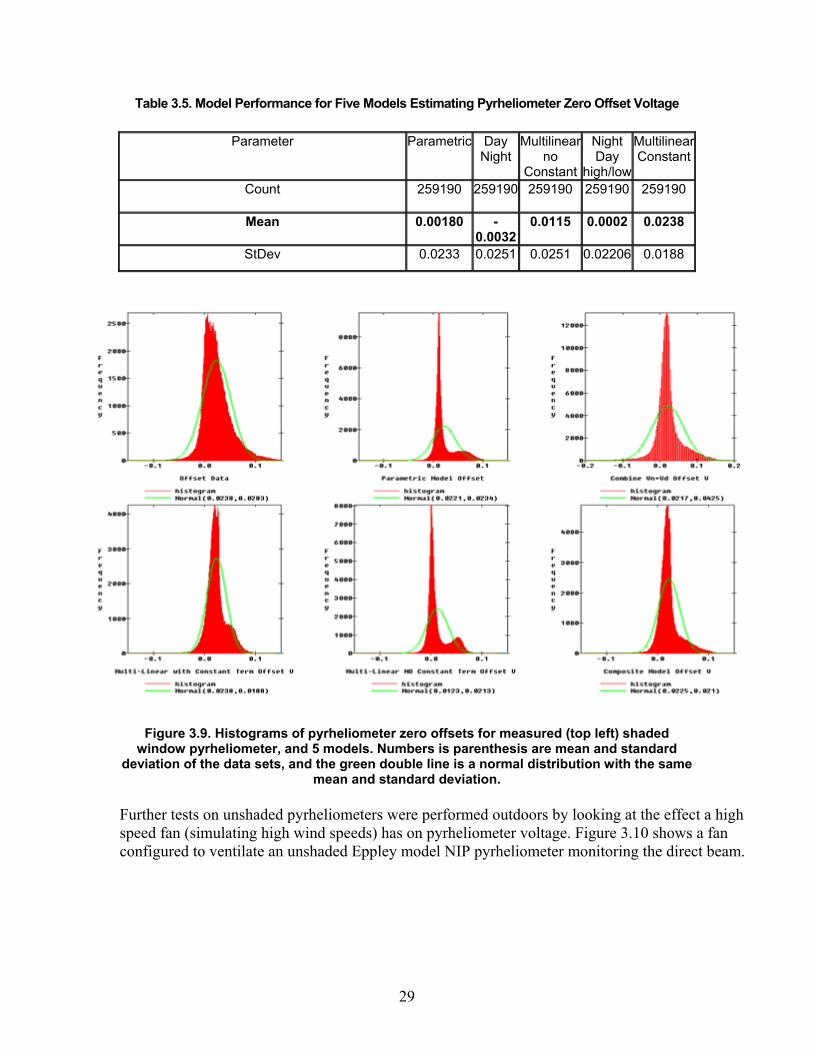
Table 3.5. Model Performance for Five Models Estimating Pyrheliometer Zero Offset Voltage
Parameter Parametric Day Multilinear Night
ded dard
me
fect a high shows a fan
t beam.
Night no Constant
Day high/low
MultilinearConstant
Figure 3.9. Histograms of pyrheliometer zero offsets for measured (top left) shawindow pyrheliometer, and 5 models. Numbers is parenthesis are mean and stan
deviation of the data sets, and the green double line is a normal distribution with the samean and standard deviation.
Further tests on unshaded pyrheliometers were performed outdoors by looking at the efspeed fan (simulating high wind speeds) has on pyrheliometer voltage. Figure 3.10configured to ventilate an unshaded Eppley model NIP pyrheliometer monitoring the direc
Count 259190 259190 259190 259190 259190
Mean 0.00180 -0.0032
0.0115 0.0002 0.0238
StDev 0.0233 0.0251 0.0251 0.02206 0.0188
29

D artering from the south east. Two other pyrheliometers were continuously monitoring the beam radiation as well. The fan was and off, and the . With the fan on, the air velocity in the neighborhood of the radiom s -1 orded as 1 minute averages of 3 second samples of the voltages. Figure 3.11 shows soon as the fan is tu r o , the o u tage is affected by being slightly reduced. A further test was conducted by intervals throughout a clear day. Two nearby p e ored the direct beam as well. The difference between the undisturbed and ventilated fan was computed, and hourly averages of the differences computed inute by minute and hourly comparison of the differences.
uring this clear day test, natural wind speeds were below 2 meters per second, (ms-1) qu
cycled on effect on the pyrheliometer v 6 to 7 m
oltages . Data
monitoredeter i were rec
that as rned on o ff pyrhelicycling a fan on and off at hourly
meter o tput vol
yrheliometers w re undisturbed, and monit
. Figure 3.12 shows the m
Figure 3.10 Outdoor pyrheliometer wind speed test with high speed fan.
30

Figure 3.11. Response of unshaded pyrheliometer to increased air flow of 6 ms-1 to 7 ms-1
from nearby fan.
Figure 3.12. One-minute (dotted line) and hourly average (X in box) difference in irradiance
between two pyrheliometers, one ventilated at hourly intervals, the other undisturbed.
31

32
A statistical analysis of the difference between the fan-on and fan-off hourly mean differences shows that the ventilation had a statistically significant effect on the ventilated pyrheliometer signal with a confidence level of 99.95%. [28] Further analysis, and a journal article summarizing our findings and their significance will be published in FY 06.
3.3.9 Revisions to ASTM Radiometer Calibration Standards As reported in the midyear progress report, the task participates in several consensus standards activities to support the PV industry in developing quality products with substantiated claims of performance. We provide technical expertise on radiometric measurements to ASTM committee E44 on Solar, Geothermal, and Alternative Energy Sources, G03 on Reliability and Durability, and the International Lighting Commission (CIE) Technical Committee TC-72 on Solar Spectral Distributions. As a result of the research findings discussed above, we proposed withdrawing two obsolete standards, and developed revisions to two ASTM Standards and presented them for committee review at the January 2005 meeting of committee G03. Since the midyear progress report, and additional standard was identified for revision and the revision completed.
he committee withdrew the two obsolete standards:
E913-82(1999) Standard Method for Calibration of Reference Pyranometers with
eeded to be submitted, along with the first draft revision of the third standard, by August
T
Axis Vertical by the Shading Method E941-83(1999) Standard Test Method for Calibration of Reference Pyranometers
with Axis Tilted by the Shading Method and the three standards selected for revision were::
G167-00 Standard Test Method for Calibration of a Pyranometer Using a Pyrheliometer
E816-95 Standard Test Method for Calibration of Pyrheliometers by Comparison
to Reference Pyrheliometers E824-94 Standard Test Method for Transfer of Calibration from Reference to
Field Radiometers. We accomplished the first draft revisions in time for ballot ASTM main committee before the June 24-26 2005 committee meeting in Pittsburg, PA. The result of the initial ballot on the first two revised standards were that 16 negative items and editorial comments were identified, and needed to be corrected; then the two balloted standards n8, 2005. Revisions to all three standards were accomplished, addressing the negatives and

comments identified for the first two standards. All three standards were submitted ballot on time, and were balloted between August 16 and September 16, 2005, asin Figure 3.13, as screen image of the ASTM ballot website.
for shown
be addressed and deemed persuasive or non-
The pro
integration over geometric response variations [13] A further
e mean of which is the calibration value for the reference diffuse
is
Wm-2).
Figure 3.13 ASTM Ballot website screen image showing three standards revised under the leadership of this task.
Any further negative vote on the ballot actions must
persuasive by the committee; after which time further revisions may be made, or the approved standards proceed to full committee ballot.
posed modifications to the ASTM standard shade-unshade pyranometer calibration determine an average responsivity at 45° zenith angle for three instrument azimuth angles. This results in
modification includes a continuously shaded, or control pyranometer, and 60° rotation angles. Regression fits of responsivities to zenith angle, Rs(z) determine six
alues of Rs (45°), thv(shaded pyranometer) for use in a component summation calibration. The Solar Radiometric and Metrology task has demonstrated that with the modified shade-unshade technique, clear sky diffuse irradiance can be measured with an uncertainty of ± (3% of reading + 1.0 Wm-2). For typical clear sky calibration conditions, the diffuse irradiance on the order of 10% of the total global hemispherical irradiance. This means that the uncertainty in the total global reference irradiance due to uncertainty in the diffuse reference irradiance is on the order of ± (0.3% of the total reference irradiance, + 0.3
33

Modifications to the ASTM pyrheliometer calibration standard removed the requiremento subtract “dark readings” for the pyrheliometers under test at the beginning and end of the calibration sequence. This is because of the demonstrated
t
unstable nature of the pyrheliometer offset described in the previous section. Improved uncertainty and precision and bias sections of all three standa ds were written based on inter-laboratory and intra-laboratory tests conducted at NREL and other laboratories, and over time within NREL (repeated calibrations of instruments). Revisions to the E824 standard on comparison techniques were primarily in the area of updated bias, precision, and uncertainty sections, as well as an improved bibliography of recent research in solar radiometer calibrations. Results of the committee ballot will be discussed at the January 2006 ASTM committee G03 meeting in Ft. Lauderdale, FL.
3.4 Upgrade of NREL Radiometer Calibration System One source of error in Tables 3.3 and 3.4 that could be reduced is the data logger bias of 9 microvolts. This is because the specifications of the data logger used in our RCC system for the past 5 years quote, and NREL has verified, this offset error. In addition, the old data logger (Fluke Helios) is obsolete—more than 7 years old—and no longer supported by John Fluke Co. To reduce this source of uncertainty and improve reliability and maintainability of our system, a DataProof low thermal voltage scanner, shown in Figure 3.14, was chosen. In the first half of FY 2005, we assembled a data logging system consisting of the low offset switches, high quality off-the-shelf voltage measuring systems, and NREL-designed computer controlled data acquisition. Figure 3.15 shows
data
r
the assembled RCC data acquisition system configured for testing.
Figure 3.14 DataProof low thermal voltage scanner, which is the basis of the new RCC
collection system. Note low voltage bias of less than 1.0 microvolts.
34

35
Figure 3.15 New 100 channel custom NREL RCC high quality voltage measurement systeconfigured for operational testing and control software development.
Initial tests show short circuit (zero) voltage bias errors of less than 1.0 microvolt for thnew system, which is a factor of 9 improvement over the older syste
m
e m. Further testing
as conducted to evaluate and select the best configuration and software algorithms for ollecting radiom upgraded to include this data gger as a selectable instrument for collecting the calibration data. During FY 2005 the st two NREL BORCAL events (BORCAL 2005-03 and BORCAL 2005-04, spectively) were conducted with the old (Fluke Helios) and new (DataProof) data
cquisition systems. The results from the two events were compared to evaluate any new iases appearing due to the new system configuration.
hirty instruments were common to the two BORCAL events, and the events were onducted within one week of each other to avoid biases introduced by changing nvironmental conditions and solar geometry. Figure 3.16 shows the percent deviation in sponsivity for the 30 instruments is less than 0.4%, and the average deviation was
.11%. Some of this deviation is due to different environmental conditions and solar eometry, however, and is comparable with the uncertainty in the reference irradiance erived from the absolute cavity radiometer) of 0.35%. Thus both systems result in
ssentially the same responsivity results. The improvement with the new system is that
0.1% to 0.0 dget. The resulting expanded uncertainty in each individual responsivity computation is reduced from 1.8% to 1.6%.
wc eter calibration data. RCC software was lolareab Tcere0g(dethe source of uncertainty in the data logger due to the zero offset bias is reduced from
1%, essentially removing this source of error from the uncertainty bu

Figure 3 ld data acquisition system results for NREL radiometer calibrations. Distribution of differences
, which is used to accurately
E
er
.16 Individual deviations in responsivity (in percent) between new and o
shown in histogram along right vertical axis.
3.5 Evaluation of Indoor Calibration System (ICS) for Pyranometers For the past two decades, the Solar Radiation Research Laboratory (SRRL) has beencalibrating radiometers for use in outdoor solar radiation measurements. Radiometers are calibrated using the NREL-developed BORCAL system. Calibration provides each instrument with an individual solar irradiance sensitivitymeasure solar energy with a traceability to world solar radiation standards. Recently, the SRRL obtained an ICS to provide a flexible alternative to BORCAL during incompatible weather conditions. The ICS was developed by Kipp and Zonen (K&Z), a solar and atmospheric science instrument manufacturer, for use with their radiometers. We developed a project for one of the co-authors, Amy Bowen of Baylor University, a DOSummer Undergraduate Laboratory Intern (SULI) to validate the system for calibration of other manufacturer’s radiometers. This section of the report is based on her final papdescribing the results of the project. Since SRRL calibrations from the BORCAL method are traceable to the WRR, the standard for meteorological radiation measurements, the ICS results must be compared with the BORCAL results to ensure that they meet theseinternational standards.
36

Eighteen radiometers populated the study instrument group: one pyrgeometer and 17 pyranometers. Of the pyranometers, there were ten Eppley Precision Spectral Pyranometers (PSP) and seven Licor Li200s. From this group, a total of five reference instruments were employed, three for the Eppley instrument group and two for the Licor instrument group. For both instrument groupings, one reference was chosen at random and, after analyzing preliminary results, a second instrument was selected that most closely matched the average percent difference between the BORCAL and ICS results at a 45-degree zenith angle. An additional PSP reference instrument was chosen after we recognized a bias in the initial selection. The final chosen reference instruments were PSP 18078F3 and Li200 PY28258.
Figure 3.17. The ICS with test and reference instruments installed on the turntable.
The ICS consists of a light source, a turntable for the instrument mounts, a shading mechanism, a voltmeter, and a voltage stabilizer, all of which are mounted on a worktable (Figure 3.17). The light source is mounted on a post attached to the back and center of the table. The turntable rests on the table directly below the lamp. A rotating arm supports the shading mechanism, which consists of a black cloth cylinder draped from a solid, circular ceiling. At the base of the turntable is a switch for toggling the voltmeter connection between threference and test instruments. Since the original instrument mount was designed for Kipp and Zonen pyranom
e
eters, two new mounts were made to accommodate the Eppley nd Licor instruments.
a
37
Interactive software was developed using the LabWindows integrated development environment, to aid the user in the ICS data acquisition process. The program promuser through the procedure, indicating when to shade, un-shade, rotate the instruments, and flip the voltmeter switch. The user is required to register each reference instrument by entering its information; the reference can then be selected from a pull-down menu opre configured reference instruments. The data are displayed in a table as measurements are gathered from the voltmeter. At the end of the procedure, the software displays the test instrument’s sensitivity, the lamp stability, and presents the user with a file saving option.
pts the
f
The testing procedure for one instrument takes approximately seven minutes. First the instruments are placed on the turntable mount and are shaded for two minutes while they stabilize. Next, the instruments are unveiled for a period of one minute before a voltage reading is taken from both. Again, the instruments are shaded, this time for a period of one minute before a voltage reading is taken. This is the “zero” reading for the first position (it is subtracted from the illuminated voltage reading to account for biases). Then the instrument mount is rotated 180° to the second position and the shade, un-shade procedure is repeated. The sensitivity of the test instrument is computed from the collected voltages and the known sensitivity of the reference instrument. The lamp stability is also computed from the collected voltages, with more than a 0.5% difference between the two positions considered unacceptable. If the lamp stability is unacceptable, the procedure is repeated for that particular instrument. Table 3.6 shows measured BORCAL and ICS responsivities and their differences at a 45-degree zenith angle with the chosen PSP reference instrument, 18078F3. Two apparent outlier instruments, 25823F3 and 25824F3, responsivities were respectively 6.41% and 4.44% greater than their BORCAL responsivities. With these outliers, the average difference between responsivities for the two different methods was -1.25% and the standard deviation was 2.46%. Removing these outliers from statistical analysis, the mean difference was -0.06% and the standard deviation of the differences was 0.72%.
38
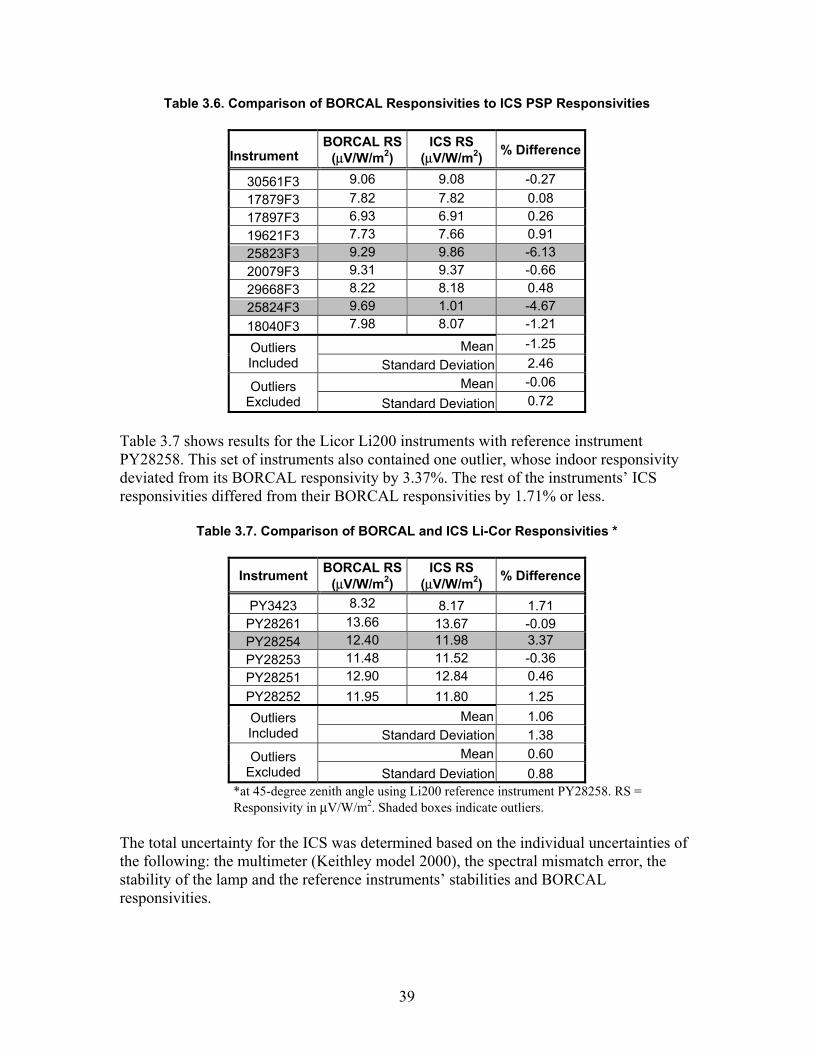
Table 3.6. Comparison of BORCAL Responsivities to ICS PSP Responsivities
Instrument BORCAL RS
(µV/W/m2) ICS RS
(µV/W/m2) % Difference
30561F3 9.06 9.08 -0.27 17879F3 7.82 7.82 0.08 17897F3 6.93 6.91 0.26 19621F3 7.73 7.66 0.91 25823F3 9.29 9.86 -6.13 20079F3 9.31 9.37 -0.66 29668F3 8.22 8.18 0.48 25824F3 9.69 1.01 -4.67 18040F3 7.98 8.07 -1.21
Mean -1.25 Outliers Included Standard Deviation 2.46
Mean -0.06 Outliers Excluded Standard Deviation 0.72
Table 3.7 shows results for the Licor Li200 instruments with reference instrument PY28258. This set of instruments also contained one outlier, whose indoor responsivity deviated from its BORCAL responsivity by 3.37%. The rest of the instruments’ ICS responsivities differed from their BORCAL responsivities by 1.71% or less.
Table 3.7. Comparison of BORCAL and ICS Li-Cor Responsivities *
Instrument BORCAL RS(µV/W/m2)
ICS RS (µV/W/m2) % Difference
PY3423 8.32 8.17 1.71 PY28261 13.66 13.67 -0.09 PY28254 12.40 11.98 3.37 PY28253 11.48 11.52 -0.36 PY28251 12.90 12.84 0.46 PY28252 11.95 11.80 1.25
Mean 1.06 Outliers Included Standard Deviation 1.38
Mean 0.60 Outliers Excluded Standard Deviation 0.88
*at 45-degree zenith angle using Li200 reference instrument PY28258. RS = Responsivity in µV/W/m2. Shaded boxes indicate outliers.
The total uncertainty for the ICS was determined based on the individual uncertainties of the following: the multimeter (Keithley model 2000), the spectral mismatch error, the stability of the lamp and the reference instruments’ stabilities and BORCAL responsivities.
39

The la re .18 shows the spectral irradiance difference between outdoor and indoor sources.
rgest contributor to the system uncertainty was the spectral mismatch error. Figu3
nts erence is
ttributed to the outlier instruments; therefore, if subsequent research allows us to confidently would be
duced to 0.5%. A total theoretical uncertainty of 4.41% was calculated for the larger spectral mismatch 9 ty w lat hese uncertainty calcula up ur ta which was calculated to be 5.08 4% if tlier ins nts are excluded. After identifying the two PSP outlier instruments ticed th t serial numbers (25823F3 and 25824F3). This led us to hypothesize a physical difference in this particular set of ins possib ted to m cturing t use, that causes them to behave differently than the others. Refer to Table 3.6; notice the comparatively large gap between th A ese two instruments. To investigate, we took nce ments outdoors and repeatedly took volt ngBORCAL responsivities, both rence instrument’s response to within 0.5%. T e took another instrumen 3) and calculated its
sponsivity using the ICS, where we found it to have a 4.91% higher ICS than BORCAL
d the ents after positioning an infrared absorbing filter between the
instrument dome and the lamp. Both outlier instruments’ responsivities decreased by several µV/W/m2 when filtered, while the reference instruments’ responsivities either
Figure 3.18. Spectral distribution of natural sunlight and ICS lamp source.
Considering all PSP’s, we found there is a 4% difference in the way that the instrumerespond to the indoor spectrum verses the outdoor spectrum. Most of this diffa
exclude those instruments from our results, this spectral uncertaintyre
error and 1.tions were s
3% uncertain as calcu ed for the smaller error. Tl uncertainty, ported by o experimen
%, or 1.4 the ou trume
we no eir adjacen
truments, ly rela anufa or pas
e BORC these two
L and ICS data points for thoutliers and one of our refere instru
age readi s from each during a 20-minute period. After applying the instruments followed the refe
his validated the BORCAL results for outdoor irradiance. Next, wt from the same serial number range (PSP 25825F
reresponsivity. In the third experiment, we took voltage readings from both of the outliers anreference instrum
40

slightly increased or showed no change. This response suggests that the outlier instruments are more responsive in the infrared region than the other instruments tested.
Considering that the natural sunlight and lamp spectra are very different, and the two outliers respond differently in some areas of the spectrum than the other instruments do, we conclude the outlier ICS responsivities do not match their BORCAL responsivities due to this spectral mismatch. These experiments suggested a material difference between the outliers and the other instruments that we were testing, possibly a different or inconsistent paint or seal on the sensor of the instruments. Further investigation into the cause of the unusual behavior of these instruments must be performed before the ICS can be sufficiently validated and so that “problem” instruments can be identified prior to or as a result of the calibration.
41

4.0 Upgrades to the Measurement and Instrumentaeam Website
tion
nd
n research community. Until recently, data could be downloaded as either:
• Daily data: ASCII or compressed data selected for a single day, or period, at the data time resolution (5 minute or 1 minute data).
or • Hourly monthly summary data for the MIDC Solar Radiation Monitoring stations.
The option to generate hourly data (by averaging the 1 or 5 minute raw data) is now available for any MIDC station. A new option to generate “Selected Hourly Data (ASCII)” and “Selected Hourly Data (ZIP)” is now available from the “Daily Data/Plots” page on the MIDC. The user can then select any day range and instruments. The “hourly data” was previously only available for SRRL BMS (using the QA'd monthly data from DQMS). Now it can be done for any site using the raw data. This capability will permit much more efficient use of the measured data for producing system performance solar radiation input file structures, verification and validation of hourly solar radiation models, data for producing Typical Meteorological Year file structures, and many other applications. In addition to the interface and data access modifications above, several instruments were decommissioned, refurbished, or upgraded during the year. The degradation of filters in the EKO Model MS 110 sunphotometer required decommissioning that unit until funds become available for new replacement filters (approximately $5,500 US). We disassembled the Atmospheric Optical Calibration system, and NREL-developed sunphotometer, and evaluated the filters used in that unit. Transmission measurements showed little degradation, however as spare, unused filters were available, new filters were installed in the unit. At the same time, we developed the ability to display and analyze Langley plots to calibrate the sunphotometer channels on clear days. Figure 4.1 is an example AOCS Langley plot (from which instrument channel calibration coefficients can be derived).
TThe Solar Radiometry and Metrology task partially supports the SRRL Measurement aInstrumentation Team (MIT) website. On April 8, 2005, the site became one of the few examples in the world where continuous solar radiation data has been collected for 25 years. All 25 years of the collected data are available and can be downloaded from the site at http://www.nrel.gov/midc/. Twelve measurement stations, including the SRRL BMS site, are available through this page. The BMS site provides access to 138 different measurement parameters, all of interest to the solar radiatio
42

Figure 4.1 Daily clear sky Langley (sunphotometer calibration) plots for narrow band channels of Atmospheric Optical Calibration System now available at Measurement and Instrumentation Data Center (MIDC) website. 500 nm channel shown for September 17,
2005.
43

5.0 Solar Radiometric Metrology Interactions—Second Half of FY 2005 The table below is a sample of an additional 95 interactions documented with the PV industry, academia, and other national and international laboratories over and above the 135 interactions in the first half of FY 2005 summarized in section 5.0 of the midyear report.
Table 5.1 Industrial, Academic, National and International Laboratory Interactions
Contact Topic Outcome
Spire Corporation Bedford, MA
Jun 1
Information on spectroradiometer design and performance
Provided overview, experience concerning various types of spectrometers.
HelioTrax San Diego CA
Jun 2
Bird Clear sky model filtering of data for various geometries
Provided technical guidance on filtering data for daylight applications
Honeywell Specialty Films Morris Township NJ
Jun 6
Reflectance measurements tedlar films
Provided measurements requested.
Universidad de Valladolid Departamento de Física
Aplicada Facultad de Ciencias
Use of SMARTS model For UV spectral estimation
Provided links to model and documentation, literature references.
Valladolid Spain Jun 6
Mangosuthu Technikon Institute of Technology
Durban South Africa Aug 5
Information on solar radiation instrumentation selection, site, setup, and maintenance
Provided CD of reference documents.
DOE Headquarters Solar Energy Technologies
Program Washington, D.C.
Aug 26
Web site inquiry; conversion of irradiance to photon flux density in visible range
Provided sample calculation and conversion factor
Pacific Northwest Laboratories Richland WA Jun BORCAL
Pyranometer and Pyrheliometer calibration and characterization
ISO 17025 compliant calibration results
DuPont Displays Santa Barbara CA
Aug 15
Solar daylight modeling for outdoor display glare research
CIE, ASTM, NIST and SMARTS model generation of CIE D65 illuminant information discussed over several exchanges.
NASA Surface Solar Energy Working
group Aug 25 2005 (ASES
Conference)
Paper on model performance bias and random error analysis
Model performance US Solar Radiation Data Base upgrade
44

Contact Topic Outcome National Institute of
Standards and Technology Gaithersburg MD
August 29
Request for Pyranometer and pyrheliometer calibrations.
Provided logistical and technical information for next BORCAL event
QF Colorado Springs Utility Colo. Springs, CO.
Aug 26
Request for flat plat resource data to correlate with utility peak load, CO. Springs site.
Provided Info on PVWATTS and NSRDB website data sources, suggested analysis approach.
bafemi Awolowo University, Information on filters for UV Technical references OIle-Ife, Nigeria.
Jun 7 exposure testing provided.
Photovoltaic and Thermal
Sol ory St P ex,
F
Means to calc al SMART odel ple Energy
ar Outdoor Laborataul lez Durance Ced
rance Jun 17
ulate annuaverage spectral distribution and photon flux density in PV response bands
S spectral med and examdiscuss
calculations provided.
Natio of Standa ology
Gaith MD ns
pulse simulators
nal Instituterds and Techn
ersburgJuly 17
Information on techniques for measuring spectral distributio
Provided logistical and technical information on NREL PASS system
National Institute of Ocea hy
Goa, India nograp
Sep 2
Extraterrestrial spectral ks to NREL distributions appropriate for use in estimating ocean color from satellite data
Provided linand other web sites with ETR spectra
Department Solar M y
Fraunh olare
Spectral modeling code and applications to PV performance evaluation, prediction
ion of SMARTS code, URL for inventory of spectral modeling codes available.
Cells-aterials and Technolog
ofer-Institut für SEnergie e ISE
Freiburg, Germany Sep 15
system
Description of applicat
ConEdison NJ Aug 16
Resource data for flat plate and Provided NSRDB data ch concentrator systems in NJ and analysis approa
Dow Chemical Co. Freeport Tx.
Sep 5
Modeling solar irradiance on cylindrical chemical storage tank
Provided referencsimple computatiomodel
es and nal
H2GO Saratoga CA
Sep 17
Cavity radiometer information Referred to inventor and manufacturer of instrument
Arizo ice radiometers, Pyranometer,
nt radiometer calibrations
na Public ServPhoenix, AZ Jun BORCAL
Radiometer Calibrations (UV
pyrheliometers)
ISO 17025 complia
supporting accreditation National Institute of
Stan logy
August 24
ta dards and Techno
Gaithersburg MD (ASES conference)
Pyranometer Thermal Offset daand corrections.
Shared experimental data, draft publications,and references.
Kipp nen Uncertainty sources and
s ll
s nge
data
And Zorland anDelft Nethe d Bohemia
New York Sep 27
applications for thermopile versusilicon pyranometers
Information on silicon cepyranometer corrections and uncertainty for PV monitoring applicationversus climate cha
45

Contact Topic Outcome
Florid enter a Solar Energy CCocoa, FL
Feb 24
Pyranometer calibration issues
processing techniques
Shared example calibration results, consensus on data
and sources of differences
Shell Solar Camarillo, CA (Feb 05)
measurements
ve uct
Pulse spectral simulator Data provided to improaccuracy in PV prodtesting,
SPIRE Corp. Bedford, MA
Sep 16
l odel 350i and
one prototype Solar Simulator 7
classifications
Request to measure spectradistribution of 2 m
ISO 17025 compliant ASTM E92
46

6.0 Major Publication ASTM Standards G167-00 Standard Test Method for CalibratioUsing a Pyrheliometer (REVISION) ASTM Standard E816-95 Stan alibrationComparison to Reference (REVISION) ASTM Standard E824-94 Standard Test Method for Transfer of Calibration from Reference t adiometers
Lester, A., D. R. Myers, A Method for Improving Global Pyranometer Measurements by Modeling Responsivity Functions. Solar Energy, 2005. In Press Reda, I., J. Hickey, C. Long, D. Myers, T. Stoffel, S. Wilcox, J.J. Michalsky, E.G. Dutton, D. Nelson, Using a Blackbody to Calculate Net-Longwave Responsivity of Shortwave Solar Pyranometers to Correct for Their Thermal Offset Error During Outdoor Calibration Using the Component Sum Method. Journal of Atmospheric and Oceanic Technology, Vol. 22, No. 10, pages 1531–1540,2005. Myers, et al. FY 2005 Midyear Progress Report Solar Radiometry and Metrology Task PVC57301 NREL/TP-56-37954 March 2005. Stoffel et al, “NREL Participation in the DOE Atmospheric Radiation Measurement (ARM) Program” CORM 2004 Annual Technical Conference NIST Boulder CO May 11-13 2005. Reda, et al., “Determination of Longwave Response of Shortwave Solar Radiometers” CORM 2004 Annual Technical Conference NIST Boulder CO May 11-13 2005. Myers, et al., “Solar Radiometric Metrology for Renewable Energy Applications” CORM 2004 Annual Technical Conference NIST Boulder CO May 11-13 2005. Myers, et al., “An Update on Reducing the Uncertainty in Solar Radiometric Measurements”, in Proceedings Solaris 2005 2nd Joint International Conference May 26-27, 2005. Athens, Greece. Myers, D.R., “Solar radiation modeling and measurements for renewable energy applications: data and model quality” Energy, Volume 30, Issue 9, 1 July 2005, Pages 1517-1531 (No. 8 on the list of “top 25 downloaded articles”). Myers, et al., “Analysis of Broadband Model Performance for an Updated National Solar Radiation Database in the United States of America” 2005 Joint ISES/ASES meeting, Orlando FL Aug 6-12 2005.
s
n of a Pyranometer
dard Test Method for C of Pyrheliometers by
o Field R . (REVISION)
47

7.0 Conclusion A great deal of progress in understanding the sources of uncertainty in broadband
k has maintained ISO 17025 compliant traceability r solar and optical radiation calibrations and measurements. This includes monitoring
e revisited and revised our analysis of ncertainty for both broadband and spectral measurement systems. We measured and
ing PV performance measurements to tandard Reporting Conditions. Our research has led to new insights into sources of error
(ASTM) standard rocedures for radiometer calibrations have been developed and put before the consensus
er and
teractions with the PV industry, cademia, other national laboratories, and PV system designers on a wide range of topics,
n gs, and indoor and outdoor PV testing
ethods. Much of the above have been documented in a series of journal articles and rial
radiometer measurements has been accomplished in the period covered by this report. The Solar Radiometric Metrology tasfothe stability of the WRR scale for NREL reference cavity radiometers and maintaining the NIST Scale of Spectral Irradiance. Wucharacterized the performance of several NREL research and PV industry solar simulators, providing data essential for translatSin broadband radiometers, and improved methods of correcting for environmental influences on broadband measurement data. Revisions to existing pstandards community for approval later in FY 2006. We are upgrading the radiometcalibration data acquisition system to remove a known bias error from our BORCALRADCAL system, and have identified a replacement for obsolescent and aging workhorse spectroradiometers essential to primary and secondary PV reference call calibrations. We have documented over 135 separate inaincluding instrumentation, calibrations, broadband, and spectral modeling, solar radiatioresource data, module and systems energy ratinmconference papers, disseminating our research results to both the scientific and industcommunity.
48

8.0 References [1] Myers, D. R., T.L. Stoffel, A.M. Andreas, S.M. Wilcox, I. Reda, M. Anderberg
Gotseff, B. Kay, FY 2005 Midyear Progress Report on Solar Radiometry and Metrology Task PVC57301. NREL/TP-560-37954 2005 National Renewable Energy Laboratory
[2] ISO, General requirements for the competence of testing and calibration laboratories2005 International Standards Organization, Geneva Switzerland
[3] Anon. International Pyrheliometer Comparison IPC-IX 25 September- 13 October 2000 Results and Symposium. 2001. Davos and Zurich, Switzerland: MeteoSwis
[4] ASTM, Standard Test Methods for Electrical Performance of Nonconcentrator Terrestrial Photovoltaic Modules and Arrays Using Reference Cells, Standard E1036. 1998 American Society for Testing and Materials, West Conshohocken, PA.
[5] Walker, J. H., et al., NBS Special Publication 250-20 "Spectral Irradiance Calibrations". 1987 National Institute of Standards and Technology
[6] ANSI, American National Standard for Expressing Uncertainty-U.S. Guide to the Expression of Uncertainty in Measurement. ANSI/NCSL Z540-2-1997 Secretariat, National Conference of Standards Laboratories (NCSL) Boulder, CO. 1997.
[7] BIPM, Guide to the Expression of Uncertainty in Measurement. Published by ISOTAG 4, 1995. International Bureau of Weights and Measures (BIPM) Sevres, France. 1995.
[8] Taylor, B. N., C E Kuyatt, Guidelines for Evaluation and Expressing the Uncertainty of NIST Measurement Results. NIST Technical Note 1297 1993 National Institute of Standards and Technology
[9] ASTM, Standard Specification for Solar Simulation for terrestrial Photovoltaic Testing ASTM Standard E-927. 1997 American Society for Testing and Materials, West Conshohocken, PA.
, P.
.
s.
ilcox, A. Andreas,. Optical Radiation Measurements for Photovoltaic Applications Instrumentation Uncertainty and Performance. in 50th Annual Conference of the Society of Photo-optical Instrumentation Engineers, Organic Photovoltaics V. 2004. Denver, CO: SPIE Bellingham, Washington.
[11] Myers, D. R., T L Stoffel, S Wilcox, I Reda, A Andreas, Recent Progress in Reducing the Uncertainty in and Improving Pyranometer Calibrations. Journal of Solar Energy Engineering, 2002. 124: p. 44-50.
[12] Reda, I., Improving the Accuracy of Using Pyranometers to Measure Clear Sky Global Irradiance NREL/TP-560-24833. NREL/TP-560-24833 1998 National Renewable Energy Laboratory
[13] Reda, I., D Myers, Calculating the diffuse responsivity of solar pyranometers. NREL/TP-560-26483 1999 National Renewable Energy Laboratory
[14] Reda, I., J. Hickey, C. Long,D. Myers, T. Stoffel, S. Wilcox,J.J. Michalsky, E.G. Dutton, D. Nelson, Using a Blackbody to Calculate Net-Longwave Responsivity of Shortwave Solar Pyranometers to Correct for Their Thermal Offset Error During Outdoor Calibration Using the Component Sum Method. Journal of Atmospheric and Oceanic Technology, 2005. 22 (10), pp1531–1540.
[15] Reda, I., T. Stoffel, D. Myers, A Method to calibrate a solar pyranometer for measuring reference diffuse irradiance. Solar Energy, 2003. 74: p. p. 103-112.
[10] Myers, D. R., I. Reda, S. W
49

[16] WMO, OMM No. 8Observation.5th ed.
Guide to Meteorological Instruments and Methods of Vol. 8. 1983, Geneva, Switzerland: . Secretariat of the World
[17] W 1996
[18] Reda, I., T Stoffel, D Myers, Calibration of a solar absolute cavity radiometer with
to
[20] A
[21] D L. Alberta, I.
7: p.
. 472-484. .
. Richtsmeier, B. Pukall, J. B. Mello, and L. S. Jeong.
[25] Al
ts
[27] ISO, ISO 98461993: Solar Energy--Calibration of a Pyranometer using a 93
[28] Handbook
Meteorological Organization. MO, International Pyrheliometer Comparison VIII. Working Report No 188
World Meteorological Organization
traceability to the world radiometric reference. NREL/TP-463-20619 1996 National Renewable Energy Laboratory
[19] ASTM, Standard Test Method for Calibration of a Pyrheliometers by ComparisonReference Pyrheliometers ASTM E 816-95. ASTM G167-00 2000 American Society for Testing and Materials STM, Standard Test Method for Calibration of a Pyranometer Using a
PyrheliometerASTM G167-0. ASTM G167-00 2000 American Society for Testing and Materials utton, E. G., J. J. Michalsky, T. Stoffel, B. W. Forgan, J. Hickey, T.
Reda, Measurement of Broadband Diffuse Solar Irradiance Using Current Commercial Instrumentation with a Correction for Thermal Offset Errors. Journal of Atmospheric and Oceanic Technology, 2001. 18(3): p. 297-314.
[22] Gulbrandsen, A., On the Use of Pyranometers in the Study of Spectral Solar Radiation and Atmospheric Aerosols. Journal of Applied Meteorology, 1978. 1899-904.
[23] Haeffelin, M., S. Kato, A.M. Smith, C.K. Rutledge,T.P. Charlock, J.R. Mahan,, Determination of the thermal offset of the Eppley Precision Spectral Pyranometer. Applied Optics, 2001. 40(4): p
[24] Anderson, G. P., A. Berk, P. K. Acharya, M. W. Matthew, L. S. Bernstein, J. HChetwynd, Jr., H. Dothe, S. M. Adler-Golden, A. J. Ratkowski, G. W. Felde, J. A. Gardner, M. L. Hoke, S. CMODTRAN4: radiative transfer modeling for remote sensing. in Optics in Atmospheric Propagation and Adaptive Systems III;. 1999: Society of Photo-Optical Instrumentation Engineers Bellingham, WA. STM, Standard Test Method for Determination of the Spectral Mismatch
Parameter Between a Photovoltaic Device and a Photovoltaic Reference CelASTM Standard E973M-96 American Society for Testing and Materials, West Conshohocken PA. 1996
[26] Lester, A., D. Myers, A Method for Improving Global Pyranometer Measuremenby Modeling Responsivity Functions. Solar Energy, 2005. In Press.
Pyrheliometer. International Standards Organization, Geneva, Swizterland. 19Natrella, M. G., Experimental Statistics. National Bureau of Standards91. Vol. 91. 1963, Washington, D.C.: National Bureau of Standards.
50
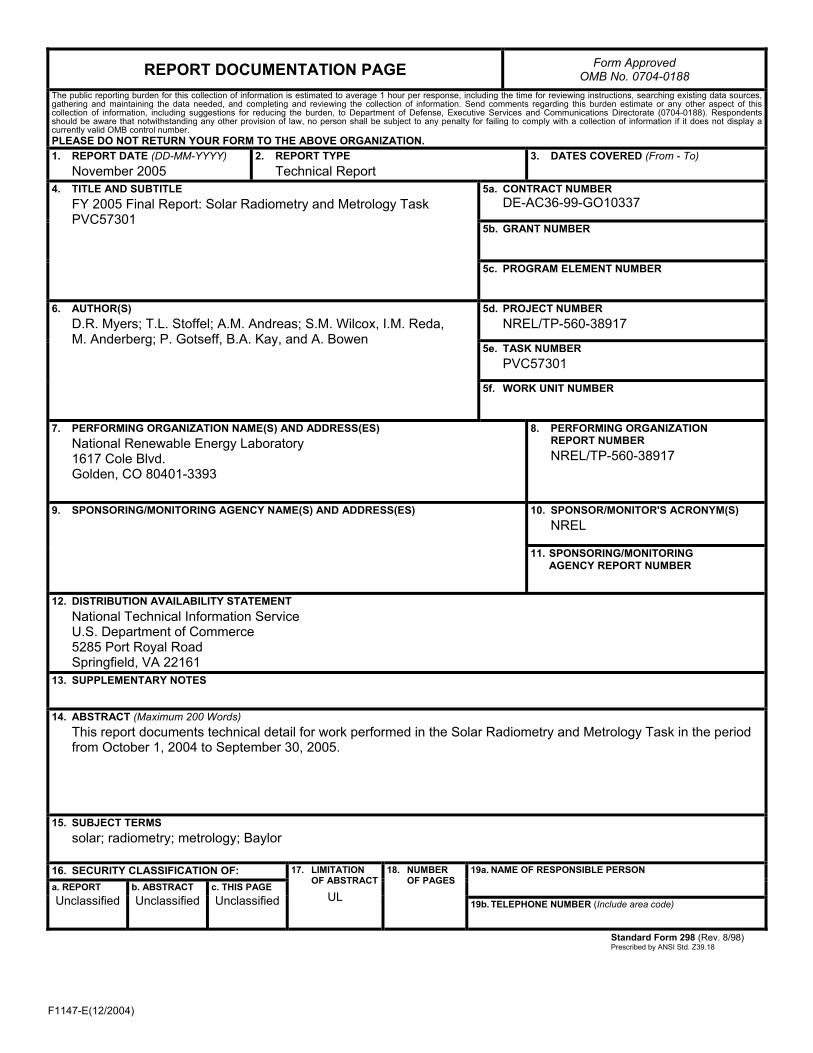
F1147-E(12/2004)
REPORT DOCUMENTATION PAGE Form Approved OMB No. 0704-0188
The public reporting burden for this collection of information is estimated to average 1 hour per response, including the time for reviewing instructions, searching existing data sources, gathering and maintaining the data needed, and completing and reviewing the collection of information. Send comments regarding this burden estimate or any other aspect of this collection of information, including suggestions for reducing the burden, to Department of Defense, Executive Services and Communications Directorate (0704-0188). Respondents should be aware that notwithstanding any other provision of law, no person shall be subject to any penalty for failing to comply with a collection of information if it does not display a currently valid OMB control number. PLEASE DO NOT RETURN YOUR FORM TO THE ABOVE ORGANIZATION. 1. REPORT DATE (DD-MM-YYYY)
November 2005 2. REPORT TYPE
Technical Report 3. DATES COVERED (From - To)
5a. CONTRACT NUMBER
DE-AC36-99-GO10337
5b. GRANT NUMBER
4. TITLE AND SUBTITLE FY 2005 Final Report: Solar Radiometry and Metrology Task PVC57301
5c. PROGRAM ELEMENT NUMBER
5d. PROJECT NUMBER NREL/TP-560-38917
5e. TASK NUMBER PVC57301
6. AUTHOR(S) D.R. Myers; T.L. Stoffel; A.M. Andreas; S.M. Wilcox, I.M. Reda, M. Anderberg; P. Gotseff, B.A. Kay, and A. Bowen
5f. WORK UNIT NUMBER
7. PERFORMING ORGANIZATION NAME(S) AND ADDRESS(ES) National Renewable Energy Laboratory 1617 Cole Blvd. Golden, CO 80401-3393
8. PERFORMING ORGANIZATION REPORT NUMBER NREL/TP-560-38917
10. SPONSOR/MONITOR'S ACRONYM(S) NREL
9. SPONSORING/MONITORING AGENCY NAME(S) AND ADDRESS(ES)
11. SPONSORING/MONITORING AGENCY REPORT NUMBER
12. DISTRIBUTION AVAILABILITY STATEMENT National Technical Information Service U.S. Department of Commerce 5285 Port Royal Road Springfield, VA 22161
13. SUPPLEMENTARY NOTES
14. ABSTRACT (Maximum 200 Words) This report documents technical detail for work performed in the Solar Radiometry and Metrology Task in the period from October 1, 2004 to September 30, 2005.
15. SUBJECT TERMS solar; radiometry; metrology; Baylor
16. SECURITY CLASSIFICATION OF: 19a. NAME OF RESPONSIBLE PERSON a. REPORT
Unclassified b. ABSTRACT Unclassified
c. THIS PAGE Unclassified
17. LIMITATION OF ABSTRACT
UL
18. NUMBER OF PAGES
19b. TELEPHONE NUMBER (Include area code)
Standard Form 298 (Rev. 8/98) Prescribed by ANSI Std. Z39.18