FY 14-15 Executive Budget Review HIGHER EDUCATION …house.louisiana.gov/housefiscal/DOCS... ·...
49
Representative Jim Fannin Chairman Representative Simone Champagne Vice Chairman FY 14-15 Executive Budget Review HIGHER EDUCATION House Committee on Appropriations by the House Fiscal Division April 7, 2014
Transcript of FY 14-15 Executive Budget Review HIGHER EDUCATION …house.louisiana.gov/housefiscal/DOCS... ·...

Representative Jim Fannin Chairman
Representative Simone Champagne Vice Chairman
FY 14-15 Executive Budget Review HIGHER EDUCATION
House Committee on Appropriations by the House Fiscal Division
April 7, 2014

House Fiscal Division
Budget Overview – Department Structure 3 – Comparison to Total State Budget 4 – Means of Finance Comparison 5 – 10-Year Budget History 6 – Major Sources of Revenues 8 – Expenditure Breakdown 9 – Significant Budget Adjustments 11 – Discretionary/Non-Discretionary Funding 14 – Workforce and Innovation for a Stronger Economy Fund 17 – Formula and Non-formula Operations 19 – Salaries and Positions 26 – National Comparison 32 – Taylor Opportunity Program for Students 46 – Agency Contacts 49
Higher Education 2
Agenda
Willis Brewer 225-342-1964

House Fiscal Division Higher Education 3
Department Structure
Willis Brewer 225-342-1964
Board of Regents Louisiana Universities
Marine Consortium
Office of Student Financial
Assistance
Louisiana State University System
• Louisiana State University A&M College
• Paul M. Hebert Law Center
• Pennington Biomedical Research Center
• LSU Agricultural Center
• LSU Shreveport
• LSU Alexandria
• LSU Eunice
• LSU Heath Sciences Center New Orleans
• LSU Health Sciences Center Shreveport
Southern University System
• Southern University Baton Rouge
• Southern Ag Center
• Southern Law School
• Southern University New Orleans
• Southern University Shreveport
University of Louisiana System
• Grambling State University
• Louisiana Tech University
• McNeese State University
• Nicholls State University
• Northwestern Louisiana University
• Southeastern Louisiana University
• University of Louisiana at Lafayette
• University of Louisiana at Monroe
• University of New Orleans
Louisiana Community and Technical Colleges System
• Baton Rouge Community College
• Bossier Parish Community College
• Central Louisiana Technical Community College
• Delgado Community College
• Fletcher Technical Community College
• Louisiana Delta Community College
• Northshore Tech Comm. College
• Northwest Louisiana Tech. College
• Nunez Community College
• River Parishes Community College
• South Central Louisiana Technical College
• South Louisiana Community College
• SOWELA Technical Community College

House Fiscal Division Higher Education 4
Comparison to Total State Budget FY 14-15
Willis Brewer 225-342-1964
Means of Finance Higher Education
Total State
Budget
% of Total
State Budget
State General Fund $900,075,117 $8,617,600,000 10.4%
Interagency Transfers $14,985,191 $1,767,132,013 0.8%
Fees and Self-Gen. Rev. $1,373,431,742 $3,861,523,669 35.6%
Statutory Dedications $231,982,145 $4,065,764,569 5.7%
Federal Funds $101,532,604 $9,886,615,632 1.0%
TOTAL MOF $2,622,006,799 $28,198,635,883 9.3%
Authorized Positions 19,972 53,109 37.6%
08-09
Actual
09-10
Actual
10-11
Actual
11-12
Actual
12-13
Actual
13-14
Existing
14-15
Exec.
State General Fund 16.5% 13.3% 15.1% 11.4% 11.7% 6.2% 10.4%
Fees and Self-Generated Revenue 28.6% 28.4% 28.4% 32.8% 33.7% 35.3% 35.6%
% of HIED to Total State General Fund
House Fiscal Division Higher Education 5
Means of Finance
Means of FinanceFY 12-13
Actual Revenues
FY 13-14
Existing
Operating Budget
(12/1/12)
FY 14-15
Executive Budget
Recommendation
Change from
FY 13-14 to
FY 14-15
Percent
Change from
FY 13-14 to
FY 14-15
State General Fund $980,259,306 $524,820,869 $900,075,117 $375,254,248 71.5%
Interagency Transfers $297,275,177 $111,235,049 $14,985,191 ($96,249,858) (86.5%)
Fees and Self-Gen Rev $1,145,792,798 $1,279,887,741 $1,373,431,742 $93,544,001 7.3%
Statutory Dedications $189,463,892 $594,669,343 $231,982,145 ($362,687,198) (61.0%)
Federal Funds $152,181,160 $122,773,947 $101,532,604 ($21,241,343) (17.3%)
TOTAL $2,764,972,333 $2,633,386,949 $2,622,006,799 ($11,380,150) (0.4%)
Authorized Positions 24,866 20,472 19,972 (500) (2.4%)
Willis Brewer 225-342-1964
State General Fund • $361.5 million in MOF Swaps ($294.4 Overcollections and $67.3 TOPS fund)
• $7 million WISE Fund • $17 million TOPS
$375.2M
Statutory Dedications • Nonrecurring $361.5 million ($294.4 Overcollections and $67.3 TOPS fund)
• Nonrecur $40 million Def. Mntce/Gen. Op.
($362.7M)
Federal
• $17.6 million Reduction for Private Partnerships (Medicare)
• $3.6 million Carry-forwards and Teach Louisiana First
($21.2M)
Interagency Transfers • $97.1 million related to Public/Private Partnerships
• Lab School MFP ($1 mill increase)
• Chaffee Grant
($96.2M)
Significant Adjustments:
Authorized Positions • 500 Vacant Positions Eliminated
500 T.O.
Fees and Self-Gen Rev • $87.7 million tuition increases
• $7.7 million in workload adjustments
$93.5M

House Fiscal Division Higher Education 6
10-Year Budget History
Willis Brewer 225-342-1964
*Existing Operating Budget as of 12/1/13 **Governor’s Executive Budget Recommendation Source: Executive Budget Supporting Documents
$2.34
$2.61 $2.81
$2.98 $2.83
$2.96 $2.89 $2.76
$2.63 $2.62
$0
$1
$2
$3
$4
FY 05-06
FY 06-07
FY 07-08
FY 08-09
FY 09-10
FY 10-11
FY 11-12
FY 12-13
FY 13-14 E.O.B. *
FY 14-15 Exec. Bud.
**
Bill
ion
s
Fiscal Year
HIGHER EDUCATION (Total Funding)

House Fiscal Division Higher Education 7
10-Year Equivalent State General Fund and Fees & Self-Generated Revenue History
Willis Brewer 225-342-1964
Source: Executive Budget Supporting Documents
$1,033,951,930
$1,397,613,902
$887,678,909
$715,345,433 $671,280,438
$699,985,434
$809,086,402
$1,373,390,292
$0
$200,000,000
$400,000,000
$600,000,000
$800,000,000
$1,000,000,000
$1,200,000,000
$1,400,000,000
$1,600,000,000
$1,800,000,000
2005-06 2006-07 2007-08 2008-09 2009-10 2010-11 2011-12 2012-13 EOB 2013-14* Exec. Budget 2014-15**
Equivalent State General Fund
Equivalent State General Fund without LOSFA & Hospitals
Fees and Self-Generated
LOSFA added to HIED (FY 2008-09)
Huey P. Long added to HIED (FY 2007-08)
Federal Stimulus (ARRA) Funds
*Existing Operating Budget as of 12/1/13 **Governor’s Executive Budget Recommendation
Overcollections and TOPS Fund included
Equivalent State General Fund includes General Fund and other Means of Financing that was used to supplant the loss in General Fund.

House Fiscal Division
State General Fund - $900 million
• $361.5 million of General Fund replacing Overcollection and TOPS funds
Fees and Self-Generated -$1.4 billion
• Tuition and Fees, Sales and Services of Educational Activities, Activities related to Instruction, State Grants, Other Self-Generated Revenues
Federal Funds - $101.5 million
• Federal Family Education Loan Program and other grants/scholarships at LOSFA
• Federal Grants and Appropriations for LUMCON and Agricultural Centers
Statutory Dedications - $232 million
• LA Quality Education Support Fund, Support Education in Louisiana Fund (SELF), TOPS Fund, Tobacco Health Care Fund, Workforce Training - Rapid Response, Overcollections (Workforce and Innovation for a Stronger Economy-WISE)
Higher Education 8
Major Sources of Revenues FY 14-15
Willis Brewer 225-342-1964

House Fiscal Division Higher Education 9
Expenditure Breakdown
ExpendituresFY 12-13
Actual Expenditures
FY 13-14
Existing Operating
Budget (12/1/12)
FY 14-15
Executive Budget
Recommendation
Change from FY
13-14 to FY
14-15
Percent
Change from
FY 13-14 to
FY 14-15
Salaries $1,215,309,886 $1,105,529,367 $0 ($1,105,529,367) (100.0%)
Other Compensation $72,357,980 $53,690,320 $0 ($53,690,320) (100.0%)
Related Benefits $474,891,798 $455,206,587 $0 ($455,206,587) (100.0%)
Travel $10,700,827 $9,544,443 $0 ($9,544,443) (100.0%)
Operating Services $182,250,953 $167,755,008 $0 ($167,755,008) (100.0%)
Supplies $138,118,850 $86,802,541 $0 ($86,802,541) (100.0%)
Prof Services $35,757,384 $34,185,240 $0 ($34,185,240) (100.0%)
Other Charges $611,224,429 $697,759,212 $2,622,006,799 $1,924,247,587 275.8%
Acq/Major Repairs $24,360,226 $22,914,231 $0 ($22,914,231) (100.0%)
Unallotted $0 $0 $0 $0 0.0%
TOTAL EXP $2,764,972,333 $2,633,386,949 $2,622,006,799 ($11,380,150) (0.4%)
Current Executive Budget practice and interpretation by the Division of Administration places all Higher Education State General Fund dollars in the Board of Regents’ budget and into the Other Charges expenditure category. Thus, there are no itemized expenditure categories with which to compare FY 14-15 to previous fiscal years until the appropriation letters are issued in the next fiscal year.
Willis Brewer 225-342-1964
Source: Executive Budget Supporting Documents

House Fiscal Division Higher Education 10
Expenditure Breakdown
Willis Brewer 225-342-1964
Source: Executive Budget Supporting Documents
ExpendituresFY 10-11
Actual Expenditures
FY 11-12
Actual Expenditures
FY 12-13
Actual Expenditures
FY 13-14
Existing Operating
Budget (12/1/12)
Change from
FY 10-11 to
FY 14-15
Percent
Change from
FY 10-11 to
FY 14-15
Salaries $1,337,994,729 $1,290,430,076 $1,215,309,886 $1,105,529,367 ($232,465,362) (17.4%)
Other Compensation $78,775,217 $72,921,118 $72,357,980 $53,690,320 ($25,084,897) (31.8%)
Related Benefits $444,959,099 $486,652,067 $474,891,798 $455,206,587 $10,247,488 2.3%
Travel $9,720,419 $10,874,740 $10,700,827 $9,544,443 ($175,976) (1.8%)
Operating Services $219,330,256 $193,763,560 $182,250,953 $167,755,008 ($51,575,248) (23.5%)
Supplies $151,980,062 $145,066,942 $138,118,850 $86,802,541 ($65,177,521) (42.9%)
Prof Services $32,452,880 $27,189,650 $35,757,384 $34,185,240 $1,732,360 5.3%
Other Charges $636,124,605 $628,432,070 $611,224,429 $697,759,212 $61,634,607 9.7%
Acq/Major Repairs $52,237,686 $29,804,220 $24,360,226 $22,914,231 ($29,323,455) (56.1%)
Unallotted $103,827 $6,563 $0 $0 ($103,827) (100.0%)
TOTAL EXP $2,963,678,780 $2,885,141,006 $2,764,972,333 $2,633,386,949 ($330,291,831) (11.1%)
ExpendituresFY 10-11
Actual Expenditures
FY 11-12
Actual Expenditures
FY 12-13
Actual Expenditures
FY 13-14
Existing Operating
Budget (12/1/12)
Change from
FY 10-11 to
FY 14-15
Percent
Change from
FY 10-11 to
FY 14-15
Salaries $1,277,369,041 $1,232,357,919 $1,171,992,242 $1,088,561,777 ($188,807,264) (14.8%)
Other Compensation $76,287,909 $70,430,391 $69,830,945 $53,253,022 ($23,034,887) (30.2%)
Related Benefits $424,532,891 $464,535,774 $457,626,665 $448,842,995 $24,310,104 5.7%
Travel $9,608,287 $10,759,147 $10,567,593 $9,346,121 ($262,166) (2.7%)
Operating Services $204,926,446 $181,907,909 $170,780,529 $165,071,822 ($39,854,624) (19.4%)
Supplies $134,678,416 $127,204,758 $124,660,790 $83,529,402 ($51,149,014) (38.0%)
Prof Services $21,939,405 $18,688,897 $20,556,466 $20,340,936 ($1,598,469) (7.3%)
Other Charges $366,090,669 $344,060,182 $314,509,493 $395,906,119 $29,815,450 8.1%
Acq/Major Repairs $51,938,093 $29,575,803 $24,288,539 $22,745,731 ($29,192,362) (56.2%)
Unallotted $103,827 $6,563 $0 $0 ($103,827) (100.0%)
TOTAL EXP $2,567,474,984 $2,479,527,343 $2,364,813,262 $2,287,597,925 ($279,877,059) (10.9%)
Total Higher Education
Higher Education - without LOFSA, EA Conway Medical Center, and Huey P. Long Medical Center
Note: Prior to FY 2010-11, Personal Services were included in Other Charges.

House Fiscal Division Higher Education 11
Significant Adjustments
Willis Brewer 225-342-1964
Provides budget authority for LaGrad Act 741 tuition increases LSU A&M to align self-generated budget for their Veterinary Medicine Contract Program Fees, Lab School, Continuing Education, and other self-generated increases. HSC Shreveport for hospital contracts with private partners
$93.5 M Fees and Self-Generated
Reduces interagency transfer authority at LSU hospitals for the public/private partnerships (budget authority for Uncompensated Care Claims, Medicaid, and other Hospital Contracts). $1 million increase in LSU and SU A&M for their lab schools (MFP match).
$96.2 M IAT
Reduces federal funds budget authority at LSU hospitals for the public/private partnerships (Medicare). Non-recurring carry-forward for LOSFA
$21.2 Federal Funds
$361.5 million in Means of Financing Swaps replacing $294 million Overcollections and $67.3 million TOPS Fund with State General Fund (net budget impact=$0). $40 million for Workforce and Innovation for a Stronger Economy (WISE) Initiative ($7 State General Fund and $33 million Statutory Dedications). $17.6 million funding for projected increase in TOPS $6.1 Competitive Core Funding (aka, Rapid Growth) $2 million STEM Technology Funds for Southern University and Grambling State
$12.6 M Net State Funds (SGF & SD)

House Fiscal Division Willis Brewer 225-342-1964 Higher Education 12
Significant Changes FY 14-15 Executive Budget
General Fund Interagency
Transfers Fees and Self-
Generated Statutory
Dedications Federal Funds Total Budget
Calcasieu Parish Higher Education Improvement Fund $0 $0 $0 $32,611 $0 $32,611
Louisiana Quality Education Support Fund $0 $0 $0 $1,000,000 $0 $1,000,000
Adjustment for Public/Private Partnerships ($479,935) ($97,141,475) ($1,290,714) $0 ($17,641,217) ($116,553,341)
Lab School Adjustment $0 $1,012,273 $0 $0 $0 $1,012,273
Means of Financing (MOF) Swaps
Calcasieu Parish Fund ($39,848) $0 $0 $39,848 $0 $0
Orleans Parish Excellence Fund ($23,686) $0 $0 $23,686 $0 $0
Replacing Overcollections with State General Fund $294,265,343 $0 $0 ($294,265,343) $0 $0
Replacing TOPS Fund with State General Fund $67,300,000 $0 $0 ($67,300,000) $0 $0
Support Education in Louisiana Fund (SELF) Fund ($2,352,000) $0 $0 $2,352,000 $0 $0
TOPS Fund ($2,347,347) $0 $0 $2,347,347 $0 $0
Non-Recurring Adjustment
Legislative Amendment for Gen.Op (Southern U.) ($7,500,000) $0 $0 $0 $0 ($7,500,000)
Carryforwards ($152,216) $0 ($555,237) $0 ($3,424,540) ($4,131,993)
Judgment payment for McNeese $0 $0 $0 ($1,333,707) $0 ($1,333,707)
Termination pay for LSU hospitals (Overcollections) $0 $0 $0 ($4,000,000) $0 ($4,000,000)
Deferred Maintenance and General Operations $0 $0 $0 ($40,000,000) $0 ($40,000,000)
Teach LA First & Health Ed. Loan Forgiveness $0 ($101,000) $0 $0 ($200,000) ($301,000)
Competitive Core/Rapid Growth funds $0 $0 $0 $6,100,000 $0 $6,100,000
STEM Facility & Technology Upgrade (SU & Grambling) $2,000,000 $0 $0 $0 $0 $2,000,000
Tobacco Tax Adjustment $0 $0 $0 ($659,588) $0 ($659,588)
TOPS Adjustment $17,559,885 $0 $0 $0 $0 $17,559,885
Tuition Increase - LaGrad Act 741 $0 $0 $87,723,162 $0 $0 $87,723,162
Workforce & Innovation for a Stronger Economy Initiative $7,024,052 $0 $0 $32,975,948 $0 $40,000,000
Align with Projected Collections (workload) $0 ($19,656) $7,666,790 $0 $24,414 $7,671,548
Total Changes $375,254,248 ($96,249,858) $93,544,001 ($362,687,198) ($21,241,343) ($11,380,150)
Net State Funds (SGF and SD): $12,567,050

House Fiscal Division Willis Brewer 225-342-1964 Higher Education 13
Changes in State Funding for Academic Institutions Operations Workforce and Innovation for a Stronger Economy (WISE) Initiative $40,000,000 Deferred Maintenance/General Operations ($40,000,000) Competitive Core Growth/Rapid Growth Funds $6,100,000 STEM Facility, Equipment, and Technology Upgrades $2,000,000 Legislative Amendment for General Operations (Southern University) ($7,500,000) Tobacco Tax Adjustment ($659,588) Louisiana Quality Education Support Fund (8g Funds) $1,000,000 Calcasieu Parish Higher Education Improvement Fund $32,611
Changes in Self-Generated Operations (excluding hospitals) Tuition Increase - LaGrad Act 741 $87,723,162 Align with Projected Collections - LSU A&M and HSC Shreveport Medical School $7,746,204
Other Significant Changes (all MOF) TOPS Adjustment $17,559,885 Nonrecurring Judgment payment for McNeese State University ($1,333,707) Workload Adjustments for LOSFA (Lumina/USA Funds and alignment of expenditures) ($74,656) Lab School MFP Adjustment $1,012,273 LOSFA Carryforwards for Federal funds and Adjustments ($4,432,993)
Changes to Hospitals
Nonrecurring termination pay for LSU hospitals ($4,000,000) Adjustment for public/private partnerships ($116,553,341)
Total Changes ($11,380,150)
Significant Changes FY 14-15 Executive Budget
$973,023
$95,469,366
$96,442,389
$12,730,802
($120,553,341)

House Fiscal Division Higher Education 14
Discretionary/Nondiscretionary Funding in
FY 14-15 Executive Budget
Willis Brewer 225-342-1964
The discretionary State General Fund in Higher Education’s budget is 30.1% of the total discretionary State General Fund recommended for FY 14-15. The non-discretionary State General Fund in Higher Education’s budget is 1.2% of the total non-discretionary State General Fund recommended for FY 14-15.
TOTAL FUNDING -$2,622,006,799 STATE GENERAL FUND -$900,075,117
Activity/Program Discretionary Non-Discretionary Discretionary Non-Discretionary
Board of Regents $917,243,732 $69,367,358 $830,707,759 $69,367,358
Rent in State Owned Buildings $0 $1,434,060 $0 $1,434,060
Retirees' Group Insurance $0 $58,217,716 $0 $58,217,716
Legislator Auditor Fees $0 $6,315,582 $0 $6,315,582
8(g) Replacement with State General Fund (Direct) for the La. Technical College per R.S. 17:3801 (F)
$0 $3,400,000
$0 $3,400,000
Administration $917,243,732 $0 $830,707,759 $0
LA Universities Marine Consortium $9,549,906 $ - $ - $ -
LUMCON Operations $7,419,906 $0 $0 $0
Ancillary-LUMCON $2,130,000 $0 $0 $0
Louisiana Office of Student Financial Assistance $144,628,509 $361,552 $0 $0
Rent in State Owned Buildings $0 $361,552 $0 $0
Administration/Support Services $10,850,753 $0 $0 $0
Loan Operations $53,048,682 $0 $0 $0
Scholarships/Grants $4,026,343 $0 $0 $0
TOPS Tuition $76,702,731 $0 $0 $0
Louisiana State University System $652,013,163 $0 $0 $0
University of Louisiana System $557,144,389 $0 $0 $0
Southern System $86,571,790 $0 $0 $0
Louisiana Community and Technical Colleges System $185,126,400 $0 $0 $0
TOTAL $2,552,277,889 $69,728,910 $830,707,759 $69,367,358
General Fund for all HIED transferred to BOR

House Fiscal Division Higher Education 15
Discretionary/Nondiscretionary Funding in
FY 14-15 Executive Budget
Willis Brewer 225-342-1964
?
State General Fund
$900 Million Discretionary
$830.7 Million
Board of Regents
$830.7 Million
LOSFA
$0
LUMCON
$0
Systems
(LCTC, LSU, SU, UL)
$0
Non-Discretionary
$69.4 Million
Rent in State Owned Buildings
$1.4 Million
Retirees' Group Insurance
$58.2 Million
Legislator Auditor Fees $6.3 Million
8(g) replacement
$3.4 Million Federal
$101.5Million
Statutory Dedications
$232 Million
Self-Generated Revenue
$1.37 Billion Total HIED
Budget
$2.62 Billion
Subtract
$15 Million IAT
(Interagency Transfer Double
Count)
$2.61 Billion
Available

House Fiscal Division Willis Brewer 225-342-1964 Higher Education 16
Mandated Costs
Mandates includes: Retirement (Teachers/Lasers/Other); Group Insurance (Active/Retirees); Legislative Auditor; Office of Risk Management; Civil Service Fees
Excludes LOSFA, LUMCON, BOR, E.A. Conway Medical Center, and Huey P. Long Medical Center
$0
$200,000,000
$400,000,000
$600,000,000
$800,000,000
$1,000,000,000
$1,200,000,000
$1,400,000,000
$1,600,000,000
FY 2008-09 FY 2013-14
Mandated Cost as a Percentage of State Funding
Mandates
Remaining State Funds
29.7% of State Funds
65.4% of State Funds

House Fiscal Division
• $7 million State General Fund & $33 million Overcollections Fund appropriated in FY 14-15 Executive Budget
• House Bill 1033 (Engrossed) provides for a $40 million deposit into the WISE Fund, subject to appropriation by the legislature
• WISE Council is composed of: • Four System Presidents (LCTCS, LSU, UL, and SU) • Commissioner of Higher Education • Executive Director of Louisiana Workforce Commission • Chairman of Workforce Investment Council • Secretary of Department of Economic Development
• Council's Responsibility: – Prepare workforce demand gap analysis and set research priorities
• Statewide and regional degree and certificate production and research priorities • A prioritization of high demand degree and certificate production
– Develops Distribution Methodology • 80% allocated based on degrees and certificates awarded in 4/5 Star jobs defined by Louisiana Workforce
Commission. Degrees are then weighted by cost and priority. • 20% allocated based on research productivity - National Science Foundation (NSF) Federal Research
Expenditures survey • Requires 20% private match to draw funds, for example: cash, donation of technology/construction, facility,
scholarship, internships, sponsorships, endowed faculty, tangible property.
– Approves Institution Implementation Plan – Submits annual reports to certain legislative committees
Willis Brewer 225-342-1964 Higher Education 17
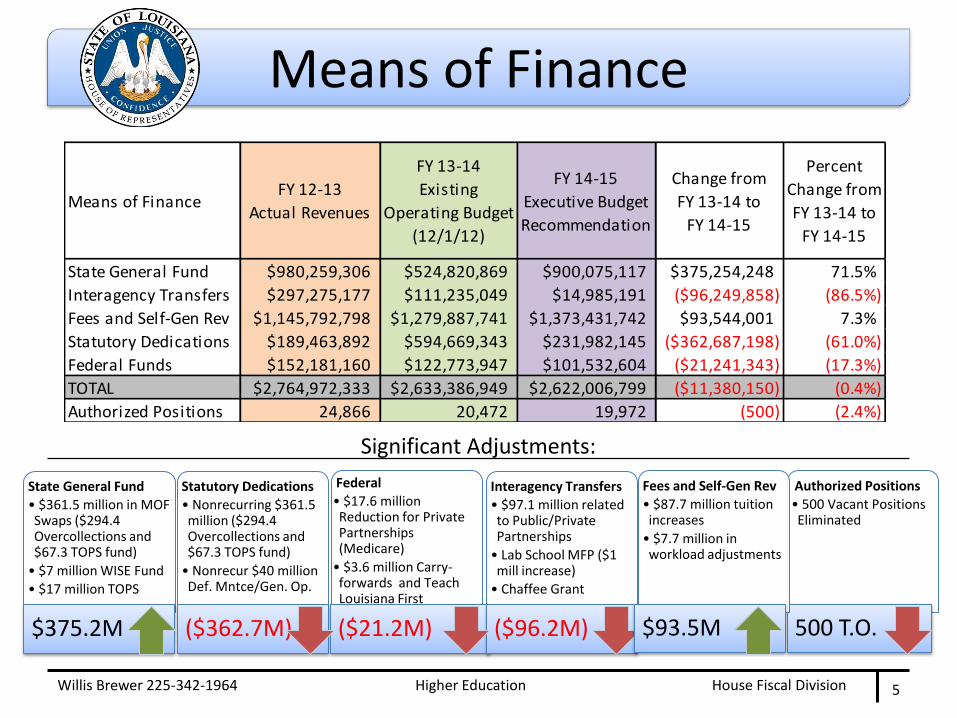
Workforce and Innovation for a Stronger Economy (WISE) Fund
House Fiscal Division
• Competitive Core Funding (Rapid Growth) – $6.1 million in Overcollections – Equity adjustment to address rapid growth at some schools – Schools with lowest state share implementation rate – Preliminary distribution of funds:
• Science, Technology, Engineering and Math (STEM) Facility, Equipment, and Technology Upgrades – $2 million in State General Funds for Southern University
and Grambling State University ($1 million each) Willis Brewer 225-342-1964 Higher Education 18
Additional Higher Education Initiatives
• Bossier Parish Community College - $3,392,249
• Delgado Community College - $612,937
• L.E. Fletcher Tech. Community College - $329,868
• Nunez Community College - $313,024
• River Parishes Community College - $360,610
• Sowela Technical Community College - $1,091,313

House Fiscal Division
Specialized Academic Institutions
• Health Sciences Centers New Orleans
• Health Sciences Centers Shreveport
• LSU and Southern Law Centers
Non-Formula Institutions with no ability to raise tuition
• LSU and Southern Agricultural Centers
• Pennington Biomedical Research Center
• Louisiana Universities Marine Consortium (LUMCON)
• Louisiana Office of Student Financial Assistance (LOSFA)
• Management Boards
Willis Brewer 225-342-1964 Higher Education 19
Non-Formula Institutions

House Fiscal Division
• The Board of Regents formula funding distribution will be equal to the existing FY 13-14 funding with the exception of the Competitive Core Growth funds which was used to address the rapid growth and low state share implementation rate of several schools.
• The following distribution includes the STEM Technology ($2 million) and Competitive Core Growth ($6.1 million) distributions.
• This does not include the WISE Fund distribution.
Willis Brewer 225-342-1964 Higher Education 20
Funding Formula Distribution

House Fiscal Division Willis Brewer 225-342-1964 Higher Education 21
Louisiana Community and Technical Colleges System
FY 08-09
Beginning
Budget
FY 13-14
Existing Budget
FY 14-15
Executive
Budget
$ Change from
FY 14 to FY 15
%
Change
$ Change from
FY 09 to FY 15
%
Change
Baton Rouge Community College 31,816,383 36,783,087 37,748,583 965,496 2.6% 5,932,200 18.6%
Bossier Parish Community College 23,930,182 29,807,256 34,712,005 4,904,749 16.5% 10,781,823 45.1%
Delgado Community College 71,802,647 81,533,700 85,889,137 4,355,437 5.3% 14,086,490 19.6%
L.E. Fletcher Technical Community College 6,648,605 8,020,860 8,795,728 774,868 9.7% 2,147,123 32.3%
Louisiana Delta Community College 6,700,923 17,827,834 18,557,834 730,000 4.1% 11,856,911 176.9%
Louisiana Technical College 93,117,015 17,738,890 18,698,394 959,504 5.4% (74,418,621) -79.9%
Nunez Community College 8,443,905 7,437,000 8,117,524 680,524 9.2% (326,381) -3.9%
River Parishes Community College 4,785,185 7,950,251 8,795,861 845,610 10.6% 4,010,676 83.8%
South Louisiana Community College 12,105,167 26,868,166 28,228,166 1,360,000 5.1% 16,122,999 133.2%
Sowela Technical Community College 11,582,348 12,695,131 14,376,555 1,681,424 13.2% 2,794,207 24.1%
Northshore Technical Community College 0 9,750,969 10,240,969 490,000 5.0% 10,240,969
Central Louisiana Technical Comm. College 0 9,586,870 9,972,870 386,000 4.0% 9,972,870
LCTCS Online 0 1,295,904 1,295,904 0 0.0% 1,295,904
LCTC Board of Supervisors 14,636,397 27,156,540 17,156,540 (10,000,000) -36.8% 2,520,143 17.2%
La. Comm. & Tech. Colleges System 285,568,757 294,452,458 302,586,070 8,133,612 2.8% 17,017,313 6.0%
Total Operating Budget Comparison - Beginning Budget FY 08-09, Existing Operating Budget FY 13-14, and Executive Budget FY 14-15

House Fiscal Division Willis Brewer 225-342-1964 Higher Education 22
Southern University System
FY 08-09
Beginning
Budget
FY 13-14
Existing
Budget
FY 14-15
Executive
Budget
$ Change from
FY 14 to FY 15
%
Change
$ Change from
FY 09 to FY 15
%
Change
Southern Agricultural Center 8,997,364 8,869,292 7,869,292 (1,000,000) -11.3% (1,128,072) -12.5%
Southern Baton Rouge 92,735,078 71,258,158 74,913,673 3,655,515 5.1% (17,821,405) -19.2%
Southern Law Center 11,210,867 12,701,831 13,280,901 579,070 4.6% 2,070,034 18.5%
Southern New Orleans 22,528,577 19,704,483 18,879,895 (824,588) -4.2% (3,648,682) -16.2%
Southern Shreveport 13,518,686 14,325,138 12,825,138 (1,500,000) -10.5% (693,548) -5.1%
Southern Board of Supervisors 3,674,332 14,421,547 1,408,668 (13,012,879) -90.2% (2,265,664) -61.7%
Southern University System 152,664,904 141,280,449 129,177,567 (12,102,882) -8.6% (23,487,337) -15.4%
Revised on 4/8/2014

House Fiscal Division Willis Brewer 225-342-1964 Higher Education 23
University of Louisiana System
FY 08-09
Beginning
Budget
FY 13-14
Existing Budget
FY 14-15
Executive
Budget
$ Change from
FY 14 to FY 15
%
Change
$ Change from
FY 09 to FY 15
%
Change
Grambling State 57,743,468 50,276,303 52,861,992 2,585,689 5.1% (4,881,476) -8.5%
Louisiana Tech 104,172,154 95,528,693 100,928,837 5,400,144 5.7% (3,243,317) -3.1%
McNeese State 72,659,684 61,276,822 62,938,958 1,662,136 2.7% (9,720,726) -13.4%
Nicholls State 59,829,497 52,497,115 53,956,342 1,459,227 2.8% (5,873,155) -9.8%
Northwestern State 79,754,203 69,495,483 72,725,377 3,229,894 4.6% (7,028,826) -8.8%
Southeastern Louisiana 127,633,111 108,509,686 113,818,064 5,308,378 4.9% (13,815,047) -10.8%
University of Louisiana - Lafayette 152,130,300 131,349,559 136,126,210 4,776,651 3.6% (16,004,090) -10.5%
University of Louisiana - Monroe 88,169,545 72,980,996 75,011,217 2,030,221 2.8% (13,158,328) -14.9%
University of New Orleans 124,719,036 106,606,773 109,459,658 2,852,885 2.7% (15,259,378) -12.2%
University of LA Board of Supervisors 10,356,565 3,248,112 3,248,112 0 0.0% (7,108,453) -68.6%
University of LA System 877,167,563 751,769,542 781,074,767 29,305,225 3.9% (96,092,796) -11.0%
Total Operating Budget Comparison - Beginning Budget FY 08-09, Existing Operating Budget FY 13-14, and Executive Budget FY 14-15

House Fiscal Division Willis Brewer 225-342-1964 Higher Education 24
Louisiana State University System
FY 08-09
Beginning
Budget
FY 13-14
Existing Budget
FY 14-15
Executive
Budget
$ Change from
FY 14 to FY 15
%
Change
$ Change from
FY 09 to FY 15
%
Change
LSU and A & M College 451,275,826 453,039,581 475,667,906 22,628,325 5.0% 24,392,080 5.4%
Paul M. Hebert Law Center 20,631,766 24,145,145 24,659,437 514,292 2.1% 4,027,671 19.5%
Pennington Biomedical Research Center 17,150,614 14,275,607 13,275,607 (1,000,000) -7.0% (3,875,007) -22.6%
LSU Agricultural Center 112,433,303 90,331,084 89,344,671 (986,413) -1.1% (23,088,632) -20.5%
LSU Shreveport 32,331,513 29,101,928 30,083,442 981,514 3.4% (2,248,071) -7.0%
LSU at Alexandria 21,248,479 16,262,900 16,782,877 519,977 3.2% (4,465,602) -21.0%
LSU Eunice 14,040,274 12,793,598 12,807,249 13,651 0.1% (1,233,025) -8.8%
LSU Health Sciences Center-New Orleans 200,022,502 170,177,707 172,004,429 1,826,722 1.1% (28,018,073) -14.0%
LSU Health Sciences Center-Shreveport 423,693,958 213,907,521 124,835,147 (89,072,374) -41.6% (298,858,811) -70.5%
EA Conway 89,695,385 18,293,582 2,999,765 (15,293,817) -83.6% (86,695,620) -96.7%
Huey P. Long 60,619,144 11,535,382 0 (11,535,382) -100.0% (60,619,144) -100.0%
LSU Board and System Office 10,662,973 3,495,054 3,495,054 0 0.0% (7,167,919) -67.2%
LSU System 1,453,805,737 1,057,359,089 965,955,584 (91,403,505) -8.6% (487,850,153) -33.6%LSU System without Hospitals 985,109,579 914,839,388 962,955,819 48,116,431 5.3% (22,153,760) -2.2%
Total Operating Budget Comparison - Beginning Budget FY 08-09, Existing Operating Budget FY 13-14, and Executive Budget FY 14-15

House Fiscal Division Willis Brewer 225-342-1964 Higher Education 25
BOR, LUMCON, and LOSFA
FY 08-09
Beginning
Budget
FY 13-14
Existing Budget
FY 14-15
Executive
Budget
$ Change from
FY 14 to FY 15 % Change
$ Change from
FY 09 to FY 15 % Change
Board of Regents* 126,506,352 60,679,593 61,607,305 927,712 1.5% (64,899,047) -51.3%
Louisiana Universities Marine Consortium 9,211,071 11,885,758 11,885,758 0 0.0% 2,674,687 29.0%
Louisiana Office of Student Financial Assistance (LOSFA)
Administration / Support Services 7,204,319 14,691,845 11,212,305 (3,479,540) -23.7% 4,007,986 55.6%
Loan Operations 35,589,481 53,048,682 53,048,682 0 0.0% 17,459,201 49.1%
Scholarships / Grants 36,236,823 30,686,724 30,366,068 (320,656) -1.0% (5,870,755) -16.2%
TOPS Tuition 119,772,573 217,532,809 235,092,694 17,559,885 8.1% 115,320,121 96.3%
LOSFA Total 198,803,196 315,960,060 329,719,749 13,759,689 4.4% 130,916,553 65.9%
Total Operating Budget Comparison - Beginning Budget FY 08-09, Existing Operating Budget FY 13-14, and Executive Budget FY 14-15
* Excluding $40 million WISE Fund in FY 14-15

House Fiscal Division Higher Education 26
Salaries and Positions
Willis Brewer 225-342-1964
EOB FY 13-14 SALARIES
$1.16 billion for Salaries and Other Compensation
$455 million for Related Benefits
Total Personal Services = $1.6 billion; 83.4% of Higher Education’s total Existing Operating Budget (excluding Other Charges)
FY 14-15 POSITIONS
19,972 Authorized Positions (5,157 classified and 14,815 unclassified)
0 full-time non-T.O. positions
0 Other Charges positions
As of 12/27/2013, Higher Education had 1,825 vacancies. The Executive Budget eliminates 500 of these vacancies.

House Fiscal Division Higher Education 27
Salaries and Positions
Willis Brewer 225-342-1964
Source: Prepared by House Fiscal Division staff using information from ISIS-HR and Civil Service
33,863
31,661
32,174
33,464
33,458
33,585 30,091
29,452
27,846
0
5,000
10,000
15,000
20,000
25,000
30,000
35,000
40,000
2005 2006 2007 2008 2009 2010 2011 2012 2013
TOTAL FULL-TIME EQUIVALENT (FTE) POSITIONS
Change % Change
2005 2013 05 to 13 05 to 13
HI ED 33,863 27,846 (6,017) (17.8%)
TOTAL 90,253 65,289 (24,964) (27.7%)
FULL-TIME EQUIVALENT POSITIONS

House Fiscal Division Higher Education 28
Salaries and Positions
Willis Brewer 225-342-1964
Source: Prepared by House Fiscal Division staff using information from ISIS-HR and Civil Service
$32,546
$44,063
$0
$10,000
$20,000
$30,000
$40,000
$50,000
$60,000
$70,000
$80,000
CLASSIFIED AVERAGE ANNUAL PAY PER FTE
House Fiscal Division Higher Education 29
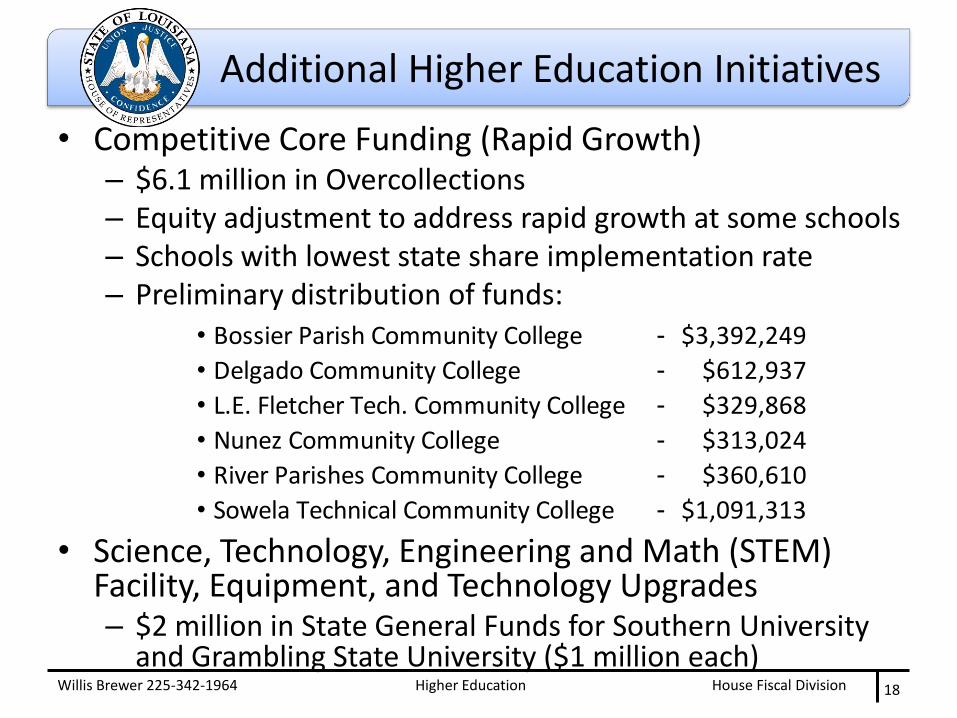
Salaries and Positions
Willis Brewer 225-342-1964
Source: Prepared by House Fiscal Division staff using information from ISIS-HR and Civil Service
$62,491 $62,531
$0
$20,000
$40,000
$60,000
$80,000
$100,000
$120,000
$140,000
$160,000
$180,000
$200,000
UNCLASSIFIED AVERAGE ANNUAL PAY PER FTE

House Fiscal Division Higher Education 30
Positions
Willis Brewer 225-342-1964
Source: Prepared by House Fiscal Division staff using BOR Fall Employee Salary Database; data as of November 1 of each Fiscal Year.
Employee Classification 2008-09 2009-10 2010-11 2011-12 2012-13 2013-14 09 to 14 # Change
09 to 14 % Change
Executive, Administrative, Managerial 2,395 2,170 1,829 1,780 1,920 1,837 (558) -23.3%
Faculty 10,607 10,274 10,233 10,078 9,804 9,606 (1,001) -9.4%
Professionals (support/service) 9,211 9,261 9,095 8,988 8,732 7,678 (1,533) -16.6%
Technical and paraprofessionals 4,218 4,123 3,816 3,832 3,820 3,170 (1,049) -24.9%
Clerical and secretarial 3,674 3,519 3,480 3,333 3,164 2,598 (1,077) -29.3%
Skilled Crafts 1,104 1,110 872 803 825 709 (395) -35.8%
Service/Maintenance 2,919 2,730 2,692 2,598 2,471 1,976 (942) -32.3%
Total Full-time Equivalent Employees 34,128 33,187 32,017 31,412 30,735 27,574 (6,554) -19.2%
Total Full Time Equivalent (FTE) Employee Positions Higher Education (excluding E.A. Conway, Huey P. Long, and LOSFA)

House Fiscal Division Higher Education 31
Salaries
Willis Brewer 225-342-1964
Source: Prepared by House Fiscal Division staff using BOR Fall Employee Salary Database; data as of November 1 of each Fiscal Year.
Employee Classification 2008-09 2009-10 2010-11 2011-12 2012-13 2013-14 09 to 14 $
Change 09 to 14
% Change
Executive, Administrative, Managerial $86,319 $89,824 $93,254 $94,476 $92,172 $93,127 $6,808 7.9%
Faculty $62,494 $63,346 $62,836 $61,854 $62,998 $63,238 $744 1.2%
Professionals (support/service) $47,844 $48,067 $48,599 $48,728 $49,371 $51,164 $3,320 6.9%
Technical and paraprofessionals $30,243 $31,245 $31,949 $30,895 $30,701 $27,757 ($2,485) -8.2%
Clerical and secretarial $29,091 $29,845 $29,575 $29,445 $29,677 $30,670 $1,579 5.4%
Skilled Crafts $36,307 $37,111 $37,882 $37,782 $37,167 $37,635 $1,328 3.7%
Service/Maintenance $22,857 $23,820 $24,461 $24,153 $24,272 $25,403 $2,546 11.1%
Average Salary $48,392 $49,143 $49,326 $48,997 $49,697 $51,350 $2,958 6.1%
Average Annual Salary Higher Education (excluding E.A. Conway, Huey P. Long, and LOSFA)

House Fiscal Division Willis Brewer 225-342-1964 Higher Education 32
National Faculty Salary Comparisons 4-Year Institutions – All Ranks
Source: Prepared by House Fiscal Division staff using the Integrated Postsecondary Education Data System (IPEDS) Data Center; data includes all faculty ranks.
$64,612 $65,133 $65,562 $65,558 $66,140
$75,421 $76,419 $77,183 $78,291 $81,653
$0
$10,000
$20,000
$30,000
$40,000
$50,000
$60,000
$70,000
$80,000
$90,000
2008-09 2009-10 2010-11 2011-12 2012-13
Louisiana US Average
FY 12-13 compared to FY 08-09
$ Change % Change
Louisiana $1,528 2.4%
US Average $6,233 8.3%

House Fiscal Division Willis Brewer 225-342-1964 Higher Education 33
National Faculty Salary Comparisons 4-Year Institutions by Academic Rank
Source: Prepared by House Fiscal Division staff using the Integrated Postsecondary Education Data System (IPEDS) Data Center.
$91,740
$69,204
$57,822 $52,991
$42,265
$103,160
$74,933
$62,863
$50,082 $45,500
$92,667
$59,419
$53,936
$42,308
$112,815
$80,392
$68,277
$52,710 $49,395
$0
$20,000
$40,000
$60,000
$80,000
$100,000
$120,000
Professor Associate professor
Assistant professor
Lecturer Instructor Professor Associate professor
Assistant professor
Lecturer Instructor
Louisiana US Average
Louisiana United States Average
$68,053
FY 08-09 FY 12-13
FY 08-09 FY 12-13

House Fiscal Division Willis Brewer 225-342-1964 Higher Education 34
National Faculty Salary Comparisons 2-Year & below Institutions – All Ranks
Source: Prepared by House Fiscal Division staff using the Integrated Postsecondary Education Data System (IPEDS) Data Center; data includes all faculty ranks.
$49,099 $48,139 $45,843 $45,675 $44,984
$60,709 $61,410 $61,278 $61,527 $63,382
$0
$10,000
$20,000
$30,000
$40,000
$50,000
$60,000
$70,000
2008-09 2009-10 2010-11 2011-12 2012-13
Louisiana US Average
FY 12-13 compared to FY 08-09
$ Change % Change
Louisiana -$4,114 -8.4%
US Average $2,673 4.4%

House Fiscal Division Willis Brewer 225-342-1964 Higher Education 35
National Faculty Salary Comparisons 2-Year & Below Institutions by Academic Rank
Source: Prepared by House Fiscal Division staff using the Integrated Postsecondary Education Data System (IPEDS) Data Center.
$74,403
$57,567
$52,930
$43,107
$25,000
$71,067
$59,602 $53,636
$63,485
$43,822
$28,182
$73,197
$62,706
$55,640
$64,773
$51,895
$0
$10,000
$20,000
$30,000
$40,000
$50,000
$60,000
$70,000
$80,000
Professor Associate professor
Assistant professor
Instructor Lecturer Professor Associate professor
Assistant professor
Instructor Lecturer
Louisiana US Average
Louisiana United States Average
FY 08-09 FY 12-13
FY 08-09 FY 12-13
$51,426
$51,426
$39,856
$65,371

House Fiscal Division Willis Brewer 225-342-1964 Higher Education 36
Public, 4-Year Annual Undergraduate Tuition and Fees
$0
$1,000
$2,000
$3,000
$4,000
$5,000
$6,000
$7,000
$8,000
2005-06 2006-07 2007-08 2008-09 2009-10 2010-11 2011-12 2012-13
Louisiana US Average
LA +/- US ($1,489), or -29.8%
LA +/- US ($1,999), or -26.7%
Source: Prepared by House Fiscal Division staff using the Integrated Postsecondary Education Data System (IPEDS) Data Center.

House Fiscal Division
$0
$500
$1,000
$1,500
$2,000
$2,500
$3,000
$3,500
$4,000
2005-06 2006-07 2007-08 2008-09 2009-10 2010-11 2011-12 2012-13
$1,234 $1,314 $1,368 $1,454 $1,515
$1,973
$2,272
$2,696
Louisiana US Average
Willis Brewer 225-342-1964 Higher Education 37
Public, 2-Year and below Annual Undergraduate Tuition and Fees
Source: Prepared by House Fiscal Division staff using the Integrated Postsecondary Education Data System (IPEDS) Data Center.
LA +/- ($1,477), or -54.5%
LA +/- ($911), or -25.3%

House Fiscal Division Willis Brewer 225-342-1964 Higher Education 38
Comparison of Annual Percentage Changes of Annual Tuition and Mandatory Fees
4.6%
2.6%
5.8%
6.5% 6.2%
7.4%
4.0% 5.5%
1.8%
5.3%
9.9%
10.6%
11.7%
0.0%
2.0%
4.0%
6.0%
8.0%
10.0%
12.0%
14.0%
2005-06 2006-07 2007-08 2008-09 2009-10 2010-11 2011-12 2012-13
US Avg, Public, 2-year US Avg, Public, 4-year Louisiana 4-yr
BOR 3-4-5 Tuition Plan
LaGrad Act
Source: Prepared by House Fiscal Division staff using the Integrated Postsecondary Education Data System (IPEDS) Data Center.

House Fiscal Division
• Currently, no decision has been made by any system/institution whether to increase tuition for Fiscal Year 14-15.
• Institutions have to consider the following issues:
– Enrollment
– SREB Eligibility
– Student Accessibility
Willis Brewer 225-342-1964 Higher Education 39
Tuition Increases

House Fiscal Division Willis Brewer 225-342-1964 Higher Education 40
Headcount Enrollment
Source: Prepared by House Fiscal Division staff using the Integrated Postsecondary Education Data System (IPEDS) Data Center.
13
9,5
85
14
9,7
87
14
0,8
94
15
5,0
86
14
1,5
72
15
8,2
23
14
0,9
72
15
9,9
13
13
9,2
53
16
0,0
18
0
20,000
40,000
60,000
80,000
100,000
120,000
140,000
160,000
180,000
Louisiana US Average
Four Year Institutions
2008 2009 2010 2011 2012
51
,57
7
12
5,8
20
58
,96
3
13
7,3
50
79
,70
1
14
0,9
54
80
,59
4
13
9,0
52
78
,04
2
13
5,6
46
Louisiana US Average
Two Year and Below Institutions
2008 2009 2010 2011 2012

House Fiscal Division Willis Brewer 225-342-1964 Higher Education 41
Funding per FTE Student Public, Four-Year Institutions
Source: Prepared by House Fiscal Division staff using the Integrated Postsecondary Education Data System (IPEDS) Data Center.
$5,225 $5,233
$5,644 $6,646
$8,096 $8,099
$5,661
$5,541 $5,218
$3,195 $3,507
$3,824
$3,834
$3,861 $4,071
$4,268 $4,618
$5,249 $8,419 $8,740
$9,468
$10,480
$11,957 $12,170
$9,929 $10,159
$10,467
$0
$2,000
$4,000
$6,000
$8,000
$10,000
$12,000
$14,000
$16,000
2003-04 2004-05 2005-06 2006-07 2007-08 2008-09 2009-10 2010-11 2011-12
Louisiana Average
State Appropriations per FTE Student Net Tuition and Fees per FTE Student
$6,552 $6,599
$6,928
$7,307
$7,760
$7,166 $6,548
$6,463
$5,952
$4,612
$5,027 $5,459
$5,752
$6,079 $6,394
$6,638
$7,030
$7,631 $11,164 $11,627
$12,387 $13,059
$13,839 $13,560
$13,187 $13,493
$13,583
2003-04 2004-05 2005-06 2006-07 2007-08 2008-09 2009-10 2010-11 2011-12
United States Average
State Appropriations per FTE Student Net Tuition and Fees per FTE Student
House Fiscal Division
$0 $5,000 $10,000 $15,000 $20,000 $25,000
Wyoming
Connecticut
New Jersey
Iowa
Illinois
Alabama
Minnesota
Maine
Delaware
California
Kentucky
Rhode Island
Ohio
New York
US Average
Missouri
Washington
Idaho
Oklahoma
Mississippi
Texas
Georgia
Utah
Pennsylvania
Louisiana
Florida
State Appropriations per FTE Student
Net Tuition and Fees per FTE Student
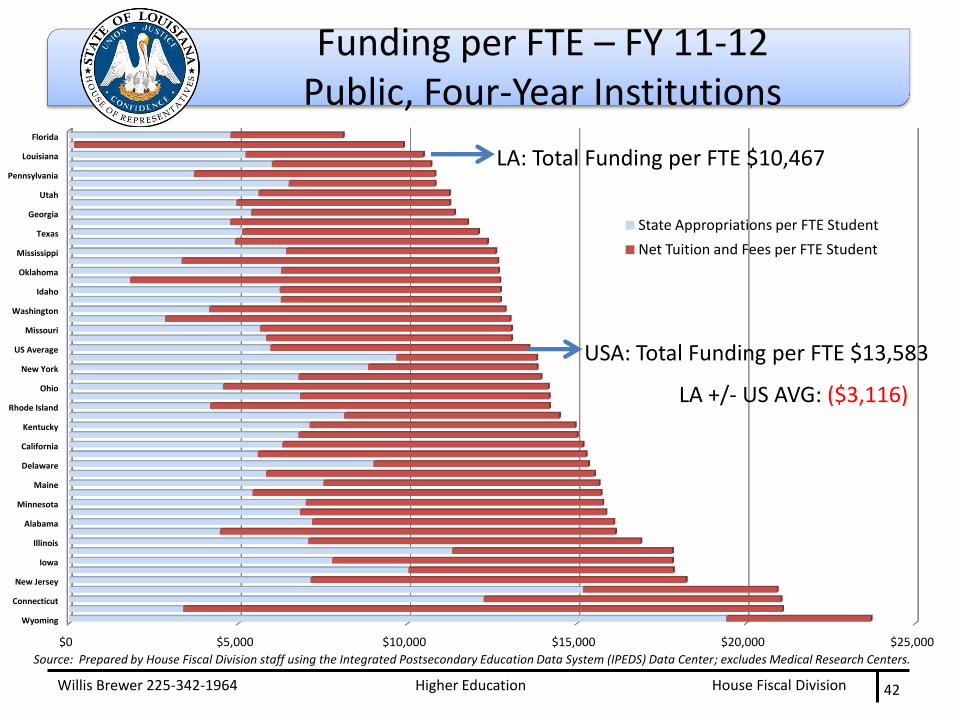
Willis Brewer 225-342-1964 Higher Education 42
Funding per FTE – FY 11-12 Public, Four-Year Institutions
LA: Total Funding per FTE $10,467
USA: Total Funding per FTE $13,583
LA +/- US AVG: ($3,116)
Source: Prepared by House Fiscal Division staff using the Integrated Postsecondary Education Data System (IPEDS) Data Center; excludes Medical Research Centers.

House Fiscal Division Willis Brewer 225-342-1964 Higher Education 43
Funding per FTE Student Two-Year and Below Institutions
Source: Prepared by House Fiscal Division staff using the Integrated Postsecondary Education Data System (IPEDS) Data Center; two-year institutions include two-year and below two-year institutions.
$2,627
$2,700
$3,765
$4,120
$4,351
$4,269
$2,950
$2,746
$2,555
$1,135
$1,310
$1,388
$1,952
$1,848 $1,619
$1,244 $1,575
$1,833 $3,762
$4,011
$5,153
$6,072 $6,199 $5,887
$4,194 $4,320 $4,388
$0
$1,000
$2,000
$3,000
$4,000
$5,000
$6,000
$7,000
2003-04 2004-05 2005-06 2006-07 2007-08 2008-09 2009-10 2010-11 2011-12
Louisiana Average
$2,714
$2,902
$3,156
$3,395
$3,492
$3,220
$2,758
$2,725 $2,691
$1,607
$1,670 $1,788
$1,890
$1,887 $1,887
$1,842 $1,856
$1,987
$4,320 $4,572
$4,944
$5,285 $5,379
$5,107
$4,600 $4,581
$4,678
2003-04 2004-05 2005-06 2006-07 2007-08 2008-09 2009-10 2010-11 2011-12
United States Average
State Appropriations per FTE Student
Net Tuition and Fees per FTE Student

House Fiscal Division Willis Brewer 225-342-1964 Higher Education 44
Funding per FTE – FY 11-12 Public, Two-Year and Below Institutions
$0 $2,000 $4,000 $6,000 $8,000 $10,000 $12,000 $14,000
Alaska
New Hampshire
Connecticut
Hawaii
Rhode Island
Vermont
Minnesota
Montana
Utah
Alabama
Tennessee
Ohio
Georgia
Maine
Virginia
Iowa
US Average
Florida
Kansas
Louisiana
New Mexico
South Carolina
California
Michigan
Missouri
Arizona
State Appropriations per FTE Student
Net Tuition and Fees per FTE Student
LA: Total Funding per FTE $4,388
USA: Total Funding per FTE $4,678
LA +/- US AVG: ($290)
Source: Prepared by House Fiscal Division staff using the Integrated Postsecondary Education Data System (IPEDS) Data Center; two-year institutions include two-year and below two-year institutions.

House Fiscal Division Willis Brewer 225-342-1964 Higher Education 45
Historical State and Net Tuition Funding Trend – 4-Year Institutions
Source: Prepared by House Fiscal Division staff using the Integrated Postsecondary Education Data System (IPEDS) Data Center; data includes State Appropriations and Net Tuition and Fees.
$11,552
$13,583
$7,702
$10,467
$0
$2,000
$4,000
$6,000
$8,000
$10,000
$12,000
$14,000
$16,000
1999-00 2000-01 2001-02 2002-03 2003-04 2004-05 2005-06 2006-07 2007-08 2008-09 2009-10 2010-11 2011-12
US Average - Total State & Net Tuition Funding per FTE
Louisiana - Total State & Net Tuition Funding per FTE
LA -32.5% less than US Average
LA -10.1% less than US Average
LA -22.9% less than US Average
LA -23.5% less than US Average

House Fiscal Division Willis Brewer 225-342-1964 Higher Education 46
Taylor Opportunity Program for Students (TOPS)
0
10,000
20,000
30,000
40,000
50,000
60,000
$0
$50,000,000
$100,000,000
$150,000,000
$200,000,000
$250,000,000
$300,000,000
$350,000,000
$400,000,000
Nu
mb
er
of
Aw
ard
s
Total $ of Awards Total # of Awards
Actual Amounts
FY 2009 Average Award : $2,855
FY 2013 Average Award : $4,053
FY 2002 Average Award : $2,497
TOPS Fully Implemented
Projected Amounts
Source: Prepared by House Fiscal Division staff using Louisiana Office of Student Financial Assistance (LOSFA) website and Budget Request Projections.
Change b/w 2009 and 2002:
$358, or 14.3%
Change b/w 2013 and 2009:
$1,198, or 41.9%
LaGrad Act

House Fiscal Division Willis Brewer 225-342-1964 Higher Education 47
Go Grants
$16,969,425
$25,848,548 $25,111,788
10,461
30,797
36,201
0
5,000
10,000
15,000
20,000
25,000
30,000
35,000
40,000
$0
$5,000,000
$10,000,000
$15,000,000
$20,000,000
$25,000,000
$30,000,000
2007-08 2008-09 2009-10 2010-11 2011-12 2012-13
Nu
mb
er
of
Aw
ard
s
Fun
din
g
$ Awards # Awards
FY 2009 Average Award : $1,517
FY 2013 Average Award :
$730
FY 2014 Award will range from $300 - $3,000 based
on student need
Source: Prepared by House Fiscal Division staff using Louisiana Office of Student Financial Assistance (LOSFA) website and Budget Request.
FY 2015 Estimated $13.7 million
additional amount needed.

House Fiscal Division Willis Brewer 225-342-1964 Higher Education 48
Actual Educational and General Expenditures by Function
Source: BOR-1 Actuals; excludes LSU HSC Shreveport Hospital, EA Conway, Huey P. Long, and LOSFA.
2008-09 2009-10 2010-11 2011-12 2012-13 $ Change %
Change
Instruction $926,063,191 $868,800,621 $882,918,123 $861,003,040 $824,670,100 ($101,393,091) (10.9%)
Research $207,438,440 $192,796,732 $187,035,996 $181,581,654 $174,888,981 ($32,549,459) (15.7%)
Public Service $73,249,186 $63,533,123 $60,142,159 $57,991,157 $55,219,162 ($18,030,024) (24.6%)
Academic Support $212,405,601 $191,905,211 $204,800,505 $200,038,346 $195,441,410 ($16,964,191) (8.0%)
Student Services $89,602,372 $84,011,949 $89,355,130 $88,618,799 $86,480,788 ($3,121,584) (3.5%)
Institutional Support $403,755,871 $355,995,504 $348,962,499 $328,044,165 $298,297,008 ($105,458,864) (26.1%)
Scholarships/ Fellowships $104,963,748 $116,117,161 $135,976,321 $151,706,009 $154,559,622 $49,595,874 47.3%
Plant Operations/ Maintenance $255,357,098 $239,445,217 $256,494,739 $236,038,265 $219,483,173 ($35,873,925) (14.0%)
Total E&G Expenditures $2,272,835,498 $2,112,605,515 $2,165,685,463 $2,105,021,438 $2,009,040,243 ($263,795,255) (11.6%)

House Fiscal Division Higher Education 49
Department Contacts
Willis Brewer 225-342-1964
AGENCY Agency Head Phone
Board of Regents Mr. W. Clinton “Bubba” Rasberry, Jr. 225-342-4253
Louisiana Universities Marine Consortium Dr. Nancy Rabalais 985-851-2800
Louisiana Office of Student Financial Assistance Dr. Suanne Boutte' 225-219-1012
Louisiana State University System Dr. F. King Alexander 225-578-2111
University of Louisiana System Dr. Sandra Woodley 225-342-6950
Southern University System Dr. Ronald Mason 225-771-4500
Louisiana Community and Technical Colleges System Dr. Monty Sullivan 225-922-1643

![Renewable Energy Cost Power Point.pptx [Read-Only]house.louisiana.gov/rc/pdf/0215_13_RenewableEnergyCostPowerPoint.pdf · LPSC Renewable Energy Pilot yRFPs issued by Utility Companies](https://static.fdocuments.net/doc/165x107/5d537d8388c993337f8b774b/renewable-energy-cost-power-pointpptx-read-onlyhouse-lpsc-renewable-energy.jpg)