
Fuzzy Logic based fault detection in induction machines...
18
IJCSNS International Journal of Computer Science and Network Security, VOL.9 No.9, September 2009 226 Manuscript received September 5, 2009 Manuscript revised September 20, 2009 Fuzzy Logic based fault detection in induction machines using Lab view R.SaravanaKumar † K.Vinoth Kumar † Dr. K.K.Ray †† VIT University,vellore,INDIA, Karunya University, Coimbatore, INDIA, VIT University,vellore,INDIA Summary The main objectives of this paper are to perform fault analysis on an induction motor using both experiments and simulation, and to study failure identification techniques applied for condition monitoring of the motor and finally to design an On-line condition monitoring system with fuzzy logic controller using LabView. The work in this paper was divided into two phases. The phase one was concerned with the modeling of three-phase induction motor in three phase reference frame using Matlab/Simulink and designing an intelligent system for condition monitoring of the motors. The phase two concerned with the implementation of On-line condition monitoring system through LabView. Key words: Condition monitoring, induction motor, Lab view, fuzzy logic. 1. Introduction The three phase Induction motors due to their simple construction, high reliability and low cost, have dominated in the field of electromechanical energy conversion by having more than 75% of motors in use. Though the probability of breakdowns of Induction motors is very low, the fault diagnosis has become almost indispensable. Particularly when they are working in sophisticated automated production lines. To decrease the machine down time and improve stability on line diagnostic features are to be necessarily incorporated with the drives. In modern industry lots of machines depend on mutual operation, and the cost of unexpected breakdowns is very high. Thus condition monitoring techniques comprising of fault diagnosis and prognosis are of great concern in industry and are gaining increasing attention. A three-phase Induction motors may experience several types of fault conditions which include Over load, Ground fault, Line to Line fault, Unbalanced supply voltage, Over voltage, Under voltage, Single phasing, Turn to Turn fault. When one of the three-phase to the motor is open, single phasing situation occurs. This result increased positive and negative sequence currents and hence excessive heating. Unbalance supply voltage results in negative sequence voltage. It leads to increase in positive and negative sequence current components. Ground and line faults are prevalent in motors than other power system devices. These faults are detected by observing the zero sequence current. Similarly Turn to Turn short and coil open faults can cause current unbalance. From the foregoing analysis it is clear that the appearance of various faults is simply determined by the stator current values. In general stator currents and voltages are preferred because the sensors required are usually present in the drive considered. The conventional monitoring systems have a number of limitations such as inflexible, high cost, hardware limitations which are heavily dependent upon specialized instruments. In recent years the monitoring and fault detection of electrical machines have moved from traditional techniques to Artificial intelligence and virtual instrumentation techniques. But the Virtual instrumentation approach helps us to get rid of the above said drawbacks. In addition to this, additional scientific visualizations and advanced analysis can also be added in the form of virtual instruments with minimal cost. Because of its over all versatility as an engineering tool, the software package Lab View is chosen in most of the engineering problems. In this paper Condition monitoring system for Induction motor has been developed in both simulation model (Matlab/Simulink) as well as in real time (LabView). For the past fifteen years there has been a substantial amount of research into the creation of new Condition Monitoring techniques for Induction Motor drives. New methods have been developed which are now being used in industries and research is continuing with the development of new and alternative on-line diagnostic techniques. However it is still the end users who have to make the selection of most appropriate and effective monitoring system to suit their particular Induction Motor drive systems. The possible detection methods to identify the motor faults are listed as follows. 1. Vibration Monitoring. 2. Motor Current Signature Analysis (MCSA). 3. Electromagnetic field monitoring using search coils. 4. Chemical analysis (Lubricating oil debris, Cooling gas).
Transcript of Fuzzy Logic based fault detection in induction machines...
IJCSNS International Journal of Computer Science and Network Security, VOL.9 No.9, September 2009
226
Manuscript received September 5, 2009 Manuscript revised September 20, 2009
Fuzzy Logic based fault detection in induction machines using Lab view
R.SaravanaKumar† K.Vinoth Kumar† Dr. K.K.Ray†† VIT University,vellore,INDIA, Karunya University, Coimbatore, INDIA, VIT University,vellore,INDIA Summary The main objectives of this paper are to perform fault analysis on an induction motor using both experiments and simulation, and to study failure identification techniques applied for condition monitoring of the motor and finally to design an On-line condition monitoring system with fuzzy logic controller using LabView. The work in this paper was divided into two phases. The phase one was concerned with the modeling of three-phase induction motor in three phase reference frame using Matlab/Simulink and designing an intelligent system for condition monitoring of the motors. The phase two concerned with the implementation of On-line condition monitoring system through LabView.
Key words: Condition monitoring, induction motor, Lab view, fuzzy logic.
1. Introduction
The three phase Induction motors due to their simple construction, high reliability and low cost, have dominated in the field of electromechanical energy conversion by having more than 75% of motors in use. Though the probability of breakdowns of Induction motors is very low, the fault diagnosis has become almost indispensable. Particularly when they are working in sophisticated automated production lines. To decrease the machine down time and improve stability on line diagnostic features are to be necessarily incorporated with the drives. In modern industry lots of machines depend on mutual operation, and the cost of unexpected breakdowns is very high. Thus condition monitoring techniques comprising of fault diagnosis and prognosis are of great concern in industry and are gaining increasing attention. A three-phase Induction motors may experience several types of fault conditions which include Over load, Ground fault, Line to Line fault, Unbalanced supply voltage, Over voltage, Under voltage, Single phasing, Turn to Turn fault. When one of the three-phase to the motor is open, single phasing situation occurs. This result increased positive and negative sequence currents and hence excessive heating. Unbalance supply voltage results in negative sequence voltage. It leads to increase in positive and negative sequence current components. Ground and line faults are
prevalent in motors than other power system devices. These faults are detected by observing the zero sequence current. Similarly Turn to Turn short and coil open faults can cause current unbalance.
From the foregoing analysis it is clear that the appearance of various faults is simply determined by the stator current values. In general stator currents and voltages are preferred because the sensors required are usually present in the drive considered. The conventional monitoring systems have a number of limitations such as inflexible, high cost, hardware limitations which are heavily dependent upon specialized instruments. In recent years the monitoring and fault detection of electrical machines have moved from traditional techniques to Artificial intelligence and virtual instrumentation techniques. But the Virtual instrumentation approach helps us to get rid of the above said drawbacks. In addition to this, additional scientific visualizations and advanced analysis can also be added in the form of virtual instruments with minimal cost. Because of its over all versatility as an engineering tool, the software package Lab View is chosen in most of the engineering problems. In this paper Condition monitoring system for Induction motor has been developed in both simulation model (Matlab/Simulink) as well as in real time (LabView). For the past fifteen years there has been a substantial amount of research into the creation of new Condition Monitoring techniques for Induction Motor drives. New methods have been developed which are now being used in industries and research is continuing with the development of new and alternative on-line diagnostic techniques. However it is still the end users who have to make the selection of most appropriate and effective monitoring system to suit their particular Induction Motor drive systems. The possible detection methods to identify the motor faults are listed as follows. 1. Vibration Monitoring. 2. Motor Current Signature Analysis (MCSA). 3. Electromagnetic field monitoring using search coils. 4. Chemical analysis (Lubricating oil debris, Cooling
gas).

IJCSNS International Journal of Computer Science and Network Security, VOL.9 No.9, September 2009
227
5. Temperature measurement. 6. Infrared measurement. 7. Acoustic noise measurement. 8. Radio frequency emission monitoring. 9. Partial Discharge measurement. The Fig. 2.1 presents an overview of problems and possible On-line monitoring techniques. The focus has been on the use of On-line condition monitoring to detect degradation processes and failure mechanisms. It is necessary to treat each induction motor drive as a unique entity and the potential failure modes fundamental causes, mechanical load characteristics, and operation conditions have all to be taken into consideration when a condition monitoring system is being selected.
Fig. 1. Problems, Failures and Possible on-line Monitoring Techniques for Induction Motor Drives
Failure of insulation between winding and ground can cause large ground current, which would result in irreversible damage to the core of the machine. If the fault is detected at an early stage, the machine can be put back into service by just rewinding the stator on the other hand, replacing the motor means increased downtime. Typical protection for stator insulation failure in an industrial environment includes the use of ground fault relays and negative sequence or phase current balance relays would cause nonsense trips with unbalanced line voltages. Ground fault relays would not be effective for early fault detection. Sensor less methods for detection of turn-faults are based on monitoring the line currents and voltages for an electrical asymmetry caused by turn-turn short circuits in the winding. For line connected machines, the negative sequence current is the fundamental fault signature for a winding fault.
Fig. 2. Three phase Stator Winding
1.1 LOW/MEDIUM VOLTAGE
4.1kv AND BELOW STATOR WINDING
PROBLEMS
1.1.1 INSULATION BREAKDOWN • SHORTED
TURNS • SHORTED
COILS • OPEN COIL • LINE TO
GROUND SHORT
MCSA AND
VIBRATION ANALYSIS
BROKEN ROTOR BARS
MCSA, VIBRATION
AND AXIAL FLUX
ANALYSIS
MECHANICAL
PROBLEMS BEARING
WEAR MISALIGNME
NT
STATOR
STATOR
2. ROTOR
VIBRATION
ANALYSIS
Line to Ground Line to
Line Fault
R
Turn to Turn Short
Open coil
YB

IJCSNS International Journal of Computer Science and Network Security, VOL.9 No.9, September 2009
228
The Figure 2shows the three phase stator winding with different faults. Turn fault detection based on the axial leakage component flux and electrically excited vibrations have also been existing, however, the sequence components approach provides a better signal to noise ratio, is easier to measure and does not require any special instrumentation besides current sensors. The sensitivity of sequence components based turn-fault detection schemes depends on the extent to which the effects of non-idealities are compensated. The negative sequence current is affected by unbalance in power supply and inherent asymmetries in the machine and in instrumentation. Motor Current Signature Analysis can detect the fault before a phase-phase or phase-earth failure. It is therefore possible with a low voltage stator winding to have some lead time between shorted turns developing and actual failure.
Table 1. Comparison of different fault detection technologies
Faults can be detected
Method Insulation
Stator
winding
Rotor
Winding
Rotor
Eccentricity
Bearing Damage
Vibration
No No Yes Yes Yes
MCSA No Yes Yes Yes Yes
Axial flux
No Yes Yes Yes No
Lubricating oil debris
No No No No Yes
Cooling gas
Yes Yea Yes No No
Partial Discharge
Yes No No No No
The possible detection methods to identify the motor faults are Vibration, Motor Current Signature Analysis (MCSA), Axial flux, Lubricating oil debris, Cooling gas, and Partial Discharge. A comparative analysis of different monitoring techniques is listed in Table .1. From this MCSA is the most appropriate technique which can be used for both stator as well as rotor fault detection. Line current can be monitored non-invasively via clip-on current transducers hence no interruption to the machine operation is required, and the system can be made versatile and portable. MCSA has shown to be capable of detecting, differentiating, and tracking the machine abnormalities, it has number of inherent strengths, the most notable are 1. Provides nonintrusive monitoring capability at a
location remote from the equipment.
2. Provides degradation and diagnostic information. 3. Offers high sensitivity to a variety of disorders
affecting operational readiness 4. Can be performed rapidly and as frequently as desired
by relatively unskilled personnel using portable, inexpensive equipment.
5. Is equally applicable to high-powered and fractional horsepower machines, ac and dc motors.
MCSA can be implemented using time domain or frequency domain analyses and is also capable of analyzing systems during transients, such as during initial or final operation of the system. 2. Modeling and simulation of three phase induction motor for various fault conditions 2.1. Introduction A theory is often a general statement of principle abstracted from observation and a model is a representation of a theory that can be used for prediction and control. To be useful, a model must be realistic and yet simple to understand and easy to manipulate. These are conflicting requirements, for realistic models are seldom simple and simple models are seldom realistic. Often, the scope of a model is defined by what is considered relevant. Features or behaviors that are pertinent must be included in the model and those that are can not be ignored. Modeling here refers to the process of analysis and synthesis to arrive at a suitable mathematical description that encomposes the relevant dynamic characteristics of the component, preferably in terms of parameters that can be easily determined in practice. In mathematical modeling, we try to establish functional relationships between entities that are important. A model supposedly imitates or reproduces certain essential characteristics or conditions of the actual – often on a different scale. It can take on various forms: physical, as in scale-models and electrical analogs of mechanical systems; mental, as in heuristic or intuitive knowledge; and symbolic, as in mathematical, linguistical, graphical, and schematical representations. Simulation can be very useful in many scientific studies that proceed as follows: 1. Observing the physical system. 2. Formulating a hypothesis or mathematical model to
explain the observation. 3. Predicting the behavior of the system from solutions
or properties of the mathematical model. 4. Testing the validity of the hypothesis or mathematical
model.

IJCSNS International Journal of Computer Science and Network Security, VOL.9 No.9, September 2009
229
Every model has parameters, which are to be estimated. The model must lend itself to methods by which these parameters can be determined experimentally; otherwise the model will be incomplete. The developed model must be verified and validated. Verification involves checking the consistency of the mathematics, the solution procedure, and the underlying assumptions. Validation is the determination of how adequately the model reflects pertinent aspects of the actual system that are represented by it. When a discrepancy in unacceptably large, the model must be revised and the cycle repeated. Modeling and simulation have appropriate uses. They are especially beneficial in situations where the actual system does not exist or is too expensive, time-consuming, or hazardous to build, or when experimenting with an actual system can be cause unacceptable disruptions. Changing the values of the parameters, or exploring a new concept of operating strategy, can often be done more quickly in a simulation than by conducting a series of experimental studies on an actual system Simulation can also be a very useful training aid; it is a technique by which students can learn more and gain greater insight and better understanding about the system they are studying. A frequent question about simulation is its validity. Do the simulation results reflect those of the actual system for the condition simulated? Even with valid component models, the use of them in a larger simulation must be done carefully with consistency; otherwise, the results could be meaningless. Finally, in interpreting the results, we should not overlook the simplifications and assumptions made in devising the model. In this chapter, the three-phase induction motor model has been derived instead of two phase model (d-q representation), which is very commonly used. This is because the two-phase model is driven under balance operation. This model constrained the driven solution for any problem to balance operation, which severely limits the scope of many practical problems that may be studied. Also, it impairs the accuracy of these solutions since absolute balanced conditions rarely apply. Three-phase representation of all system components has been chosen so as to allow for unsymmetrical operation and to enhance the practical significance of the derived model. Such a representation is able to represent in accurate detail the many unsymmetrical phenomena encountered, which is not possible when using d-q modeling methods. So, in order to gain an understanding of problems that does not comply directly with balanced operating conditions and for which d-q methods of analysis are inappropriate, three-phase representation becomes essential.
2.2 Induction Machine Equations
The figure 3. shows the two dimensional diagram of three-phase induction motor with stator and rotor windings.
Fig.3. Three phase Induction motor
The voltage equations for a three-phase induction machine can be expressed as:
Stator equation is
dtd
iRV AAAA
λ+=
dtd
iRV BBBB
λ+=
dtd
iRV CCCC
λ+= (1)
Rotor equation is
dtd
iRV aaaa
λ+=
dtd
iRV bbbb
λ+=
dtd
iRV cccc
λ+= (2)
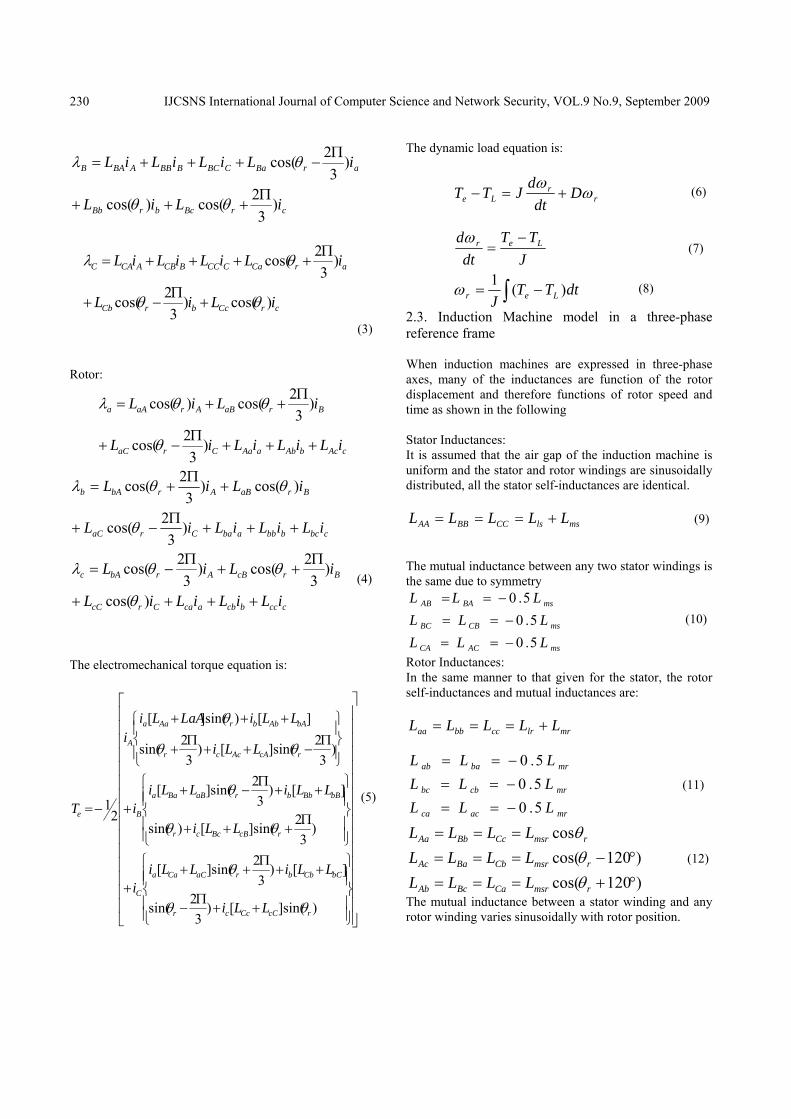
The flux linkages associated with the interactions between stator and rotor windings are represented by: Stator:
crAcbrAb
arAaCACBABAAAA
iLiL
iLiLiLiL
)3
2cos()3
2cos(
)cos(Π
−+Π
++
+++=
θθ
θλ
IJCSNS International Journal of Computer Science and Network Security, VOL.9 No.9, September 2009
230
crBcbrBb
arBaCBCBBBABAB
iLiL
iLiLiLiL
)3
2cos()cos(
)3
2cos(
Π+++
Π−+++=
θθ
θλ
crCcbrCb
arCaCCCBCBACAC
iLiL
iLiLiLiL
)cos()3
2cos(
)3
2cos(
θθ
θλ
+Π
−+
Π++++=
(3)
Rotor:
cAcbAbaAaCraC
BraBAraAa
iLiLiLiL
iLiL
+++Π
−+
Π++=
)3
2cos(
)3
2cos()cos(
θ
θθλ
cbcbbbabaCraC
BraBArbAb
iLiLiLiL
iLiL
+++Π
−+
+Π
+=
)3
2cos(
)cos()3
2cos(
θ
θθλ
cccbcbacaCrcC
BrcBArbAc
iLiLiLiL
iLiL
++++
Π++
Π−=
)cos(
)3
2cos()3
2cos(
θ
θθλ (4)
The electromechanical torque equation is:
⎥⎥⎥⎥⎥⎥⎥⎥⎥⎥⎥⎥⎥⎥⎥⎥
⎦
⎤
⎢⎢⎢⎢⎢⎢⎢⎢⎢⎢⎢⎢⎢⎢⎢
⎣
⎡
⎪⎪⎭
⎪⎪⎬
⎫
⎪⎪⎩
⎪⎪⎨
⎧
++Π
−
++Π
+++
⎪⎪⎭
⎪⎪⎬
⎫
⎪⎪⎩
⎪⎪⎨
⎧
Π+++
++Π
−++
⎪⎭
⎪⎬⎫
⎪⎩
⎪⎨⎧
Π−++
Π+
+++
−=
)sin(][)3
2sin(
][)3
2sin(][
)3
2sin(][)sin(
][)3
2sin(][
)3
2sin(][)3
2sin(
][)sin(][
21
rcCCccr
bCCbbraCCaa
C
rcBBccr
bBBbbraBBaa
B
rcAAccr
bAAbbrAaa
A
e
LLi
LLiLLii
LLi
LLiLLii
LLi
LLiLaALii
T
θθ
θ
θθ
θ
θθ
θ
(5)
The dynamic load equation is:
rr
Le Ddt
dJTT ω
ω+=− (6)
JTT
dtd Ler −
=ω
(7)
∫ −= dtTTJ Ler )(1ω (8)
2.3. Induction Machine model in a three-phase reference frame When induction machines are expressed in three-phase axes, many of the inductances are function of the rotor displacement and therefore functions of rotor speed and time as shown in the following Stator Inductances: It is assumed that the air gap of the induction machine is uniform and the stator and rotor windings are sinusoidally distributed, all the stator self-inductances are identical.
mslsCCBBAA LLLLL +=== (9)
The mutual inductance between any two stator windings is the same due to symmetry
msACCA
msCBBC
msBAAB
LLLLLL
LLL
5.05.0
5.0
−==−==−==
(10)
Rotor Inductances: In the same manner to that given for the stator, the rotor self-inductances and mutual inductances are:
mrlrccbbaa LLLLL +===
mracca
mrcbbc
mrbaab
LLLLLLLLL
5.05.05.0
−==−==−==
(11)
)120cos()120cos(
cos
°+===°−===
===
rmsrCaBcAb
rmsrCbBaAc
rmsrCcBbAa
LLLLLLLLLLLL
θθθ
(12)
The mutual inductance between a stator winding and any rotor winding varies sinusoidally with rotor position.

IJCSNS International Journal of Computer Science and Network Security, VOL.9 No.9, September 2009
231
2.4 Induction Motor Model implementation with Matlab/Simulink In this section, the implementation of the stationary reference abc model of a three-phase induction motor using simulink, using the equations listed in the previous section has been given. Figure 4.shows an overall diagram of the induction motor in the stationary three-phase reference frame. The details of the subsystems in the main blocks are given in figure 5.
Fig. 4 Simulink Model of Condition Monitoring System The parameters inside the induction motor three-phase model and the three phase source can be set by executing a m-file which stores the all parameters used in the model. By running the m-file all the values of the parameters can be accessed by the model from the workspace. Machine Parameters: The parameters of the machine used for simulation are listed below: Rated Voltage V = 380v Frequency f=50Hz , Stator Resistance Rstator = 15.3Ω Rotor Resistance Rrotor = 7.46Ω, The stator and rotor self-inductances are equal to
Lstator = Lrotor = Lleakage+Lmutual = .035+.55 = .585H The mutual inductance between any two stator and any tow rotor windings is equal to Lss,mutual = Lrr,mutual = -0.5Lmutual = -0.275H The mutual inductance between a stator winding and any rotor winding is equal to Lsr,mutual = Lmutual =0.55H Number of Poles p = 4, Inertial constant J = 0.023kg.m2
Fig. 5. Simulink Model of Induction Motor Subsystem
Fig. 6. Model of Symmetrical components subsystem
2.5. Design of Condition monitoring of Induction Motor using Fuzzy Logic Controller Condition monitoring of the induction motor is a process of continuous evaluation of the health of the motor throughout its serviceable life. Condition monitoring and protection are obviously closely related functions.

IJCSNS International Journal of Computer Science and Network Security, VOL.9 No.9, September 2009
232
Condition monitoring should be designed so as to preempt faults that can occur in the induction motor. It can be extended to provide primary protection, but its real function must always be to attempt and to recognize the development of faults at an early stage. Such advanced warning is desirable since it allows maintenance person greater freedom to schedule outages in the most convenient manners. By condition monitoring we can reduce unexpected failures and downtime, increase the time for standards maintenance, and reduce maintenance and operational cost.
2.5.1. Overview of Fuzzy Logic
Fuzzy Logic has emerged as a profitable tool for the controlling of subway systems and complex industrial processes, as well as for household and entertainment electronics, diagnosis systems and other expert systems. Fuzzy logic is basically a multivalued logic that allows intermediate values to be defined between conventional evaluations like yes/no, true/false, etc. Notions like rather warm or pretty cold can be formulated mathematically and processed by computers. In this way an attempt is made to apply a more human-like way of thinking in the programming of computers. Fuzzy controllers are the most important application of fuzzy theory. They work rather different than conventional controllers; expert knowledge is used instead of differential equations to describe a system. 2.5.2. Construction of Fuzzy and Membership functions Fuzzy rules and membership functions are constructed by observing the data set. For the measurements related to the stator currents, more insight into the data are needed, so membership functions will be generated for Negative Medium(NM), Negative Small(NS), Zero(Z), Positive Small(PS), Positive Medium(PM). For the measurement related to the stator condition, it is only necessary to know if the motor condition is Good, or Damaged or Seriously Damaged. Optimized membership functions for this are shown in figure 6 and figure 7. The stator related faults that have been investigated in this study are 1. Turn-to Turn short, 2. Break in stator winding 3. Unbalance in input Voltage 4. Open phase The steps in building Condition Monitoring system are:
1. Determine the fuzzy control input. The current is the input to the fuzzy controller.
2. Determine the fuzzy control output. The output is the condition of the motor.
3. Choose the word descriptions for the status of input and output.
Input Status Word Descriptions 1. Negative Medium(NM) 2. Negative Small(NS) 3. Zero(Z) 4. Positive Small(PS) 5. Positive Medium(PM) Output Status Word Descriptions 1. Good 2. Damaged 3. Seriously Damaged The next step is to determine the degree of membership for both input and output variables. This can be done by knowledge base only.(The membership function values for input and output variables and Rule base are given in chapter 4) 3. Implementation of On Line condition monitoring system 3.1 Introduction The three phase induction motors due to their simple, robust design and construction, have been widely used in industries. In spite of the fact that the probability of breakdowns of induction motor is very low, 2 to 3% per annum, monitoring their operating condition is essential particularly when they are employed in automated production lines. The induction motors are subject to the occurrence of incipient faults. If these incipient faults are left undetected, the occurrence of an incipient fault will eventually degenerate into a machine failure. In many industries lots of machines depend on mutual operation, and the cost of unexpected breakdowns is very high. In such cases the breakdowns of machines in operation usually involve higher losses in production process than the cost of their repairs or even the initial costs of the machine themselves. In addition, the unexpected breakdowns may have safety implications and may even expose human being to danger. Both technical and economical considerations suggested the development of a new computer-based monitoring system to predict the faults by means of acquiring the data and the analysis of that data. An efficient Condition Monitoring system can reduce manpower consumption as well as guarantee that the running will never halt accidentally. It should be capable of monitoring the running machines with the existence of electrical interference, prediction the need for maintenance before serious detoriation or breakdown occurs, identifying and locating the defects in detail, and even estimating the life of machines.
IJCSNS International Journal of Computer Science and Network Security, VOL.9 No.9, September 2009
233
3.2 Overview of Virtual Instrumentation
Virtual Instrumentation is defined as combining hardware and software with industry-standard computer technologies to create user defined instrumentation solutions. LabView is a graphical programming language that uses icons instead of text to create applications. Using LabView we can create test and measurement, data acquisition, instrument control, data logging, measurement analysis, and report generation applications.
Fig. 7. Schematic diagram of a Virtual Instrument
In general LabView programs are called Virtual Instruments (VI) it is shown in figure 7. VI's contain two main components, the front panel, and the block diagram. The front panel is the user interface of the VI. The block diagram contains the graphical source code. LabView is integrated fully for communication with hardware such as GPIB, RS-232, RS-485, and Plug-in data acquisition boards. It also has built in libraries for using software standards such TCP/IP networking and Activex. It is a powerful graphical development environment for signal acquisition, measurement analysis, and data presentation, without the complexity of traditional development tools. 3.3 Development of Lab View based Monitoring
system The development of computer technologies, transducer technologies, signal processing techniques together with artificial-intelligence(AI) techniques has made it possible to implement Condition Monitoring (CM) more efficiently on any electrical equipment. It is expected to make CM systems more reliable, more intelligent and cheaper, so that they can be widely employed even in small scale industries. CM is a technique served for Condition-Based Monitoring (CBM). Earlier to this time-based maintenance had been the mainly used maintenance strategy for a long time.
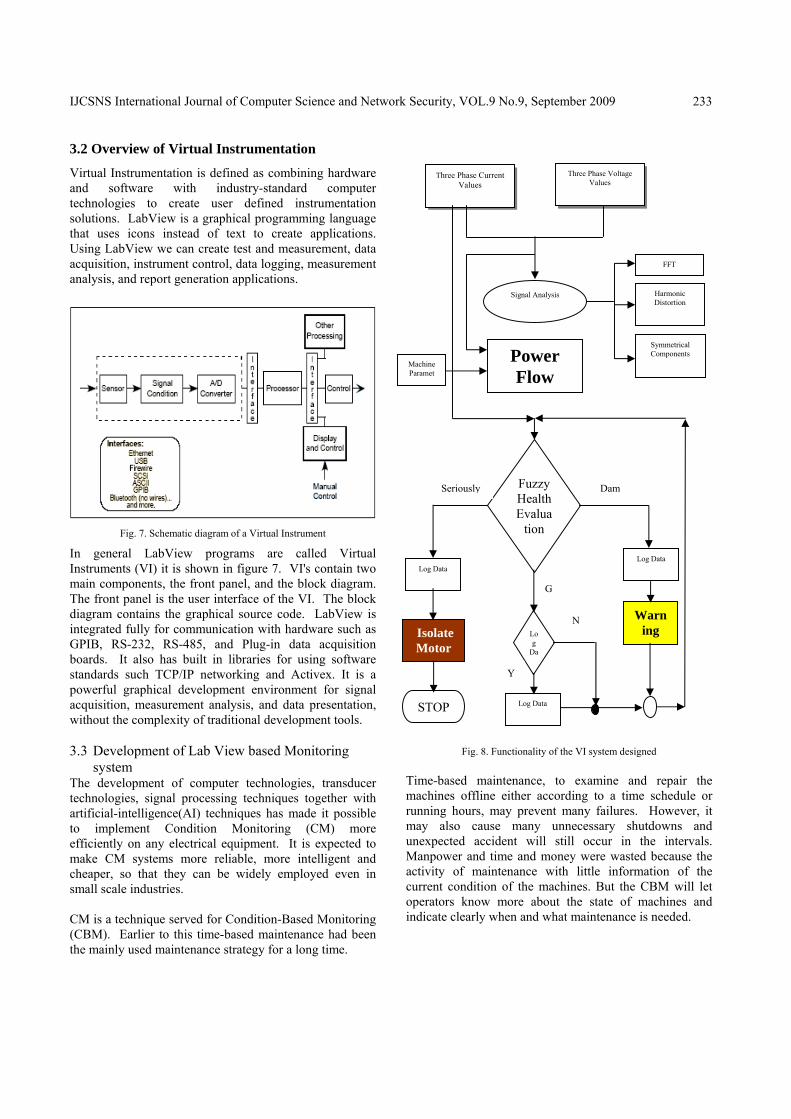
Fig. 8. Functionality of the VI system designed
Time-based maintenance, to examine and repair the machines offline either according to a time schedule or running hours, may prevent many failures. However, it may also cause many unnecessary shutdowns and unexpected accident will still occur in the intervals. Manpower and time and money were wasted because the activity of maintenance with little information of the current condition of the machines. But the CBM will let operators know more about the state of machines and indicate clearly when and what maintenance is needed.
Three Phase Current Values
Three Phase Voltage Values
Signal Analysis
FFT
Harmonic Distortion
Symmetrical Components Power
Flow Machine Paramet
Fuzzy HealthEvalua
tion
Seriously Dam
G
Log Data Log Data
Log
Da
Log Data
Y
N Warning Isolate
Motor
STOP
IJCSNS International Journal of Computer Science and Network Security, VOL.9 No.9, September 2009
234
In a LabView program the front panel simulates the panel of a physical instrument .The results can be viewed on the computer screen through the front panel. Actually the VI receives instructions from a block diagram constructed in graphical source code. The block diagram is a pictorial solution to a programming problem. The figure 8. shows the functionality of the VI system for the Condition Monitoring of induction motor.
Here the input quantities are the three phase input voltage and the three phase stator current signals. The acquired signals are processed for diagnostic purpose through Fast Fourier Transform (FFT), Total Harmonic Distortion (THD), and symmetrical components analysis. The power flow calculations are done using the acquired signals and the parameters of the specific motor. A fuzzy logic controller has been designed to evaluate the state of the motor based on the stator current magnitude. Based on the output of the fuzzy controller protective actions are carried out. The total Instrumentation system incorporates 1. Data Acquisition. 2. Signal Processing 3. Fuzzy Control
3.4 Data Acquisition
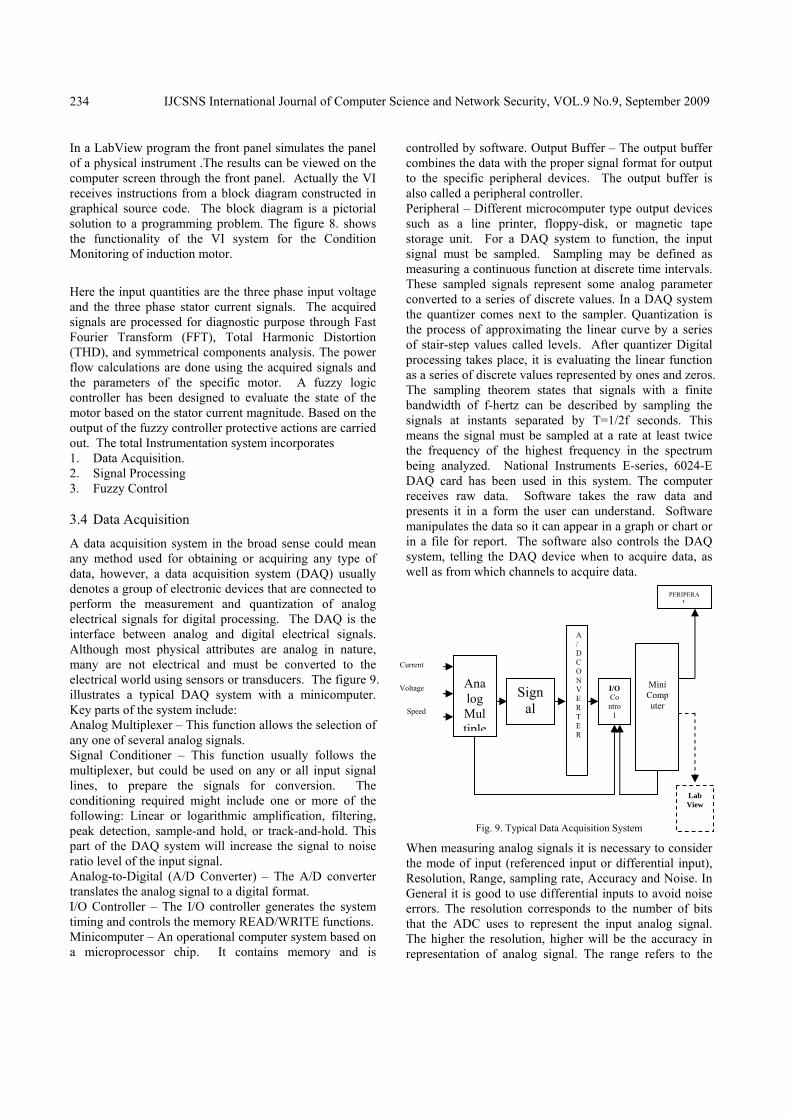
A data acquisition system in the broad sense could mean any method used for obtaining or acquiring any type of data, however, a data acquisition system (DAQ) usually denotes a group of electronic devices that are connected to perform the measurement and quantization of analog electrical signals for digital processing. The DAQ is the interface between analog and digital electrical signals. Although most physical attributes are analog in nature, many are not electrical and must be converted to the electrical world using sensors or transducers. The figure 9. illustrates a typical DAQ system with a minicomputer. Key parts of the system include: Analog Multiplexer – This function allows the selection of any one of several analog signals. Signal Conditioner – This function usually follows the multiplexer, but could be used on any or all input signal lines, to prepare the signals for conversion. The conditioning required might include one or more of the following: Linear or logarithmic amplification, filtering, peak detection, sample-and hold, or track-and-hold. This part of the DAQ system will increase the signal to noise ratio level of the input signal. Analog-to-Digital (A/D Converter) – The A/D converter translates the analog signal to a digital format. I/O Controller – The I/O controller generates the system timing and controls the memory READ/WRITE functions. Minicomputer – An operational computer system based on a microprocessor chip. It contains memory and is
controlled by software. Output Buffer – The output buffer combines the data with the proper signal format for output to the specific peripheral devices. The output buffer is also called a peripheral controller. Peripheral – Different microcomputer type output devices such as a line printer, floppy-disk, or magnetic tape storage unit. For a DAQ system to function, the input signal must be sampled. Sampling may be defined as measuring a continuous function at discrete time intervals. These sampled signals represent some analog parameter converted to a series of discrete values. In a DAQ system the quantizer comes next to the sampler. Quantization is the process of approximating the linear curve by a series of stair-step values called levels. After quantizer Digital processing takes place, it is evaluating the linear function as a series of discrete values represented by ones and zeros. The sampling theorem states that signals with a finite bandwidth of f-hertz can be described by sampling the signals at instants separated by T=1/2f seconds. This means the signal must be sampled at a rate at least twice the frequency of the highest frequency in the spectrum being analyzed. National Instruments E-series, 6024-E DAQ card has been used in this system. The computer receives raw data. Software takes the raw data and presents it in a form the user can understand. Software manipulates the data so it can appear in a graph or chart or in a file for report. The software also controls the DAQ system, telling the DAQ device when to acquire data, as well as from which channels to acquire data.
Fig. 9. Typical Data Acquisition System
When measuring analog signals it is necessary to consider the mode of input (referenced input or differential input), Resolution, Range, sampling rate, Accuracy and Noise. In General it is good to use differential inputs to avoid noise errors. The resolution corresponds to the number of bits that the ADC uses to represent the input analog signal. The higher the resolution, higher will be the accuracy in representation of analog signal. The range refers to the
Analog Multiple
Signal
A/D C O N V E R T E R
I/O Contro
l
Mini Computer
PERIPERAL
LabView
Current
Voltage
Speed

IJCSNS International Journal of Computer Science and Network Security, VOL.9 No.9, September 2009
235
maximum and minimum voltage levels that ADC can quantize then sampling rate determines how often an analog to digital conversion takes place. Signal conditioning is necessary to shield the signals from noise and distortion. The actual current measured has to be stepped down and isolated to protect the DAQ board. The most common type of signal conditioning is amplification, current signals are amplified to improve the digital signal accuracy and to reduce noise.
3.5 Signal Processing
The signals to be analyzed are acquired through signal conditioning circuits and DAQ card. This is shown in Fig. 10. After acquisition the signal is brought to the actual magnitude by suitable multiplication factor.
Fig 10. Schematic diagram of the actual setup
The signal processing has been divided into two parts. 1. Spectrum analysis 2. Symmetrical component analysis 3.5.1. Spectrum analysis
The samples of the signal obtained from the DAQ card constitute the time domain representation of the signal. This representation gives the amplitudes of the signal at the instants of time during which it had been sampled. However, in the fault diagnosis of induction motor, it is required to know the frequency content of the current signal rather than the amplitudes of the individual samples. The representation of the signal in terms of its individual frequency components is known as the frequency domain representation of the signal. The frequency domain
representation could give more insight about the signal and the system. The algorithm used to transform samples of the data from the time domain into the frequency domain is known as the Fast Fourier Transform (FFT). The FFT establishes the relationship between the samples of a signal in the time domain and their representation in the frequency domain. The FFT is widely used in the fields of spectral analysis. If the signal is sampled at a sampling rate of fs Hz, then the time interval between the samples is Δt, (e.g., see Eq. 13) where
sft 1=Δ (13)
The Fast Fourier Transform is given by
∑−
=
−=
1
0
2N
i
Nk
ij
ik exXπ
for k=0,1,2,…N-1 (14)
Where X[i] is the frequency domain representation.
tNNf
f s
Δ==Δ
1 (15)
The time domain 'x' and the frequency domain 'X' have a total of N samples. If the FFT is complex, it contains two pieces of information-the amplitude and phase.
⎭⎬⎫
⎩⎨⎧
±−= kspnff st )1(1 (16)
The objective of performing FFT analysis on the current signal is to identify current components in the stator winding that are function of shorted turns. The following equation gives the components in the airgap flux waveform that are a function of shorted turns. The diagnosis of shorted turns via MCSA is based on detecting the frequency components given by equation 16 in that these rotating flux waves can induce corresponding
IJCSNS International Journal of Computer Science and Network Security, VOL.9 No.9, September 2009
236
current components in the stator winding. The components are clearly a function of motor design, in a four pole, three phase, squirrel cage induction motor, from equation (16) there will be a whole series of components,
With ( )sfandsffnk st +⎟⎟⎠
⎞⎜⎜⎝
⎛⎟⎠⎞
⎜⎝⎛−⎟
⎠⎞
⎜⎝⎛=== 1
2,,
31
23,1,1 1
1
With ( ) 11 ,,2,2,1 sfandsffnk st −===
With ( )sfandsffnk st 312
,,531
25,3,1 1
1 −⎟⎟⎠
⎞⎜⎜⎝
⎛⎟⎠⎞
⎜⎝⎛−⎟
⎠⎞
⎜⎝⎛===
With ( )sfandsffnk st 21,,3213,4,1 11 −⎟⎟
⎠
⎞⎜⎜⎝
⎛⎟⎠⎞
⎜⎝⎛−===
With ⎟⎟⎠
⎞⎜⎜⎝
⎛⎟⎠⎞
⎜⎝⎛−⎟
⎠⎞
⎜⎝⎛
⎟⎟⎠
⎞⎜⎜⎝
⎛⎟⎠⎞
⎜⎝⎛−⎟
⎠⎞
⎜⎝⎛===
351
23,,
751
27,5,1 11
sfandsffnk st
With ( )sfandsffnk st 32,,4314,6,1 11 −⎟⎟
⎠
⎞⎜⎜⎝
⎛⎟⎠⎞
⎜⎝⎛−===
With⎟⎟⎠
⎞⎜⎜⎝
⎛⎟⎠⎞
⎜⎝⎛−⎟
⎠⎞
⎜⎝⎛
⎟⎟⎠
⎞⎜⎜⎝
⎛⎟⎠⎞
⎜⎝⎛−⎟
⎠⎞
⎜⎝⎛=== sfandsffnk st 3
7123,,
971
29,7,1 11
(17)
and so on with combinations of k and n values. The figure 4.3.2 shows the frequency spectrum of the induction motor under different fault conditions.
3.5.2. Symmetrical Component Analysis
The ocurrence of shorted turns and phase imbalanced in the stator winding of induction motors cause predictable harmonics to appear in the spectrum of line currents and in the axial leakage flux. These changes however, can be small relative to the fundamental. The situation is further complicated because the induced harmonic components can exhibit beating at slip frequency or at a low integer multiple of slip frequency. This means that the detection of changes in the amplitude of such components can be unreliable, since it both frequency and time dependant. To overcome these drawbacks, the symmetrical component theory, and the approach is quite general, allowing for any asymmetrical arrangement of stator winding faults. By analyzing the relation of the positive and negative-sequence currents to that of torque and slip, when the machine is subjected to various operating conditions, the faults can be diagnosed. An unbalanced system of related phasors can be resolved into n systems of balanced phasors called the symmetrical components of the original phasors. In symmetrically wound machines there is no reaction between the different sequency quantities, if balanced voltages are applied to the stator, only balanced currents of the same sequence will flow. Due to the mutual winding coupling and other
effects, the impedance displayed by machines will be different when exited by different sequence sources. The per phase impedance of the positive-sequence network will be different from those of negative and zero-sequence networks. The expression for the three unbalanced phasors as a function of the balanced phasor components are
(18) The positive, negative, and zero sequence vector components of any phase always have the angular relationship with respect to one another.
(19)
⎟⎟⎟
⎠
⎞
⎜⎜⎜
⎝
⎛
⎟⎟⎟
⎠
⎞
⎜⎜⎜
⎝
⎛=
⎟⎟⎟
⎠
⎞
⎜⎜⎜
⎝
⎛
c
b
a
a
a
a
VVV
aaaa
VVV
2
2
2
1
0
11
111
31 (20)
(21) If suppose C phase is lost and the motor is running at a steady speed. Then Va and Vb are the remaining voltages and they produce equal and opposite line currents Ia and Ib, which increase to around 1.73 to 2.00 times that of the normal. The back EMF generated in the machine armature will be approximately balanced in all three phases, since both the motor stator windings and rotor cage have distributed conductors. By ignoring stator resistance, the internal voltage Vma and Vmb of phase A and B respectively will add vectorially with the respective stator leakage reactance voltage drops Vsa and Vsb to equal the applied voltages Va and Vb. For ungrounded neutral, zero-sequence current is neglected. The negative-sequence voltages produce currents which are limited by impedanced that closely approximate those that apply when the motor is started. This negative-sequence current results in the production of counter torque. To compensate negative torque produced, the positive-sequence current increases. The motor slip increases to allow the additional positive torque to develop.

IJCSNS International Journal of Computer Science and Network Security, VOL.9 No.9, September 2009
237
The similar approach can be applied for the turn faults too. The symmetrical component waveforms of the input voltage and stator currents for different fault conditions are shown in figure 8.
3.6 Fuzzy Control
In the motor fault diagnosis process, time domain current signals are captured from sensors. The diagnostic expert then uses both time domain and frequency domain signals to study the motor condition and determines what faults are present. However, experienced engineers are often required to interpret measurement data that are frequently inconclusive. A fuzzy logic approach may help to diagnose induction motor faults. Fuzzy logic is reminiscent of human thinking process and natural language enabling decisions to be made based on vague information. Fuzzy logic is shown in figure 11. it allows items to be described as having a certain membership degree in a set. While conducting fault diagnosis, there are several situations in which an object is not obviously "Good" or "Damaged", but may fall into some interior range. According to the fact that induction motor condition interpretation is a fuzzy concept. Here the motor condition is described using linguistic variables. Fuzzy subsets and the corresponding membership functions describe stator current amplitudes. A knowledge base, comprising rule base is built to support the fuzzy inference. The induction motor condition is diagnosed using a compositional rule of fuzzy inference. The obtained results indicate that the proposed fuzzy logic approach is capable of highly accurate diagnosis. humans express knowledge. (like an electrical machine referred as "somewhat secure", "little overloaded"). This linguistic input can be expressed directly by a fuzzy system. The internal structure of fuzzy controller is shown in figure 12. The stator current signal contains potential fault information. Fuzzy systems rely on a set of rules. These rules, allow the input to be fuzzy, i.e. like the natural way that Ia = μia (Iaj) Σ Ia Ib = μib (Ibj) Σ Ib Ic = μic (Icj) Σ Ic CM = μcm (cmj) Σ CM (22) Where Iaj , Ibj , Icj and cmj are elements of the discrete universe of discourse Ia, Ib, Ic and CM .the optimized rule base has been developed so as to cover all the healthy and the faulty conditions of the motor.
Fig. 11. Complete structure of Fuzzy Controller
Fig. 12. Internal structure of Fuzzy Controller
In this case the stator current Ia, Ib, and Ic are considered input variables to the fuzzy system. The stator condition, CM is chosen as output variable. All the system inputs and outputs are defined using fuzzy set theory. The input variables are interpreted as linguistic variables, with Negative Medium(NM), Negative Small(NS), Zero(Z), Positive Small(PS), Positive Medium(PM). Similarly the output variable stator condition (CM) is interpreted as linguistic variables, with Good, Damaged, and Seriously Damaged. Fuzzy rules and membership functions are constructed by observing the data set. There are 31 if-then rules used and the membership function for input and ouput variables are shown in figure 13 and figure 14 respectively.

IJCSNS International Journal of Computer Science and Network Security, VOL.9 No.9, September 2009
238
Fig.13. Fuzzy membership functions for stator currents
Fig.14. Fuzzy membership functions for Condition of Motor
3.6.1. Rule Base 1. If Ia is NS then CM is Seriously Damaged 2. If Ib is NS then CM is Seriously Damaged 3. If Ic is NS then CM is Seriously Damaged 4. If Ia is PM then CM is Seriously Damaged 5. If Ib is PM then CM is Seriously Damaged 6. If Ic is PM then CM is Seriously Damaged 7. If Ia is NM and Ib is NM and Ic is NM then CM is
Good 8. If Ia is NM and Ib is NM and Ic is Zero then CM is
Damaged. 9. If Ia is NM and Ib is NM and Ic is PS then CM is
Damaged 10. If Ia is NM and Ib is Zero and Ic is NM then CM is
Damaged 11. If Ia is NM and Ib is PS and Ic is NM then CM is
Damaged 12. If Ia is Zero and Ib is NM and Ic is NM then CM is
Damaged 13. If Ia is PS and Ib is NM and Ic is NM then CM is
Damaged 14. If Ia is NM and Ib is Zero and Ic is Zero then CM is
Damaged
15. If Ia is NM and Ib is Zero and Ic is PS then CM is Seriously Damaged
16. If Ia is NM and Ib is PS and Ic is Zero then CM is Seriously Damaged
17. If Ia is NM and Ib is PS and Ic is PS then CM is Damaged
18. If Ia is Zero and Ib is NM and Ic is Zero then CM is Damaged
19. If Ia is Zero and Ib is NM and Ic is PS then CM is Seriously Damaged
20. If Ia is PS and Ib is NM and Ic is Zero then CM is Seriously Damaged
21. If Ia is PS and Ib is NM and Ic is PS then CM is Damaged
22. If Ia is Zero and Ib is Zero and Ic is NM then CM is Damaged
23. If Ia is PS and Ib is Zero and Ic is NM then CM is Seriously Damaged
24. If Ia is Zero and Ib is PS and Ic is NM then CM is Seriously Damaged
25. If Ia is Zero and Ib is PS and Ic is Zero then CM is Damaged
26. If Ia is Zero and Ib is PS and Ic is PS then CM is Damaged
27. If Ia is Zero and Ib is Zero and Ic is PS then CM is Damaged
28. If Ia is PS and Ib is Zero and Ic is Zero then CM is Damaged
29. If Ia is Zero and Ib is Zero and Ic is Zero then CM is Good
30. If Ia is PS and Ib is PS and Ic is Zero then CM is Good
31. If Ia is Zero and Ib is PS and Ic is PS then CM is Good.
Defuzzification is defined as the conversion of fuzzy output to crisp output. There are many types of defuzzification methods available. Here we used Center of Area (COA) method for defuzzification. Despite its complexity it is more popularly used because, if the areas of two or more contributing rules overlap, the overlapping area is counted only once.
Output of Fuzzy Logic Controller 1. Good ----- 70 TO 100 2. Damaged ----- 30 To 70 3. Seriously Damaged ----- 0 To 30
The output of the fuzzy controller is used as the command signal for the closed loop operations. If the fuzzy controller output is Good, then the program goes for next set of data to be acquired. Meanwhile if the operator wants, the data like three phase current, three phase
CM
CM
μ(CM)

IJCSNS International Journal of Computer Science and Network Security, VOL.9 No.9, September 2009
239
voltage, frequency of input voltage, power factor, total harmonic distortion of both the current and voltage and the state of the motor can be stored in a file. If any incipient faults are slight voltage unbalance occurs, then the output of the fuzzy controller will go Damaged. Immediately the fault data and the current spectrum are stored in a file for analysis purpose with time as long as fault persists. At the same time a warning indication will be given to the operator, and a beep sound will be generated at the central processing unit of the computer to alert the operator at the shop as well as the control room engineer. The front panel of the monitoring system will also display the possible cause for the damaged state of the motor. The instantaneous current and voltage waveforms, and the spectrum of the current can be stored as a HTML file to find the root cause of the fault. For the severe faults such as open phase, open coil, single line to ground short and line to line to short, the fuzzy controller output will be seriously damaged. In this state the machine should not be allowed to operate any further. Whenever the fuzzy controller output goes seriously damaged, the machine will be isolated from the supply and the instantaneous fault data are stored, also the front panel of the monitoring system will display the possible cause seriously damaged state of the motor. After performing the above said operations the program will be stopped. 5. Simulation and Results
5.1 Normal Operation
For the values given in section 2.4 and using a simulation stop time of 2.0 seconds, the motor was simulated during starting from rest with rated voltage applied and no mechanical load. Figure 15 and 16 shows the Stator current and health of induction motor, Stator input voltage, speed and torque, symmetrical components of stator current, symmetrical components of stator induced voltage, symmetrical components of stator input voltage are shown. From these results it can be concluded that after the transient period is over, the health of the motor is Good, and there is no negative sequence component in both stator induced voltage and stator current.
Fig. 15. Three phase Stator currents and Percentage Health of Induction
motor (Normal Operation)
Fig. 16 Developed Torque and Speed of Induction motor (Normal
Operation) 5.2 Turn-Turn short in one phase winding
After the simulation for normal operation of the induction motor model, simulation for the short circuit in the part of the winding in R phase has been carried out. At this condition the value of the stator resistance at short circuit fault is equal to Rstator, fault = 13.1Ω, we can find the value of the inductance at the fault state by using the ratio between the value of the resistance at both state(normal and fault). Thus the value of the inductance is

IJCSNS International Journal of Computer Science and Network Security, VOL.9 No.9, September 2009
240
faultStator
normalStator
faultStator
normalStator
LL
nR
R
,
,
,
, ==
HLL faultStator
faultStator
5.0585.01.133.15
,,
≈⇒∴=
Replacing the values of the stator resistance and stator
self-inductance in phase R by these values the results can be obtained. Figure 17 shows the Stator current and health of induction motor, speed and torque, symmetrical components of stator current, symmetrical components of stator induced voltage, are shown. The simulation is started up with normal state parameters. After obtaining steady state at 0.5 second the turn fault has been created by changing the above said parameters. From these results it can be concluded that during normal operation(before fault), the health of the motor is Good, and there is no negative sequence component in both stator induced voltage and stator current. As soon as the fault is created the stator current becomes unbalanced, and the health of the induction motor goes seriously damaged and finally settles to Damaged state, and we can notice that there is presence of negative sequence component in both stator induced voltage and stator current waveforms during fault conditions.
Fig. 17. Symmetrical component waveforms of stator current (Turn-Turn
short) 5.3 Break in stator winding For simulation of the break fault in the stator winding at R phase, it is not possible to apply a break in the phase by putting the value of the stator resistance and the stator inductance to infinity. It is assumed that the value of the
stator resistance is very large and corresponding to this value we can calculate the value of the inductance by this equation:
faultStator
normalStator
faultStator
normalStator
LL
nR
R
,
,
,
, ==
HLL faultStator
faultStator
35.382585.010000
3.15,
,
≈⇒∴=
Replacing the values of the stator resistance and stator
self-inductance in phase R by these values, the fault state results can be obtained. Figure 18 and 19. shows the Stator current and health of induction motor, speed and torque, symmetrical components of stator current, symmetrical components of stator induced voltage, are shown. The simulation is started up with normal state parameters. After obtaining steady state at 0.5 second the break in winding fault has been created by changing the above said parameters. From these results it can be concluded that during normal operation(before fault), the health of the motor is Good, and there is no negative sequence component in both stator induced voltage and stator current. As soon as the fault is created the stator current becomes fully unbalanced, and the health of the induction motor goes seriously damaged and finally settles to the same state, and the presence of negative sequence component in both stator induced voltage and stator current waveforms during fault conditions can be noticed.
Fig. 18 Stator current and Percentage health of induction motor (Break
in winding)

IJCSNS International Journal of Computer Science and Network Security, VOL.9 No.9, September 2009
241
Fig. 19. Symmetrical component waveform of stator current (Break in
winding) 5.4 Unbalance in input voltage The simulation of induction motor with voltage unbalance can be simulated by simply varying the voltage magnitude in any one of the phase, no other parameters need to be changed. As in the previous case, the machine is started up with normal value, and at 0.5 second, the current takes its steady state value, now the fault has been created by changing the voltage of B phase. In this case a 6% of the rated voltage in C phase was reduced to create unbalance. Figure 20 and 21 shows the Stator current and health of induction motor, speed and torque, symmetrical components of stator current, symmetrical components of stator induced voltage, and symmetrical components of input voltages are shown. The simulation is started up with normal state parameters. After obtaining steady state at 0.5 second the turn fault has been created by changing the magnitude of B phase voltage. From these results it can be concluded that during normal operation(before fault), the health of the motor is Good, and there is no negative sequence component in both stator induced voltage and stator current. As soon as the fault is created the stator current becomes unbalanced, and the health of the induction motor goes seriously damaged and finally settles to Damaged state, and we can notice that there is presence of negative sequence component in both stator induced voltage and stator current waveforms during fault conditions.
Fig. 20 Stator current and Percentage health of induction motor (voltage
unbalance)
Fig. 21 Symmetrical component waveform of stator current (voltage
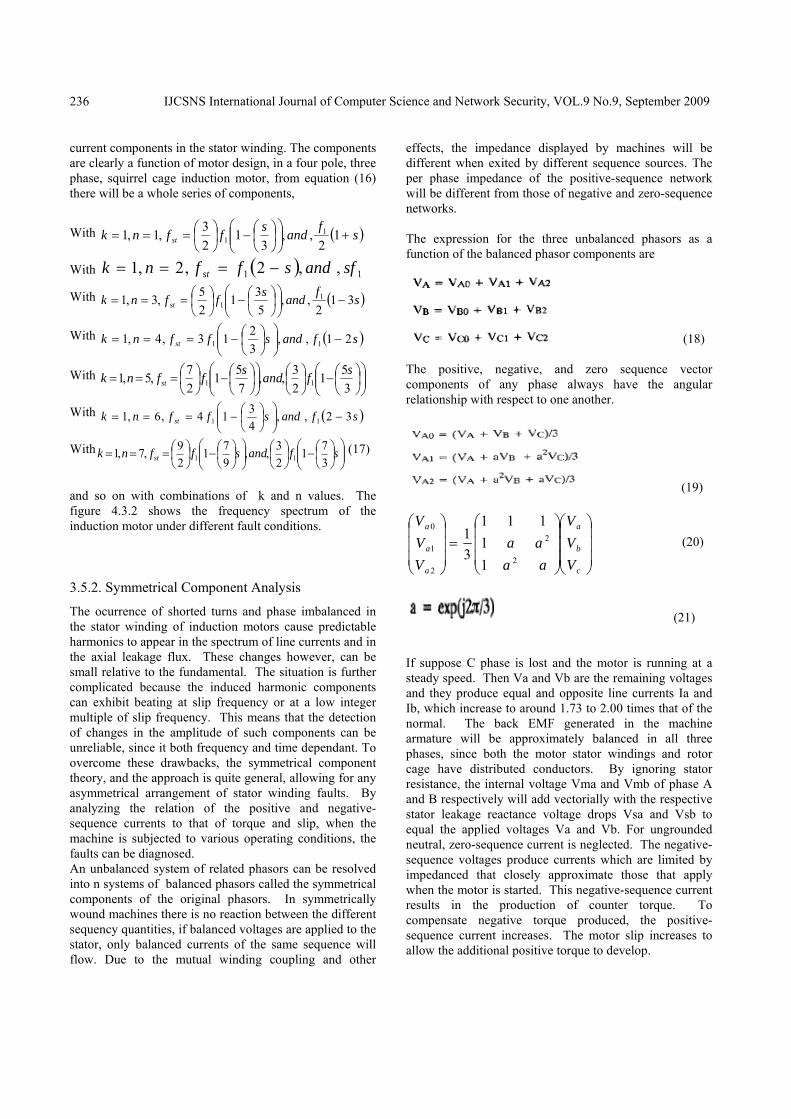
unbalance) 5.5 Open Phase fault In this case after normal startup, at 0.5 second, R phase was open circuited and the corresponding results are shown in figures 22.and figure 23. Shows the condition monitoring of motor using labview
Fig. 22 Stator current and Percentage health of induction motor (one
phase open)
IJCSNS International Journal of Computer Science and Network Security, VOL.9 No.9, September 2009
242
Fig. 23 Stator current and Percentage health of induction motor (one
phase open) using labview
4.Conclusion A LabView based measurement and health evaluation system has been developed and implemented. This application allows fast failure state estimation. The more detailed investigation to point out the difficult conditions of the machine under different stator fault conditions of induction motor can be performed. This is a highly versatile technology for condition monitoring and fault analysis of motors. It solves the shutdown Problems and ensures safe working environment in continuous process industry. 5.Future Improvement
In future this work can be extended for monitoring the rotor related faults. The developed condition monitoring system requires a personal computer for data acquisition and diagnosis; this can be miniaturized by using an embedded system which does not require any personal computer for health evaluation.
References [1] W. T. Thomson : "A Review of On-Line Condition
Monitoring Techniques for Three-Phase Squirrel-Cage Induction Motors -Past Present and Future" Keynote address at IEEE Symposium on Diagnostics for Electrical Machines, Power Electronics and Drives, Gijon, Spain, pp 3-18 Sept. 1999.
[2] YE Zhongming and WU Bin, Ryerson "A Review on Induction Motor Online Fault Diagnosis" Proceedings of third international conference on Power Electronics and Motion Control, 2000. IPEMC 2000.
[3] Paul V. Goode, Mo-Yuen Chow "Using a Neural/Fuzzy System to Extract Heuristic Knowledge of Incipient Faults in Induction Motors: Part II – Methodology", IEEE Transactions on Industrial Electronics, Vol.42, no.2, pp: 131 – 138, April 1995.
[4] Randy R. Schoen, Brain K. Lin, Thomas G. Habetler, Jay H. Schlag and Samir Farag. "An Unsupervised, On-Line System for Induction Motor Fault Detection Using Stator Current Monitoring" IEEE Transactions On Industry Applications, Vol. 31, No.6, pp: 1280 – 1286, November/December, 1995.
[5] M.E.H. Benbouzid, H. Nejjari, University of Picardie, France "A Simple Fuzzy Logic Approach for Induction Motors Stator Condition Monitoring" IEEE International Electric Machines and Drives Conference, 2001. IEMDC 2001. Volume , Issue , 2001 Page(s):634 – 639.
[6] Sang-Bin Lee, Rangarajan M. Tallam, and Thomas G. Habetler, Georgia "A Robust, On-Line Turn-Fault Detection Technique for Induction Machines based on Monitoring the Sequence Component Impedance Matrix" IEEE Transactions On power electronics, Vol. 18, No.3, Page(s): 865- 872, May 2003.
[7] Subhasis Nandi, Hamid A. Toliyat, "Novel Frequency Domain Based Technique to Detect Incipient Stator Inter-Turn Faults in Induction Machines" proceedings of industry application conference, Page(s): 367-374 vol.1 2000,
[8] Fco. Sergio Sellschopp S., Marco A. Arjona L., Torreon Coahuila, "A Virtual Instrument For Frequency Analysis of Electrical Machines" proceedings of electrical machines and drives conference, On page(s): 845-852, 2001
R.Saravanakumar received his B.E. Degree in Electrical and Electronics Engineering from Thiyagarajar College of Engineering , Madurai, Tamilnadu India in 1996.He obtained M.E., in Power Electronics and Drives from College of Engineering Guindy ,Tamilnadu ,India in 1998.Since 1999,He is with the Vellore Institute of
Technology (VIT)University Tamilnadu ,India working in the School of Electrical Science. Presently he is working as a research scholar for PhD degree in the School of Electrical Science at the VIT University. His present research interests are Condition Monitoring of Industrial Drives, Modeling and simulation of Electrical system, Special machines, Application of Soft computing Technique.
IJCSNS International Journal of Computer Science and Network Security, VOL.9 No.9, September 2009
243
K.Vinoth Kumar is a member of IEEE. He is received his B.E. Degree in Electrical and Electronics Engineering from Anna University , Chennai, Tamilnadu India in 2006.He obtained M.Tech., in Power Electronics and Drives from VIT University, Vellore ,Tamilnadu ,India in 2008. Now he is with the Karunya University Coimbatore, India working in the School
of Electrical science. His present research interests are Condition Monitoring of Industrial Drives, Modeling and simulation of Electrical system, Special machines, Neural Networks and fuzzy logic.
K.K.Ray received his B.E. Degree in Electrical Engineering from Jabalpur University, Calcutta India in 1967.He obtained M.Tech from Indian Institute of Technology Kanpur, Kanpur ,India ,in 1977. From 1967 to 2002, Dr Ray was with the Indian School of Mines University, Dhanbad (Jharkhand),India working in the Department of Engineering
and Mining . He received his PhD degree from the Indian Institute of Technology Delhi, New Delhi,India in 1991. Since 2003 he is with the School of Electrical sciences, VIT University Tamilnadu, India. His present research interests are Power Electronics and Drives, Instrumentation and machines, Reactive Power Compensation, Switchgear Protection.