Fuzzy Decision Support in the Early Phases of the Fuzzy ... · [email protected]...
11
General rights Copyright and moral rights for the publications made accessible in the public portal are retained by the authors and/or other copyright owners and it is a condition of accessing publications that users recognise and abide by the legal requirements associated with these rights. • Users may download and print one copy of any publication from the public portal for the purpose of private study or research. • You may not further distribute the material or use it for any profit-making activity or commercial gain • You may freely distribute the URL identifying the publication in the public portal If you believe that this document breaches copyright please contact us providing details, and we will remove access to the work immediately and investigate your claim. Downloaded from orbit.dtu.dk on: Dec 17, 2017 Fuzzy Decision Support in the Early Phases of the Fuzzy Front End of Innovation in Product Development Achiche, Sofiane; Appio, Francesco Paolo Published in: Proceedings of the ASME 2010 International Design Engineering Technical Conferences & Computers and Information in Engineering Conference Publication date: 2010 Document Version Publisher's PDF, also known as Version of record Link back to DTU Orbit Citation (APA): Achiche, S., & Appio, F. P. (2010). Fuzzy Decision Support in the Early Phases of the Fuzzy Front End of Innovation in Product Development. In Proceedings of the ASME 2010 International Design Engineering Technical Conferences & Computers and Information in Engineering Conference: IDETC/CIE 2010 Montreal, Qc, Canada.
Transcript of Fuzzy Decision Support in the Early Phases of the Fuzzy ... · [email protected]...

General rights Copyright and moral rights for the publications made accessible in the public portal are retained by the authors and/or other copyright owners and it is a condition of accessing publications that users recognise and abide by the legal requirements associated with these rights.
• Users may download and print one copy of any publication from the public portal for the purpose of private study or research. • You may not further distribute the material or use it for any profit-making activity or commercial gain • You may freely distribute the URL identifying the publication in the public portal
If you believe that this document breaches copyright please contact us providing details, and we will remove access to the work immediately and investigate your claim.
Downloaded from orbit.dtu.dk on: Dec 17, 2017
Fuzzy Decision Support in the Early Phases of the Fuzzy Front End of Innovation inProduct Development
Achiche, Sofiane; Appio, Francesco Paolo
Published in:Proceedings of the ASME 2010 International Design Engineering Technical Conferences & Computers andInformation in Engineering Conference
Publication date:2010
Document VersionPublisher's PDF, also known as Version of record
Link back to DTU Orbit
Citation (APA):Achiche, S., & Appio, F. P. (2010). Fuzzy Decision Support in the Early Phases of the Fuzzy Front End ofInnovation in Product Development. In Proceedings of the ASME 2010 International Design EngineeringTechnical Conferences & Computers and Information in Engineering Conference: IDETC/CIE 2010 Montreal,Qc, Canada.
Proceedings of the ASME 2010 International Design Engineering Technical Conferences & Computers and Information in Engineering Conference
IDETC/CIE 2010 August 15-18, 2010, Montreal, Quebec, Canada
DETC- 28211
FUZZY DECISION SUPPORT IN THE EARLY PHASES OF THE FUZZY FRONT END OF INNOVATION IN PRODUCT DEVELOPMENT
Sofiane Achiche Department of Management Engineering
Technical University of Denmark Lyngby, Denmark [email protected]
Francesco Paolo Appio Marketing Department Nestlè Italiana S.p.A.
Milan, Italy [email protected]
ABSTRACT The innovation process may be divided into three areas: the
fuzzy front end (FFE), the new product development (NPD)
process, and commercialization. Every NPD process has a FFE
in which products and projects are defined. Companies tend to
begin the stages of FFE without a clear definition and analysis
of the process to go from opportunity identification to concepts,
and often they even abort the process or start over. Koen’s
Model for the FFE is composed of 5 different phases, the first
two being Opportunity Identification and Opportunity Analysis,
which are the focus of this paper. Furthermore, several tools can
be used by designers/managers in order to improve, structure
and organize their work during the FFE. However, these tools
tend to be selected and used in a heuristic manner. Additionally,
some tools are preferred and more effective during specific
phases of the FFE; hence an economic evaluation of the cost of
their usage is very critical and there is also a need to
characterize them in terms of their influence on the FFE.
This paper focuses on decision support for
managers/designers in their process of assessing the cost of
choosing/using tools in the core front end activities, namely
Opportunity Identification and Opportunity Analysis. This is
achieved by analyzing the Influencing Factors (Firm context,
Industry context, Macro environment) along with data
collection from managers followed by the automatic
construction of fuzzy decision support models (FDSM) of the
discovered relationships. The decision support focuses upon the
estimate investment needed for the use of tools during the 2
phases cited above. The generation of FDSMs is carried out
automatically using a specialized genetic algorithm applied to
learning data obtained from 5 experienced managers from 5
different companies. The automatically constructed FDSMs
accurately reproduced the managers’ estimations using the
learning data sets and were very robust when validated with
hidden data sets.
1. INTRODUCTION The innovation process may be divided into three
categories: the fuzzy front end (FFE), the new product
development (NPD) process, and commercialization [19].
Attention has been nearly always turned to the efficiency and
effectiveness of the NPD activities to set up a good market
launch and get adequate payback and return on investments.
Nevertheless, the new products failure rate is still high and one
of the reasons is the simplistic/fuzzy approach toward the front
end analyses. Every NPD process has a FFE in which products and
projects are defined. However, the ways product ideas are
generated, developed and assessed varies greatly [19]. The FFE
is usually described with two approaches: sequential and non-
sequential. Sequential frameworks such as Stage-GateTM
model [9] or PACE® (Product and Cycle-time Excellence)
model [25] are now sometimes considered as not appropriate.
For example, Stage-GateTM
model focuses on the management
of individual or group of projects, not paying attention to links
between technology and business opportunities. Hence, projects
are often extensions of existing products. According to [27],
problems related to the management of multiple projects such
as resources competition and sorting out priorities for
development cannot be solved by such linear thinking. In view
of this fact, it emerges the need to move from a sequential
process model to a non-sequential relationship model [19] (see
Figure 1) and with it the need for tools to help structuring and
decision making.
Proceedings of the ASME 2010 International Design Engineering Technical Conferences & Computers and Information in Engineering Conference
IDETC/CIE 2010 August 15-18, 2010, Montreal, Quebec, Canada
DETC2010-28211
1 Copyright © 2010 by ASME

2 Copyright © 2010 by ASME
Frequently, companies begin the stages of FFE without a
clear definition and analysis of the process to go from
opportunity identification to concepts, often they even abort the
process or to start over. For each stage of the Koen’s Model
[19] several tools, such as Brain Storming, Mind mapping, etc,
exist and can be used by designers to improve, structure and
organize their work in the FFE context. However, these tools
tend to be selected and used in a heuristic manner, which has a
big influence on the total cost of a NPD project, since 70% of
project cost is determined by the decisions made during the FFE
[19] and that cost increase whenever there is a loop-back.
Furthermore, some tools are preferred and more effective
during specific phases of FFE [8]. Hence, economic evaluation
of tools’ cost becomes very critical. It is therefore needed to
characterize the tools in terms of their influence on the FFE and
the cost of their usage.
This paper focuses on decision support for managers in
their process of assessing the cost of choosing/using tools in the
Core Front End “Activity” elements (Opportunity Identification
and Opportunity Analysis) as shown in Figure 1. This is
achieved by analyzing the Influencing Factors (Firm context,
Industry context, Macro environment) and then the construction
of fuzzy decision support models (FDSM) of the discovered
relationships.
Figure 1: The New Concept Development (NCD) model. (Koen, et
al. 2002)
The decision support will focus on the estimate investment
needed for the use of tools during the opportunity identification
and analysis of the FFE. FDSMs will be linking the parameters
of tools in terms of Explicit Costs and Persons to the Estimate
Investment of its use, taking into consideration the use intensity
of the tool. FDSMs are constructed using Fuzzy-Flou[2].
FDSMs generalize and formalize the manager’s assessment
(transportable to other managers), and the If-Then fuzzy rules
of the FDSMs are explicit and can be used as future decision
support rules in the FFE additionally to help to improve the
understanding of this less structured phase of NPD.
Furthermore, the FDSMs enable a company/manager to
understand better the management of its cost structure during
the above mentioned phases of FFE.
In this paper 5 different companies were used for the data
collection. Furthermore, in order to increase the generalization
level of the fuzzy models and to reduce subjectivity, the
learning of the FDSMs was carried out using the data from the
tools that were selected by the majority of companies (3 out of
5).
2. RESEARCH AIM The long term aim of this research is to support managers
when adopting a tool to use during FFE of innovation through
the creation of FDSMs that can be used for the following:
• a starting point for tool adoption/use
• a better distribution of assets (human potential/money)
versus cost of tool usage
• analyses of costs during different phases of FFE
The specific research aims for the work presented in this
paper is to focus on the opportunity identification and
opportunity analysis of the FFE estimate investment.
The inputs of the FDSMs are two macro-parameters
namely: Persons and Explicit Costs.
Each considered tool was assessed by the managers against
these two macro-parameters, which have a set of micro-
parameters. The FDSMs link inputs of the opportunity analysis
and/or opportunity identification phases with an Estimate
Investment of using a tool, through the use and evaluation of the
dimensions Persons and Explicit Costs. In other words, the
micro and macro parameters were used as inputs to FDSMs
(rule base and database) while the output being either the
Estimate Investment or the cost in Persons and the Explicit
Costs. It is noteworthy that in this paper, the developed FDSMs
are not tool specific but will be helping the managers decide on
the estimate investment for the entire phase.
3. RESEARCH METHODOLOGY The research methodology employed is summarized here.
An explorative research to classify the tools was first carried
out, from for which 59 existing tools were assessed and
considered [4]. It is noteworthy that “Tools” embraces methods,
models, systems, frameworks and techniques. Tools were
assessed in terms of (Figure 2):
• Inputs, i.e. information, knowledge, procedures;
• Outputs, i.e. products, services, procedures,
information, knowledge;
• Resources, i.e. two macro-parameters have been
chosen from the analysis of the literature to describe
the resource requirements. Both of them, divided into
micro-parameters.
The tools were classified according to the categories
opportunity analysis and identification proposed by Koen [19].
Figure 1 illustrates the Koen’s Model for FFE [19].
2 Copyright © 2010 by ASME

3 Copyright © 2010 by ASME
Figure 2: Inputs, Outputs and Resources to use tools
In order to build the link between theory and practice, the
case study was carried with 2 Danish and 3 Italian companies.
In this paper, the information collection was done by means of a
3-steps procedure [4] that will be described in the following
sections.
4. DATA COLLECTION In order to collect information data from the companies’
managers, a semi-structured interview was carried out. Many
factors (e.g. available time, factors from inside and outside the
work place, the relationship with the interviewer, the
respondent’s role experience, etc) could influence respondent’s
answers, and it is very difficult for the interviewer to control
them. Given that and in order to reduce the effect of bias, it was
decided to proceed using the following three steps.
4.1.Step 1: Tools reviewing A document containing indications about the context of
FFE (focus on the Opportunity Identification and Opportunity
Analysis stages) and instructions about how to proceed was sent
by e-mail, after a brief explanation of the context, to the
manager. Then the managers are presented with a table
containing all the tools reported by the authors from literature.
This table is used to understand if the company uses/knows the
tool, in which of the two stages mentioned above, and/or if it is
used in combination with other tools. Additionally, the
managers could add in tools used within the organization and
not listed in the table.
The aim of the step 1 is to map the tools’ usage inside the
companies’ practices and processes and to discover other tools
that did not emerge from the literature review.
4.2.Step 2: Mapping Inputs and Outputs This step is a semi-structured interview that was carried out
face-to-face (at the company’s office), or via Skype.
The semi-structured interview used the last incident method
as a starting point, followed by more specific questions about
key FFE’s parameters, to finally end with questions about the
tools. The aim of this step is to have an in depth description of
the environment in which the interviewee operates, to release
further comments about step 1, to understand if the process is
structured or not and to draw a comprehensive mapping of the
inputs and outputs of tools.
4.3.Step 3: Usage Intensity and Parameters Assessment This step was carried out via e-mail. In this part the
manager stated the use intensity of each tool using a Likert scale
1-5. This was followed by an assessment of the parameters and
micro-parameters, with a focus on the rate incidence (%) given
by the interviewee during the interview. The aim of this step is
to formalize results about the usage of resources implied by
adopting a specific tool, which later can be generalized for a
phase.
Figure 3: Final Evaluation Card
After these three steps the results were summarized in a
matrix called Final Evaluation Card (see Figure 3) this is
composed of two axes, the vertical one for indicating the
parameters’ weights, and the horizontal one to represent the use
intensity; two grids are constructed to obtain the Estimate
Investment (qualitative evaluation) related to a single tool.
More details will be given later in this paper.
5. REVIEW OF TOOLS USED IN OPPORTUNITY IDENTIFCATION AND ANALYSIS From the literature review many tools used in the first two
stages of the FFE emerged. In this section a clustering of these
tools will be carried out in order to ease their analysis and
assessment. Some of the methods utilized in the Opportunity
Identification stage (structured approach) are Customer trend
analysis, Road mapping, Technology trend analysis etc.,
whereas, it is possible to conduct analysis of the same stage in
an informal way with tools such as Ad hoc sessions, Water
Cooler, etc. [19].
In the Opportunity Analysis stage it is possible to use the
same tools as in the Opportunity Identification stage [19] and
based on this the data collection from all the tools in both stages
will be merged to form the learning data file for FDSM
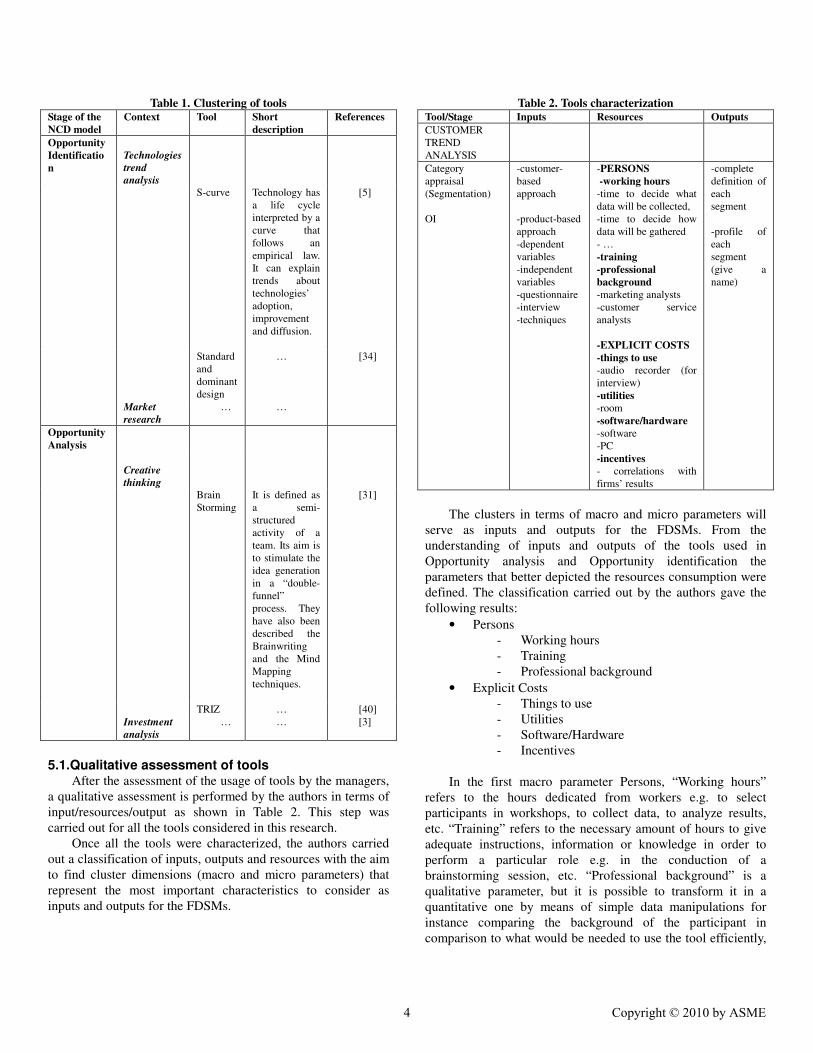
construction. Table 1 gives a short example of the tools’
clustering for each phase and their description. Each manager
received a copy of the table.
3 Copyright © 2010 by ASME
4 Copyright © 2010 by ASME
Table 1. Clustering of tools Stage of the
NCD model
Context Tool Short
description
References
Opportunity
Identificatio
n
Technologies
trend
analysis
S-curve Technology has
a life cycle
interpreted by a
curve that
follows an
empirical law.
It can explain
trends about
technologies’
adoption,
improvement
and diffusion.
[5]
Standard
and
dominant
design
… [34]
Market
research
… …
Opportunity
Analysis
Creative
thinking
Brain
Storming
It is defined as
a semi-
structured
activity of a
team. Its aim is
to stimulate the
idea generation
in a “double-
funnel”
process. They
have also been
described the
Brainwriting
and the Mind
Mapping
techniques.
[31]
TRIZ … [40]
Investment
analysis
… … [3]
5.1.Qualitative assessment of tools After the assessment of the usage of tools by the managers,
a qualitative assessment is performed by the authors in terms of
input/resources/output as shown in Table 2. This step was
carried out for all the tools considered in this research.
Once all the tools were characterized, the authors carried
out a classification of inputs, outputs and resources with the aim
to find cluster dimensions (macro and micro parameters) that
represent the most important characteristics to consider as
inputs and outputs for the FDSMs.
Table 2. Tools characterization Tool/Stage Inputs Resources Outputs
CUSTOMER
TREND
ANALYSIS
Category
appraisal
(Segmentation)
OI
-customer-
based
approach
-product-based
approach
-dependent
variables
-independent
variables
-questionnaire
-interview
-techniques
-PERSONS
-working hours
-time to decide what
data will be collected,
-time to decide how
data will be gathered
- …
-training
-professional
background
-marketing analysts
-customer service
analysts
-EXPLICIT COSTS
-things to use
-audio recorder (for
interview)
-utilities
-room
-software/hardware
-software
-PC
-incentives
- correlations with
firms’ results
-complete
definition of
each
segment
-profile of
each
segment
(give a
name)
The clusters in terms of macro and micro parameters will
serve as inputs and outputs for the FDSMs. From the
understanding of inputs and outputs of the tools used in
Opportunity analysis and Opportunity identification the
parameters that better depicted the resources consumption were
defined. The classification carried out by the authors gave the
following results:
• Persons
- Working hours
- Training
- Professional background
• Explicit Costs
- Things to use
- Utilities
- Software/Hardware
- Incentives
In the first macro parameter Persons, “Working hours”
refers to the hours dedicated from workers e.g. to select
participants in workshops, to collect data, to analyze results,
etc. “Training” refers to the necessary amount of hours to give
adequate instructions, information or knowledge in order to
perform a particular role e.g. in the conduction of a
brainstorming session, etc. “Professional background” is a
qualitative parameter, but it is possible to transform it in a
quantitative one by means of simple data manipulations for
instance comparing the background of the participant in
comparison to what would be needed to use the tool efficiently,
4 Copyright © 2010 by ASME

5 Copyright © 2010 by ASME
for example in order to use tools about category appraisal
efficiently, the participant should have marketing analysts
background, and customer service analysts skills.
The second macro-parameter is Explicit Costs, where
“Things to use” refers to things such as paper, pens, pencils,
audio recorder, etc., that could be needed during the use of a
specific tool. “Utilities” refers to room availability, internet
connection, whiteboards, tables, etc. while “Software/hardware”
is related to the use of things like Office suite, printers, etc., as
support to the decisions. Finally, “Incentives” refer to financial
incentives to participate and/or adopt a specific tool. When
implemented in an FDSM, the macro parameters will be the
output of the models while the micro parameters will be the
inputs. The next step is using Persons and Explicit Costs as
inputs for the Estimate Investment. More details will be given in
the following sections.
6. CASE STUDY AND RESULTS In the experimental assessment of this paper, 5 companies
were used. The managers with whom the project was
conducted, their roles in the companies are described in the
Table 3:
Table 3. List of companies Company
#
Locatio
n
Industry Experienc
e
Representative’s
role
1 DK Engineering
Consultancy
25 years Senior Engineer &
Manager
2 IT Engineering
Handicraft
8 years Export Manager
3 IT Plant
Protection
13 years R&D Manager
4 IT ICT 8 years Project Engineer
Manager
5 DK Healthcare 9 years R&D Innovation
Manager
6.1.Parameter selection for decision support As stated in the section above, the parameters obtained
from the assessment of the tools will be used as inputs for the
FDSM. The FDSMs developed in this paper are of the MISO
(multiple inputs/single output) type. The following sets of
inputs/outputs are considered:
FDSM 1
• Inputs
� Working hours
� Training
� Professional background
• Output
� Persons (investment)
FDSM 2
• Inputs
� Things to use
� Utilities
� Software/Hardware
� Incentives
• Output
� Explicit Costs
FDSM 3
• Inputs
� Persons
� Explicit Costs
• Output
� Estimate Investment
It is noteworthy that FDSM1, FDSM2 and FDSM3 are not
tool specific but applied to the stage of opportunity analysis and
identification as a whole, which is the focus of this paper as
previously stated. However, the same approach can be used for
the construction of tool-specific FDSMs; but more experimental
data need to be collected, from more companies or more
managers, in order to diversify the data and increase the
generalization level of the FDSMs. The FDSMs are expected to
closely match the managers’ evaluations which would lead to a
tool that can be used for decision support by other managers.
Figure 4 illustrates the schematics of the Manager’s fuzzy
decision support system, where the manager starts with a
request to the system in terms of observations on the inputs
which will provide information on Persons investments and/or
Explicit Costs, further up the model an Estimate Investment of
the phase can be obtained using the output from the previous
models.
Figure 4: Schematics of the Managers Fuzzy Decision Support
System
6.2.Fuzzy Decision Support Models In this section, the construction of the FDSM models will
be explained. In order to increase the generalization value of the
models, only data from tools that were used by the majority of
the companies is included in the learning of the FDSMs. In this
paper this means at least three companies have reported using
the tool. Furthermore, at least one of the three companies has to
be either in Denmark or Italy (IT or DK). Additionally, the tools
can be used either in the opportunity analysis phase, the
opportunity identification phase or both. The tools meeting
these constraints are listed in Table 4.
5 Copyright © 2010 by ASME

6 Copyright © 2010 by ASME
Table 4. Tools meeting the constraints for model construction Tool Usage Country
Brainstorming [31] 4 2 IT + 2 DK
SWOT Analysis [21] 4 2 IT + 2 DK
Mind Mapping [36] 3 1 IT + 2 DK
Science and Technology Road Mapping [20] 3 2 IT + 1 DK
Corporate or Product Technology Road
Mapping [20]
3 2 IT + 1 DK
Category Appraisal [26] 3 2 IT + 1 DK
The remaining data from the tools that do not meet the
constrains cited above, will be used a posteriori for validation
of the automatically generated models.
6.3.Construction of the learning Data Sets In order to understand how the data was gathered let us go
through an example with one company. In this case company
“1” will be used. In order to gather quantitative data, a
formalization of results is carried out in terms of resources
requirements per tool. The results can help the company to take
into consideration the distribution and allocation of resources as
estimated by the manager (e.g. spotting inefficient allocation of
resources). Company 1’s Persons and Explicit Costs parameters
usage are illustrated in Figure 5.
Figure 5: Incidence rate of Explicit Costs and Persons on the
company 1’s budget
The Persons’ micro-parameters are expressed in terms of
TIME. However the Explicit Costs’ micro-parameters are
expressed in terms of MONEY within the company.
Considering the budget dedicated to the early stages of the
Fuzzy Front End, the higher incidence is given by the macro-
parameter Persons.
Furthermore, for each tool the company’s manager had to
state the intensity of use of the tools based on a Likert scale 1-5,
where 1 means Low Use Intensity and 5 means High Use
Intensity. Figure 6 shows an example for the tool
Brainstorming.
Figure 6: Company 1’s manager Use Intensity levels for
Brainstorming
Finally, the information collection is organized by the mean
of the 3rd step where the data is formalized. The third step
aims at formalizing the resource requirements. The
formalization is done by a matrix called Final Evaluation Card
(FEC), thanks to which it is possible to calculate the Estimate
Investment (EI) per tool according to the following formula:
∑ ∑= =
=
7
1 1i
EI
k
j
jki llw (1)
where:
i = 1 … 7 (micro-parameters in the FEC)
j = 1 … 5 (Use Intensity levels)
k = the selected Use Intensity level in the FEC
wi = micro-parameters’ weights
ljk = resultant Use Intensity level with the cumulative function
lEI = Estimate Investment level
The values obtained by equation 1, are used as the output
training value levels for the FDSM 3 while the intermediate
results are used for FDSM 1 and FDSM 2 (see Figure 4). The
approach described above was carried out for each company
and tool and used to build up the training set for FDSMs
learning.
6.4.Automatic learning and Generation of FDSM The construction of the FDSMs is carried out automatically
using a specialized genetic algorithm (GA). GAs are powerful
stochastic optimization techniques based on the analogy of the
mechanics of biological genetics and imitate the Darwinian
survival of the fittest approach [12]. Each individual of a
population is a potential FDSM, where four basic operations of
the Real/Binary-Like Coded GA (RBCGA) learning are
performed; reproduction, mutation, evaluation and natural
selection. The RBCGA developed by the authors combines a
real coded and a binary coded GA. The reproduction
6 Copyright © 2010 by ASME

7 Copyright © 2010 by ASME
mechanisms are a multi-crossover proposed by the authors [2]
and a uniform mutation [10].
6.4.1.Performance Criterion of the RBCGA In this paper, the performance criterion is the accuracy
level of the FDSMs (approximation error) in reproducing the
outputs of the learning data. The approximation error is a
combination between the ∆RMS, measured using the RMS error
method and the absolute error, ∆ABS the next two equations
detail these errors.
∑=
−=∆
N
i
outputoutput
MSN
dataRBCGA
1
2
R
)( (2)
While the absolute error is measured as follows:
−=∆ ∑
N
dataRBCGAABS
outputoutputN
I
ABS (3)
where N represents the size of the learning data. The fitness
value φ is evaluated as a percentage of the output length of the
conclusion L, i.e.
1002
1 ABSRMS ×
∆+∆−=
Lφ (4)
6.4.2.Evolutionary strategy To generate the FDSMs using the RBCGA one has to set up
the maximal complexity allowed, the multi-crossover
probability and the mutation probability. In this paper the
maximal complexity is 5 fuzzy sets per input premise and 12
fuzzy sets on the output. However the RBCGA can reduce those
values. The reproduction probabilities are set to: 85% multi-
crossover, 15% simplification rate and 5% mutation, more
details on these mechanisms are given in [1]. The simplification
% is there in order to reduce the complexity of the fuzzy models
and increase their generalization level. The population size is
set to 200 and the number of generations to 200. Each run was
repeated three times to ensure the robustness of the learning
process. At the end of the learning the best individual is selected
according to the highest φ.
6.5.Fuzzy Decision Support Models The genetically generated FDSM 1 and FDSM 2, were
obtained with a fitness function value of 99%, the maximum
absolute errors were 0.18 and 0.16 for FDSM1 and 2
respectively. The RBCGA proposed several FDSMs with a high
fitness function value, however the selected ones were the ones
with the least number of rules. Both FDSM 1 and 2 have only 2
membership functions per premise: high and low. The outputs
consist of 7 fuzzy sets namely: Very Little, Small, Low,
Moderate, Modest, Considerable and Very Sizeable. Figure 7
and Figure 8 show FDSM for the Persons and Explicit Costs
macro-parameters, the two FDSMs presented here constitute the
first two models of the Manager Support System presented in
Figure 4.
Figure 7: Persons FDSM (FDSM 1)
Figure 8: Explicit Costs FDSM (FDSM 2)
7 Copyright © 2010 by ASME

8 Copyright © 2010 by ASME
The third FDSM (FDSM 3) is the global model that takes
as inputs the values obtained from the FDSM 1 and 2. However
the manager can use it individually to assess the estimate
investment in tools during the opportunity analysis and/or
opportunity identification phases.
Figure 9: Estimate Investment FDSM (FDSM 3)
FDSM 3 contains two fuzzy sets on the inputs Persons and
Estimate Cost namely High and Low, while on the output four
fuzzy sets were enough to model the experimental data: Very
Little, Moderate, Considerable and Very Sizeable. FDSM 3 was
generated with an accuracy of 99% while reproducing the
experimental data. The maximum absolute error for FDSM 3 is
0.26.
The advantage of FDSMs is that the manager can both
enter crisp observations in order to predict one of the macro-
parameters or use fuzzy sets as inputs and hence add uncertainty
to his observations and still get a crisp value as an output.
Figure 9 illustrates FDSM 3 which represents the last part of the
Manager Support System presented in Figure 4.
As one can see from Figure 7, Figure 8 and Figure 9 the
FDSMs are totally transparent, which means that the mangers
that will use the models can at the same time understand the
relationships between the different inputs and outputs through
the analysis of the explicit if-then fuzzy rules. The semantics
linked to the FDSMs through the fuzzy sets help giving a
human assessment of the estimate investment during critical
FFE stages.
6.6.Validation of the FDSMs Using Hidden Data As cited above, the learning was done using five different
tools, however during the case study several other tools were
listed by the managers as being used but they did not fulfill the
generalization constrains the authors set-up in order to be
included in the learning set of FDSMs. In this section the data
from these tools will constitute the hidden data.
The hidden data will test the robustness of developed
FDSMs. Table 5 lists all the tools used for constructing the
validation data set along with the frequency of their usage.
Table 5. Tools for model validation
Tool Usage Country
QFD [39] 2 1 IT + 1 DK
PFMP [15] 1 0 IT + 1 DK
Ideal Concepts [24] 1 0 IT + 1 DK
Analogical Thinking [11] 1 0 IT + 1 DK
Morphological Analysis [29] 1 0 IT + 1 DK
TRIZ [40] 2 1 IT + 1 DK
KJ-Method [28] 1 0 IT + 1 DK
Design for X [38] 1 0 IT + 1 DK
Elicitation [36] 2 2 IT + 0 DK
Alien Interviewing [23] 2 1 IT + 1 DK
Competitive Intelligence Analysis [17] 2 1 IT + 1 DK
Porter’s Five Forces [14] 2 1 IT + 1 DK
Blue Ocean Strategy (Strat. Canvas) [18] 2 1 IT + 1 DK
Scenario Planning [35] 2 1 IT + 1 DK
Conjoint Analysis [13] 2 1 IT + 1 DK
IT Road Mapping [20] 2 1 IT + 1 DK
PPM Road Mapping [20] 2 1 IT + 1 DK
PEST Analysis [16] 2 1 IT + 1 DK
Investment Analysis [3] 2 1 IT + 1 DK
AHP [36] 1 1 IT + 0 DK
Random Word [30] 1 0 IT + 1 DK
Brain writing [36] 1 0 IT + 1 DK
Value Appropriation Methods [33] 1 0 IT + 1 DK
GE Matrix [21] 1 0 IT + 1 DK
BCG Matrix [21] 1 0 IT + 1 DK
S Curve [5] 1 0 IT + 1 DK
Nominal Group Technique [32] 1 0 IT + 1 DK
Lead User Technique [22] 1 0 IT + 1 DK
Focus Group [6] 2 1 IT + 1 DK
Once the data merged into three different validation files
(for FDSM1, FDSM2 and FDSM3), the absolute error profile
and the correlations between fuzzy prediction and human
evaluation are shown in Table 6.
8 Copyright © 2010 by ASME

9 Copyright © 2010 by ASME
Table 6. Error and correlations between fuzzy and human
predictions Max Absolute
Error
Mean Absolute
Error
Correlations
FDSM1 Persons 0.41 0.10 99%
FDSM2 Estimate
Cost
0.42 0.12 99%
FDSM3 Estimate
Investment
2.78 0.81 96.3%
One can easily see from Table 6 that the mean absolute
error is still low. even when the FDSMs were tested with hidden
data. FDSM 1 and 2 predicted the human decision with 99%
correlation. a maximum absolute error of 0.42 and the mean
absolute error of 0.12. FDSM3 performs a bit less accurately
with a maximum absolute error of 2.78 on a scale of 15.
However, the average absolute error remains quite low with
0.81 and the correlation high with 96.3%.
7. CONCLUSION This paper presented three different fuzzy logic
decision support models for evaluating costs in terms of
Persons, Explicit Costs and Estimate Investment needed for
using support tools during the early stages of the fuzzy front end
of product development. Each of the models was a multiple
input single output fuzzy knowledge bases. The fuzzy models
were constructed using quantitative data collected form a case
study carried out with 5 experienced managers from 5 different
companies situated in Denmark or Italy. The obtained results
confirm the possibility of estimating the costs of the usage of
tools to structure the fuzzy front end of innovation during the
opportunity identification and opportunity analysis phases. The
three automatically generated fuzzy decision support models
developed here matched the managers’ evaluations of the
investigated dimensions in the learning phase and remained
very stable when validated with the hidden data that was not
included in the learning set. When selecting fuzzy decision
support models from the final population of the genetically
generated solutions, the authors favoured smaller and more
simple rule bases because they can be more easily investigated
by managers in order to understand the influence of the inputs
on the outputs and hence better manage the cost of a specific
phase in relation to the use of a specific support tool. The
approach adopted in this paper can easily be extended to the
other phases of the fuzzy front end, and can both be applied to a
single tool or an entire phase.
ACKNOWLEDGMENTS The authors want to thank all the participants to the case
conducted in this paper.
REFERENCES [1] Achiche, S., Balazinski, M., & Baron, L. (2004). Multi-
combinative Strategy to Avoid Premature Convergence in
Genetically-generated Fuzzy Knowledge Mechanics.
Journal of Theoretical and Applied Mechanics, vol. 42, n.
3 , pp. 417-444.
[2] Achiche, S., Baron, L., & Balazinski, M. (2003).
Real/Binary Like Coded Genetic Algorithm to
Automatically Gneerate Fuzzy Knowledge Bases. IEEE
Frouth International Conference on Control and
Automation (pp. 799-803). Montreal, Canada.
[3] Anthony, R., Hawkins, D., & Macrì, D. (2005). Sistemi di
Controllo. Analisi economiche per le decisioni aziendali.
2nd ed.: McGraw-Hill.
[4] Appio, F. (2009). Managing the Early Stages of the Fuzzy
Front End of Innovation: How Companies Use Tools to
Identify and Analyze Opportunities. Master Thesis,
Department of Management Engineering, Technical
University of Denmark, Copenhagen.
[5] Brown, R. (1992). Managing the "S" curves of innovation.
Journal of Consumer Marketing, vol. 9, issue 1 .
[6] Bruseberg, A., & McDonagh, P. (2002). Focus groups to
support the industrial/product designer: a review based on
current literature and designers feedback. Applied
Ergonomics, vol. 33 .
[7] Bsalazinski, M., Bellerose, M., & Czogala, E. (1993).
Application of Fuzzy Logic Techniques to the Selection of
Cutting Parameters in Machining Processes. International
Journal of Fuzzy Sets and Systems, vol. 61 , pp. 307-317.
[8] Commission, E., & Innova, E. (2008). Insights on
Innovation Management in Europe. Tangible Results From
IMP3rove.
[9] Cooper, R. (2001). Winning at New Products. Cambridge:
Perseus Publishing.
[10] Cordòn, O., Herrera, F., & Villar, P. (2000). Analysis and
Guidelines to Obtain a Good Uniform Fuzzy Partition
Granularity for Fuzzy-rule Based Systems using Simulated
Annealing. International Journal of Approximate
Reasoning , pp. 187-216.
[11] Dahl, D., & Moreau, P. (2002). The Influence and Value of
Analogical Thinking During New Product Ideation.
Journal of Marketing Research, vol. 39 .
[12] Goldberg, D. (1989). Genetic Algorithms in Search,
Optimization and Machine Learning. Massachussetts:
Addison-Wesley.
[13] Green, P., & Srinivasan, V. (1990). Conjoint Analysis in
Marketing: New Developments With Implications for
Research and Practice. Journal of Marketing, n. 54 .
[14] Grundy, T. (2006). Rethinking and reinventing Micheal
Portr's five forces model. Strategic Change, August .
[15] IPU, YORK, & PTC. (2005). Lean Product Structures.
Case: YORK. Denmark.
[16] Jones, K. (2007). PEST or STEP analysis. Retrieved from
http://202.205.89.79/download/materials/2007f/discipline/
9 Copyright © 2010 by ASME

10 Copyright © 2010 by ASME
Marketing/Kevin%20Jones/2b.%20PEST%20or%20STEP
%20Analysis.ppt
[17] Kahaner, L. (1998). Competitive Intelligence: How to
Gather, Analyze and Use Information to Move Business to
the Top. New York: Touchstone Books.
[18] Kim, W., & Mauborgne, R. (2007). Strategia Oceano Blu.
Vincere senza competere. Harvard Business School Press,
ETAS.
[19] Koen, P., & al., e. (2002). Fuzzy Front End: Effective
Methods, Tools and Techniques. In P. Belliveau, A. Griffin,
& S. Somermeyer, PDMA Toolbook fr New Product
Development. New York: John Wiley and Sons.
[20] kostoff, R., & Schaller, R. (2001). Science and Technology
Roadmaps. IEEE Transactions on Engineering
Management, vol. 48, n. 2 .
[21] Kotler, P., & Scott, G. (1993). Marketing Management.
Analisi, Pianificazione, Attuazione e Controllo. 7th ed.:
Prentice Hall International, ISEDI.
[22] Lilien, G., & al., e. (2002). Performance Assessment of the
Lead User Idea-Generation Process for New Product
Development. Management Science, vol. 48, n. 8 .
[23] List, D. (2005). Market research methods for innovation
development: an overview. Retrieved from
http://www.emarketing.net.cn/upload/file/2009/02/05/1612
33822055976.pdf
[24] McAloone, T., & Bey, N. Environmental improvement
through product development. Denmark.
[25] McGrath, M., & Akiyama, C. (1996). PACE: An Integrated
Process for Product and Cycle Time Exellence. In M.
McGrath, Setting the PACE in Produc Development.
Boston: Butterworth and Heinemann.
[26] Myers, J. (1996). Segmentation and Positioning for
Strategic Marketing Decisions. Chicago, Illinois: American
Marketing Association.
[27] Nelson, B. (2004). What Comes After Stage-gate: The
Need for a New Framework for Innovation. Retrieved from
http://www.workingforums.com/articles/Article3.pdf
[28] Noji, K. (2001). KJ Method. Second Thematic Training
Course, United Nations Centre for Regional Development
(UNCRD). Nagoya, Japan.
[29] Prokopska, A. (2001). Application of Morphological
Analysis Methodology in Architectural Design. Acta
Polytechnica, vol. 41, n. 1 .
[30] Richardson, A., Hupp, R., & Seethaler, R. (2003). The Use
of Lateral Thinking in Finding Creative Conflict
Resolutions. Retrieved from
http://www.tuti.com.au/Publications/2003/2003ABA.pdf
[31] Rossitier, J., & Lilien, G. (1994). New "Brainstorming"
Principles. Australian Journal of Management, vol. 19,
issue 1 .
[32] Sample, J. (1984). Nominal Group Technique: An
Alternative to Brainstorming. Retrieved from
http://www.joe.org/joe/1984march/iw2.html
[33] Schilling, M. (2005). Gestione dell'innovazione. It. ed.,
McGraw-Hill.
[34] Schilling, M. (1998). Technological lockout: an integrative
model of the economic and strategic factors driving
technology success and failure. Academy of Management
Review, vol. 23, n. 2 .
[35] Schoemaker, P. (1995). Scenario Planning: A Tool for
Strategic Thinking. Sloan Management Review, vol. 36,
issue 2 .
[36] UNIDO. (2005). UNIDO Technology Foresight Manual.
Organization and Methods. Vienna, vol. 1.
[37] van Kleef, E. (2006). Consumer research in the early stages
of new product development. Issues and applications in the
food domain. Chapters 1-2-5, PhD thesis, Wageningen
University.
[38] Watson, B., & Radcliffe, D. (1998). Structuring Design for
X Tool Use for Improved Utilization. Journal of
Engineering Design, vol. 9, n. 3 .
[39] Yang, C., & Fang, H. (2003). Integrating fuzzy logic into
quality function deployment for product positioning.
Journal of the Chinese Institute of Industrial Engineers,
vol. 20, n. 3 .
[40] Zhang, F. (2004). The Objectives Decision Making Study in
Product Innovation Development Process Based on TRIZ
Technology Evolution Theory . Retrieved from
Scientific.net Materials Science and Engineering, vols.
471-472: http://www.scientific.net
10 Copyright © 2010 by ASME


![Chapter 3: Fuzzy Rules & Fuzzy Reasoning513].pdf · CH. 3: Fuzzy rules & fuzzy reasoning 1 Chapter 3: Fuzzy Rules & Fuzzy Reasoning ... Application of the extension principle to fuzzy](https://static.fdocuments.net/doc/165x107/5b3ed7b37f8b9a3a138b5aa0/chapter-3-fuzzy-rules-fuzzy-513pdf-ch-3-fuzzy-rules-fuzzy-reasoning.jpg)