Industrial Automation Repairs, Spares and Service | Canada | Lektronix

Institut C.D. HOWE Institute
commentaryNO. 472
Future Shock? The Impact of
Automation on Canada’s Labour Market
Doomsday scenarios abound about massive job loss due to automation. But the future is much less bleak for workers in Canada.
Matthias Oschinski and Rosalie Wyonch

Essential Policy Intelligence | Conseils indispensablessur les
polit
ique
s
INST
ITU
TC.D. HOWE
INST
ITU
TE
Daniel SchwanenVice President, Research
Commentary No. 472March 2017Human Capital Policy
C.D. Howe Institute publications undergo rigorous external reviewby academics and independent experts drawn from the public andprivate sectors. The Institute’s peer review ensures the quality, integrityand objectivity of its policy research. The Institute will not publish anystudy that, in its view, fails to meet these standards.
The Institute requires that its authors publicly disclose any actual or potential conflicts of interest of which they are aware.
In its mission to educate and foster debate on essential public policy issues, the C.D. Howe Institute provides nonpartisan policy advice to interested parties on a non-exclusive basis. The Institute will not endorse any political party, elected official, candidate for elected office, or interest group.
As a registered Canadian charity, the C.D. Howe Institute as a matter of course accepts donations from individuals, private and public organizations, charitable foundations and others, by way of general and project support. The Institute will not accept any donation that stipulates a predetermined result or policy stance or otherwise inhibits its independence, or that of its staff and authors, in pursuing scholarly activities or disseminating research results.
The Institute’s Commitment to Quality
About The Authors
Matthias Oschinski is Manager, Economics Practice, at PricewaterhouseCoopers, Canada.
Rosalie Wyonchis Policy Analyst, at the C.D. Howe Institute.
$12.00isbn 978-1-987983-22-7issn 0824-8001 (print);issn 1703-0765 (online)

The Study In Brief
Throughout history, technological change has helped lift people out of squalor and poverty, raised standards of living and improved well-being. Technological change, however, can also be disruptive – rendering specific occupations and skills obsolete, unsettling economic structures and contributing to unemployment and economic uncertainty.
Innovation is a driving factor of productivity and economic growth, but increasing productivity means that fewer people are needed to produce the same amount of goods. The increasing pace of technological change has led some to speculate that, in the digital era, technology might destroy old jobs faster than new ones are created. Job losses can occur, however, only if innovation outstrips growth in demand for new products and services. As well, the potential for automation does not necessarily translate into actual automation: the decision to automate depends on factors such as firm size, competitive pressure and the cost of a machine versus the cost of human labour.
This Commentary assesses the impact of technological change on Canada’s labour market over the past 30 years and highlights its implications for the near future. If the past is any guide, a continuation of gradual changes can be expected in the demand for skills in the labour force. This is a natural market reaction to technological change. There is unlikely to be a drastic shift in employment due to automation in the near future, although some industries and types of occupations will be more disrupted than others. Here, public policy could both encourage automation and prepare the workforce for the transition. Key findings are as follows:
• It is very unlikely that employment in occupations highly susceptible to automation (35 percent of Canada’s employment) will be completely replaced by smart machines over the next few years.
• Canadian employment is concentrated in industries that have a low risk of automation, with industries where less than a quarter of the jobs are susceptible to automation accounting for 27.5 percent of total employment (4.9 million jobs). Industries where more than three-quarters of the jobs are at high risk of automation account for only 1.7 percent of employment (310,000 jobs). This implies that Canada’s diversified economy and labour force are well positioned to adapt to rapid technological change.
• Occupations high in abstract, complex-decision-making skills with a strong focus on creativity, critical thinking and interpersonal social skills have a relatively low risk of being automated. An increase in demand for these skills is likely over the near and medium term.
• As the rate of technological progress increases and digitization permeates different occupations and industries, technical job-specific skills might become obsolete relatively quickly. This indicates a need to increase opportunities for continuous education and lifelong learning. Educational institutions such as colleges, technical schools and apprenticeship programs likely will have an expanded role over the lifecycle of employment as people learn to adapt to changing conditions.
C.D. Howe Institute Commentary© is a periodic analysis of, and commentary on, current public policy issues. Barry Norris and James Fleming edited the manuscript; Yang Zhao prepared it for publication. As with all Institute publications, the views expressed here are those of the authors and do not necessarily reflect the opinions of the Institute’s members or Board of Directors. Quotation with appropriate credit is permissible.
To order this publication please contact: the C.D. Howe Institute, 67 Yonge St., Suite 300, Toronto, Ontario M5E 1J8. The full text of this publication is also available on the Institute’s website at www.cdhowe.org.

2
Technological progress has helped to lift people out of squalor and poverty, raised standards of living and improved well-being. In many instances, however, technological change has also been disruptive, rendering specific occupations and skills obsolete, unsettling economic structures and contributing to unemployment and economic uncertainty.
The conventional view – based on the experiences of past periods of industrial change – is that technological progress and innovationare desirable, as they contribute to increasedproductivity, which, in turn, translates into higherincomes through economic growth (Miller andAtkinson 2013). With technology, productionrequires fewer workers, who can then be employedelsewhere, causing the total level of production inthe economy to increase.
Recent developments in automation, however, characterized by machine-to-machine communication and increased digitization, have some economists worried. In their view, the digital era could herald a time when technology destroys old jobs faster than new ones can be created (Krugman 2013; Levy and Murnane 2004; Sirkin, Zinser and Hohner 2011). As Cowen (2013) puts it, “increasingly, machines are providing not only the brawn but the brains, too.” The extension of technology into new domains is increasing uncertainty about which occupations might exist in the future and what jobs will be created
to replace the automated ones (for definitions of occupation, task and skill and the differences among them for the purposes of this Commentary, see Box 1).
Another branch of economic policy debate argues that Canada faces an imminent shortage of the skills it needs to adopt new technologies and remain globally competitive. The reasoning is that an aging workforce and competition from abroad to recruit and retain talent are contributing to a shortage of skilled individuals in the labour market. It is not clear that Canada suffers from a broad-based shortage of skilled labour: labour shortages might exist in specific sectors and occupations, but they are not necessarily more common now than in the past (Massé, Roy and Gingras 1998).
This Commentary assesses the impact of technological change on Canada’s labour market over the past 30 years and highlights implications for the near future. Recent publications have made rather startling claims that large portions of the population face unemployment in the years to come, both in Canada and the United States (see Brynjolfsson and McAfee 2014; Frey and Osborne 2013; and Lamb 2016). This claim, however, is somewhat alarmist. Taking the immediate past into account, we expect a continuation of gradual changes in the demand for skills in the labour force – a natural market reaction to technological change. A drastic shift
The views expressed in this publication are the authors’ own and do not necessarily represent the views of PwC Canada. The authors would like to thank Jane Li for her assistance at the outset of this research. We also extend thanks to David Gray, Andrew Heisz, Peter Howitt, Lara Speirs, Arthur Sweetman, CPA Canada, Polytechnics Canada, Colin Busby, Daniel Schwanen and anonymous reviewers for their insightful comments. The authors retain responsibility for any errors and the views expressed.
Technological change has been the hallmark of economic progress throughout human history. With the invention of the steam engine, humanity set in motion the Industrial Revolution that put it on a path of economic development unprecedented in history.

3 Commentary 472
in employment due to automation is unlikely in the near future, although particular industries and types of occupations will be disrupted more than others. Consequently, public policy – by encouraging collaboration between public and private institutions in preparing the workforce for the transition to new technologies – should both encourage the adoption of these technologies and ensure that the workforce has the necessary skills to succeed.
Creative Destruction: What It Is and Why It Is Needed
The process of technological progress is one of “creative destruction,” where some occupations, skills, products and firms become obsolete and are replaced by a technologically superior alternative. This process, facilitated by trade, improves overall economic growth and raises living standards in the long run. In the short run, however, it risks igniting economic and political tensions as some businesses fail and some people lose their jobs. At the same time, new jobs are created and the skills required for
some others might change dramatically. Creative destruction is not a uniform process – it does not affect all sectors and occupations evenly. Rather, it is sporadic, with bursts of growth in certain sectors and decline in others. This process of creation-causing obsolescence can be seen in the pattern of high levels of both job creation and destruction that rapidly growing economies exhibit (Howitt 2015).
Similar to their effects on the labour market, technological innovations are not uniformly transformative. Some might affect only specific processes in a few industries. Others, known as “general purpose technologies,” affect virtually all sectors of the economy, resulting in widespread productivity gains and spurring the development of complementary goods that make use of and/or improve the technology (Rainer and Strohmaier 2014). The most recent innovations in automation and machine-to-machine communications (the “Internet of things”) are such complementary developments extending from general purpose information and communications technologies
Box 1: Skills, Tasks and Occupations: A Glossary
Skill: an ability, whether learned or inherent, that facilitates the learning, acquisition and application of knowledge. Certain skills require learned procedures; others are abstract. Skills that can be acquired through learned procedure are easier to automate, as human procedures can be translated into computational ones.
Task: the application of skill and knowledge to complete a goal. If a task requires only skills that are procedural, the task is routine. If a task requires skills that are abstract, the task is non-routine, as the procedure varies in some abstract way to complete the goal.
Occupation: a set of tasks that can be performed either by a human or by technology or (in almost all cases) a combination of both. For this discussion, we classify occupations consistent with the National Occupational Classification used by Statistics Canada for labour market information. An occupation can be automated only if substantively all of the tasks required to perform it can be completed without a human. Automating technologies can only perform tasks that consist of skills that are sufficiently procedural as to be facilitated by computers, robots or tools.

4
(IT) that started with the telegraph and developed through radio, television, the computer, satellite communications, the laser and the Internet (Lipsey, Carlaw and Bekar 2005). Although each of these innovations is substantial on its own, they are part of a continuum of developments.1
The eventual effects of today’s innovations on tomorrow’s labour market are a matter of debate amongst academics. The core of the disagreement is whether or not IT will be more transformative of society than the combination of the previous general purpose technologies of the Industrial Revolution. Some argue that IT appears to be advancing much faster than previous technologies, and assert that we are on the verge of a dramatic increase in technological unemployment (Brynjolfsson and McAfee 2014). The reasons for this assumption are threefold. First, Moore’s Law2 states that technological progress occurs at an increased pace as processing capability decreases in cost. Second, technology nowadays is mainly digital, making it more applicable in a variety of industries and occupations. Third, IT enables new ways of combining and recombining ideas, and thus the ability to spawn new innovations (Arthur 2011). These factors combined are resulting in increasingly fast development of new technologies and in the application of autonomous technologies
to new disciplines and tasks. On the opposing side are those, such as Robert Gordon (2016), who hypothesize that improvements in standards of living afforded by the combination of the steam engine, electricity, central heat and indoor plumbing were fundamentally transformative of almost every aspect of daily life, and the magnitude of this transformation is unlikely to be repeated by today’s information technologies.
How, in fact, has technology affected the Canadian labour market so far? What can the changing composition of the labour market following the invention, refinement and adoption of new technologies tell us about the effects of these technologies? Are there any indications of significant shifts or other signals that the pace of change in the labour market is accelerating?
Robots at Work in Canada’s Labour M arket
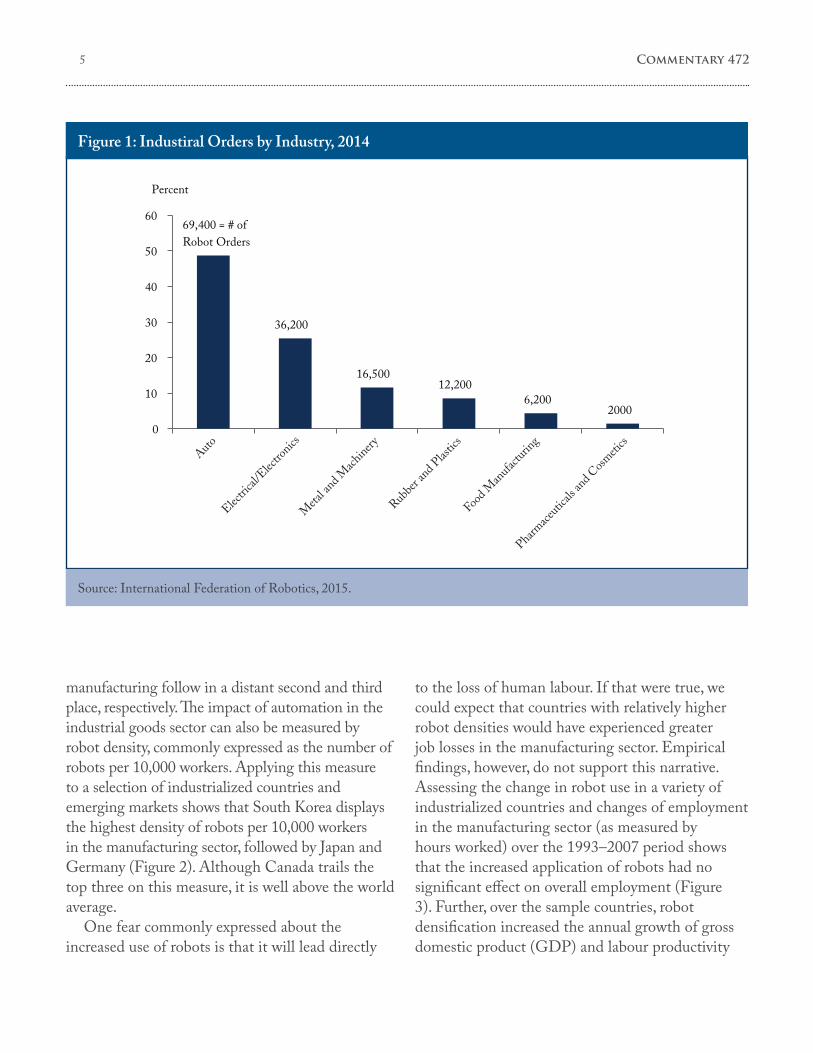
What can the process of automation so far tell us about the effect of future automation in the workplace? One indication of increased automation is the use of industrial robots, particularly in auto manufacturing,3 which accounts for almost half of the industrial robots sold in Canada (Figure 1). Electrical goods manufacturing and metal and machinery
1 The telegraph was made possible by the invention of the voltaic cell in 1800, an early form of direct current electricity that was limited in its range of applications (Lipsey, Carlaw and Bekar 2005) The telegraph, in turn, was critical to the organization and coordination of railways. The combination of railway, telegraph and electricity made possible unprecedented and expansive transportation and communications networks that gave rise to modern business enterprises that engage in mass production and mass distribution (Gordon 2016). In this sense, a linear continuum along a singular general purpose technology is an oversimplification of the benefit that such technologies can have through interaction and mutual improvement.
2 Moore’s Law refers to the observation, by Gordon Moore, co-founder of Intel, that the processing power of computers increases exponentially while their relative cost decreases at a similar rate.
3 An industrial robot, as defined by the International Organization for Standardization, is “an automatically controlled, reprogrammable, multipurpose manipulator programmable in three or more axes, which may be either fixed in place or mobile for use in industrial automation applications” (ISO 8373). Any computational hardware that does not fit this description is not considered a robot for the purposes of this discussion.
5 Commentary 472
manufacturing follow in a distant second and third place, respectively. The impact of automation in the industrial goods sector can also be measured by robot density, commonly expressed as the number of robots per 10,000 workers. Applying this measure to a selection of industrialized countries and emerging markets shows that South Korea displays the highest density of robots per 10,000 workers in the manufacturing sector, followed by Japan and Germany (Figure 2). Although Canada trails the top three on this measure, it is well above the world average.
One fear commonly expressed about the increased use of robots is that it will lead directly
to the loss of human labour. If that were true, we could expect that countries with relatively higher robot densities would have experienced greater job losses in the manufacturing sector. Empirical findings, however, do not support this narrative. Assessing the change in robot use in a variety of industrialized countries and changes of employment in the manufacturing sector (as measured by hours worked) over the 1993–2007 period shows that the increased application of robots had no significant effect on overall employment (Figure 3). Further, over the sample countries, robot densification increased the annual growth of gross domestic product (GDP) and labour productivity
Figure 1: Industiral Orders by Industry, 2014
Source: International Federation of Robotics, 2015.
69,400 = # of Robot Orders
36,200
16,50012,200
6,2002000
0
10
20
30
40
50
60
Percent
Auto
Electri
cal/E
lectro
nics
Meta
l and
Mach
inery
Rubbe
r and
Plas
tics
Food M
anufa
cturin
g
Pharmace
utical
s and
Cos
metics

6
by about 0.37 percent, making it responsible for approximately one-tenth of aggregate growth over the period (Graetz and Michaels 2015).4
Thus, increased automation does not inevitably lead to higher unemployment in the manufacturing sector. The impact of automation on the labour market largely depends on whether the new technology is a substitute for, or a complement to, human labour. This depends on the tasks the
automation will take over and whether it can perform them with a comparable level of skill. Sufficiently complex tasks require advanced skills that cannot currently be performed by autonomous technology. In this context, then, it is helpful to analyze the tasks employees perform and to distinguish between tasks that, in principle, can be automated and those that cannot.
Figure 2: Density of Robots in Manufacturing by Country, 2014
Source: International Federation of Robotics, 2015.
0
50
100
150
200
250
300
350
400
450
500
Density(Robots per 10,000 workers)
South
Kore
aJap
an
Sweden
Denmark
Belgium
United
States
Spain
Taiwan
France
Finlan
d
Austri
a
Canad
a
Wor
ldwide
Avg
.
China
German
y
4 The growth attributable to robot densification was calculated by comparing realized growth to the counterfactual scenario that robot densities remained constant over the period of analysis (1993–2007).

7 Commentary 472
The Impact of Autom ation on Job Tasks
The first step is to distinguish between occupations consisting of predominantly routine tasks that, in principal, are automatable and those that include non-routine tasks that cannot as easily be performed by machines or smart software. Occupations that consist of mostly non-routine, manual labour, like personal care workers, generally require lower qualifications and involve interpersonal interaction. Jobs that consist mostly of routine tasks, like business administration, are generally middle wage and require more education than do non-routine manual jobs but little interpersonal interaction. Non-routine cognitive occupations, like lawyers and engineers,
are generally high wage and require interpersonal interaction and a high level of education (Figure 4).
Applying this classification to the Canadian labour market, the increase in non-routine cognitive and non-routine manual jobs has outpaced job growth in routine occupations (see Appendix Table A-1 for a breakdown of occupations into task categories). Indeed, between 1987 and 2015, employment in non-routine cognitive occupations increased by 91 percent (2.6 million jobs) and in non-routine manual occupations by around 78 percent (700,000 jobs). In contrast, employment in routine occupations grew by only 27 percent (2.2 million jobs) over the period (Figure 5). Consequently, this development has shifted employment shares in the workforce (Figure 6). In 1987, routine occupations constituted roughly
Figure 3: Change in Robot Use and Manufacturing Employment, by Country (1993-2007)
Note: Data for robotic density in Canada are not available before 2010 .Source: Graetz and Michaels, 2015.
Australia
Austria
DenmarkFinland
France
South Korea
Hungary
Italy
Germany
Spain
Sweden
UK
United States
y = 0.0453x - 14.174 R² = 0.1891
-30
-25
-20
-15
-10
-5
0
5
10
15
20
25
0 50 100 150 200 250 300 350 400 450
Percentage Change in Manufacturing Hours
Percentage Change in # of Robots
NetherlandsBelgium

8
Figure 4: Employment Classification Grid
Source: Autor, Levy and Murnane 2003, adapted to Canadian occupation classifications.
Routine Non-Routine
• Scheduling and coordination• Labourers • Administrative and clerical • Sales and Customer service• Trades and equipment operators• Manufacturing
Manual
• Food-service• Personal Care• Technical and assisting occupations in health• Protective Services
Cognitive
• Professional occupations in health, business, finance, education, law, social and community services
• Natural and applied science• Managerial occupations
Low-educational requirementsHigh level of interpersonal interaction
Middle-educational requirementsLow level of interpersonal interaction
High- educational requirementHigh level of interpersonal interaction
65.9 percent of the labour force; by 2015, this share had declined to around 57.7 percent. The employment share of non-routine cognitive jobs, in contrast, rose from 23.2 percent in 1987 to 30.6 percent in 2015. Non-routine manual jobs, which account for a relatively small share of the labour force, increased from 7.2 percent in 1987 to 8.8 percent in 2015.
The shift away from routine occupations and towards non-routine jobs indicates a change in skill requirements, driven in part by technological change. Still, the Canadian labour market has not experienced job polarization to the extent that the US labour market has. South of the border, middle-income jobs have diminished relative to both low- and high-wage jobs (Cheremukhin 2014). In Canada, in contrast, wage polarization reflects a combination of regional resource booms and increases in the minimum wage. Moreover, the
growth of low-income jobs has been outpaced by the growth of middle-income jobs, which, in turn, has been outpaced by the growth of high-income jobs (Green and Sand 2015). This suggests that, at least for Canada, technological change is increasing the demand for skills in the labour market and increasing the growth of middle- and high-income occupations, as opposed to displacing middle-income earners. However, the relative decline in routine-intensive jobs signals that adaptive and interpersonal skills are becoming increasingly important aspects of occupations.
The Likelihood of Autom ation by Occupation in Canada
To quantify the skills content of a given occupation, we used information provided by the Occupational Information Network (O*Net), a database

9 Commentary 472
Figure 5: Employment Change by Occupation Task Category, Canada 1987-2015
Source: Authors’ calculations, Statistics Canada, Labour Force Survey.
80
100
120
140
160
180
200
1987
1988
1989
1990
1991
1992
1993
1994
1995
1996
1997
1998
1999
2000
2001
2002
2003
2004
2005
2006
2007
2008
2009
2010
2011
2012
2013
2014
2015
Percent Change(1987=100)
Non-Routine Cognitive
Non-Routine Manual
Routine
Figure 6: Employment Shares by Task Categories, Canada 1987 and 2015
Source: Authors’ calculations, Statistics Canada, Labour Force Survey.
23.2
7.2
65.9
30.6
8.8
57.7
0
10
20
30
40
50
60
70
Non-Routine Cognitive Non-Routine Manual Routine
Percent
1987 2015

1 0
containing detailed definitions for almost all occupations, and providing quantitative indicators on the importance and the level of skills used in each occupation. Using feedback from engineers and artificial intelligence (AI) researchers, we selected skills that remain difficult to computerize (Table 1).
Each occupation requires a different mix of these skills, at different intensities and levels. In principle, the occupations that have high skill requirements in the areas identified as barriers to automation are impossible to automate, while those with low requirements are theoretically automatable. The occupations that have low requirements for some skills and high requirements for others are less obvious. It is likely that aspects of these jobs are automatable, while others are not. In these cases, automating technologies might improve each
employee’s productivity, so that, as the occupation itself evolves, fewer and fewer people are required to perform it. If the occupation itself is not fully automatable, some of the tasks allocated to it that require lower skill levels might become “automated.” Occupations requiring high levels of skills that require adaptability to novel situations or that involve social components – for example, instructors of persons with disabilities, police officers or specialist physicians – are unlikely to be automatable. Occupations whose tasks require low levels of adaptation or do not require subtle human interactions – for example, bookkeepers, motor vehicle assemblers and service station attendants – are easier to automate. To estimate the likelihood that a given occupation can be automated, we used a partial set of all occupations. Using real-world examples, we classified jobs between those that
Table 1: Skill Barriers to Automation
Source: O*NET Database.
Social perception Being aware of others’ reactions and understanding why they react as they do.
Originality The ability to come up with unusual or clever ideas about a given topic or situation, or to develop creative ways to solve a problem.
Assisting others Providing personal assistance, medical attention, emotional support or other personal care to others such as coworkers, customers or patients
Philosophy Knowledge of different philosophical systems and religions, including their basic principles, values, ethics, ways of thinking, customs, practices and their impact on human culture.
Initiative Job requires willingness to take on responsibilities and challenges.
Leadership Job requires willingness to lead, take charge and offer opinions and direction.
Innovation Job requires creativity and alternative thinking to develop new ideas for and answers to work-related problems.
Adaptability and flexibility Job requires openness to change (positive or negative) and to consider variety in the workplace.
Independence Job requires developing one’s own way of doing things, guiding oneself with little or no supervision and depending on oneself to get things done.

1 1 Commentary 472
Figure 7: Likelihood of Automation by Employment and Occupation Category
Source: Authors’ calculations, Statistics Canada, Labour Force Survey.
0
50
100
150
200
250
300
350
00.
020.
040.
060.
08 0.1
0.12
0.14
0.16
0.18 0.2
0.22
0.24
0.26
0.28 0.3
0.32
0.34
0.36
0.38 0.4
0.42
0.44
0.46
0.48 0.5
0.52
0.54
0.56
0.58 0.6
0.62
0.64
0.66
0.68 0.7
0.72
0.74
0.76
0.78 0.8
0.82
0.84
0.86
0.88 0.9
0.92
0.94
0.96
0.98 1
Employment('000)
Management Business, Finance and Administration
Natural and Applied Sciences Health
Education, Law, Social, Community and Government Services
Arts, Culture, Recreation and Sport
Sales and Service Trades, Transport and Equipment Operators
Natural Resources and Agriculture Manufacturing and Utilities
Probability (0-1)
certainly can be automated and those we are most confident cannot. Using these occupations and their associated skills requirements as a “training set,” we used a statistical machine-learning technique to estimate the probabilities for all occupations (see online Appendix B for details).5
Our approach expands on similar work in this area (see Frey and Osborne 2013), with two significant differences. First, since previous work contains skills that have since become automatable, we used an updated list of skills that cannot be computerized,6 focusing on those that
5 We estimated a “likelihood of automation” for each occupation specified by Statistics Canada’s 4-digit 2011 National Occupational Classification; for full results, please contact [email protected].
6 A previously identified barrier to automation was tasks that involve complex perception and manipulation skills – finger dexterity, manual dexterity and the ability to work in cramped or awkward positions (Frey and Osborne 2013). Large strides have been made in the automation of these physical abilities, and in most contexts they no longer represent a domain of strict human dominance.

1 2
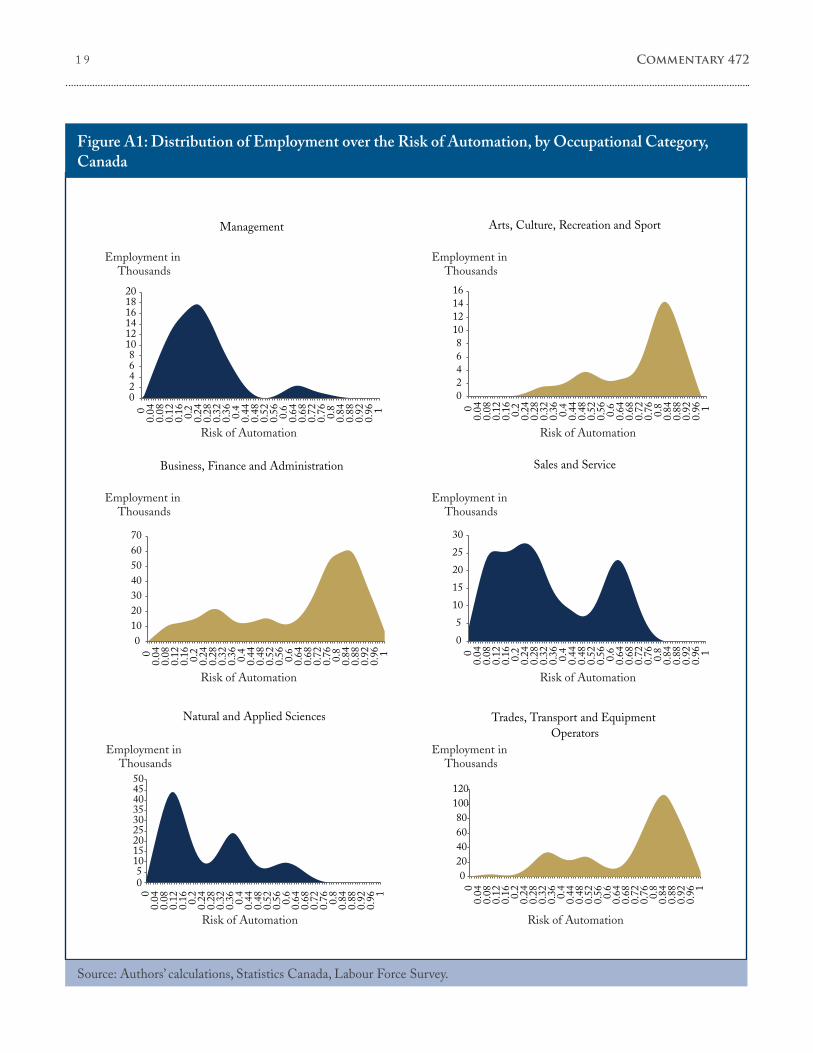
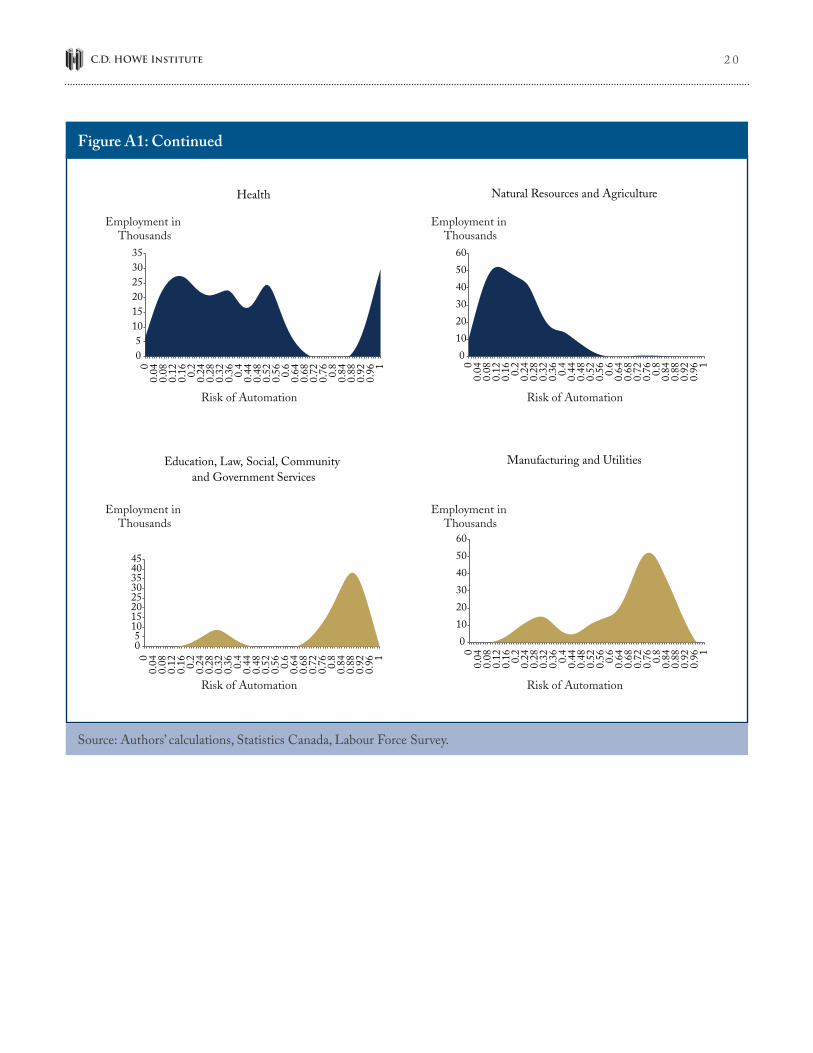
require creativity and flexibility when facing novel situations. By the updated measure, we find that Canada’s employed are less at risk of automation from today’s level of technology than they would be from that in 2013. Second, in providing information on skills requirements by occupation, O*Net distinguishes between the level and importance of skills. Although importance signals the general requirement of a specific skill for a certain occupation, the level is the intensity with which the skill is applied to that occupation. Previous research focuses only on the level of skills, and does not account for the importance of that skill to an occupation. In contrast, we weighed skill level by importance for each occupation to be able to use both pieces of information in our analysis. The analysis yields an estimate of the probability that an occupation, in its current form, could be automated; see Figure 7.7 The likelihood of automation varies by occupational group: low for health, and natural and applied sciences; higher for manufacturing and utilities, trade transport and equipment operators, and business finance and administration.
Some industries contain more occupations with a higher likelihood of automation than do other industries. To establish which industries are more vulnerable to automation, we first defined their level of susceptibility to automation. Accounting for underlying differences in the number of occupations in each category and their uneven distribution, we determined occupations with a likelihood of automation lower than 0.36 to be at “low risk,” and
those with a likelihood of automation higher than 0.72 to be at “high risk.”8 Applying these thresholds at the industry level allowed us to determine the share of “high-risk” employees by industry (Figure 8).
There are 16 industries where the share of “most vulnerable” employment exceeds 50 percent,9 but only two where at least three-quarters of the jobs are in occupations with a high risk of automation: agriculture (92.2 percent) and fishing, hunting and trapping (94.2 percent). The industries with the highest proportion of employment vulnerable to automation are those that have already become highly automated. These industries, however, represent a relatively small share of total employment. Rather, employment is concentrated in industries that are less susceptible to automation: those where less than a quarter of employees are vulnerable to automation account for 4.9 million Canadian jobs (27.5 percent of the total), while industries where more than 75 percent of employees are at high risk from automation account for only 310,000 jobs (1.7 percent of the total).
The employment effects of automation thus are unevenly dispersed, and weigh most heavily on industries that historically were already a focus of concern about job losses due to technological change. This suggests that efforts to prepare the labour force for potential technological change might be able to build on existing programs, as we discuss below. The concentration of employment in industries where occupations are less at risk from automation also signals that Canada’s diversified
7 See Appendix Figure A-1 for the distribution of employment by occupational category. Detailed results of probability estimates for each occupation are available upon request.
8 See online Appendix B for a detailed explanation. To account for differences in the underlying distributions of each occupation category, we estimated the standard deviation, proportioned by the skew, for each distribution to calculate a range around the mean of each distribution. We then weighted these ranges by the number of observations in each occupation type to determine a single aggregate range of “medium risk” of automation.
9 To account for the suppressed employment data, we calculated the share of the vulnerable employed as the weighted average of the high and low possible values of the most vulnerable. Weight was determined by the percentage of the employed at high risk in the known sample.

1 3 Commentary 472
Figure 8: Vulnerable Employment by Industry in Canada
Source: Authors’ calculations, Statistics Canada, Labour Force Survey.
102030405060708090
100
0
500
1000
1500
2000
2500
PercentEmployment(’000)
Unknown (supressed in data)
Employment at low or medium risk
Employment at high risk
Percent of employment at high risk
0
Com
pute
r Sys
tem
Des
ign
Serv
ices
Man
agem
ent,
Scie
ntifi
c an
d T
echn
ical
Ser
vice
sO
ther
Pro
fess
iona
l Ser
vice
sE
duca
tiona
l Ser
vice
sH
ealth
Car
e an
d So
cial
Ass
ista
nce
Prof
essi
onal
Bus
ines
s Se
rvic
esP
ublic
adm
inis
trat
ion
Who
lesa
le T
rade
Oil
and
Gas
Ext
ract
ion
Fin
ance
, Ins
uran
ce, R
eal E
stat
e an
d L
easi
ngIn
form
atio
n, c
ultu
re a
nd re
crea
tion
Util
ities
Oth
er s
ervi
ces
Supp
ort A
ctiv
ities
for M
inin
g an
d O
il an
d G
as E
xtra
ctio
nC
onst
ruct
ion
Oth
er T
rans
por t
atio
n E
quip
men
t Man
ufac
turi
ngC
ompu
ter,
Ele
ctro
nic
and
Ele
ctri
cal P
rodu
cts
Ret
ail T
rade
Man
agem
ent,
Adm
inis
trat
ive
and
Oth
er S
uppo
rtT
rans
port
atio
n an
d W
areh
ousi
ngFo
rest
ry a
nd L
oggi
ng w
ith s
uppo
rt a
ctiv
ities
Min
ing
and
Qua
rryi
ng (e
xcep
t Oil
and
Gas
)
Food
and
Bev
erag
e Pr
oduc
tsA
ccom
mod
atio
n an
d fo
od s
ervi
ces
Pape
r Man
ufac
turi
ng
Rub
ber,
Pla
stic
s an
d C
hem
ical
sO
ther
Man
ufac
turi
ngM
etal
Fa b
rica
tion
and
Mac
hine
ry (e
xclu
ding
ele
ctri
cal)
Prin
ting
and
Rel
ated
Sup
port
Act
iviti
esW
ood
Prod
uct M
anuf
actu
ring
Mot
or V
ehic
le, B
ody,
Tra
iler &
Par
ts M
anuf
actu
ring
Agr
icul
ture
F
ishi
ng, H
untin
g an
d T
rapp
ing
Man
ufac
ture
d M
iner
al P
rodu
cts
economy and labour force are well positioned to adapt to rapid technological change.
Autom ation’s Economic Impact: Is This Time Different?
It is important to note at this point that the potential for automation does not necessarily translate into actual automation. The decision to invest in robots or smart software clearly depends
on a number of factors: firm size, competitive pressure and the cost of a machine versus the cost of human labour, to name a few. Just because something has been invented does not mean it is immediately useful or commercially viable. General purpose technologies can take decades to reach their full potential for productivity improvement and adoption. Electricity had a deep effect on the labour market when it diffused through society, but it failed to provide dramatic productivity gains in

1 4
manufacturing until the complementary innovation of the assembly line – which itself was previously not possible due to difficulties in extending steam or water power far from its central location within factories (Howitt 2015). Electricity also lowered the basic skill level required for formerly skilled jobs (Lipsey et al. 2005); in contrast, modern innovations are increasing the demand for skilled labourers capable of using the new technologies.
Two economic concepts also offset the effects of automation on the demand for labour. First, automation is not normally a perfect substitute for a human worker. Occupations that can be automated might create new occupations to oversee the technology – for example, cashiers who oversee automatic checkouts at the grocery store. Other occupations cannot be sufficiently automated to remove the human worker; in these cases, the automation that does occur can make human workers more productive and allow them to focus on the parts of their job that cannot be performed by a robot. Second, if technology improves a product or service, people might demand more of it, which could offset some potential job losses. These offsetting effects of automation can lower the impact of technology on overall employment – indeed, to this point, they have resulted in increases in living standards, rather than massive job losses. Further, research suggests that, if automation runs ahead of the creation of new complex tasks, technological development will shift towards the creation of new complex tasks and away from automation (Acemoglu and Restrepo 2016).
The idea that technology can destroy jobs faster than new ones are created is not new. The earliest example of writings on the subject, to our
knowledge, is Aristotle’s speculation that sufficiently automated tools would eliminate the need for various occupations (Campa 2014), although the debate might have begun with the invention of the wheel (Woirol 1996). There have been numerous resurgences of the idea over the past two centuries. A well-known example is the Luddite riots between 1811 and 1816, in which textile workers protested the automation of production by destroying weaving machinery. With the advent of electrification came further concerns about the displacement of workers by the increasing pace of technology. Economists from Marx to Keynes discussed the effects that technology would have on employment.10 Concerns about automation and joblessness in the 1950s and 1960s were high enough that the US government asked a commission to study the subject. The commission concluded that automation did not threaten employment because “the basic fact is that technology eliminates jobs, not work” (United States 1966, 9); it did, however, recommend a number of public policies to help displaced workers find new jobs through transitionary unemployment assistance and an expansion of public education. The debate has continued with each major technological innovation: the introduction of personal computers in the early 1980s, the Internet and e-commerce in the 1990s and the “Internet of things” today.
Our analysis of employment data suggests that automation in the job market is a gradual process, and that the labour market has already been adjusting to technological progress over time (Figure 9). The share of employment in occupations at low risk of automation (those that have higher skill requirements) has been growing steadily over time: by around 35 percent between 1987 and 2015.
10 Marx and Keynes agreed that less labour would be required to produce the same amount of goods. They disagreed about who was likely to receive the benefits of this increased productivity and the role of government if the pace of technological unemployment outstripped growth in the demand for goods and services.

1 5 Commentary 472
Figure 9: Composition of Employment by Risk Category
Source: Authors’ calculations, Statistics Canada, Labour Force Survey.
-40-30-20-10
01020304050
1987
1988
1989
1990
1991
1992
1993
1994
1995
1996
1997
1998
1999
2000
2001
2002
2003
2004
2005
2006
2007
2008
2009
2010
2011
2012
2013
2014
2015
2016
2017
2018
2019
2020
2021
2022
2023
2024
Unknown
Change in percentage of employment at high riskChange in percentage of employment at medium riskChange in percentage of employment at low risk
Projection
Percent Change(1987=100)
Conversely, the share of employment in occupations that are at a high risk of automation (those that require less adaptive skills) has been decreasing. These gradual changes in the skills composition of the labour market have been rather continuous for the past three decades. As a consequence, employment in high-risk occupations has been on a steady decline.
Policy Implications
Given historical trends of employment, it seems unlikely that all occupations in the high-risk category will be replaced by smart machines over the next few years. If the immediate past is any guide, we expect a continuation of gradual changes in the demand for skills – a natural market reaction to technological change. Unlike some other recent analyses, therefore, we reject a “doomsday scenario” of rapidly increasing job losses due to automation (Lamb 2016). Rather, we believe there is room for public policy to moderate the effect of technological change on the labour market in a number of ways.
First, occupations high in abstract, complex decision-making skills with a strong focus on creativity, critical thinking and interpersonal social skills have a relatively low risk of being automated. Hence, an increase in the demand for these skills is likely over the near and medium term. Even children can be taught complex abstract skills: a study conducted in England found that year 5 children who were taught formal philosophical reasoning, focusing on questioning, constructing arguments and reasoned discussion, improved their literacy, numeracy and cognitive ability scores; teachers and pupils also reported improvement in interpersonal skills, self-confidence and general classroom engagement (Gorard, Siddiqui and Beng Huat See 2015). As a consequence, emphasis should be placed on teaching critical reasoning and interpersonal skills from an early age so that, by the time students enter the workforce, they will have the necessary skills to succeed.
Second, it is becoming increasingly important to equip new entrants into the workforce with an

1 6
entrepreneurial mindset. Increasingly, workers are facing a more disruptive environment in which it is important for them to be able to identify problems and respond in value-adding ways. As occupations require higher levels of skills, workers will have to adapt and make decisions without requiring managerial input. Entrepreneurial thinking should not be confined to business owners and business leaders – a workforce equipped with an entrepreneurial mindset is poised to reap more of the benefits of the next industrial revolution – in whatever form it takes. Teaching these essential skills will require a combined effort by the public sector, the private sector and educational institutions.
Finally, since technical job-specific skills might become obsolete faster as the rate of technological progress increases and digitization permeates a variety of different occupations and industries, opportunities need to be increased for continuous education and lifelong learning. Private-sector employers should be aware that it is in their own interest to broaden training opportunities for existing employees, as this would help them reap the benefits of automation and digitization. As well, the role of educational institutions such as colleges, technical schools and apprenticeship programs should expand over the lifecycle of employment as workers seek to adapt to changing conditions. An experienced workforce that is given the chance to upgrade its skills set on a continual basis will demonstrate higher levels of both productivity and job satisfaction.
Helping Workers Make the Transition
Preparing employers and employees for an increasingly disruptive economic environment will be a challenge, but policies that encourage employers to improve the skills of their employees would help offset employment losses related to increased automation. If employers did not have to bear the full cost of retraining employees, they would be less reluctant to invest in training only to
see a skilled employee move to a competitor, while employees themselves would become more resilient to labour market disruptions due to technological change. Along this line of reasoning, a number of promising policies are already in place in Canada. One is the Canada Job Grant (CJG) program, which offers financial incentives to employers to provide training (through an eligible third-party trainer) to improve employees’ skills. The program is of dual benefit, as it allows employers to determine the kinds of training workers need most and the cost of that training is split between the public and the employer.
The policy is being expanded through two new pilot programs in Ontario. The first, “Upskill,” funds partnerships to develop sector-specific training programs for essential and technical skills. The program is designed to help the sector’s employers meet their shared workforce development needs by encouraging competing employers to collaborate in training workers for the collective benefit of all parties. The second program, “Customized training,” incentivizes employers to develop firm-specific training programs in partnership with third-party trainers. This is similar to the CJG, with the added benefit that programming can be tailored to the firm’s specific needs, as opposed to its being limited to pre-existing programs. Both pilot programs, at least in theory, improve upon the existing policy’s flexibility. If effective, the CJG might provide a base to work from, and through variation become a central pillar of Canada’s labour market policy response to the risk of automation and skills displacement.
Quebec, rather than participate in the CJG, instead receives an equivalent federal transfer to administer its own training policies. Employers in Quebec must pay 1 per cent of the total employee payroll (less eligible training expenditures) in taxes that, in addition to the federal transfer, are directed towards training programs. The programs are developed in collaboration with employers, unions and the education sector. The Quebec policy offers flexibility to employers by allowing them to invest

1 7 Commentary 472
in training themselves, through direct spending on employee training, or to remit the equivalent expense in taxes to be directed towards general training programs.
Conclusions
Technological change does not inevitably lead to a reduction in human labour. Where automation complements human labour, technological change increases productivity, which should be reflected in higher wages and overall economic gains. Even where automation substitutes for human labour, machines and smart software can be expected gradually to take over specific aspects of a job, rather than replacing it entirely. Technology, moreover, can create more jobs than it replaces, as society adopts, incorporates and continues to develop new technologies.
We find no evidence of an imminent threat of massive unemployment due to automation. The automation of job tasks is part of the natural process of technological innovation and a necessary engine of economic growth. Labour market trends show a gradual shift in the skills level demanded, but new technology does not simply make people
redundant; rather, it reduces the labour required for a given level of production. This means that more of the same goods can be produced or people can be redeployed in areas that otherwise might not have been developed. This process, already underway, can be moderated by policy that encourages collaboration between public and private institutions to ensure workers have the necessary skills for a technologically uncertain future. Those whose qualifications are no longer in demand should be helped to gain the qualifications they need for new employment.
Canada is well positioned to tackle the challenges presented by increased automation, including building upon the Canada Jobs Grant, which helps transition workers over the course of their working careers. The combination of strong public educational institutions, a highly skilled workforce and existing policy to assist displaced workers during the transition between jobs is a solid foundation upon which Canada can build. By encouraging the adoption of new technologies and putting in place the appropriate support for workers, Canada can minimize both skills shortages and technological unemployment.

1 8
Appendix A
Table A1: Occupations by Task Categories, Canada
* Statscan skill levels range from 0 or 1, university education required, to 6 or 7, no formal education required.Source: Autor, Levy and Murnane 2003, adapted to Canadian occupation classifications.
Predominant Task Type
National Occupational Classification, 2011 Occupations
Category Skill Level*
Non-routine cognitive
0 0-6
Senior management occupations
Specialized middle management occupations
Middle management occupations in retail and wholesale trade and customer services
1 1 Professional occupations in business and finance
2 1,2 Professional and technical occupations in natural and applied sciences
3 0,1 Professional occupations in health and nursing
4 0-2 Professional and paraprofessional occupations in education, law and social, community and government services
Non-routine manual
5 1,2 Professional and technical occupations in art, culture, recreation and sport
3 2,4 Technical and assisting occupations in health and health services
4 3-4Occupations in front-line public protection services
Care providers and educational, legal and public protection support occupations
Routine
1 2-5
Administrative and financial supervisors and administrative occupations
Finance, insurance and related business administrative occupations
Office support occupations
Distribution, tracking and scheduling coordination occupations
6 2-7 Sales and service occupations
7 2-6 Trades, transport and equipment operators and related occupations
8 2,4,6
Supervisors and technical occupations in natural resources, agriculture and related production
Workers in natural resources, agriculture and related production
Harvesting, landscaping and natural resources labourers
9 2-6 Occupations in manufacturing and utilities
1 9 Commentary 472
Figure A1: Distribution of Employment over the Risk of Automation, by Occupational Category, Canada
Source: Authors’ calculations, Statistics Canada, Labour Force Survey.
02468
101214161820
00.
040.
080.
120.
16 0.2
0.24
0.28
0.32
0.36 0.4
0.44
0.48
0.52
0.56 0.6
0.64
0.68
0.72
0.76 0.8
0.84
0.88
0.92
0.96 1
Management
010203040506070
00.
040.
080.
120.
16 0.2
0.24
0.28
0.32
0.36 0.4
0.44
0.48
0.52
0.56 0.6
0.64
0.68
0.72
0.76 0.8
0.84
0.88
0.92
0.96 1
Business, Finance and Administration
02468
10121416
00.
040.
080.
120.
16 0.2
0.24
0.28
0.32
0.36 0.4
0.44
0.48
0.52
0.56 0.6
0.64
0.68
0.72
0.76 0.8
0.84
0.88
0.92
0.96 1
Arts, Culture, Recreation and Sport
0
5
10
15
20
25
30
00.
040.
080.
120.
16 0.2
0.24
0.28
0.32
0.36 0.4
0.44
0.48
0.52
0.56 0.6
0.64
0.68
0.72
0.76 0.8
0.84
0.88
0.92
0.96 1
Sales and Service
Employment in Thousands
Employment in Thousands
Employment in Thousands
Employment in Thousands
Risk of Automation Risk of Automation
Risk of Automation Risk of Automation
05
101520253035404550
00.
040.
080.
120.
16 0.2
0.24
0.28
0.32
0.36 0.4
0.44
0.48
0.52
0.56 0.6
0.64
0.68
0.72
0.76 0.8
0.84
0.88
0.92
0.96 1
Natural and Applied Sciences
05
101520253035
00.
040.
080.
120.
16 0.2
0.24
0.28
0.32
0.36 0.4
0.44
0.48
0.52
0.56 0.6
0.64
0.68
0.72
0.76 0.8
0.84
0.88
0.92
0.96 1
Health
05
1015202530354045
00.
040.
080.
120.
16 0.2
0.24
0.28
0.32
0.36 0.4
0.44
0.48
0.52
0.56 0.6
0.64
0.68
0.72
0.76 0.8
0.84
0.88
0.92
0.96 1
Education, Law, Social, Community and Government Services
020406080
100120
00.
040.
080.
120.
16 0.2
0.24
0.28
0.32
0.36 0.4
0.44
0.48
0.52
0.56 0.6
0.64
0.68
0.72
0.76 0.8
0.84
0.88
0.92
0.96 1
Trades, Transport and Equipment Operators
0
10
20
30
40
50
60
00.
040.
080.
120.
16 0.2
0.24
0.28
0.32
0.36 0.4
0.44
0.48
0.52
0.56 0.6
0.64
0.68
0.72
0.76 0.8
0.84
0.88
0.92
0.96 1
Natural Resources and Agriculture
0
10
20
30
40
50
60
00.
040.
080.
120.
16 0.2
0.24
0.28
0.32
0.36 0.4
0.44
0.48
0.52
0.56 0.6
0.64
0.68
0.72
0.76 0.8
0.84
0.88
0.92
0.96 1
Manufacturing and Utilities
Employment in Thousands
Risk of Automation
Employment in Thousands
Risk of Automation
Employment in Thousands
Risk of Automation
Employment in Thousands
Risk of Automation
Employment in Thousands
Risk of Automation
Employment in Thousands
Risk of Automation
2 0
Figure A1: Continued
Source: Authors’ calculations, Statistics Canada, Labour Force Survey.
05
101520253035404550
00.
040.
080.
120.
16 0.2
0.24
0.28
0.32
0.36 0.4
0.44
0.48
0.52
0.56 0.6
0.64
0.68
0.72
0.76 0.8
0.84
0.88
0.92
0.96 1
Natural and Applied Sciences
05
101520253035
00.
040.
080.
120.
16 0.2
0.24
0.28
0.32
0.36 0.4
0.44
0.48
0.52
0.56 0.6
0.64
0.68
0.72
0.76 0.8
0.84
0.88
0.92
0.96 1
Health
05
1015202530354045
00.
040.
080.
120.
16 0.2
0.24
0.28
0.32
0.36 0.4
0.44
0.48
0.52
0.56 0.6
0.64
0.68
0.72
0.76 0.8
0.84
0.88
0.92
0.96 1
Education, Law, Social, Community and Government Services
020406080
100120
00.
040.
080.
120.
16 0.2
0.24
0.28
0.32
0.36 0.4
0.44
0.48
0.52
0.56 0.6
0.64
0.68
0.72
0.76 0.8
0.84
0.88
0.92
0.96 1
Trades, Transport and Equipment Operators
0
10
20
30
40
50
60
00.
040.
080.
120.
16 0.2
0.24
0.28
0.32
0.36 0.4
0.44
0.48
0.52
0.56 0.6
0.64
0.68
0.72
0.76 0.8
0.84
0.88
0.92
0.96 1
Natural Resources and Agriculture
0
10
20
30
40
50
60
00.
040.
080.
120.
16 0.2
0.24
0.28
0.32
0.36 0.4
0.44
0.48
0.52
0.56 0.6
0.64
0.68
0.72
0.76 0.8
0.84
0.88
0.92
0.96 1
Manufacturing and Utilities
Employment in Thousands
Risk of Automation
Employment in Thousands
Risk of Automation
Employment in Thousands
Risk of Automation
Employment in Thousands
Risk of Automation
Employment in Thousands
Risk of Automation
Employment in Thousands
Risk of Automation

2 1 Commentary 472
References
Acemoglu, Daron, and Pascual Restrepo. 2016. “The Race Between Machine and Man: Implications of Technology for Growth, Factor Shares, and Employment.” NBER Working Paper 22252. Cambridge, MA: National Bureau of Economic Research.
Arthur, W. Brian. 2011. The Nature of Technology: What It Is and How It Evolves. New York: Penguin.
Autor, David, Frank Levy and Richard Murnane. 2003. “The Skill-Content of Recent Technological Change: An Empirical Investigation.” Quarterly Journal of Economics, 118:1279-1333.
Brynjolfsson, Erik, and Andrew McAfee. 2014. The Second Machine Age: Work Progress and Prosperity in a Time of Brilliant Technologies. New York: W.W. Norton.
Campa, Riccardo. 2014. “Technological Growth and Unemployment: A Global Scenario Analysis.” Journal of Evolution and Technology 24 (1): 86–103.
Cheremukhin, Anton. 2014. “Middle-Skill Jobs Lost in U.S. Labor Market Polarization.” Dallas Fed Economic Letter 9 (5): 1–4.
Cowen, Tyler. 2013. “Who will prosper in the new world?” New York Times, August 31.
Frey, Carl Benedikt, and Michael A. Osborne. 2013. “The Future of Employment: How Susceptible Are Jobs to Computerisation?” Oxford: Oxford University, Oxford Martin School, Programme on the Impacts of Future Technology. September.
Gordon, Robert. 2016. The Rise and Fall of American Growth: The U.S. Standard of Living since the Civil War. Princeton, NJ: Princeton University Press.
Gorard, Stephen, Nadia Siddiqui, and Beng Huat See. 2015. Philosophy for Children: Evaluation Report and Executive Summary. Durham, UK: Durham University.
Graetz, George, and Guy Michaels. 2015. “Robots at Work.” CEP Discussion Paper 1335 London: Centre for Economic Performance.
Green, David A., and Benjamin M. Sand. 2015. “Has the Canadian Labour Market Polarized?” Canadian Journal of Economics, 48 (2): 612–46.
Howitt, Peter. 2015. Mushrooms and Yeast: The Implications of Technological Progress for Canada’s Economic Growth. Commentary 433. Toronto: C.D. Howe Institute. September.
Karatzoglou, Alexandros, Alex Smola, and Kurt Hornik. 2016. Kernel-Based Machine Learning Lab. Version 0.9-25. Comprehensive R Archive Network, available online at https://cran.r-project.org/package=kernlab.
Krugman, Paul. 2013. “Sympathy for the Luddites.” New York Times, June 14.
Lamb, Creig. 2016. The Talented Mr. Robot: The Impact of Automation on Canada’s Workforce. Toronto: Brookfield Institute for Innovation + Entrepreneurship. June.
Levy, Frank, and Richard Murnane. 2004. The New Division of Labor: How Computers are Creating the Next Job Market. Princeton, NJ: Princeton University Press.
Lipsey, Richard, Kenneth Carlaw, and Clifford Bekar. 2005. Economic Transformations: General Purpose Technologies and Long-Term Economic Growth. Oxford: Oxford University Press.
Massé, Philippe, Richard Roy and Yves Gingras. 1998. The Changing Skill Structure of Employment in Canada. Quebec: Applied Research Branch, Strategic Policy, Human Resource Development Canada. November.
Miller, Ben, and Robert D. Atkinson. 2013. “Are Robots Taking Our Jobs, or Making Them?” Washington, DC: Information Technology and Innovation Foundation. September.
Rainer, Andreas, and Rita Strohmaier. 2014. “Modeling the Diffusion of General Purpose Technologies in an Evolutionary Multi-sector Framework.” Empirica 41 (3): 425–44.

2 2
Rasmussen, Carl E., and Christopher Williams. 2006. Gaussian Processes for Machine Learning. Cambridge, MA: MIT Press.
Seeger, Matthias. 2004. “Gaussian Processes for Machine Learning.” International Journal of Neural Systems, 14 (2): 69-106.
Sirkin, Harold L., Michael Zinser, and Douglas Hohner. 2011. “Made in America, Again: Why Manufacturing Will Return to the U.S.” [n.p.]: Boston Consulting Group. August.
United States. 1966. National Commission on Technology, Automation, and Economic Progress. Report, Vol. 1. Washington, DC: US Government Printing Office.
Woirol, Gregory R. 1996. The Technological Unemployment and Structural Unemployment Debates. Westport, CT: Greenwood Press.

Notes:

Notes:

Support the InstituteFor more information on supporting the C.D. Howe Institute’s vital policy work, through charitable giving or membership, please go to www.cdhowe.org or call 416-865-1904. Learn more about the Institute’s activities and how to make a donation at the same time. You will receive a tax receipt for your gift.
A Reputation for Independent, Nonpartisan ResearchThe C.D. Howe Institute’s reputation for independent, reasoned and relevant public policy research of the highest quality is its chief asset, and underpins the credibility and effectiveness of its work. Independence and nonpartisanship are core Institute values that inform its approach to research, guide the actions of its professional staff and limit the types of financial contributions that the Institute will accept.
For our full Independence and Nonpartisanship Policy go to www.cdhowe.org.
Recent C.D. Howe Institute Publications
March 2017 Krane, Joshua, and Brian Facey. “Promoting Innovation and Efficiency by Streamlining Competition Reviews.” C.D. Howe Institute E-Brief.February 2017 Sen, Anindya. Smokes, Smugglers and Lost Tax Revenues: How Governments Should Respond. C.D. Howe Institute Commentary 471.February 2017 Robson, William B. P., Alexandre Laurin, and Rosalie Wyonch. Getting Real: A Shadow Federal Budget for 2017. C.D. Howe Institute Commentary 470.February 2017 Robson, William B. P., Alexandre Laurin. Hidden Spending: The Fiscal Impact of Federal Tax Concessions. C.D. Howe Institute Commentary 469. February 2017 Ciuriak, Dan, and Jingliang Xiao. Aftershocks: Quantifying the Economic Impacts of a US Border Adjustment Tax. C.D. Howe Institute Working Paper.February 2017 Robins, Steven. “A Better Flight Path: How Ottawa can Cash In on Airports and Benefit Travellers.” C.D. Howe Institute E-Brief.February 2017 Koeppl, Thorsten, and Jeremy Kronick. Blockchain Technology – What’s in Store for Canada’s Economy and Financial Markets?. C.D. Howe Institute Commentary 468. January 2017 Robson, William B.P. Enduring Virtues: Saving and Investing as National Priorities for Canada in 2017. C.D. Howe Institute Commentary 467. January 2017 Ciuriak, Dan, and Jingliang Xiao. Protectionism and Retaliation. C.D. Howe Institute Working Paper. January 2017 Rémillard, Richard. Government Intervention in Venture Capital in Canada: Toward Greater Transparency and Accountability. C.D. Howe Institute Commentary 466. January 2017 Hicks, Peter. Toward a New Balance in Social Policy: The Future Role of Guaranteed Annual Income within the Safety Net. C.D. Howe Institute Commentary 465. January 2017 Johnson, Jon R. The Art of Breaking the Deal: What President Trump Can and Can’t Do About NAFTA. C.D. Howe Institute Commentary 464.

C.D
. HO
WE
Ins
tit
ut
e
67 Yonge Street, Suite 300,Toronto, O
ntarioM
5E 1J8