FUTURE PROSPECTS FOR FISH AND FISHERY … · The present study Forecasting fish consumption and...
25
FAO Fisheries Circular No. 972/5 FIPP/C972/5 (En) ISSN 0429-9329 FUTURE PROSPECTS FOR FISH AND FISHERY PRODUCTS 5. Forecasting fish consumption and demand analysis: a literature review
Transcript of FUTURE PROSPECTS FOR FISH AND FISHERY … · The present study Forecasting fish consumption and...
FAO Fisheries Circular No. 972/5 FIPP/C972/5 (En) ISSN 0429-9329
FUTURE PROSPECTS FOR FISH AND FISHERY PRODUCTS 5. Forecasting fish consumption and demand analysis: a literature review

Copies of FAO publications can be requested from: Sales and Marketing Group
Information Division FAO
Viale delle Terme di Caracalla 00100 Rome, Italy
E-mail: [email protected] Fax: (+39) 06 57053360

FAO Fisheries Circular No. 972/5 FIPP/C972/5 (En)
FUTURE PROSPECTS FOR FISH AND FISHERY PRODUCTS 5. Forecasting fish consumption and demand analysis: a literature review by Lena Westlund FAO Consultant
FOOD AND AGRICULTURE ORGANIZATION OF THE UNITED NATIONS Rome, 2005
The designations employed and the presentation of material in this information product do not imply the expression of any opinion whatsoever on the part of the Food and Agriculture Organization of the United Nations concerning the legal or development status of any country, territory, city or area or of its authorities, or concerning the delimitation of its frontiers or boundaries.
All rights reserved. Reproduction and dissemination of material in this information product for educational or other non-commercial purposes are authorized without any prior written permission from the copyright holders provided the source is fully acknowledged. Reproduction of material in this information product for resale or other commercial purposes is prohibited without written permission of the copyright holders. Applications for such permission should be addressed to the Chief, Publishing Management Service, Information Division, FAO, Viale delle Terme di Caracalla, 00100 Rome, Italy or by e-mail to [email protected]
© FAO 2005

iii
PREPARATION OF THIS DOCUMENT
At the end of the 1990s, the FAO Fisheries Department initiated a project aimed at projecting world fish consumption by 2015/2020. A number of component studies were initiated. They included geographically limited studies (North America, Europe, Japan, China) and a review of analytical work undertaken on fish consumption and demand for fish. However, it was not feasible to integrate these studies because of difficulties encountered in reconciling assumptions and methodologies. It has therefore been decided to publish the completed component studies. The present study Forecasting fish consumption and demand analysis: a literature review is the fifth of a series of papers (still in preparation) intended to be published under the main title Future prospects for fish and fishery products. It has been written by Ms Lena Westlund.
iv
Westlund, L. Future prospects for fish and fishery products. 5. Forecasting fish consumption and demand analysis: a literature review. FAO Fisheries Circular. No. 972/5. Rome, FAO. 2005. 17p.
ABSTRACT This paper reports on a number of issues and approaches in demand analysis. The review highlights different ways of treating supply and illustrates that direct (ordinary) demand systems and inverse demand systems are both applied in the analysis of fish demand. Various aspects of aggregation are discussed, both across products and across households, and with regard to income distribution and geographic location. Examples of studies incorporating socio-demographic factors are quoted and the author discusses the issue of incorporating habit formation through dynamic models as well as the phenomenon of structural change. The author presents income/expenditure elasticities for fish obtained from a number of studies undertaken in Bangladesh and Indonesia. Finally, some issues regarding forecasting fish consumption and demand are discussed.

v
CONTENTS
Page
1. INTRODUCTION 1
2. SELECTED ISSUES IN DEMAND ANALYSIS OF FISHERY PRODUCTS 2
3. REVIEW OF SOME MODELLING RESULTS: DEMAND ELASTICITIES
IN INDONESIA AND BANGLADESH 8
4. FORECASTING FUTURE FISH CONSUMPTION AND DEMAND 11
5. FINAL REMARKS 13
6. REFERENCES 13

1
1. INTRODUCTION The FAO Fisheries Department takes a special interest in the forecasting of future fish consumption and demand. In the current situation, characterized by a worldwide stagnating capture fisheries production – as many fish stocks are fully exploited or overexploited – a rapid increase in aquaculture production, in particular for high value species, and globalization of trade, it is becoming increasingly important to understand the structure and processes of the sector in order to guide its development. This becomes particularly important when recognizing the role fish plays in food security – both as a source of income and as food supplies – in many developing countries. In line with the outcome of the 1996 World Food Summit, relevant strategies need to be in place for the different food sectors, including the fishery products sector, in order to fight world hunger and malnutrition and to secure the future supply of fish worldwide. The objective of the present literature review is to report on approaches and methods used for predicting consumption and analysing demand for fish. However, in spite of an extensive literature search,1 very little work was found on quantitative predictions of fish consumption or demand in the future. The existing work with a global coverage includes the exploratory calculations and analyses carried out by FAO for the International Conference on the Sustainable Contribution of Fisheries to Food Security in Kyoto, Japan, in 1995 (FAO, 1995; Westlund, 1995), the new version of Westlund’s model by Ye in 1999, and projections for 2015/30 by DeNigris (DeNigris, draft 2000). Some work has also been done on a country-basis, e.g., for Indonesia (Chong, 1992). More recently, there are the studies carried out in China, Japan, the USA and Europe.Work on food consumption predictions has also been carried out by IFPRI2 and ICLARM3. The former has developed the IMPACT4-model for predicting the future consumption of 18 different commodities. The model – which is probably the most complete food commodity analysis model existing – is an agricultural sector model that is global in its coverage, dividing the world into 36 geographical regions. (Rosegrant, Sambilla and Perez 1995; Delgado and Courbois, 1999). However, this model does not yet include fish even though work is ongoing – together with ICLARM and in collaboration with FAO – on revising IMPACT to include fishery products. ICLARM has published forecasts for the future fish consumption development in sub-Saharan Africa (Delgado and McKenna, 1997). Wessells and Anderson (1992) reported an increase in research and literature on fish demand. This increased interest in the marketing side of the fisheries sector has been motivated by the structural changes that have taken place during the last decades with regard to fisheries management and the development of aquaculture, and the recognition of the strong links between the supply side and the market. Part of this literature focuses on analysing possible implications of various policy measures such as the effect of import tariffs on domestic prices, an example being the work on the New England groundfish market and the role of Canadian imports by Crutchfield (1985) and Felixson, Allen and Storey (1987). Work aimed at giving guidance to the industry includes the analysis of the demand for Atlantic salmon in the North American and European markets and its implications for the fish farming industry 1 The author is indebted to the FAO Fisheries Library for assisting in this work. 2 International Food Policy Research Institute, Washington D.C., United States of America. 3 International Centre for Living Aquatic Resources, Penang, Malaysia. 4 International Model for Policy Analysis of Agricultural Commodities and Trade.

2
(Kabir and Ridler, 1984; Herrmann and Lin, 1988; Lin et al., 1989) and studies of the Japanese demand for fish (Wessells and Wilen, 1993, 1994). Studies with a commercial policy focus concentrates on markets and products in industrialized countries. The limited studies available on developing countries often have a policy focus but more at the Government level. Examples include studies on Bangladesh (Pitt, 1983; Talukder, 1993; Ahmed and Shams, 1994) and on China (Gao, Wailes and Cramer, 1996) and draw conclusions with regard to food policies and food security issues for poorer population strata. Other work has a more theoretical focus and aims at improving the models and the academic framework used for demand analysis (Muellbauer, 1975; Deaton and Muellbauer, 1980; Heineke and Shefrin, 1989). Demand and food commodity analysis has developed considerably over the years from having been mainly based on static demand models including only economic variables to a wider range of models taking various socio-demographic factors into consideration (Parks and Wales, 1978; Pollack and Wales, 1981; Salvanes and DeVoretz, 1997; Eales, Durham and Wessells, 1997) and looking more closely into how to deal with consumer behaviour and changes in tastes and habits (Edwards, 1992; Rickertsen, 1996; Huang and Bouis, 1996; Asche, 1997). Most studies combine empirical and theoretical work – including many of the policy-oriented studies cited above – using existing time-series or cross-sectional data to test hypotheses about various aspects of demand. The above-cited literature use traditional commodity market analysis approaches. The common outcome of these studies is estimates of various demand elasticities. These elasticities are central to demand analysis and can be used to evaluate a variety of issues. However, Wessells and Anderson (1992) point out that there is also another, rapidly growing, literature of market research studies using different approaches and focusing on answering more practical questions commonly asked by entrepreneurs in the industry, such as consumer/buyer behaviour; what product will a buyer chose and what new products could be introduced? This market research tends to be more descriptive and use more primary data from specially designed surveys. It is also often not published as other research studies but remains the property of the commissioning company, using it for strategic decision-making. Anderson and Bettencourt (1993) argue that traditional demand analysis is inadequate for addressing many questions with regard to consumers and buyers’ behaviour. Kinnucan and Wessells (1997) confirm that this may be in particular true for aquaculture. This paper focuses mainly on the traditional market analysis approaches as this literature is generally available. Most of the literature reviewed covers fishery products but reference is also made to work on other commodities or demand analysis in general when found relevant. A selected number of issues and assumptions considered important in the demand analysis literature are discussed, although the functional forms the econometric models are not reviewed.. Some of the study results are reviewed, e.g. demand elasticities using examples from literature on Indonesia and Bangladesh. Lastly, a closer look is given to some of the work on predictions of future fish demand and consumption.
2. SELECTED ISSUES IN DEMAND ANALYSIS OF FISHERY PRODUCTS Demand analysis is often based on consumption data and the demand function is derived from observed consumption. This approach is necessary since demand data are usually
3
unavailable even though, strictly speaking, demand and consumption are different, as consumption is a function of both demand and supply. However, as pointed out by Tsoa, Schrank and Roy (1982), there is a general lack of models and analyses covering both fish demand and supply. Most empirical complete demand system analyses are based on an assumption of perfectly elastic supply. In a situation where supply is not modelled, it is also possible to assume perfectly inelastic supply, i.e., supply quantities are fixed and constant. In the seventies, some analysts started to investigate inverse demand systems in which prices are determined as functions of quantities, rather than the other way around. Anderson established some of the theoretical properties of inverse demand systems in 1980. Barten and Bettendorf (1989) used it in a case study of fish landed in Belgian seaports where fish price was related to the quantities traded and total real expenditure on fish. It was argued that this is a suitable model for fish since fish is a perishable good for which quantities are fixed in the short run. Eales, Durham and Wessells (1997) compared the ordinary demand system and the inverse demand approach for fish in Japan. They showed that the two methods gave quite different results. Nevertheless – in spite of there being a number of unanswered questions – it appeared that the inverse demand system was preferred for modelling monthly Japanese fish consumption. Likewise, Burton (1992) compared the two approaches with regard to fresh fish in the UK and concluded that the inelastic supply model is more appropriate for food studies. However, it is realized that both supply hypotheses are extremes and that to accurately measure consumer preferences, the market structure should not be “assumed away” in this way. In the work of Kabir and Ridler (1984) on the demand for Atlantic salmon in Canada, supply was considered to be exogenous and the quantities landed to have very little relation to prices. It was reasoned that the harvesting volume is subject to various regulatory measures and that climatic conditions influence yields more than the market. The example of salmon with regard to supply assumptions is interesting since the production of salmon has changed drastically during the last decades through farming. Aquaculture is supplying an increasing share of the food fish in the world and the aquaculture production and market systems are significantly different from capture fisheries. Kinnucan and Wessells (1997) reviewed marketing research paradigms for aquaculture with the United States market in mind where aquaculture is likely to follow a development similar to the increasingly “industrialized” agriculture. They noted that there should be closer linkages between farm production and consumer demand. It would appear that this development would call for new research approaches, incorporating both demand and supply to a higher degree. This view is supported by the work by Mazany, Roy and Schrank (1994) on United States demand and Canadian supply of fish products. They modelled both demand and supply for frozen fillets and blocks of different groundfish species. The results suggested that a simultaneous approach is essential since different product types interact with each other on both the demand and the supply side. They also conclude that the “market structure is complex and product-dependent. Some products face more competition in the market from other product forms and other countries’ products than do other products”. This statement leads on to the issues of aggregation, market delineation and substitutability between products. Salvanes and DeVoretz (1997) noted that “inappropriate aggregation may lead to biases in price elasticities and associated specification problems with respect to identifying substitutes”. They analysed four models at different aggregation levels of fish and meat
4
products in Canada. The results complied with prevailing theory that substitution among sub-groups reduces the own-price elasticities at the aggregate level, i.e. when substitute products are analysed together as an aggregate, they show less price sensitiveness than when analysed individually. As pointed out by Kusumastanto and Jolly (1997), if prices of sub-groups of products move together, the composite commodity theorem holds. In their work on Indonesia, they assumed that prices of fish do tend to move together and fish is hence treated as one single commodity. From a more practical viewpoint, it is generally necessary to group products. Too many variables would lead to complex models where parameters would be difficult to estimate. Moreover, constraints with regard to data availability often force researchers to make simplifications in the form of broad product groups. However, the groupings should be made carefully. According to Muellbauer (1975), the problem can be solved theoretically by imposing separability restrictions on the utility functions. Salvanes and DeVoretz (1997) also suggested formal separability tests of products to understand how and if they are related and to identify the appropriate aggregation levels. Another aspect of aggregation and substitutability is the question of what other products to include in a model, either as explanatory price variables or to be modelled at the same time. Separability tests conducted by Salvanes and DeVoretz (1997) indicated that at the highly aggregated level, fish and meat in the Canadian market could not be estimated separately since the product groups were substitutes and hence the demand for one was related to the demand for the other. However, when the fish and meat products were disaggregated into fresh and processed products, it appeared that fish could be modelled separately from meat. Hence, it seems that the commodities to be included in a certain model can depend on the level of aggregation. Asche, Salvanes and Steen (1995) in their paper on market delineation found that there is one integrated market for fresh and frozen salmon and crustaceans in Europe (the EC). They showed that there was a long-run relationship between the prices of the products and even though the prices would drift in the short-run, they would move towards a long-term equilibrium. This means that it would be difficult to analyse demand for one of the products without including the others in the model. The authors also concluded that even products with low cross-price elasticity, indicating weak substitutes, may be important to consider when delineating markets. This issue of aggregation across products and species is likely to become more complex – at least in developed economies – as fish is moving away from being a basic food to represent a large group of a variety of consumer products. It is also interesting to note that moving downstream in the fishery product distribution system, i.e. from landings and wholesale markets via processing to the retail level, substitutes may become complementing products and vice versa (Salvanes and DeVoretz, 1997). The range of products is also getting more varied when moving downstream and data may be more difficult to acquire. When investigating the possible market impact of an increase of the minimum size for American lobster, Wang and Kellogg (1988) used data from wholesale and ex-vessel markets since there was a lack of data at retail level. Since lobster is largely consumed in restaurants (60 percent of total consumption) and because menu prices include many cost components other then the lobster itself, it was difficult to estimate retail prices. Hence, the retail market could not be directly included in the model. In time series data, it is often the case that production, wholesale and trade data are more often available than data from the retail market. Asche et al. (1998) looked at the relationship
5
between the ex-vessel price of cod in Norway and the prices in the markets of its three main uses, i.e. domestic fresh consumption, exported dried salted cod and exported frozen fillets, to investigate whether derived demand elasticities could provide information on consumer demand elasticities. Using an approach based on only price data, it was found that there were proportional relationships between the ex-vessel price of cod and the domestic market as well as the export price of dried salted cod. However, this relationship was not found between ex-vessel prices and the export price of frozen fillets. It was argued that this could be explained by the fact that frozen fillets is the product form giving most possibilities to the processors to react to price changes; the exact product form can be changed. It is also a stage in the production and distribution chain where the sales price is not decided by a simple mark-up but rather by a more complex calculation including several input factors, such as labour and capital. Accordingly, it appears that derived demand is only applicable when intermediaries’ production technology contains only one variable input factor. The grouping of products is one of the fundamental aggregation problems in consumer demand studies; the other is the aggregation of data across consumers. Muellbauer (1975) stated that “there is, generally, no reason why aggregated data should obey the same rules as the microdata of any one consumer”. However, in practice, aggregate data has of course to be used and different approaches for this have been developed. Blundell, Pashardes and Weber (1993), assessed the relationship between models of consumer demand based on micro- and aggregate data, respectively, using a number of different aggregation procedures on data from repeated household surveys in the United Kingdom. They concluded that aggregate data alone are unlikely to give reliable estimates of structural price and income coefficients; the estimated income elasticities differed considerably between the micro- and aggregate equations. Nevertheless, it was argued that once certain aggregation factors, trend and seasonal components were included, the aggregate model was quite suitable for forecasting and for evaluating aggregate consequences of public-policy experiments. Work in Bangladesh showed that different household income segments reacted very differently to changes in prices (Pitt, 1983). It was argued that household data should be disaggregated into income groups in order to understand the effect of, for example, public market interventions aiming at improving nutritional intake and food security of poorer households. Similar conclusions were reached in other studies in Bangladesh (Talukder, 1993), Indonesia (Teklu and Johnson, 1987), and China (Gao, Wailes and Cramer, 1996). Work in Japan by Wessells and Wilen (1993) demonstrated that markets can be very complex. The Japanese market for salmon was found to be highly seasonal, with demand for fresh aquacultured salmon changing according to the availability of other species of fish. Moreover, traditions, habits and preferences differed across regions and the substitutes for salmon were different in different parts of the country. Similar results were reached when the analysis was extended to other seafood groups (Wessells and Wilen, 1994) and there was evidence of substantial diversity in patterns of household demand for different types of seafood across regions. The authors pointed out that a clear understanding of these issues would be essential for successful marketing of fish products in Japan. Garcia and Albisu (1998) analysed the demand for meat and fish in Spain and found that the differences in food expenditure patterns between rural and urban areas are less than expected and appear to have decreased during the last decade. Nevertheless, fish consumption has traditionally been higher in urban areas thanks to better distribution systems and there is still
6
a slightly higher expenditure (income)5 elasticity for fish – as well as for poultry – in urban areas compared to the rural areas. The above examples show that there can be significant differences in the results depending on how household data are aggregated across income level groups or regions. It would appear important to keep the purpose of the particular study clearly in mind when deciding on aggregation level. Factors other than income and geographic location distinguish households and influence demand. However, as noted in the introduction, neo-classical demand analysis was initially based on only economic variables, i.e., income and prices. Parks and Wales (1978) noted that the parameters estimated for a country’s aggregate consumption behaviour varied considerably from one country to another and showed how the age structure of the population could be incorporated as an additional explanatory variable. Capps and Havlicek (1987) incorporated three sociodemographic factors as explanatory variables in their analysis of US household demand for meat, poultry and seafood, i.e. household size, degree of urbanization and the square of household size (the impact on consumption of additional members diminishes as the size of the household increases). The study used cross-sectional data for households from different regions and it was shown that household size was important for the consumption pattern, but the influence of the degree of urbanization was not clear. In 1988, Cheng and Capps made a more detailed study of United States household demand for seafood by using data from the seafood consumption survey carried out by the United States Department of Commerce in 1981. A number of fresh and frozen products were chosen, i.e. shellfish (crabs, oysters and shrimps) and finfish (cod, flounder/sole, haddock, perch and snapper). A relatively wide range of variables was included in the model, covering geographic distribution (region) and degree of urbanization (population density), and the sociodemographic profile of the household: occupation of household head, educational level, employment status and age of household manager, number of children, ethnicity and religion, as well as household size and income. Seasonality as well as aspects of marketing were taken into account; variables for seafood outlets and “deal value” (use of coupons) were included. Prices of poultry and red meat were used for calculating cross-price elasticities and analysis of substitution. The findings indicated that own price and household size were generally key explanatory factors in household seafood expenditures. Also, deal value, household income, geographic region, urbanization, ethnicity and seasons were important whereas cross-price effects of poultry and red meat were not significant. DeVoretz and Salvanes (1994) proposed a life-cycle model to measure the impact of different household features on Canadian demand for fish, dairy and meat products, as well as a residual food group. The basic model included variables for household size decomposed into family age groupings, household head’s sex, education and foreign birth status, geographic divisions such as urban/rural, region and maritime versus hinterland location, as well as seasonality. Some surprising results occurred when the model was applied to cross-sectional data for 1986, e.g. unrealistically high expenditure elasticities indicating that all foods were luxury goods. An augmented model was developed, adding variables for spouse at home and an equivalent for meals at home. This model produced theoretically expected values with
5 It should be noted that total expenditure is often used as a proxy for income and that, in fact, total expenditure could be considered a better defined variable in demand system analysis than disposable income (Talukder, 1993; Blundell, Pashardes and Weber, 1993). Hence, in the present paper, the two terms “expenditure” and “income” will be used somewhat interchangeably – according to the definition and term used by the particular author.
7
regard to expenditure elasticities and demographic arguments and it could be argued that the absence or presence of a spouse at home was important in explaining Canadian food consumption patterns in 1986. Nevertheless, in conclusion, it was found that the economic variables – cross-, own price and income effects – dominated as explanations in all food categories, even though less so for some (dairy and the residual group). Wessells and Anderson (1992) reported that several researchers have explored the impact advertising may have on consumer demand for seafood. Nauman et al. (1995) looked into how consumer seafood purchase decisions were influenced by experience, perceptions, preferences and choice. A consumer survey was carried out in the northwestern United States with regard to the demand for hybrid striped bass, trout and salmon products. Findings indicated that demand for a certain fish product could be influenced by increasing consumers’ awareness of products through marketing: “the demand for finfish products suffers not from the lack of interest on the product but from the lack of awareness of the product”. These conclusions would be of particular interest to the aquaculture industry. It has long been recognized that past consumption patterns are important to present consumption patterns and that this element needs to be incorporated in demand analysis. Dynamic demand functions involving change over time are hence commonly used in studies (for example in Lin et al., 1989). It is also important to distinguish between long-run and short-run demand functions. Pollak (1970) cites a few reasons for why short- and long-run demand functions may differ, i.e., there may be contractual obligations on behalf of the consumer preventing a change in consumption, the consumer may not know about (new) consumption possibilities, and goods may be habit forming. Work by Asche (1997) on the import demand for salmon in the European Union indicated that only about 10 percent of the adjustment from a price or expenditure change took place immediately. Over 60 percent of the adjustment took place after three months and only after a year was the change fully reflected in demand. The short-run own-price elasticity was also lower than the long-run elasticity indicating slow adjustment. An issue closely related to habit formation is the question of whether structural change takes place in tastes and habits. Chalfant and Alston (1988) tested for stability of preferences, i.e. whether market demands for meat and fish had shifted because of a change in taste, by using time series data from Australia and the United States of America. They could not identify any significant changes and suggested that earlier models indicated structural change in demand only because of the model’s functional form. However, Edwards (1992) found structural changes in the demand for seafood in the United States due to an increased awareness of the health and nutrition benefits of seafood. His results from a graphical and regression analysis of time-series data showed increases in seafood consumption in the early 1960s and again in the late 1970s in spite of increases in the relative price of seafood. Burton and Young (1992) investigated shifts in demand for meat and fish in Britain. A dynamic model incorporating systematic demand shifters was developed. Their paper examined the extent to which observed changes in meat and fish consumption could be explained by the conventional economic factors (prices and expenditures) and whether there were also actual shifts in demand. It was concluded that empirical demand systems that include structural change are better in explaining consumption patterns than a system without.

8
Rickertsen (1996) found indications of structural change in the Norwegian demand for meat and fish during the 1980s. These shifts were towards fish and chicken and away from beef. The reasons behind the structural changes were not identified in the study but the characteristics of the shift suggested that dietary concerns might be an explanation. Huang and Bouis (1996) examined structural changes in the demand for food in Asia with examples from in particular Taiwan, Province of China and mainland China, and noted that the methodologies for measuring the effects of such changes were not as well developed as those for measuring price and income effects. It was also difficult to separate changes in tastes and lifestyles from income since they were often strongly correlated with changes in gross national product (GNP). In projecting future food demand, this posed a dilemma since existing income elasticity estimated from time-series data may be biased. An example was given for the demand for meat, fish and dairy products. In countries of more advanced economies, like Japan and Taiwan, existing elasticity estimates were likely to be upwardly biased if used for future forecasting. In countries at early stages of structural transformation, such as India and Indonesia, existing elasticities will underestimate the future demand for meat – assuming that the structural change in food demand materialized as these countries’ economies develop. Nik Mustapha and Zubaidi (1998) investigated the demand for fish and its substitutes in Malaysia and the existence of changes in tastes and habits. They found no structural change directly linked to fish but found it for red meats. This indicated that more health conscious consumers are changing their preferences away from red meat and are demanding more white meat, which would hence influence the demand for fish indirectly. In summary, there is evidence indicating that structural change does occur. However, the changes are not always easily detected and it is often not clear how to account for them in models.
3. REVIEW OF SOME MODELLING RESULTS: DEMAND ELASTICITIES IN INDONESIA AND BANGLADESH In the previous section, a number of issues and approaches applied in demand analysis were reviewed. It was seen that there are different ways of treating supply and that direct (ordinary) demand systems or inverse demand systems are both used for analysis of fish demand. Various aspects of aggregation were looked at, both across products and across households, with regard to income distribution or geographic location. Some examples of studies incorporating socio-demographic factors in their models were quoted and the issue of incorporating habit formation through dynamic models as well as the phenomenon of structural change were discussed. These issues are only a relatively small selection of a large number of considerations that researchers have to take into account when analysing demand. As mentioned in the introduction, the scope of this paper does not, for example, allow for a review of the different functional forms used in demand modelling. Nevertheless, the assumptions and choices made in all these areas influence the results of the study and the model. In this section, a summary of some of the findings presented in fish demand analysis literature will be looked at with a view to better understand the wide range of results that exist.

9
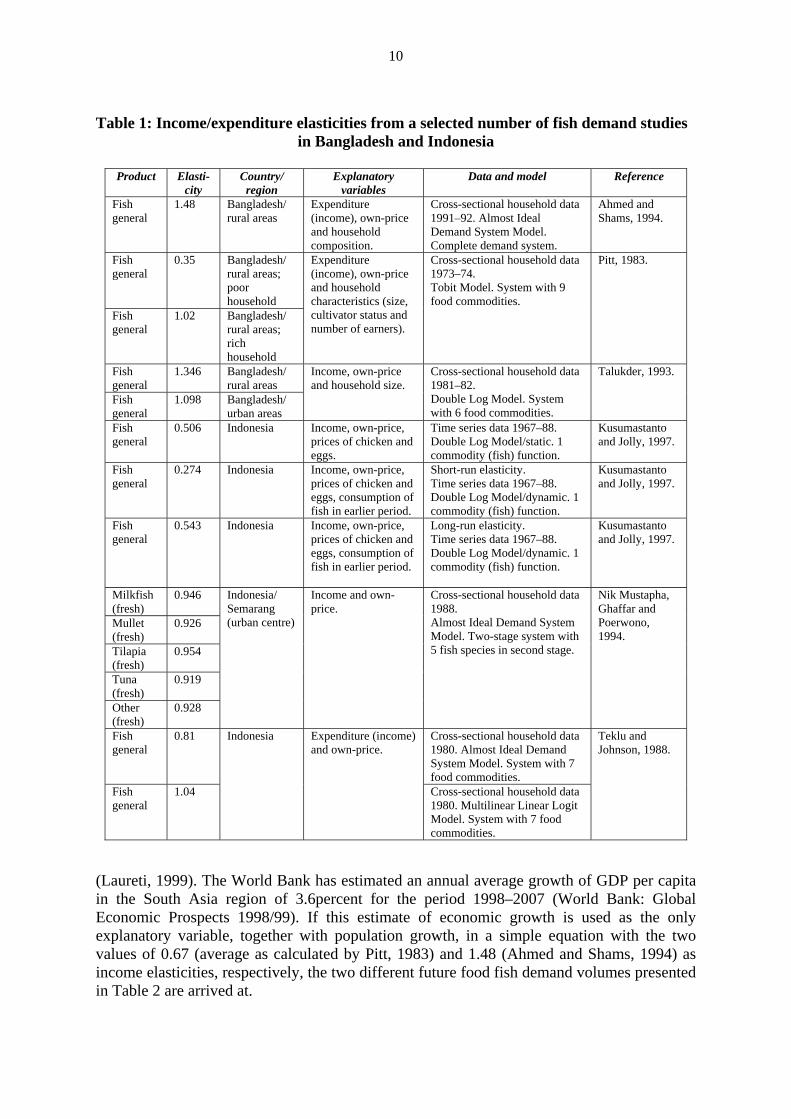
Table 1 gives a summary of income/expenditure6 elasticities of fish demand studies conducted in Indonesia and Bangladesh during the 1980s and 1990s. As noted earlier, elasticities, i.e. the economic term used for the measurement of “the degree of responsiveness of one variable to changes in another” (Bannock, Baxter and Rees, 1998), are a common outcome of demand modelling. Accordingly, the income elasticity measures the change in the quantity demanded of a good by a change in the income of the consumer, holding the influence of all other variables constant. Normally, the income elasticity of a good is positive, i.e. an increase in consumer income will increase the demand for a particular good. However, in some cases the elasticity may be negative and the good is then called an inferior good. Commodities with an income elasticity above 1 are generally luxury goods, whereas basic items usually have elasticities of less than 1. The income elasticities presented in Table 1 are positive and range from 0.35 to 1.48 for the Bangladesh studies. The first study (Pitt, 1983) gave in fact two different elasticities of 0.35 for poorer households and 1.02 for higher income (expenditure) households, with an average across all households of 0.67. The results from this particular study would indicate that fish is more of a necessity to poor households than to richer. The two studies both used cross-sectional data and ordinary (direct) demand system models. The data used were however from two different sources and the functional models used were different. Nevertheless, it is difficult to explain the differences in results. Ahmed and Shams (1994), authors of the second study, made a comparison between their results regarding rice and wheat with other studies and noted that the differences in elasticities were considerable. The reasons behind these differences were not investigated further but it was noted that there was a wide range in the methodological approaches as well as in the level of aggregation, across both commodities and income levels, between different studies. For Indonesia, the variation in income elasticities ranged between 0.274 and 0.946. The value of 0.274 is a short-run elasticity and the value of the corresponding long-run elasticity was 0.543 (Kusumastanto and Jolly, 1997), indicating a relatively slow adjustment of demand, i.e., here it took 3.3 years for demand to adjust fully to a change in income. The two studies used quite different demand functions as well as data; the former used time series data while the latter was based on cross-sectional data. Teklu and Johnson (1987) estimated two different demand systems using two different functional models applied to the same cross-section survey. The two income elasticities arrived at for fish were 0.81 and 1.04, respectively. The authors also made a comparison with other studies carried out in the Asian region and noted that different data bases, reference periods, definition and aggregation of commodities, demand structure and methods of estimation tended to give different results and therefore comparisons must be interpreted carefully. Using some of the figures from the above-cited studies on Bangladesh, an experimental calculation can be made with regard to what would happen if the estimated income elasticities were used for projecting future fish demand. According to FAO, apparent per capita fish consumption in Bangladesh was about 10.6 kg7 in 1997. With a population of 122.6 million, this figure corresponded to a total food fish supply of almost 1.3 million tonnes 6 See footnote No. 5. 7 Live weight equivalent.
10
Table 1: Income/expenditure elasticities from a selected number of fish demand studies
in Bangladesh and Indonesia
Product Elasti-city
Country/ region
Explanatory variables
Data and model Reference
Fish general
1.48 Bangladesh/ rural areas
Expenditure (income), own-price and household composition.
Cross-sectional household data 1991–92. Almost Ideal Demand System Model. Complete demand system.
Ahmed and Shams, 1994.
Fish general
0.35 Bangladesh/ rural areas; poor household
Fish general
1.02 Bangladesh/ rural areas; rich household
Expenditure (income), own-price and household characteristics (size, cultivator status and number of earners).
Cross-sectional household data 1973–74. Tobit Model. System with 9 food commodities.
Pitt, 1983.
Fish general
1.346 Bangladesh/ rural areas
Fish general
1.098 Bangladesh/ urban areas
Income, own-price and household size.
Cross-sectional household data 1981–82. Double Log Model. System with 6 food commodities.
Talukder, 1993.
Fish general
0.506 Indonesia Income, own-price, prices of chicken and eggs.
Time series data 1967–88. Double Log Model/static. 1 commodity (fish) function.
Kusumastanto and Jolly, 1997.
Fish general
0.274 Indonesia Income, own-price, prices of chicken and eggs, consumption of fish in earlier period.
Short-run elasticity. Time series data 1967–88. Double Log Model/dynamic. 1 commodity (fish) function.
Kusumastanto and Jolly, 1997.
Fish general
0.543 Indonesia Income, own-price, prices of chicken and eggs, consumption of fish in earlier period.
Long-run elasticity. Time series data 1967–88. Double Log Model/dynamic. 1 commodity (fish) function.
Kusumastanto and Jolly, 1997.
Milkfish (fresh)
0.946
Mullet (fresh)
0.926
Tilapia (fresh)
0.954
Tuna (fresh)
0.919
Other (fresh)
0.928
Indonesia/ Semarang (urban centre)
Income and own-price.
Cross-sectional household data 1988. Almost Ideal Demand System Model. Two-stage system with 5 fish species in second stage.
Nik Mustapha, Ghaffar and Poerwono, 1994.
Fish general
0.81 Cross-sectional household data 1980. Almost Ideal Demand System Model. System with 7 food commodities.
Fish general
1.04
Indonesia
Expenditure (income) and own-price.
Cross-sectional household data 1980. Multilinear Linear Logit Model. System with 7 food commodities.
Teklu and Johnson, 1988.
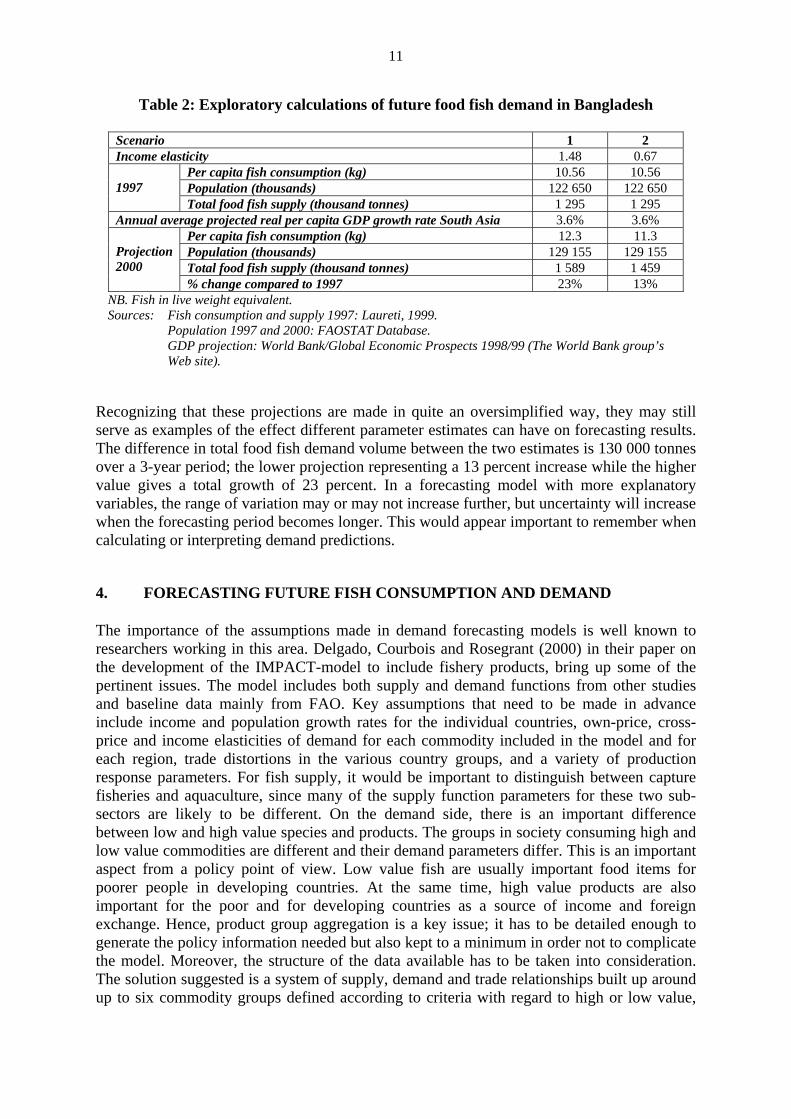
(Laureti, 1999). The World Bank has estimated an annual average growth of GDP per capita in the South Asia region of 3.6percent for the period 1998–2007 (World Bank: Global Economic Prospects 1998/99). If this estimate of economic growth is used as the only explanatory variable, together with population growth, in a simple equation with the two values of 0.67 (average as calculated by Pitt, 1983) and 1.48 (Ahmed and Shams, 1994) as income elasticities, respectively, the two different future food fish demand volumes presented in Table 2 are arrived at.
11
Table 2: Exploratory calculations of future food fish demand in Bangladesh
Scenario 1 2 Income elasticity 1.48 0.67
Per capita fish consumption (kg) 10.56 10.56 Population (thousands) 122 650 122 650
1997
Total food fish supply (thousand tonnes) 1 295 1 295 Annual average projected real per capita GDP growth rate South Asia 3.6% 3.6%
Per capita fish consumption (kg) 12.3 11.3 Population (thousands) 129 155 129 155 Total food fish supply (thousand tonnes) 1 589 1 459
Projection 2000
% change compared to 1997 23% 13% NB. Fish in live weight equivalent. Sources: Fish consumption and supply 1997: Laureti, 1999. Population 1997 and 2000: FAOSTAT Database. GDP projection: World Bank/Global Economic Prospects 1998/99 (The World Bank group’s Web site).
Recognizing that these projections are made in quite an oversimplified way, they may still serve as examples of the effect different parameter estimates can have on forecasting results. The difference in total food fish demand volume between the two estimates is 130 000 tonnes over a 3-year period; the lower projection representing a 13 percent increase while the higher value gives a total growth of 23 percent. In a forecasting model with more explanatory variables, the range of variation may or may not increase further, but uncertainty will increase when the forecasting period becomes longer. This would appear important to remember when calculating or interpreting demand predictions.
4. FORECASTING FUTURE FISH CONSUMPTION AND DEMAND The importance of the assumptions made in demand forecasting models is well known to researchers working in this area. Delgado, Courbois and Rosegrant (2000) in their paper on the development of the IMPACT-model to include fishery products, bring up some of the pertinent issues. The model includes both supply and demand functions from other studies and baseline data mainly from FAO. Key assumptions that need to be made in advance include income and population growth rates for the individual countries, own-price, cross-price and income elasticities of demand for each commodity included in the model and for each region, trade distortions in the various country groups, and a variety of production response parameters. For fish supply, it would be important to distinguish between capture fisheries and aquaculture, since many of the supply function parameters for these two sub-sectors are likely to be different. On the demand side, there is an important difference between low and high value species and products. The groups in society consuming high and low value commodities are different and their demand parameters differ. This is an important aspect from a policy point of view. Low value fish are usually important food items for poorer people in developing countries. At the same time, high value products are also important for the poor and for developing countries as a source of income and foreign exchange. Hence, product group aggregation is a key issue; it has to be detailed enough to generate the policy information needed but also kept to a minimum in order not to complicate the model. Moreover, the structure of the data available has to be taken into consideration. The solution suggested is a system of supply, demand and trade relationships built up around up to six commodity groups defined according to criteria with regard to high or low value,

12
production origin (capture of aquaculture), utilization (food or feed), and exports or imports, and with consideration given to the differences between developing and developed countries. With regard to other parameter specifications, the importance of a certain consistency is pointed out; the orders of magnitude should be similar between parameters for different countries or regions. Furthermore, IMPACT is a “conservative” model and the use of moderate values for elasticities is preferred to “end-of-the-range” ones. Delgado and McKenna (1997) made a forecast of fish demand growth in Africa. The factors identified as being likely to influence demand included income, prices of fish, prices of substitute products such as meat, prices of fish complements such as rice, tastes as well as non-price factors that affect the transaction costs of purchasing and preparing fish (availability of cold chains, proximity of retail outlets, etc.). However, since the detailed data required for analysing the above factors and their effect were not available, a regression analysis was undertaken based on FAO food fish consumption data since 1960. As a proxy for disposable income, GDP at constant prices was used; commercial energy consumption was used to represent the transaction costs for acquiring and preparing fishery products; the level of urbanization as a proxy for changes in taste; and the length of national coastlines as an indicator of national differences in fish eating traditions. With regard to prices, location specific information was also very scarce and the deflated price of imported frozen fish into Côte d’Ivoire was used as a basis for the impact of changes in fish prices. Cross-price effects were modelled using the world price of frozen beef. Some of the estimated elasticity parameters appear not to be consistent with economic theory but as an overall conclusion, the authors found that income and prices are the main factors determining demand for fish in the region. By estimating future trends of these variables – as well as of energy use – and their parameters, it was estimated that aggregate fish consumption would increase by 2.7 percent during the next few years. However, due to the expected high population growth, this would imply a decrease in per capita fish consumption by 0.31 percent per year. In fact, according to FAO statistics, African food fish supply has decreased from about 8 kg per capita in the early 1990s to just over 7 kg in 1997 (Laureti, 1999).8 Ye (1999) noted in his work on exploratory calculations for future demand for fish that disposable income and the price of fish were the most important determinants for fish consumption. Prices of substitutes and complements, tastes as well as the actual availability of fish also influence consumption. However, due to constraints of data availability, the World Fish Demand Model developed used GDP per capita as its only explanatory variable. The model is based on 17 country groupings and a forecasting model was developed for each group. Some are regression equations of per capita fish consumption against per capita GDP and others are developed as time trend regressions. Moreover, some adjustments – according to expert opinions – were made to the estimates of the econometric models when the results appeared unrealistic. Hence, the results presented show an increase in average global demand for fish to 18.7 kg per capita in 2015 and to 22.5 kg in 2030 compared to a per capita consumption of 15.6 kg in 1995.9 Demand is expected to grow fastest in Africa, to 14.8 kg in 2030 – a value double the consumption in 1995 – and slowest in Asia. However, it is very important to remember that these forecasts are of potential demand and not of consumption since prices and supply are excluded from the model. Hence, the results need not necessarily be in contradiction with Delgado and McKenna’s projection of decreasing per capita consumption of fish in Africa – price factors and the structure of supply may depress the future, actually materialized, consumption volume – but the difference between the two 8 All fish supply and consumption figures in live weight equivalent. 9 In Laureti (1999), world per capita food fish supply in 1995 is 15.3 kg and 16.1 kg in 1997.

13
studies does appear significant. The difficulties with data availability and the necessity of aggregations and simplifications become very apparent in these types of global and regional models.
5. FINAL REMARKS The present paper has reviewed some of the issues pertinent to fish demand analysis. Some specific studies and forecasts for future fish consumption and demand have been reviewed. However, opinions with regard to models, assumptions, and interpretation of results differ widely and significantly amongst studies. Hence, it can be stated that fish demand analysis and forecasting are complex issues. Even when the factors and variables relevant to a certain analysis are known, there are often serious constraints with regard to data availability. For modelling at a very aggregated level, these constraints become more severe and over-simplified models need to be used. However, it is important to realize that modelling work has tremendously increased our understanding of demand analysis systems, even though their use in forecasting is still in an early state of development. Moreover, in spite of these limitations, the work on demand analysis and predictions has added to our knowledge and understanding of the fisheries sector. Even relatively unclear indications of a certain development may be enough for creating awareness of existing problems and possible future concerns, and help direct further research or policy decisions. It is necessary, though, to keep the underlying inevitable modelling deficiencies in mind when interpreting the results of different studies. Researchers also need to present their results in a way that allows for this careful interpretation and understanding. It would also appear important to continue the work on demand analysis and consumption projections, in particular at a level of disaggregation that allows us to better understand the impact of current and future developments on food security and poverty. 6. REFERENCES Ahmed, A.U. & Shams, Y. 1994. Demand Elasticities in Rural Bangladesh: An Application of the AIDS Model, The Bangladesh Development Studies, Vol. 22, No. 1, pp. 1–25. Anderson, R.W. 1980. Some theory of inverse demand for applied demand analysis. European Economic Review, Vol. 14, pp. 281–290. Anderson, J.L. & Bettencourt, S.U. 1993. A conjoint approach to model product preferences: the New England market for fresh and frozen salmon. Marine Resource Economics, Vol. 8, No. 1, pp. 31–49. Asche, F. 1997. Dynamic adjustment in demand equations. Marine Resources Economics, Vol. 12, pp. 221–237. Asche, F., Flaaten, O., Isaksen, J.R., & Vassdal, T. 1998. Derived demand and price relationships: an analysis of the Norwegian cod sector. In Eide, A. & Vassdal, T. (eds): IIFET '98 Tromsø Conf. Proc. Vol. 2, pp. 740–745.
14
Asche, F., Salvanes, K.G., & Steen, F. 1995. Market delineation and demand structure. In Liao, D.S. (ed): IIFET 7th Biennial Conf. Proc., Vol. III, National Taiwan Ocean University, July 18–21, 1994, pp. 237–249. Bannock, G., Baxter, R.E. & Davis, E. 1998. Dictionary of economics. Penguin Books, Harmondsworth, Middlesex, England. Barten, A.P. & Bettendorf, L.J. 1989. Price formation of fish – An application of an inverse demand system. European Economic Review, Vol. 33, pp. 1509–1525. Blundell, R., Pashardes, P. & Weber, G. 1993. What Do We Learn About Consumer Demand Patterns from Micro Data? American Economic Review, Vol. 83, No. 3, pp. 570–597. Burton, M.P. 1992. The Demand for Wet Fish in Great Britain. Marine Resource Economics, Vol. 7, pp. 57–66. Burton, M., & Young, T. 1992. The structure of changing tastes for meat and fish in Great Britain. European Review of Agricultural Economics, Vol. 19, No. 2, pp. 165–180. Capps, Oral, Jr., & Havlicek, Joseph, Jr. 1987. Analysis of Household Demand for Meat, Poultry, and Seafood Using the S1-Branch System, in Raunikar, Robert, and Huang, Chung-Liang (eds): Food demand analysis: Problems, issues, and empirical evidence. Ames: Iowa State University Press, 1987, pp. 128–42. Chalfant, J.A. & Alston, J.M. 1988. Accounting for changes in taste. Journal of Political Economy, Vol. 96, pp. 391–410. Cheng, Hsiang-tai & Oral Capps, Jr. 1988. Demand Analysis of Fresh and Frozen Finfish and Shellfish in the United States. American Journal of Agricultural Economics, Vol. 70, August 1988, pp. 533–542. Chong, Kee-Chai. 1992. A model for the fisheries sector in Indonesia, commodity study of FAO/UNDP Project on Assistance in Agricultural Planning (INS/88/001), Indonesia. Crutchfield, S.R. 1985. An Econometric Model of the Market for New England Groundfish. Northeastern Journal of Agricultural and Resource Economics, Vol. 14, October 1985, pp. 128–143. Deaton, A., & Muellbauer, J. 1980. An almost ideal demand system. The American Economic Review, Vol. 70, pp. 312–326. Delgado, C.L., Courbois, C.B., & Rosegrant, M.W. (in print). Issues in modelling fish to 2020 within a global food model. IIFET 2000 Oregon Conf. Proc. Delgado, C.L., & Courbois, C. 1999. Changing fish trade and demand patterns in developing countries and their significance for policy research, in Ahmed, M., Delgado, C., Sverdrup-Jensen S., and Santos R.A.V. (eds.). Fisheries policy research in developing countries: issues, priorities and needs. ICLARM Conf. Proc. 60, 112 p.

15
Delgado, C.L., & McKenna, A.A. 1997. Demand for fish in sub-Saharan Africa: the past and the future, Naga, Vol. 20, No. 3–4, July–December 1997 (supplement), ICLARM, Manila, pp. 79–82. DeNigris, M. 2000. Future prospects for fish and fishery products. 1. Projections to the years 2015 and 2030. FAO (draft). DeVoretz, D.J. (de) & Salvanes, K.G. 1994. Canadian household demand for protein: A lifecycle approach, in Antona, M., Catanzano, J., and Sutinen, J.G. (eds): IIFET Sixth Conf. Proc., Tome II, Paris, July 6–9, 1992, pp. 1391–1404. Eales, J. & Wessells, C.R. 1999. Testing Separability of Japanese Demand for Meat and Fish within Differential Demand Systems, Journal of Agricultural and Resource Economics, Vol. 24, No. 1, July 1999, pp. 114–26. Eales, J., Durham, C. & Wessells, C.R. 1997. Generalized Models of Japanese Demand for Fish. American Journal of Agricultural Economics, Vol. 79, November 1997, pp. 1153–1163. Edwards, Steven F. 1992. Evidence of Structural Change in Preferences for Seafood, Marine Resource Economics, Vol. 7, pp. 141–151. FAO. 1995. Safeguarding future fish supplies: key policy issues and measures. International Conference on the Sustainable Contribution of Fisheries to Food Security, Kyoto (Japan), 4–9 December 1995, Document No. KC/FI/95/1, FAO/Government of Japan. Felixson, Tryggvi, Allen, P. Geoffrey, & Storey, D.A. 1987. An Econometric Model of the Market for Fresh New English Groundfish with Emphasis on the Role of Canadian Imports, Northeastern Journal of Agricultural and Resource Economics, Vol. 16, April 1987, pp. 24–34. Gracia, A., & Albisu, L.-M. 1998. The Demand for Meat and Fish in Spain: Urban and Rural Areas. Agricultural Economics, Vol. 19, No. 3, December 1998, pp. 359–66. Gao, X.-M., Wailes, Eric-J., & Cramer, G. 1996. A Two-Stage Rural Household Demand Analysis: Microdata Evidence from Jiangsu Province, China, American Journal of Agricultural Economics, Vol. 78, No. 3, August 1996, pp. 604–613. Heineke, J.M., & Shefrin, H.M. 1989. Aggregation and identification in consumer demand systems. Journal of Econometrics, Vol. 44, pp. 377–390. Herrmann, M. & Lin, Biing-Hwan. 1988. The Demand and Supply of Norwegian Atlantic Salmon in the United States and the European Community. Canadian Journal of Agricultural Economics, Vol. 36, pp. 459–471. Huang, J., & Bouis, H. 1996. Structural change in the demand for food in Asia. Food, Agric., Environ. Discuss. Pap. 11, IFPRI, Washington DC, USA. Kabir, M., & Ridler, N.B. 1984. The Demand for Atlantic Salmon in Canada. Canadian Journal of Agricultural Economics, Vol. 32, November 1984, pp. 560–568.

16
Kinnucan, H.W., & Wessells, C.R. 1997. Marketing research paradigms for aquaculture. Aquaculture Economics & Management, Vol. 1, no. 1, March 1997, pp. 73–86. Kusumastanto, Tridoyo, & Jolly, C.M. 1997. Demand Analysis for Fish in Indonesia. Applied Economics, Vol. 29, No. 1, January 1997, pp. 95–100. Laureti, E. (comp.) 1999. 1961–1997 Fish ad fishery products: world apparent consumption statistics based on food balance sheets. FAO Fisheries Circular No. 821, Rev. 5, Rome, FAO. 424 p. Lin, B., Herrmann, M., Lin, T., & Mittelhammer, R. 1989. Forecasting the price of farmed Atlantic salmon: an integrated econometric and time series approach. Agribusiness, Vol. 5, pp. 477–488. Mazany, R.L., Roy, N., & Schrank, W.E. 1994. US demand for Canadian supply of fish products, in Antona, M., Catanzano, J., and Sutinen, J.G. (eds): IIFET Sixth Conf. Proc., Tome I, Paris, July 6–9, 1992, pp. 501–516. Muellbauer, J. 1975. Aggregation, income distribution and consumer demand. Review of Economic Studies, Vol. 42, pp. 523–543. Nauman, F.A., Gempesaw, C.M., Bacon, Richard, J. & Manalo, A. 1995. Consumer Choice for Fresh Fish: Factors Affecting Purchase Decisions. Marine Resource Economics, Vol. 10, pp. 117–142. Nik Mustapha, R.A., & Zubaidi, A.B. 1998. Accounting for tastes in the demand for fish and its substitutes in Malaysia, In: Roch, J., Nurhakim, S., Widodo, J., and Poernomo, A. (eds): Sosekima. Proceedings of socio-economics, innovation and management, 4–7 December 1995, Bandungan., CRIFI, Jakarta (Indonesia), 1998, pp. 265–272. Parks, P.W., & Wales, T.J. 1978. A cross-country comparison of the effects of prices, income and population composition on consumption patterns. Econ. J., Vol. 83, pp. 834–852. Pitt, M.M. 1983. Food Preferences and Nutrition in Rural Bangladesh. The Review of Economics and Statistics, Vol. 65, pp. 105–114. Pollack, P.A. 1970. Habit formation and the dynamic demand functions. Journal of Political Economy, Vol. 78, pp. 745–763. Rickertsen, K. 1996. Structural Change and the Demand for Meat and Fish in Norway. European Review of Agricultural Economics, Vol. 23, No. 3, 1996, pp. 316–30. Rosegrant, M., Sambilla, M., & Perez, N. 1995. Global food projections to 2020: implications for investment. Food, Agric., Environ. Discuss. Pap. 5, IFPRI, Washington DC, USA. Salvanes, Kjell G., & De Voretz, Don J. 1997. Household Demand for Fish and Meat Products: Separability and Demographic Effects. Marine Resource Economics, Vol. 12, No. 1, Spring 1997, pp. 37–55.

17
Talukder, R.K. 1993. Patterns of Income Induced Consumption of Selected Food Items in Bangladesh. The Bangladesh Development Studies, Vol. 21, No. 1, pp. 41–53. Teklu, T., & Johnson, S.R. 1987. Demand systems from cross-section data – An application to Indonesia. Canadian Journal of Agricultural Economics, Vol. 36, pp. 83–101. Tsoa, Eugene, Schrank, William E., & Roy, Noel. 1982. U.S. Demand for Selected Groundfish Products, 1967–80. American Journal of Agricultural Economics, Vol. 64, pp. 483–489. Wang, Stanley D.H., & Kellogg, Christopher B. 1988. An Econometric Model for American Lobster. Marine Resource Economics, Vol. 5, pp. 61–70. World Bank 1998/99. Global economic prospects and the developing countries – beyond the financial crisis. World Bank Website (http://world.bank.org/prospects/gep98–99. Wessells, Cathy Roheim, & Anderson, J.L. 1992. Innovations and Progress in Seafood Demand and Market Analysis. Marine Resource Economics, Vol. 7, pp. 209–228. Wessells, C.R., &Wilen J.E. 1993. Economic analysis of Japanese household demand for salmon. Journal of the World Aquaculture Society, Vol. 24, No. 3, Sep. 1993, pp. 361–378. Wessells, Cathy Roheim, & Wilen, J.E. 1994. Seasonal Patterns and Regional Preferences in Japanese Household Demand for Seafood. Canadian Journal of Agricultural Economics, Vol. 42, No. 1, March 1994, pp. 87–103. Westlund, Lena. 1995. Apparent historical fish consumption and future demand for fish and fishery products – exploratory calculations. International Conference on the Sustainable Contribution of Fisheries to Food Security, Kyoto (Japan), 4–9 Dec 1995, Document No. KC/FI/95/TECH/8, FAO/Government of Japan. Ye, Y. 1999. Historical consumption and future demand for fish and fishery products: exploratory calculations for the years 2015/2030. FAO Fisheries Circular No. 946. Rome, FAO, 31p.

TR/D/AF961E/1/12.05/Web site only