Future of Indian Agriculture hi - ILSI...
39
Ramesh Chand National Professor and Director National Centre for Agricultural Economics & Policy Research (ICAR) New Delhi 30 April, 2010 Presentation made during Annual Meeting of ILSI-India National Centre for Agricultural Economics and Policy Research, New Delhi Ramesh Chand Future of Indian Agriculture
Transcript of Future of Indian Agriculture hi - ILSI...
Ramesh Chand
National Professor and Director
National Centre for Agricultural Economics & Policy Research
(ICAR)
New Delhi
30 April, 2010
Presentation made during Annual Meeting of ILSI-India
Nati
on
al
Cen
tre f
or
Ag
ricu
ltu
ral
Eco
no
mic
s an
d P
oli
cy R
ese
arc
h,
New
Delh
i
Ramesh Chand
Future of Indian Agriculture
• Challenges
• Opportunities
• Changes in operating environment:– Physical, economic, institutional
• Needs and requirement of society
Nati
on
al
Cen
tre f
or
Ag
ricu
ltu
ral
Eco
no
mic
s an
d P
oli
cy R
ese
arc
h,
New
Delh
i
Ramesh Chand
What Determines Future?
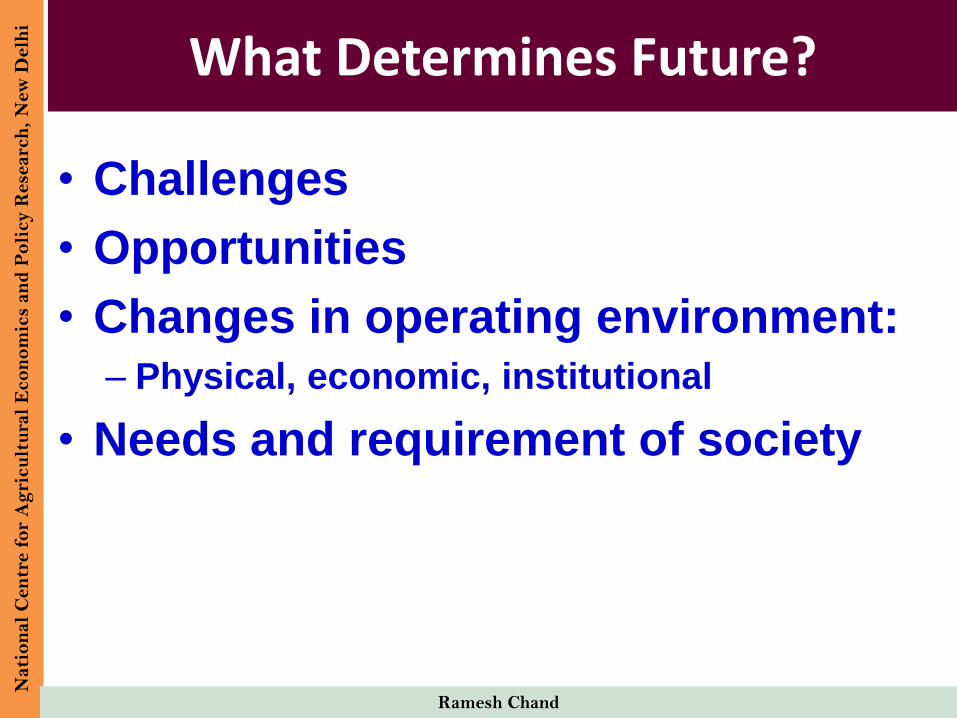
CURRENT SCENE
• Number of holdings (2001): 11.5 crore• Preponderance of small farmers
• Less than 1 hectare: 62%• Less than 2 hectare: 80%• Average size: 1.3 hectare
• Crop Intensity: 1.35• Irrigation coverage: 40%
• Heavy dependence on rainfall• Use of modern inputs: low• Regional variations• Mixed crop –livestock farm
Nati
on
al
Cen
tre f
or
Ag
ricu
ltu
ral
Eco
no
mic
s an
d P
oli
cy R
ese
arc
h,
New
Delh
i
Ramesh Chand
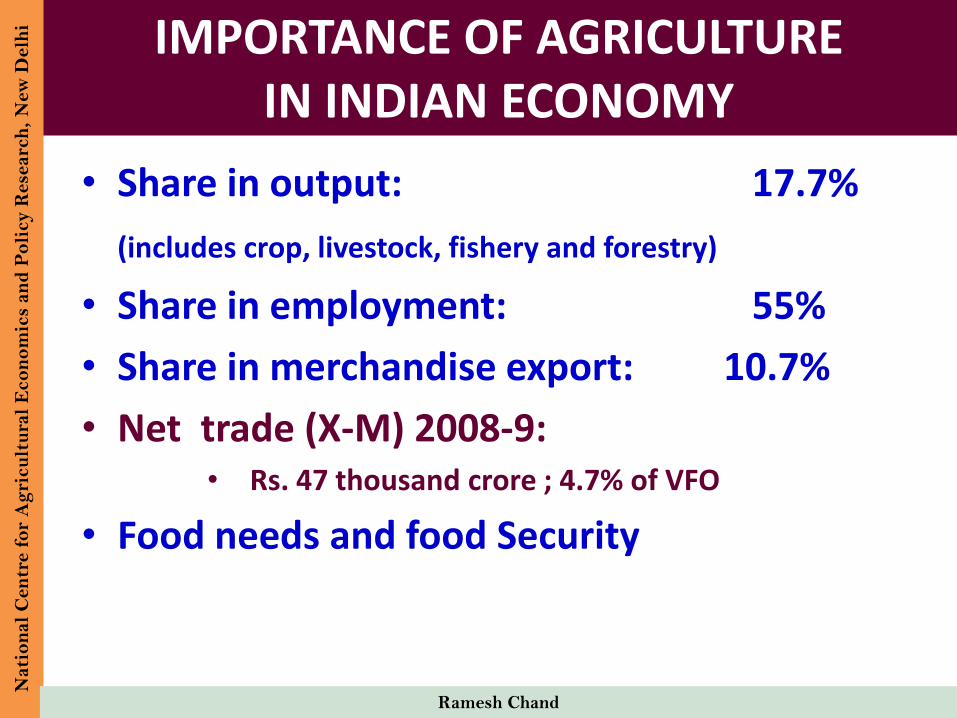
IMPORTANCE OF AGRICULTUREIN INDIAN ECONOMY
• Share in output: 17.7%
(includes crop, livestock, fishery and forestry)
• Share in employment: 55%
• Share in merchandise export: 10.7%
• Net trade (X-M) 2008-9: • Rs. 47 thousand crore ; 4.7% of VFO
• Food needs and food Security
Nati
on
al
Cen
tre f
or
Ag
ricu
ltu
ral
Eco
no
mic
s an
d P
oli
cy R
ese
arc
h,
New
Delh
i
Ramesh Chand
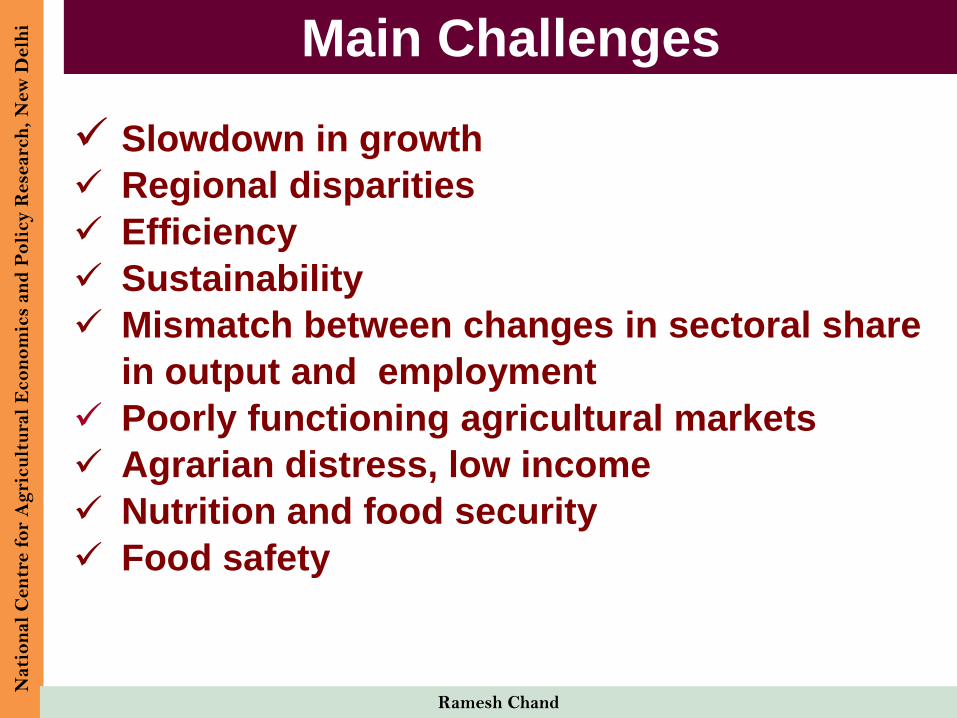
Slowdown in growth
Regional disparities
Efficiency
Sustainability
Mismatch between changes in sectoral share
in output and employment
Poorly functioning agricultural markets
Agrarian distress, low income
Nutrition and food security
Food safety
Main ChallengesN
ati
on
al
Cen
tre f
or
Ag
ricu
ltu
ral
Eco
no
mic
s an
d P
oli
cy R
ese
arc
h,
New
Delh
i
Ramesh Chand
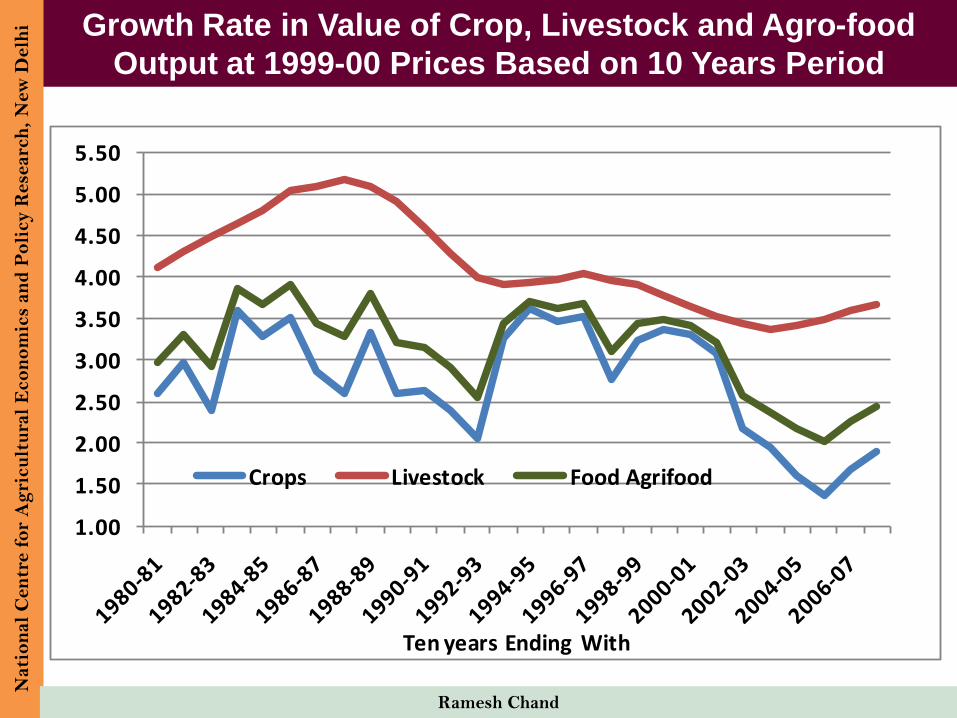
Growth Rate in Value of Crop, Livestock and Agro-food
Output at 1999-00 Prices Based on 10 Years Period
Nati
on
al
Cen
tre f
or
Ag
ricu
ltu
ral
Eco
no
mic
s an
d P
oli
cy R
ese
arc
h,
New
Delh
i
Ramesh Chand
1.00
1.50
2.00
2.50
3.00
3.50
4.00
4.50
5.00
5.50
Ten years Ending With
Crops Livestock Food Agrifood
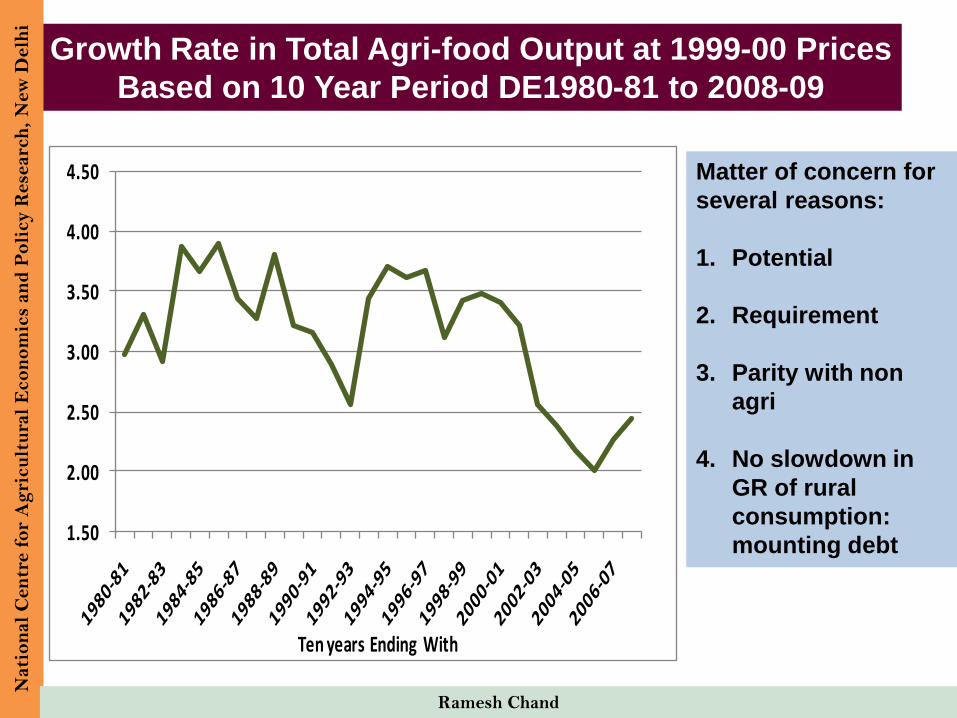
Growth Rate in Total Agri-food Output at 1999-00 Prices
Based on 10 Year Period DE1980-81 to 2008-09
Nati
on
al
Cen
tre f
or
Ag
ricu
ltu
ral
Eco
no
mic
s an
d P
oli
cy R
ese
arc
h,
New
Delh
i
Ramesh Chand
1.50
2.00
2.50
3.00
3.50
4.00
4.50
Ten years Ending With
Matter of concern for
several reasons:
1. Potential
2. Requirement
3. Parity with non
agri
4. No slowdown in
GR of rural
consumption:
mounting debt
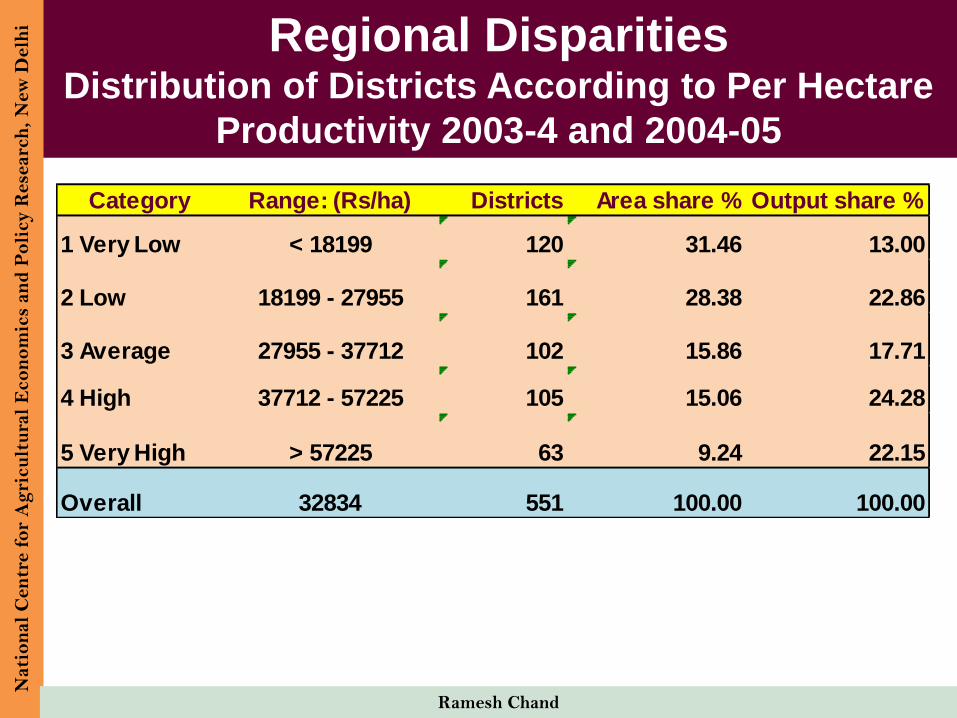
Regional DisparitiesDistribution of Districts According to Per Hectare
Productivity 2003-4 and 2004-05
Nati
on
al
Cen
tre f
or
Ag
ricu
ltu
ral
Eco
no
mic
s an
d P
oli
cy R
ese
arc
h,
New
Delh
i
Ramesh Chand
Category Range: (Rs/ha) Districts Area share % Output share %
1 Very Low < 18199 120 31.46 13.00
2 Low 18199 - 27955 161 28.38 22.86
3 Average 27955 - 37712 102 15.86 17.71
4 High 37712 - 57225 105 15.06 24.28
5 Very High > 57225 63 9.24 22.15
Overall 32834 551 100.00 100.00
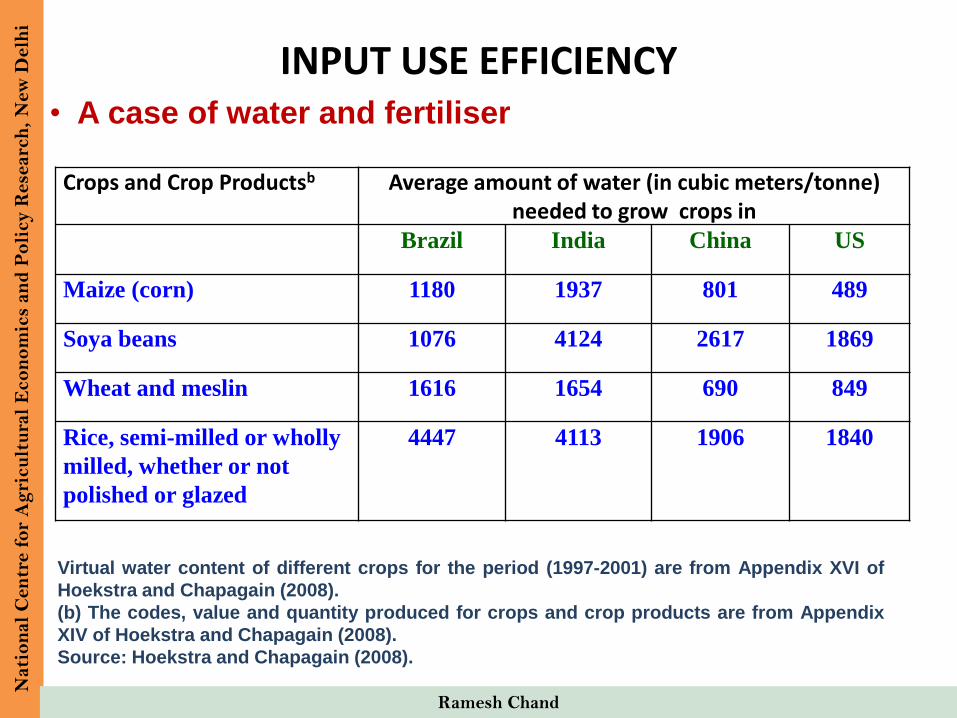
INPUT USE EFFICIENCY
Crops and Crop Productsb Average amount of water (in cubic meters/tonne) needed to grow crops in
Brazil India China US
Maize (corn) 1180 1937 801 489
Soya beans 1076 4124 2617 1869
Wheat and meslin 1616 1654 690 849
Rice, semi-milled or wholly
milled, whether or not
polished or glazed
4447 4113 1906 1840
Virtual water content of different crops for the period (1997-2001) are from Appendix XVI of
Hoekstra and Chapagain (2008).
(b) The codes, value and quantity produced for crops and crop products are from Appendix
XIV of Hoekstra and Chapagain (2008).
Source: Hoekstra and Chapagain (2008).
• A case of water and fertiliser
Nati
on
al
Cen
tre f
or
Ag
ricu
ltu
ral
Eco
no
mic
s an
d P
oli
cy R
ese
arc
h,
New
Delh
i
Ramesh Chand
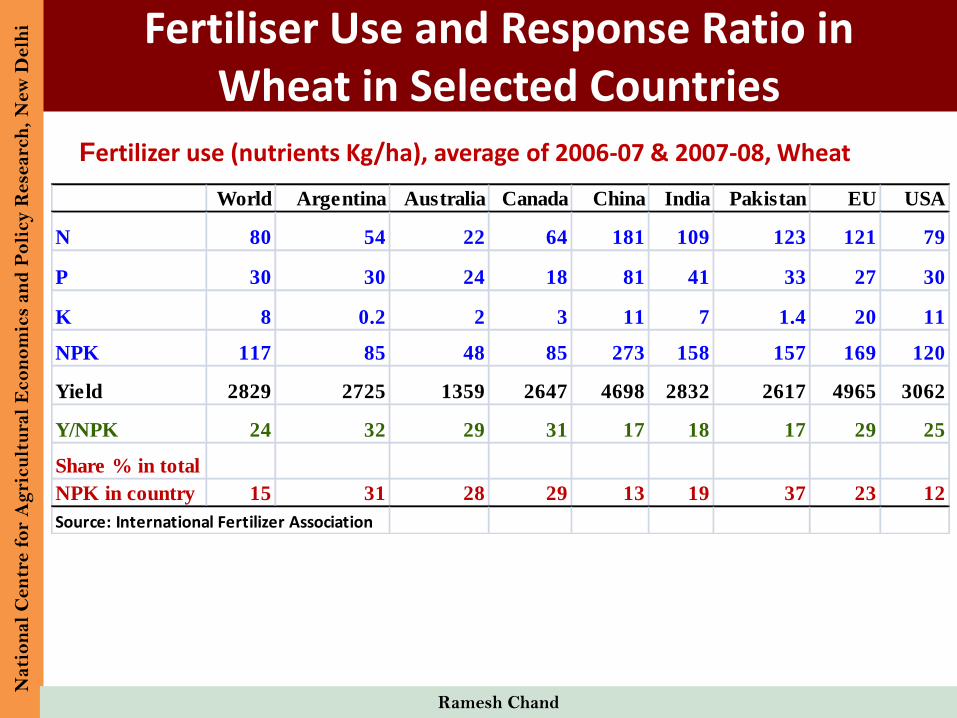
Fertiliser Use and Response Ratio in Wheat in Selected Countries
Fertilizer use (nutrients Kg/ha), average of 2006-07 & 2007-08, Wheat
Nati
on
al
Cen
tre f
or
Ag
ricu
ltu
ral
Eco
no
mic
s an
d P
oli
cy R
ese
arc
h,
New
Delh
i
Ramesh Chand
World Argentina Australia Canada China India Pakistan EU USA
N 80 54 22 64 181 109 123 121 79
P 30 30 24 18 81 41 33 27 30
K 8 0.2 2 3 11 7 1.4 20 11
NPK 117 85 48 85 273 158 157 169 120
Yield 2829 2725 1359 2647 4698 2832 2617 4965 3062
Y/NPK 24 32 29 31 17 18 17 29 25
Share % in total
NPK in country 15 31 28 29 13 19 37 23 12
Source: International Fertilizer Association
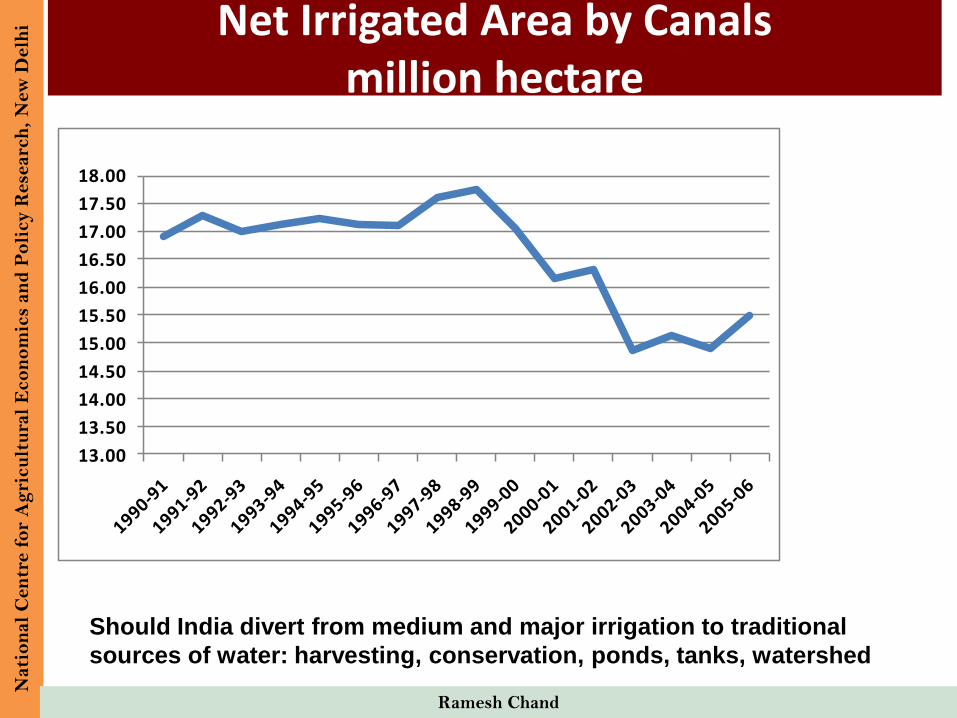
Net Irrigated Area by Canalsmillion hectare
Nati
on
al
Cen
tre f
or
Ag
ricu
ltu
ral
Eco
no
mic
s an
d P
oli
cy R
ese
arc
h,
New
Delh
i
Ramesh Chand
13.00
13.50
14.00
14.50
15.00
15.50
16.00
16.50
17.00
17.50
18.00
Should India divert from medium and major irrigation to traditional
sources of water: harvesting, conservation, ponds, tanks, watershed
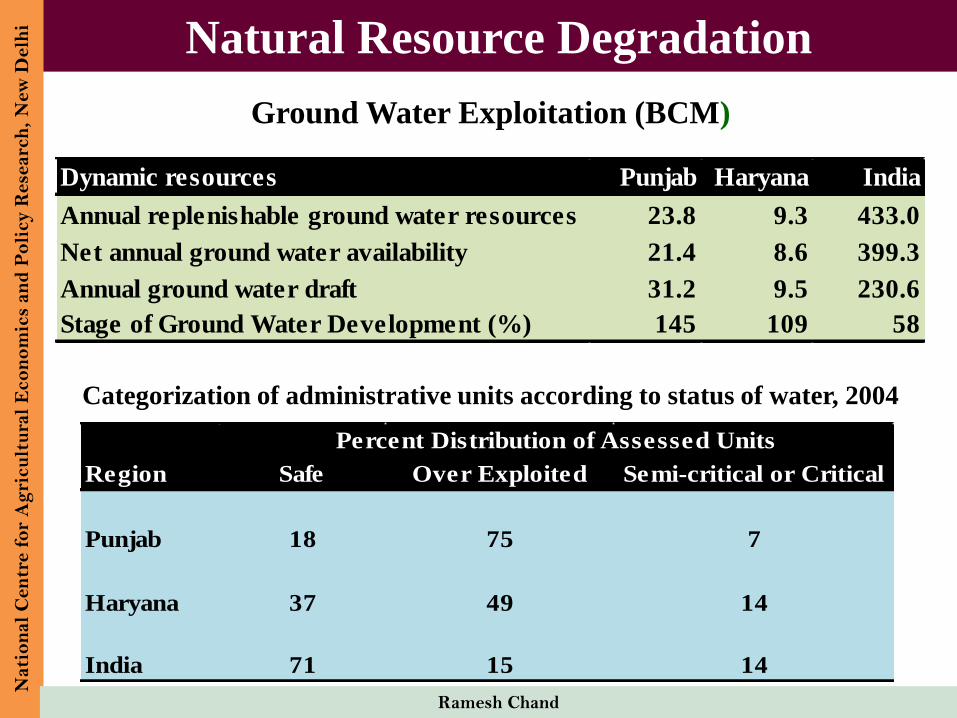
Natural Resource Degradation
Ground Water Exploitation (BCM)
Categorization of administrative units according to status of water, 2004
Nati
on
al
Cen
tre f
or
Ag
ricu
ltu
ral
Eco
no
mic
s an
d P
oli
cy R
ese
arc
h,
New
Delh
i
Ramesh Chand
Safe Over Exploited Semi-critical or Critical
Punjab 18 75 7
Haryana 37 49 14
India 71 15 14
Region
Percent Distribution of Assessed Units
Dynamic resources Punjab Haryana India
Annual replenishable ground water resources 23.8 9.3 433.0
Net annual ground water availability 21.4 8.6 399.3
Annual ground water draft 31.2 9.5 230.6
Stage of Ground Water Development (%) 145 109 58
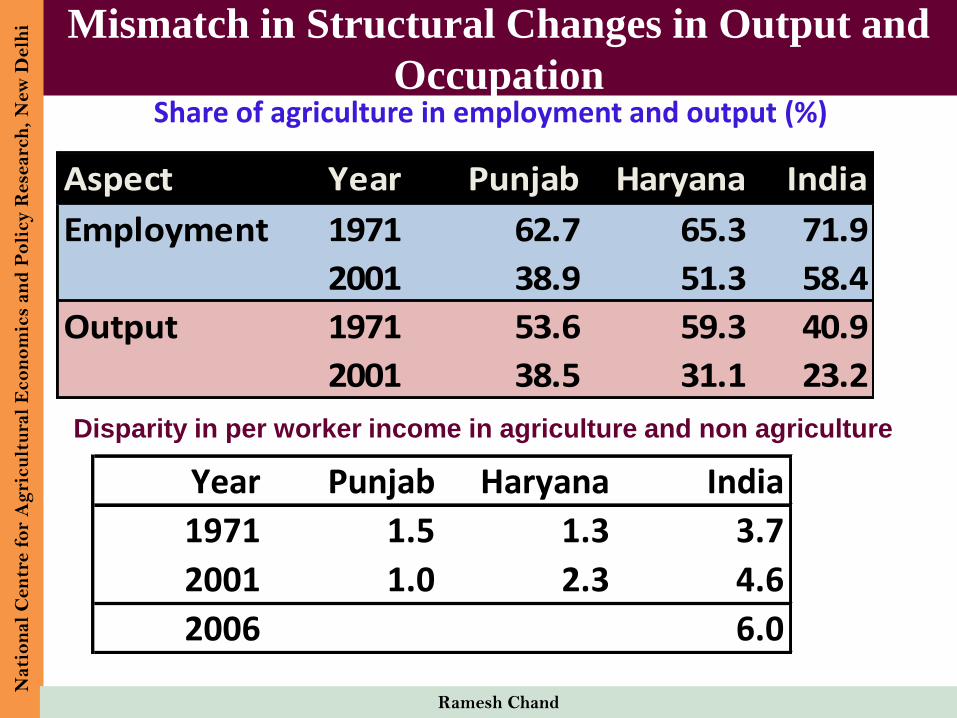
Mismatch in Structural Changes in Output and
OccupationShare of agriculture in employment and output (%)
Nati
on
al
Cen
tre f
or
Ag
ricu
ltu
ral
Eco
no
mic
s an
d P
oli
cy R
ese
arc
h,
New
Delh
i
Ramesh Chand
Disparity in per worker income in agriculture and non agriculture
Aspect Year Punjab Haryana India
Employment 1971 62.7 65.3 71.9
2001 38.9 51.3 58.4
Output 1971 53.6 59.3 40.9
2001 38.5 31.1 23.2
Year Punjab Haryana India
1971 1.5 1.3 3.7
2001 1.0 2.3 4.6
2006 6.0
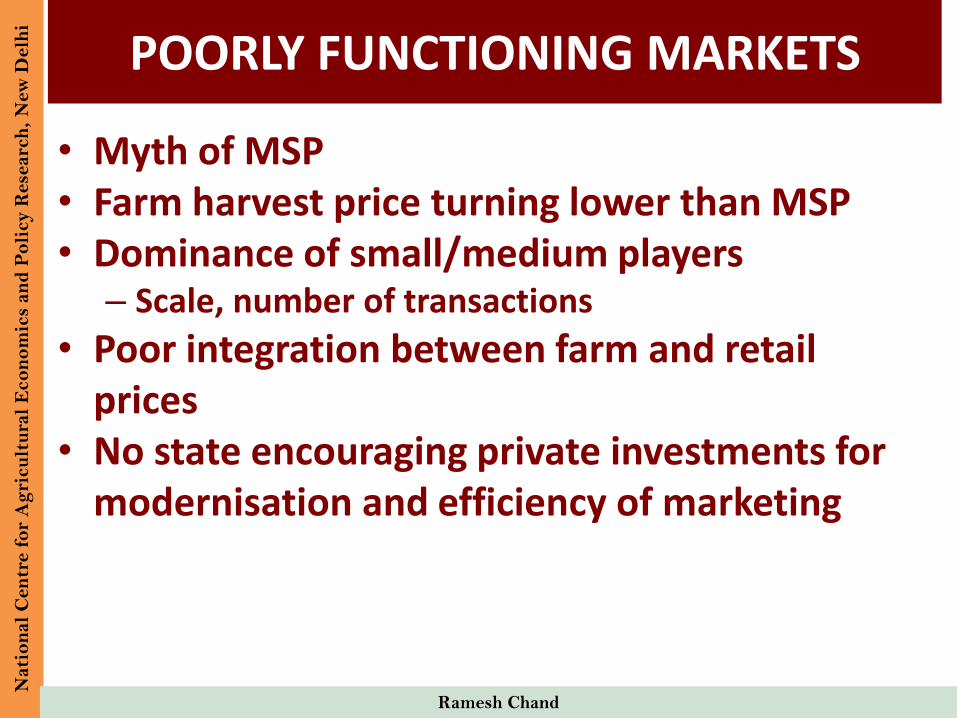
POORLY FUNCTIONING MARKETS
• Myth of MSP• Farm harvest price turning lower than MSP• Dominance of small/medium players
– Scale, number of transactions
• Poor integration between farm and retail prices
• No state encouraging private investments for modernisation and efficiency of marketing
Nati
on
al
Cen
tre f
or
Ag
ricu
ltu
ral
Eco
no
mic
s an
d P
oli
cy R
ese
arc
h,
New
Delh
i
Ramesh Chand
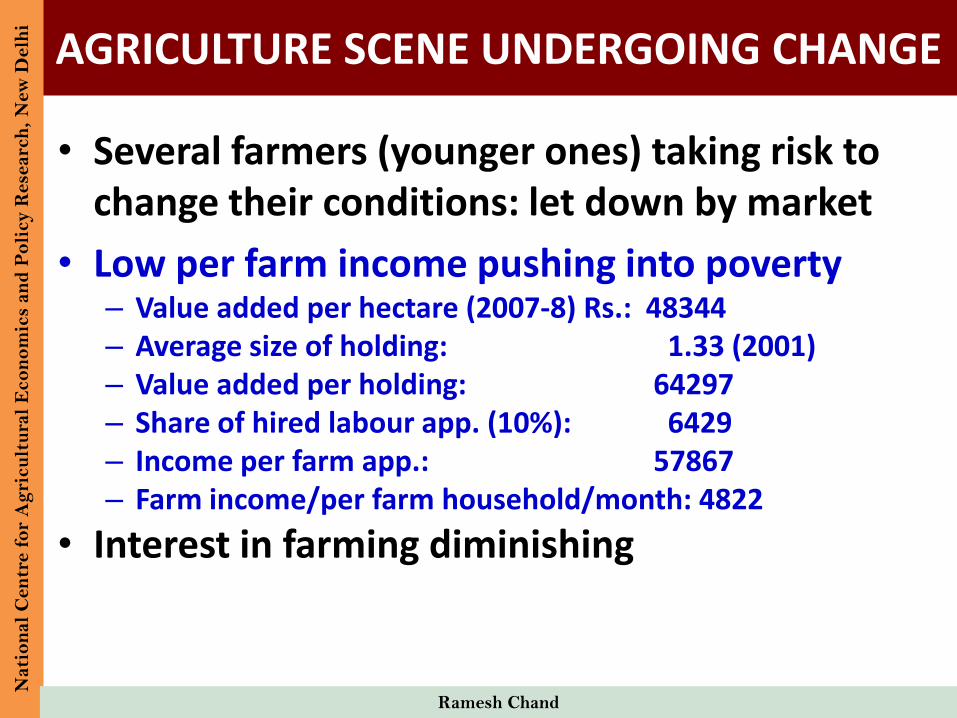
AGRICULTURE SCENE UNDERGOING CHANGEN
ati
on
al
Cen
tre f
or
Ag
ricu
ltu
ral
Eco
no
mic
s an
d P
oli
cy R
ese
arc
h,
New
Delh
i
Ramesh Chand
• Several farmers (younger ones) taking risk to change their conditions: let down by market
• Low per farm income pushing into poverty– Value added per hectare (2007-8) Rs.: 48344– Average size of holding: 1.33 (2001)– Value added per holding: 64297– Share of hired labour app. (10%): 6429– Income per farm app.: 57867– Farm income/per farm household/month: 4822
• Interest in farming diminishing
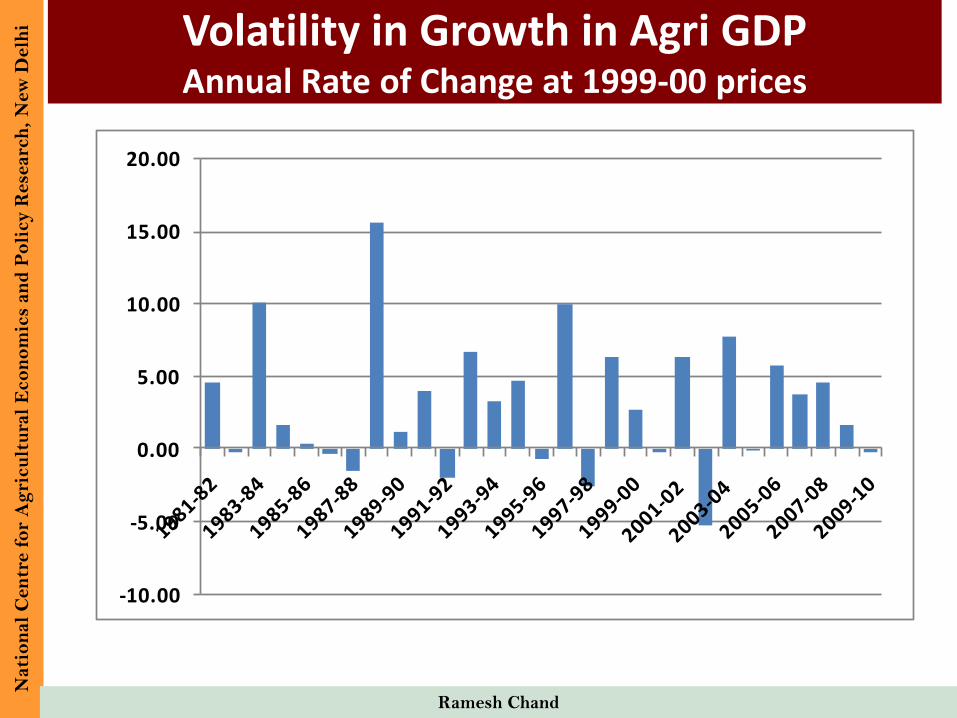
Volatility in Growth in Agri GDPAnnual Rate of Change at 1999-00 prices
Nati
on
al
Cen
tre f
or
Ag
ricu
ltu
ral
Eco
no
mic
s an
d P
oli
cy R
ese
arc
h,
New
Delh
i
Ramesh Chand
-10.00
-5.00
0.00
5.00
10.00
15.00
20.00
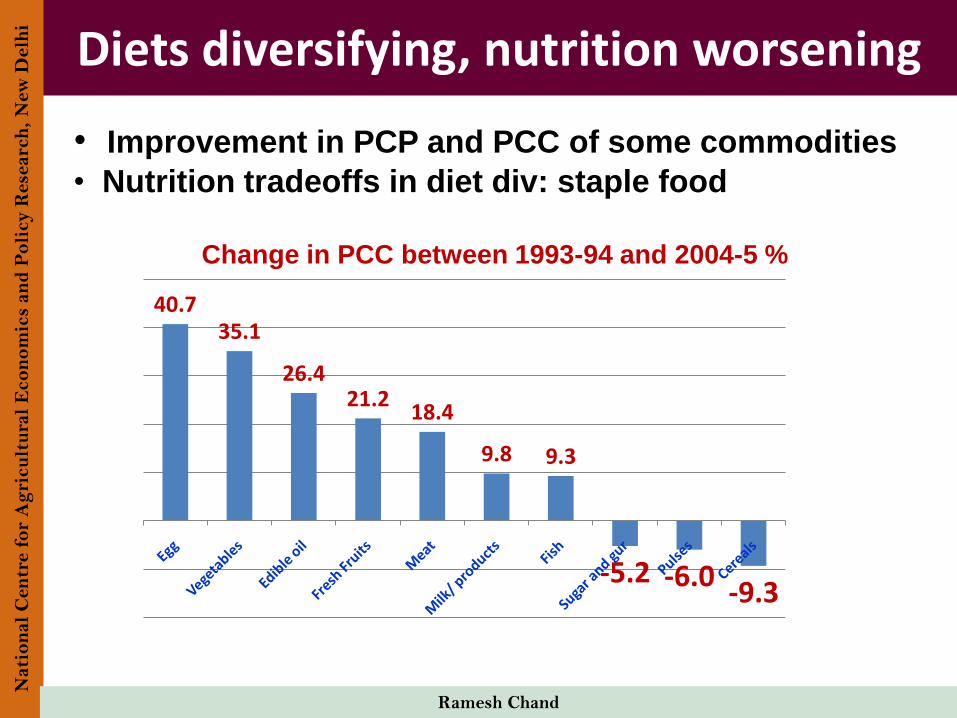
Diets diversifying, nutrition worsening
• Improvement in PCP and PCC of some commodities
• Nutrition tradeoffs in diet div: staple food
Change in PCC between 1993-94 and 2004-5 %
40.735.1
26.421.2
18.4
9.8 9.3
-5.2 -6.0-9.3
Nati
on
al
Cen
tre f
or
Ag
ricu
ltu
ral
Eco
no
mic
s an
d P
oli
cy R
ese
arc
h,
New
Delh
i
Ramesh Chand
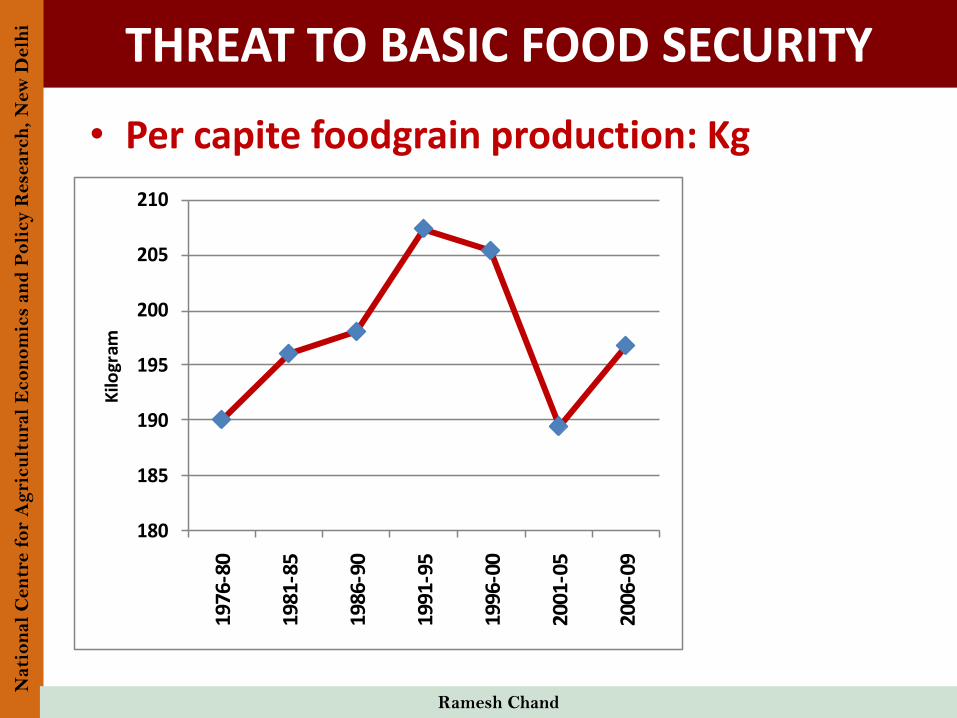
THREAT TO BASIC FOOD SECURITY
• Per capite foodgrain production: Kg
180
185
190
195
200
205
21019
76-8
0
1981
-85
1986
-90
1991
-95
1996
-00
2001
-05
2006
-09
Kilo
gram
Nati
on
al
Cen
tre f
or
Ag
ricu
ltu
ral
Eco
no
mic
s an
d P
oli
cy R
ese
arc
h,
New
Delh
i
Ramesh Chand
FOOD SAFETY
• Low use of chemicals, high residue
• Rising use of unsafe growth stimulating chemicals
• Adulteration
• Not only affecting health, also prices fetched by
farmers
• Require monitoring and effective implementation of
regulation at all levels
Ramesh Chand
Nati
on
al
Cen
tre f
or
Ag
ricu
ltu
ral
Eco
no
mic
s an
d P
oli
cy R
ese
arc
h,
New
Delh
i

OPPORTUNITIES AND PERSPECTIVE
RENEWED IMPORTANCE
OF AGRICULTURE
• Importance for inclusive growth and equity
• Agriculture and health link
• Opportunities for new business
• Geo political and strategic factors
• Paradigm shift: from being part of problem to part of
solution
– Global energy crisis
– Global climate change
• Trend towards Bios’
– Bio energy, bio medicine, bio-pesticides, bio cosmetics
Ramesh Chand
Nati
on
al
Cen
tre f
or
Ag
ricu
ltu
ral
Eco
no
mic
s an
d P
oli
cy R
ese
arc
h,
New
Delh
i
POTENTIAL OF MODERN BIOTECHNOLOGY
•Lot of promise: projected to offer solution for almost all problems:
drought, salinity, quality, resistance•Research focus shifting towards modern
biotechnologyExperience with Bt cotton
Spectacular increase in yieldSeed price : contentious
•Stiff opposition from some influential NGOs:Scary stories v/s developmental stories
•Resource requirement: capital and knowledge intensive. R&D funding of SAUs
Nati
on
al
Cen
tre f
or
Ag
ricu
ltu
ral
Eco
no
mic
s an
d P
oli
cy R
ese
arc
h,
New
Delh
i
Ramesh Chand
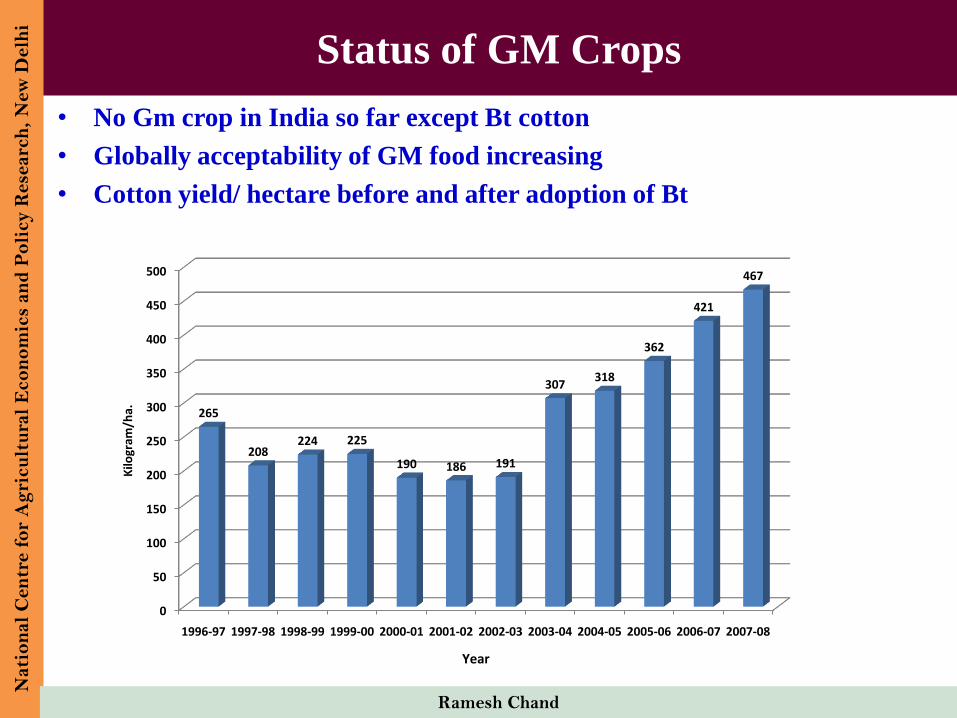
Status of GM Crops
• No Gm crop in India so far except Bt cotton
• Globally acceptability of GM food increasing
• Cotton yield/ hectare before and after adoption of Bt
Nati
on
al
Cen
tre f
or
Ag
ricu
ltu
ral
Eco
no
mic
s an
d P
oli
cy R
ese
arc
h,
New
Delh
i
Ramesh Chand
0
50
100
150
200
250
300
350
400
450
500
1996-97 1997-98 1998-99 1999-00 2000-01 2001-02 2002-03 2003-04 2004-05 2005-06 2006-07 2007-08
265
208224 225
190 186 191
307318
362
421
467
Kilo
gram
/ha.
Year
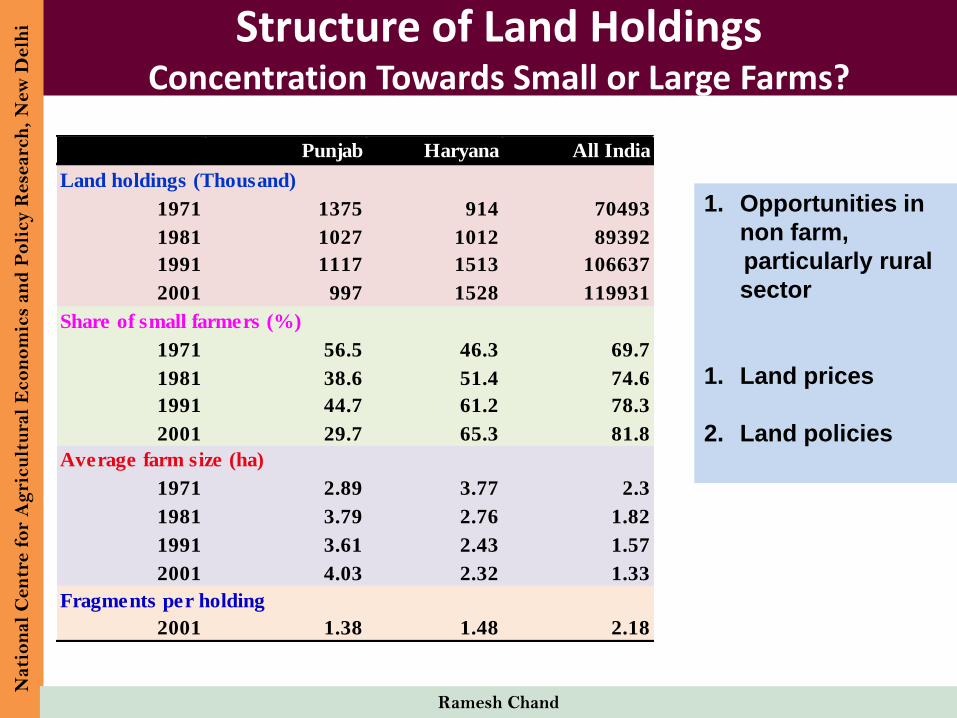
Structure of Land HoldingsConcentration Towards Small or Large Farms?
Nati
on
al
Cen
tre f
or
Ag
ricu
ltu
ral
Eco
no
mic
s an
d P
oli
cy R
ese
arc
h,
New
Delh
i
Ramesh Chand
Punjab Haryana All India
1971 1375 914 70493
1981 1027 1012 89392
1991 1117 1513 106637
2001 997 1528 119931
1971 56.5 46.3 69.7
1981 38.6 51.4 74.6
1991 44.7 61.2 78.3
2001 29.7 65.3 81.8
Average farm size (ha)
1971 2.89 3.77 2.3
1981 3.79 2.76 1.82
1991 3.61 2.43 1.57
2001 4.03 2.32 1.33
2001 1.38 1.48 2.18
Land holdings (Thousand)
Share of small farmers (%)
Fragments per holding
1. Opportunities in
non farm,
particularly rural
sector
1. Land prices
2. Land policies
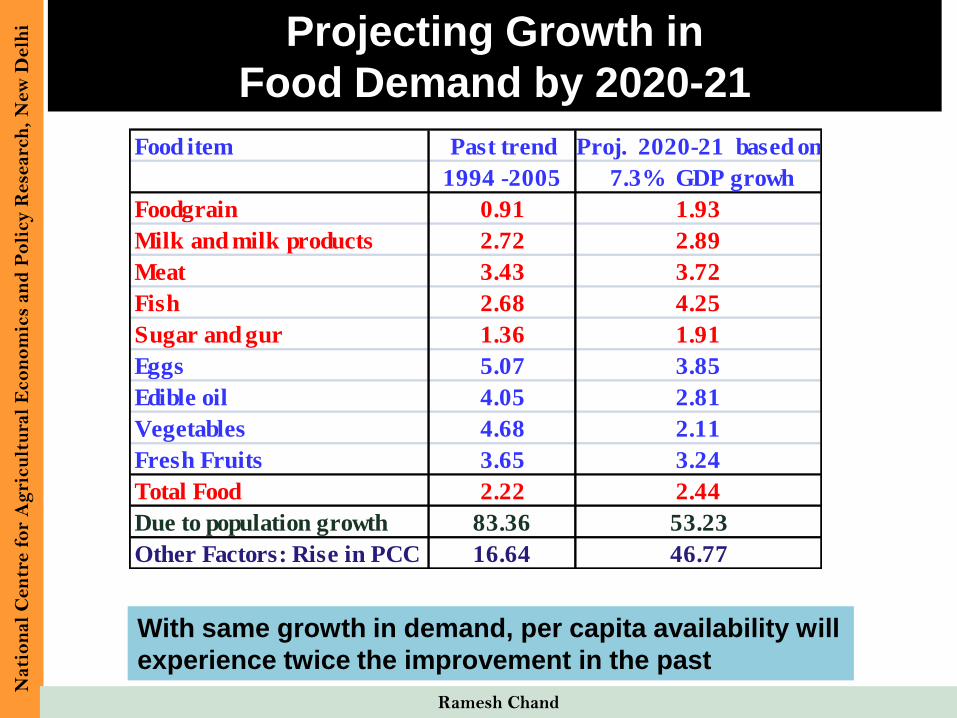
Projecting Growth in
Food Demand by 2020-21
Nati
on
al
Cen
tre f
or
Ag
ricu
ltu
ral
Eco
no
mic
s an
d P
oli
cy R
ese
arc
h,
New
Delh
i
Ramesh Chand
Food item Past trend Proj. 2020-21 based on
1994 -2005 7.3% GDP growh
Foodgrain 0.91 1.93
Milk and milk products 2.72 2.89
Meat 3.43 3.72
Fish 2.68 4.25
Sugar and gur 1.36 1.91
Eggs 5.07 3.85
Edible oil 4.05 2.81
Vegetables 4.68 2.11
Fresh Fruits 3.65 3.24
Total Food 2.22 2.44
Due to population growth 83.36 53.23
Other Factors: Rise in PCC 16.64 46.77
With same growth in demand, per capita availability will
experience twice the improvement in the past
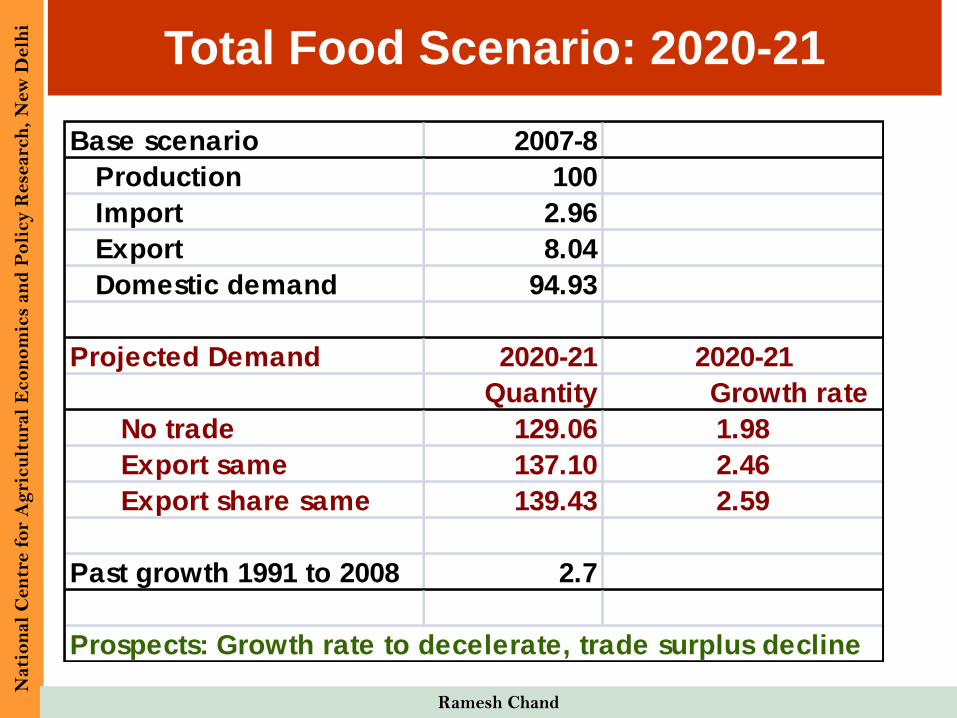
Total Food Scenario: 2020-21N
ati
on
al
Cen
tre f
or
Ag
ricu
ltu
ral
Eco
no
mic
s an
d P
oli
cy R
ese
arc
h,
New
Delh
i
Ramesh Chand
Base scenario 2007-8
Production 100
Import 2.96
Export 8.04
Domestic demand 94.93
Projected Demand 2020-21 2020-21
Quantity Growth rate
No trade 129.06 1.98
Export same 137.10 2.46
Export share same 139.43 2.59
Past growth 1991 to 2008 2.7
Prospects: Growth rate to decelerate, trade surplus decline
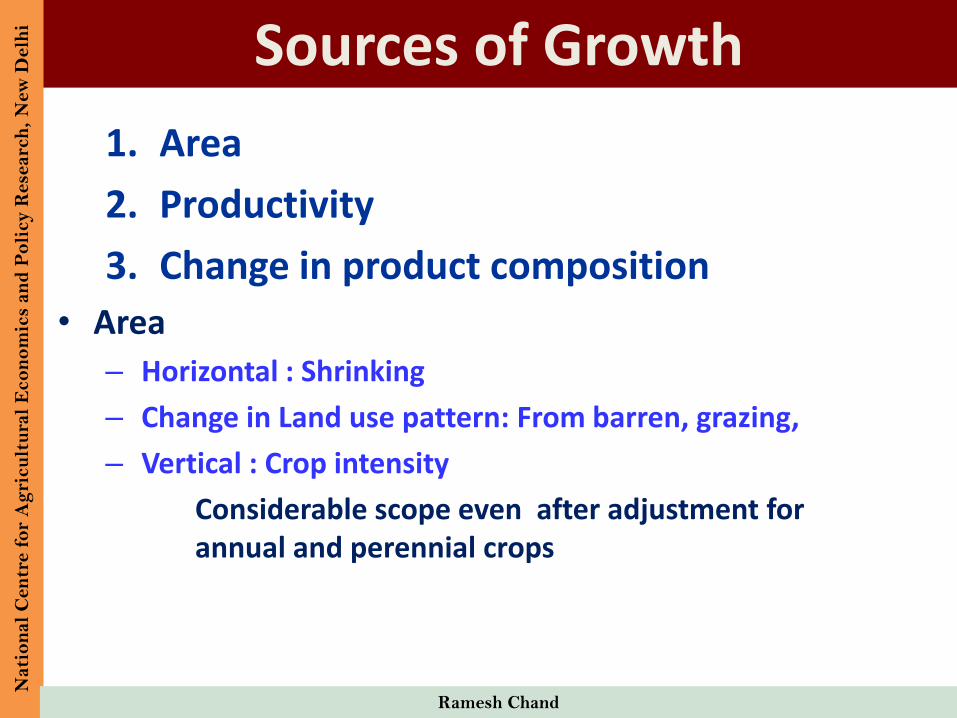
Sources of Growth
1. Area
2. Productivity
3. Change in product composition
• Area
– Horizontal : Shrinking
– Change in Land use pattern: From barren, grazing,
– Vertical : Crop intensity
Considerable scope even after adjustment for annual and perennial crops
Nati
on
al
Cen
tre f
or
Ag
ricu
ltu
ral
Eco
no
mic
s an
d P
oli
cy R
ese
arc
h,
New
Delh
i
Ramesh Chand
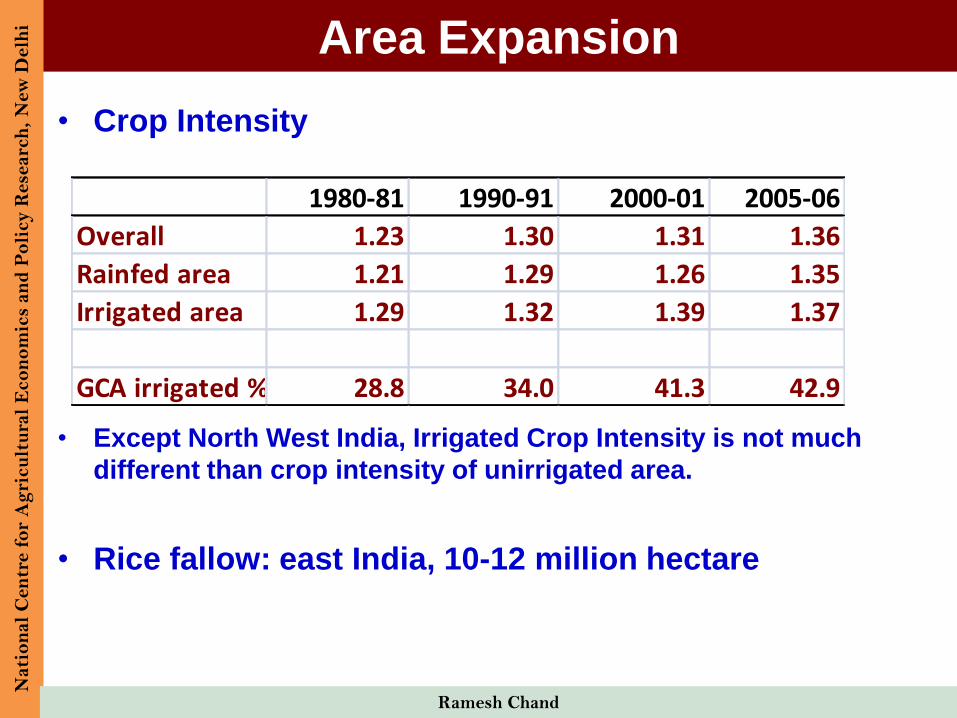
Area Expansion
• Crop Intensity
• Except North West India, Irrigated Crop Intensity is not much
different than crop intensity of unirrigated area.
• Rice fallow: east India, 10-12 million hectare
Nati
on
al
Cen
tre f
or
Ag
ricu
ltu
ral
Eco
no
mic
s an
d P
oli
cy R
ese
arc
h,
New
Delh
i
Ramesh Chand
1980-81 1990-91 2000-01 2005-06
Overall 1.23 1.30 1.31 1.36
Rainfed area 1.21 1.29 1.26 1.35
Irrigated area 1.29 1.32 1.39 1.37
GCA irrigated % 28.8 34.0 41.3 42.9
Growth in Productivity
• Technological change
• More intensive use of inputs
• Quality input (seed)
• Improvement in efficiency
Nati
on
al
Cen
tre f
or
Ag
ricu
ltu
ral
Eco
no
mic
s an
d P
oli
cy R
ese
arc
h,
New
Delh
i
Ramesh Chand
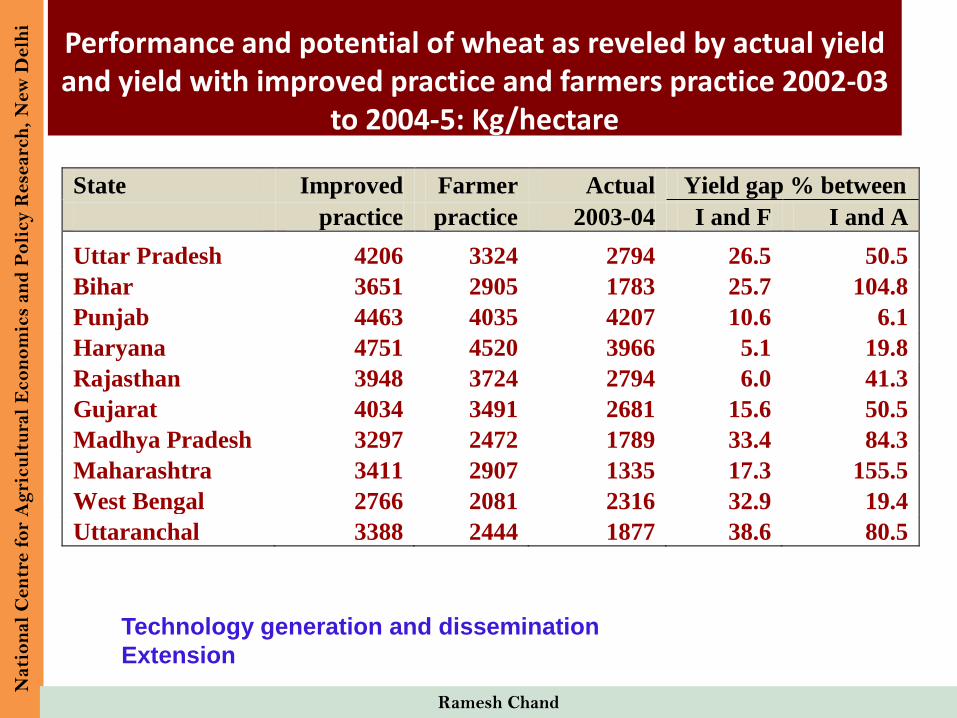
Performance and potential of wheat as reveled by actual yield and yield with improved practice and farmers practice 2002-03
to 2004-5: Kg/hectare
State Improved Farmer Actual Yield gap % between
practice practice 2003-04 I and F I and A
Uttar Pradesh 4206 3324 2794 26.5 50.5
Bihar 3651 2905 1783 25.7 104.8
Punjab 4463 4035 4207 10.6 6.1
Haryana 4751 4520 3966 5.1 19.8
Rajasthan 3948 3724 2794 6.0 41.3
Gujarat 4034 3491 2681 15.6 50.5
Madhya Pradesh 3297 2472 1789 33.4 84.3
Maharashtra 3411 2907 1335 17.3 155.5
West Bengal 2766 2081 2316 32.9 19.4
Uttaranchal 3388 2444 1877 38.6 80.5
Nati
on
al
Cen
tre f
or
Ag
ricu
ltu
ral
Eco
no
mic
s an
d P
oli
cy R
ese
arc
h,
New
Delh
i
Ramesh Chand
Technology generation and dissemination
Extension
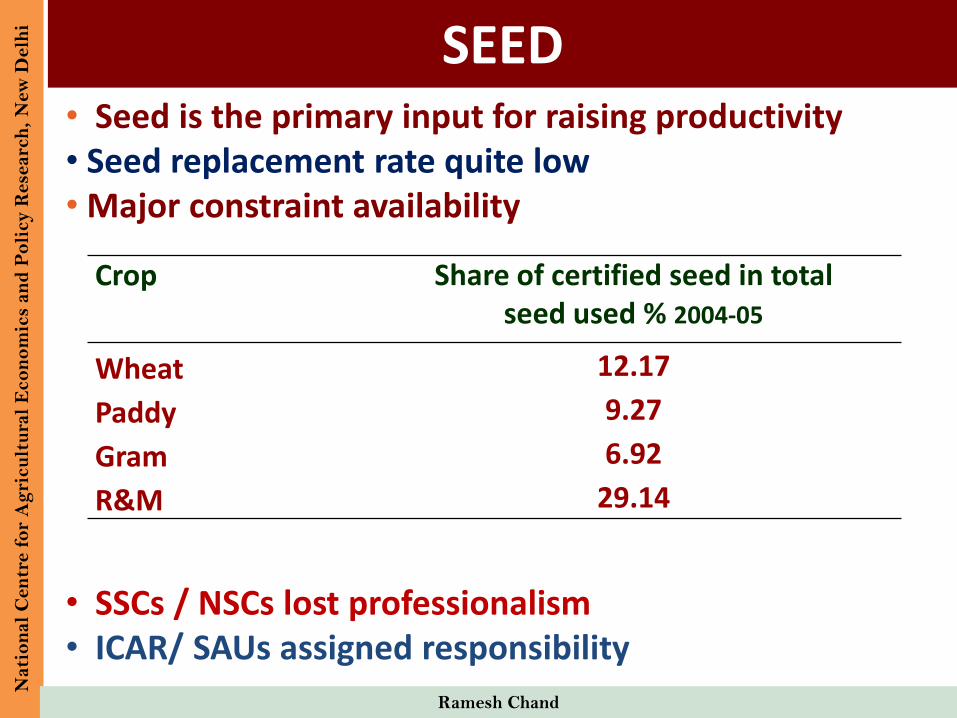
SEED• Seed is the primary input for raising productivity• Seed replacement rate quite low• Major constraint availability
Crop Share of certified seed in total seed used % 2004-05
Wheat 12.17
Paddy 9.27
Gram 6.92
R&M 29.14
• SSCs / NSCs lost professionalism• ICAR/ SAUs assigned responsibility
Nati
on
al
Cen
tre f
or
Ag
ricu
ltu
ral
Eco
no
mic
s an
d P
oli
cy R
ese
arc
h,
New
Delh
i
Ramesh Chand
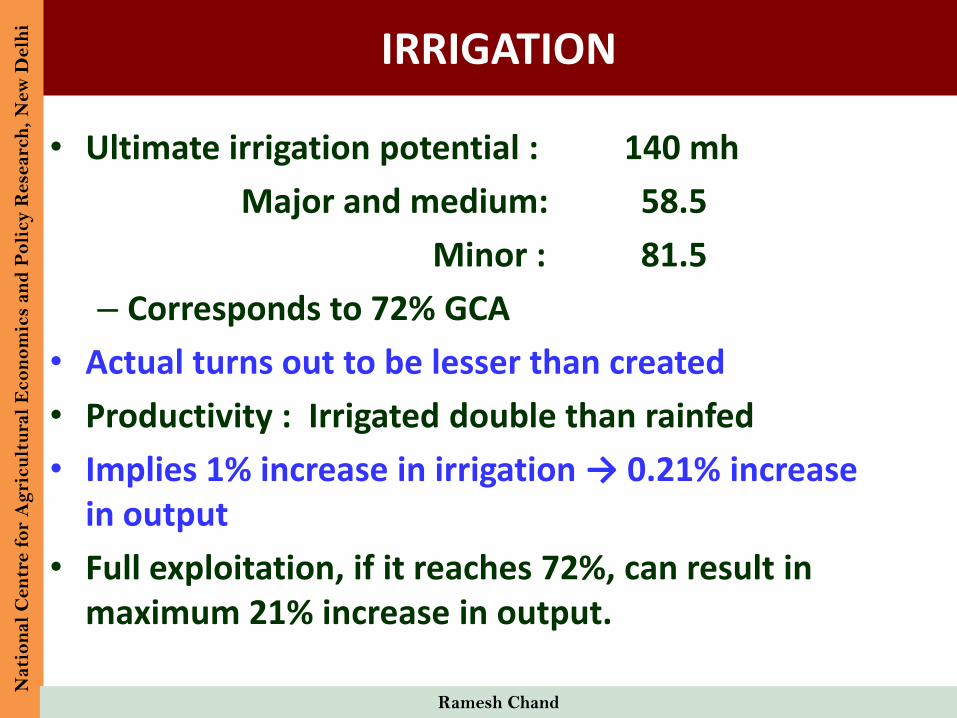
IRRIGATION
• Ultimate irrigation potential : 140 mh
Major and medium: 58.5
Minor : 81.5
– Corresponds to 72% GCA
• Actual turns out to be lesser than created
• Productivity : Irrigated double than rainfed
• Implies 1% increase in irrigation → 0.21% increase in output
• Full exploitation, if it reaches 72%, can result in maximum 21% increase in output.
Nati
on
al
Cen
tre f
or
Ag
ricu
ltu
ral
Eco
no
mic
s an
d P
oli
cy R
ese
arc
h,
New
Delh
i
Ramesh Chand
Growth Through Diversification
• Horticulture (almost same output as
foodgrains in value terms)
• Livestock (share rising)
• Fishery
Nati
on
al
Cen
tre f
or
Ag
ricu
ltu
ral
Eco
no
mic
s an
d P
oli
cy R
ese
arc
h,
New
Delh
i
Ramesh Chand
POTENTIAL OF HORTICULTURE:
Supply Side
Nati
on
al
Cen
tre f
or
Ag
ricu
ltu
ral
Eco
no
mic
s an
d P
oli
cy R
ese
arc
h,
New
Delh
i
Ramesh Chand
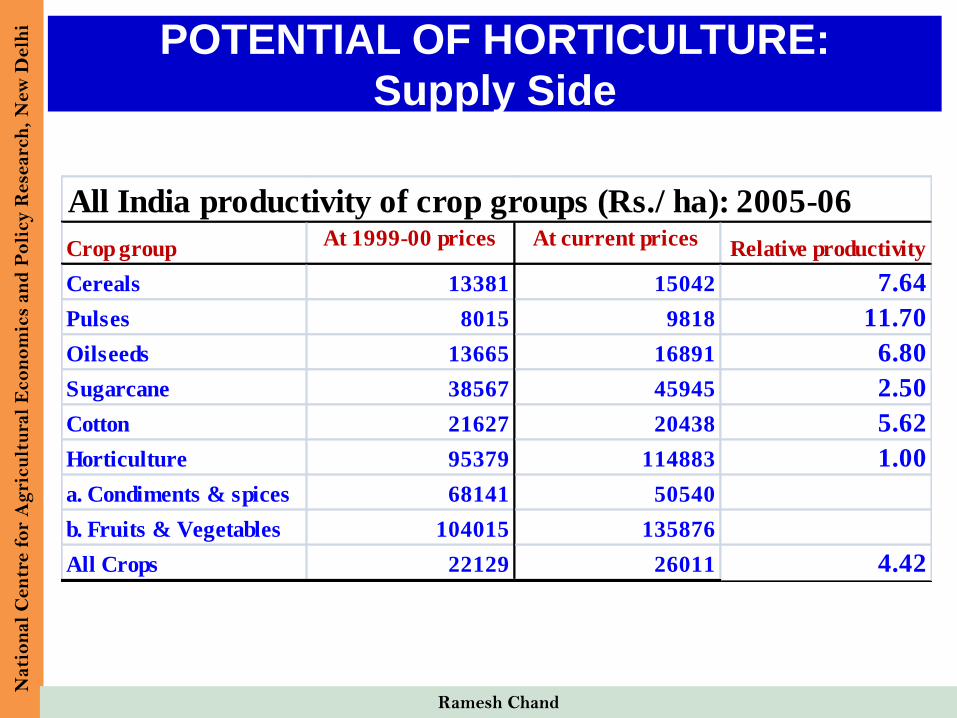
All India productivity of crop groups (Rs./ ha): 2005-06
Crop groupAt 1999-00 prices At current prices
Relative productivity
Cereals 13381 15042 7.64
Pulses 8015 9818 11.70
Oilseeds 13665 16891 6.80
Sugarcane 38567 45945 2.50
Cotton 21627 20438 5.62
Horticulture 95379 114883 1.00
a. Condiments & spices 68141 50540
b. Fruits & Vegetables 104015 135876
All Crops 22129 26011 4.42
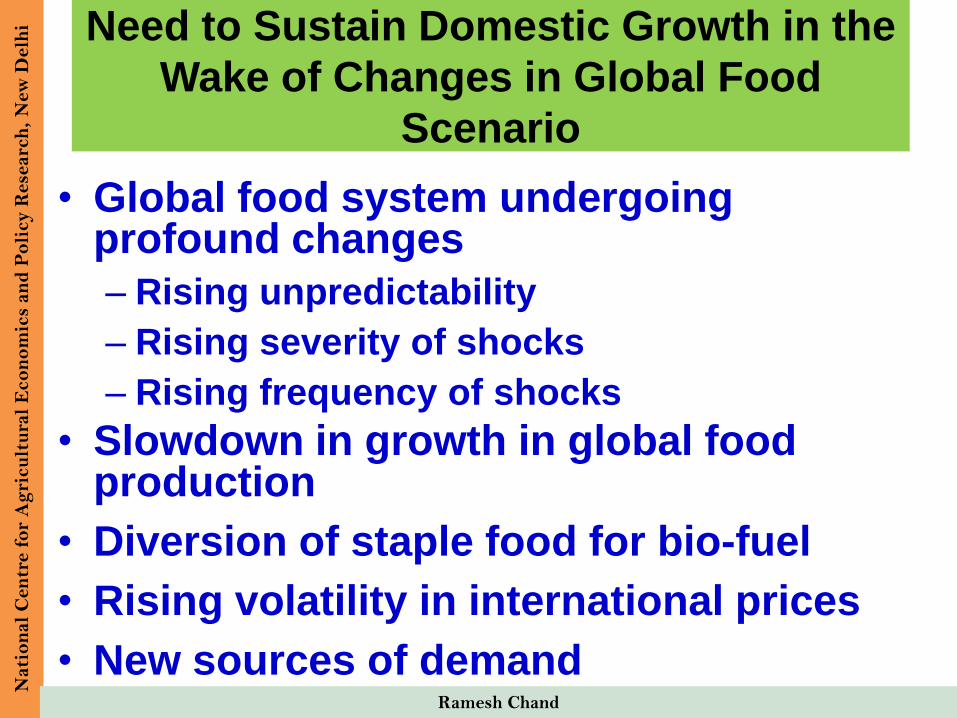
Need to Sustain Domestic Growth in the
Wake of Changes in Global Food
Scenario
• Global food system undergoing profound changes
– Rising unpredictability
– Rising severity of shocks
– Rising frequency of shocks
• Slowdown in growth in global food production
• Diversion of staple food for bio-fuel
• Rising volatility in international prices
• New sources of demand
Nati
on
al
Cen
tre f
or
Ag
ricu
ltu
ral
Eco
no
mic
s an
d P
oli
cy R
ese
arc
h,
New
Delh
i
Ramesh Chand
Supply Prospects Towards 2020-21N
ati
on
al
Cen
tre f
or
Ag
ricu
ltu
ral
Eco
no
mic
s an
d P
oli
cy R
ese
arc
h,
New
Delh
i
Ramesh Chand
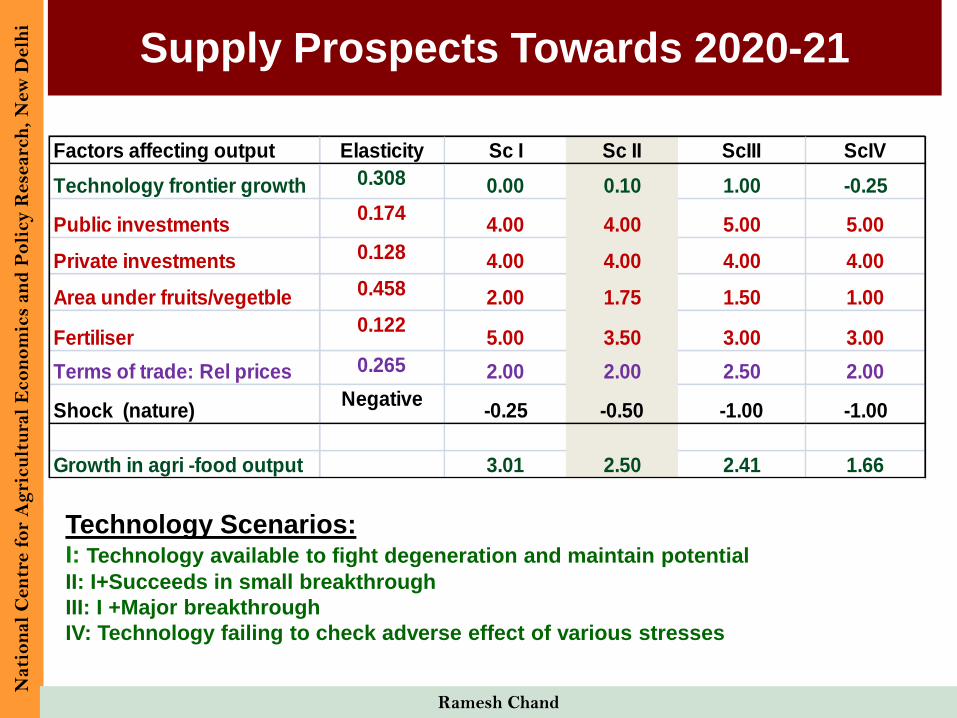
Factors affecting output Elasticity Sc I Sc II ScIII ScIV
Technology frontier growth 0.308 0.00 0.10 1.00 -0.25
Public investments0.174
4.00 4.00 5.00 5.00
Private investments 0.128 4.00 4.00 4.00 4.00
Area under fruits/vegetble 0.458 2.00 1.75 1.50 1.00
Fertiliser0.122
5.00 3.50 3.00 3.00
Terms of trade: Rel prices 0.265 2.00 2.00 2.50 2.00
Shock (nature)Negative
-0.25 -0.50 -1.00 -1.00
Growth in agri -food output 3.01 2.50 2.41 1.66
Technology Scenarios:I: Technology available to fight degeneration and maintain potential
II: I+Succeeds in small breakthrough
III: I +Major breakthrough
IV: Technology failing to check adverse effect of various stresses
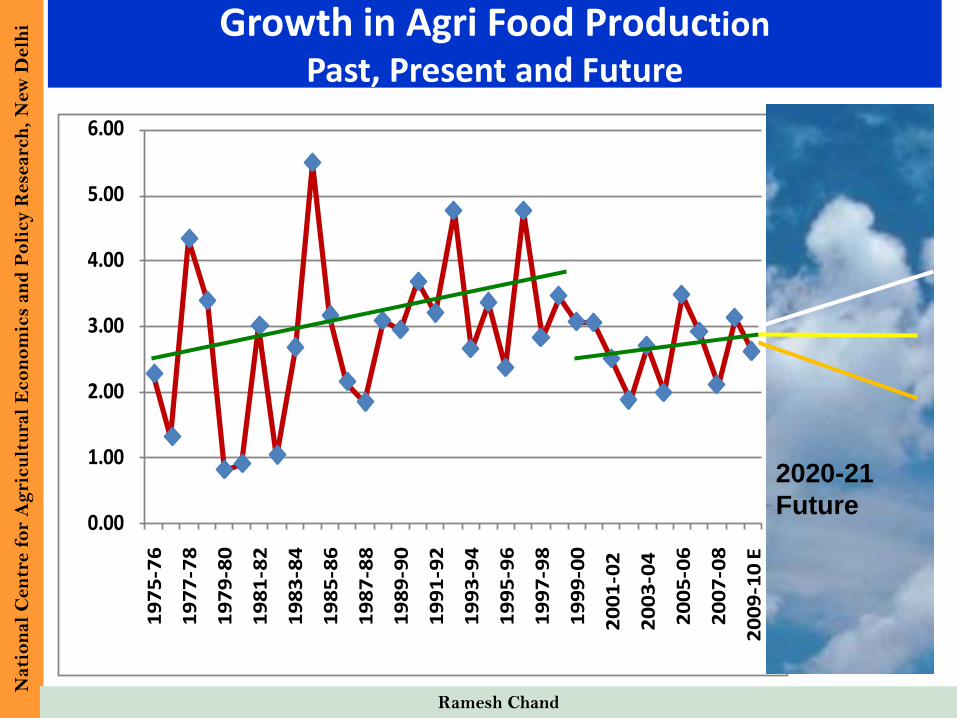
Growth in Agri Food ProductionPast, Present and Future
Nati
on
al
Cen
tre f
or
Ag
ricu
ltu
ral
Eco
no
mic
s an
d P
oli
cy R
ese
arc
h,
New
Delh
i
Ramesh Chand
0.00
1.00
2.00
3.00
4.00
5.00
6.001
97
5-7
6
19
77
-78
19
79
-80
19
81
-82
19
83
-84
19
85
-86
19
87
-88
19
89
-90
19
91
-92
19
93
-94
19
95
-96
19
97
-98
19
99
-00
20
01
-02
20
03
-04
20
05
-06
20
07
-08
20
09
-10
E
2020-21
Future
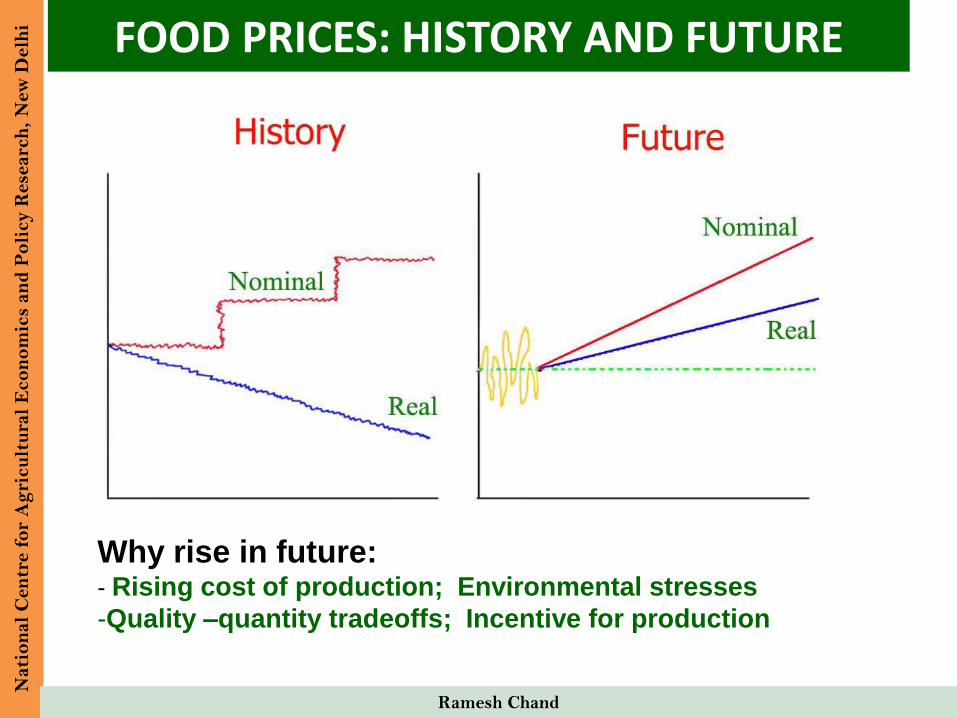
FOOD PRICES: HISTORY AND FUTUREN
ati
on
al
Cen
tre f
or
Ag
ricu
ltu
ral
Eco
no
mic
s an
d P
oli
cy R
ese
arc
h,
New
Delh
i
Ramesh Chand
Why rise in future:- Rising cost of production; Environmental stresses
-Quality –quantity tradeoffs; Incentive for production
Nati
on
al
Cen
tre f
or
Ag
ricu
ltu
ral
Eco
no
mic
s an
d P
oli
cy R
ese
arc
h,
New
Delh
i
Ramesh Chand
Thanks