Future of Energy: Digital for Coal-Fired Plants · 2 Future of Energy: Digital for Coal-Fired...
20
GE Power Future of Energy: Digital for Coal-Fired Plants A Global Perspective on Benefits of Operations Optimization for Coal Power
Transcript of Future of Energy: Digital for Coal-Fired Plants · 2 Future of Energy: Digital for Coal-Fired...

GE Power
Future of Energy: Digital for Coal-Fired PlantsA Global Perspective on Benefits of Operations Optimization for Coal Power

2 Future of Energy: Digital for Coal-Fired Plants
Executive SummaryThe global power system is in the early days of a massive transformation, and coal is at the center of the change. Availability and use of renewable energy generation, such as wind and solar power, is on the rise. But the fluctuating nature of these sources creates challenges for power and utility companies that need to continue running coal plants for their economic advantages or because of a lack of alternatives.
Renewable energy is not a passing trend. Since 2005, 870 gigawatts (GW) of renewable energy generation have been added to the global electric power system. In 2015, a record 150 GW of new renewables were installed. By 2020, net electricity generation from renewables is expected to increase by more than 50% over 2012 levels.1
Globally, countries are in different stages of the renewable energy transformation and each face individual challenges in balancing the role of coal power in their own political- and resource-driven ecosystems. Some coal plant owners are facing immediate implications. In other regions, governments are developing plans focused on how they will shift energy usage in an effort to fulfill their 2030 Paris commitments. Still other regions are envisioning an energy future not heavily tied to fuel imports, a future that may be decades in the making.
This white paper will detail the current state of coal in the energy mix for:
Regardless of each region’s unique balance, the conclusion is that coal will remain part of the long-term energy mix for many countries. It isn’t really a question of if coal will be leveraged, rather how to best use it to meet power needs in a mix with renewables while minimizing environmental impact.
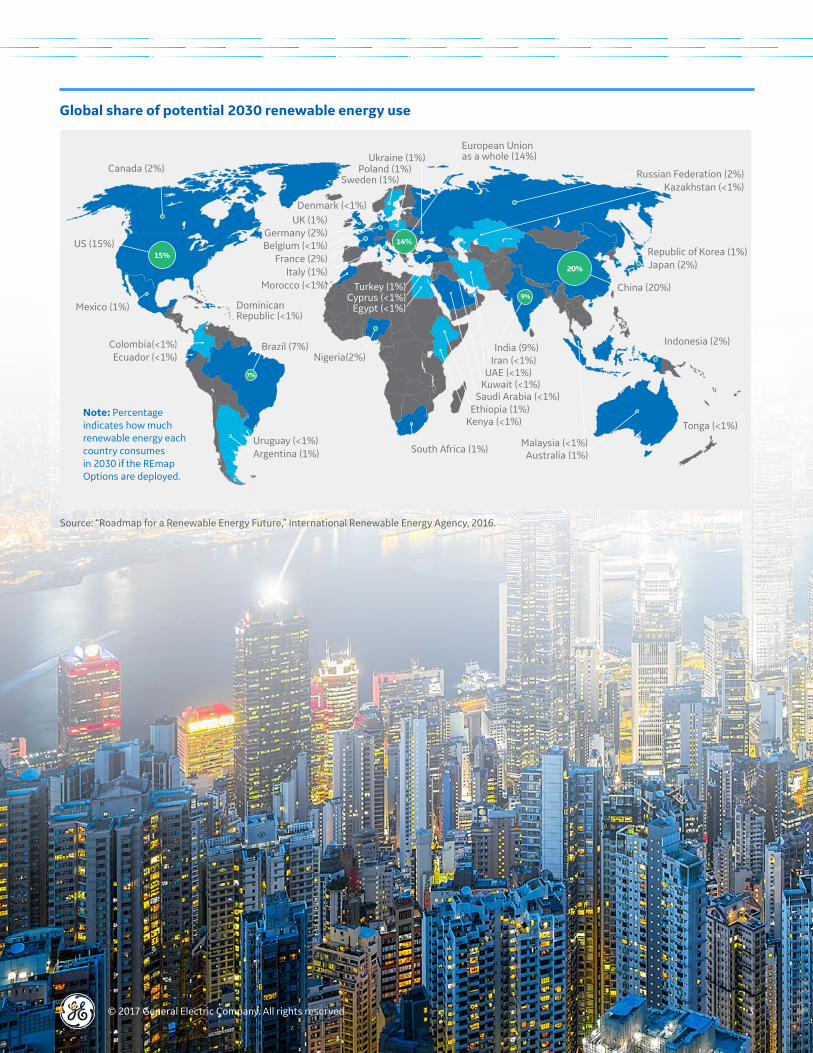
Over the next decade, there will be $1.3 trillion of value to be captured in the digital transformation of electricity. With software and data analytics, combined with advanced hardware, new digitally-enhanced power generation will deliver greater flexibility, reliability, affordability and sustainability, improve efficiencies and reduce costs, create growth opportunities and lower emissions for coal fired operations.2 Coal plant owners that embrace digital will be in the best position to successfully address the challenges and opportunities of a rapidly changing energy sector. According to REmap, the International Renewable Energy Agency’s Roadmap for a Renewable Energy Future, there is a significant opportunity for countries to scale up their share of renewable energy as illustrated by the figure on page 3.
0
5
10
15
20
25
30
35
40
PetroleumNuclear
Natural Gas
Coal
Renewables
2012 2020 2025 2030 2035 2040
Source: U.S. Energy Information Administration (EIA).
World net electricity generation by fuel, 2012-2040 (trillion kilowatthours)
North America European Union China India
Japan Southeast Asia Australia South Africa
© 2017 General Electric Company. All rights reserved. 3
Canada (2%)
US (15%)
Mexico (1%) DominicanRepublic (<1%)
Colombia(<1%)Ecuador (<1%)
Brazil (7%)
Uruguay (<1%)South Africa (1%)
Note: Percentage indicates how muchrenewable energy each country consumesin 2030 if the REmap Options are deployed.
Australia (1%)
Tonga (<1%)
Indonesia (2%)
China (20%)
Japan (2%)Republic of Korea (1%)
Malaysia (<1%)
India (9%)
Kenya (<1%)Ethiopia (1%)
Kuwait (<1%)UAE (<1%)
Iran (<1%)
Saudi Arabia (<1%)
Egypt (<1%)
Nigeria(2%)
Cyprus (<1%)
Argentina (1%)
Morocco (<1%)Italy (1%)
France (2%)Belgium (<1%)
UK (1%)Germany (2%)
Denmark (<1%)
Sweden (1%)Poland (1%)
Ukraine (1%)European Unionas a whole (14%)
Turkey (1%)
Kazakhstan (<1%)Russian Federation (2%)
15%
7%
14%
20%
9%
Source: “Roadmap for a Renewable Energy Future,” International Renewable Energy Agency, 2016.
Global share of potential 2030 renewable energy use

4 Future of Energy: Digital for Coal-Fired Plants
Global Coal — Current Market
North America
North America’s energy usage has been changing for many years. As the availability of natural gas increased, the use of coal declined. Coal, used primarily for electricity generation, reached its lowest level since 1997. Natural gas and renewable energy saw associated growth. Wind grew by 31% and solar by 5%.
For example, the United States electricity generation share from renewables and nuclear is expected to grow from 33% in 2015 to 41% in 2025 while the total North American share of electricity generation from renewables and nuclear is projected to increase from 38% to 45% in 2025.3
These projections indicate that although the United States and the North American region as a whole will substantially increase the percentage of renewables in their electricity generation mix from 2015 to 2025, fossil fuels will continue to account for nearly three-fifths of the US mix and more than half of the North American mix by the end of this period.4
60%
50%
40%
30%
20%
10%
0%1950 20101970
2016 ForecastNatural Gas (33%)Coal (32%)
Nuclear (19%)
NonhydroRenewables (8%)Hydro (6%)Other (1%)
1990 200019801960
Source: U.S. Energy Information Administration, Monthly Energy Review, March 2016.
U.S. electricity generation by sources 1950–2016
Source: U.S. Energy Information Administration, Annual Energy Outlook 2016.
6
5
4
3
2
1
0United States North AmericaCanada Mexico
14%
19%
67%
23%
18%
59%
20%
18%
62%
29%
16%
55%Trill
ion
killo
wat
t hou
rs
Reference caseprojection
Renewables
Nuclear
Fossil Fuels
2015 2025
Changing North American electricity generation mix

© 2017 General Electric Company. All rights reserved. 5
North American ChallengesAs North American markets saw greater availability of renewable energy sources, coal plant operators faced expectations to flexibly partner with renewables and other power sources to generate energy during periods when renewables cannot meet electricity demands. This, in combination with the increase of regulatory requirements and emissions standards, has created a variety of challenges for North American coal plant owners. Many plants are facing reduced operational hours, variable loads, decommissioning or moth balling.
Since 2012, generators have retired or announced retirements of 42 GW of coal-fired capacity. Between 2% and 12% of additional coal plant retirements have been predicted by 2025. According to the EIA, 18 gigawatts (GW) of electric generating capacity was retired in 2015. In fact, more than 80% of the retired capacity was conventional steam coal.5 The EIA also estimates that coal plant retirements will reach 60 GW by 2020.6 Digital steam plant solutions can help address many of these challenges, through expanding the operating envelope of the plant with greater turndown, faster ramp rates and both faster and lower cost starts. North American operators can run the plants more profitably and extend the operating profile of coal-plants while technology advances in asset management can reduce operating costs significantly by applying analytics driven maintenance strategies.
In North America, between 2% and 12% of coal plant retirements have been predicted by 2025.
6 Future of Energy: Digital for Coal-Fired Plants
European Union
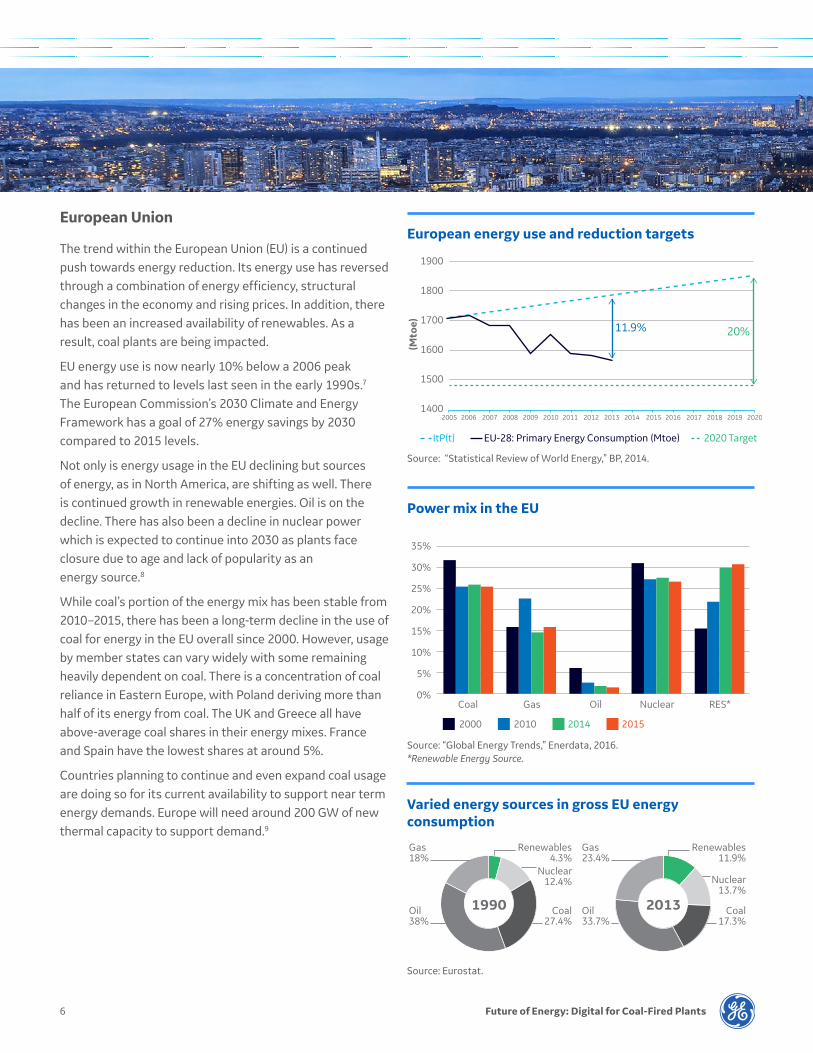
The trend within the European Union (EU) is a continued push towards energy reduction. Its energy use has reversed through a combination of energy efficiency, structural changes in the economy and rising prices. In addition, there has been an increased availability of renewables. As a result, coal plants are being impacted.
EU energy use is now nearly 10% below a 2006 peak and has returned to levels last seen in the early 1990s.7 The European Commission’s 2030 Climate and Energy Framework has a goal of 27% energy savings by 2030 compared to 2015 levels.
Not only is energy usage in the EU declining but sources of energy, as in North America, are shifting as well. There is continued growth in renewable energies. Oil is on the decline. There has also been a decline in nuclear power which is expected to continue into 2030 as plants face closure due to age and lack of popularity as an energy source.8
While coal’s portion of the energy mix has been stable from 2010–2015, there has been a long-term decline in the use of coal for energy in the EU overall since 2000. However, usage by member states can vary widely with some remaining heavily dependent on coal. There is a concentration of coal reliance in Eastern Europe, with Poland deriving more than half of its energy from coal. The UK and Greece all have above-average coal shares in their energy mixes. France and Spain have the lowest shares at around 5%.
Countries planning to continue and even expand coal usage are doing so for its current availability to support near term energy demands. Europe will need around 200 GW of new thermal capacity to support demand.9
1900
1800
1700
1600
1500
14002005 2006 2007 2008 2009 2010 2011 2012 2013 2014 2015 2016 2017 2018 2019 2020
(Mto
e)
ItP(t) EU-28: Primary Energy Consumption (Mtoe)
11.9% 20%
2020 Target
Source: “Statistical Review of World Energy,” BP, 2014.
European energy use and reduction targets
35%
30%
25%
20%
15%
10%
5%
0%Coal Gas Oil Nuclear RES*
2000 2010 2014 2015
Source: “Global Energy Trends,” Enerdata, 2016. *Renewable Energy Source.
Power mix in the EU
1990 2013
Renewables4.3%
Nuclear12.4%
Coal27.4%
Oil38%
Gas18%
Oil33.7%
Gas23.4%
Renewables11.9%
Nuclear13.7%
Coal17.3%
Source: Eurostat.
Varied energy sources in gross EU energy consumption

© 2017 General Electric Company. All rights reserved. 7
“Thermal is a fundamental part of the energy mix and there is an industry-wide understanding that power plants need to be as flexible as possible,” said European Power Plant Suppliers Association (EPPSA) President Emmanouil Kakaras at the association’s 2016 Annual Technology Evening.10
Poland especially continues to plan for coal expansion even though it had the EU’s second-highest number of wind-power installations in 2015, with developers installing 1.26 gigawatts of new capacity. The country now has 5.1 gigawatts of installed wind capacity. In 2015, investments in the wind sector were 26.4 billion Euros, a 40% increase over 2014 levels.11
European Union ChallengesFor the coal plants, as in North America, the challenge lies in being able to meet the needs of that energy mix and build efficiencies.
Old EU coal plants can find renewed life through reducing total operating costs, increased flexibility and reduced emissions allowing them to meet the toughest EU standards. Modern EU coal plants can leverage these same advances to further reduce their environmental impact while increasing their financial performance. By applying digital analytics, owners can make tradeoffs between plant flexibility and remaining life of the assets. In addition, digital solutions can reduce emissions and significantly reduce and manage total plant operating cost.
Darker colors represent a higher share for coal. The range runs from 54% in Poland down to 5% in France and Sweden. Source: Eurostat.
Coal as a share of the energy mix in EU member states
Other
100%
50%
0%
Renewables Nuclear Gas CoalOil
Poland Germany UK Denmark EU Spain France
Source: Eurostat.
Varied energy mix of selected EU countries, with the EU average shown for comparison
8 Future of Energy: Digital for Coal-Fired Plants
China
China’s energy source mix is changing faster than expected. Some even believe China’s CO2 emissions have peaked — 15 years before the 2030 target.
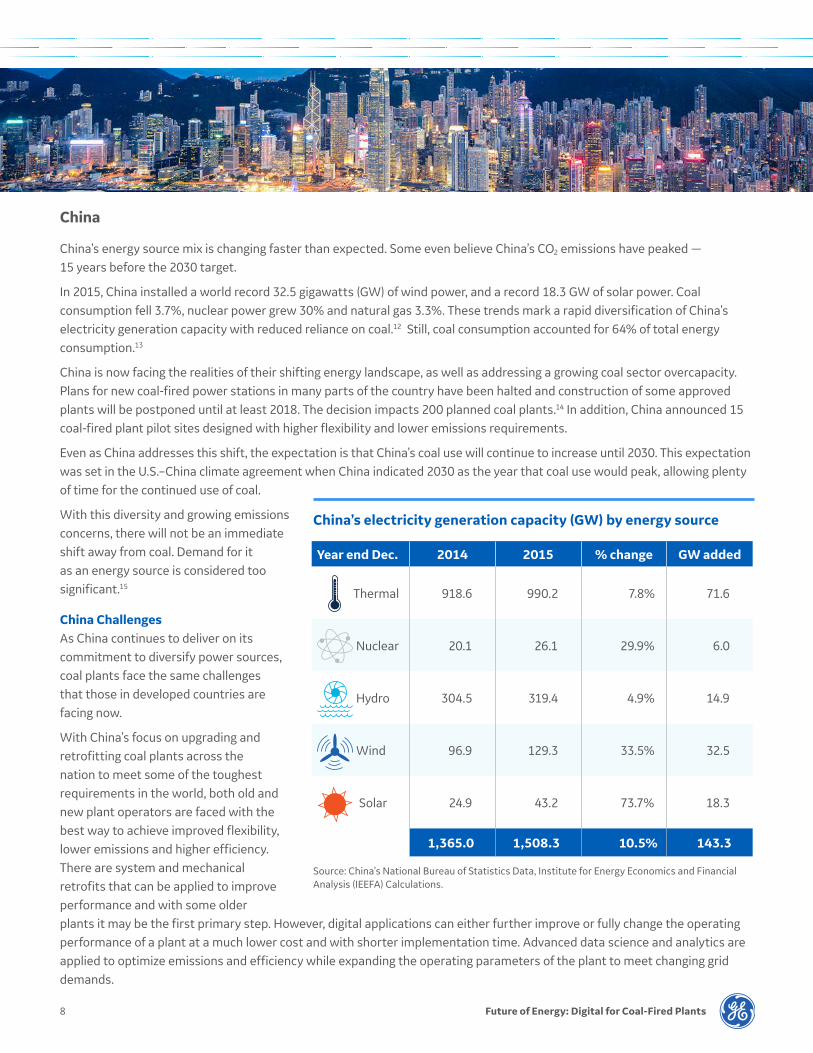
In 2015, China installed a world record 32.5 gigawatts (GW) of wind power, and a record 18.3 GW of solar power. Coal consumption fell 3.7%, nuclear power grew 30% and natural gas 3.3%. These trends mark a rapid diversification of China’s electricity generation capacity with reduced reliance on coal.12 Still, coal consumption accounted for 64% of total energy consumption.13
China is now facing the realities of their shifting energy landscape, as well as addressing a growing coal sector overcapacity. Plans for new coal-fired power stations in many parts of the country have been halted and construction of some approved plants will be postponed until at least 2018. The decision impacts 200 planned coal plants.14 In addition, China announced 15 coal-fired plant pilot sites designed with higher flexibility and lower emissions requirements.
Even as China addresses this shift, the expectation is that China’s coal use will continue to increase until 2030. This expectation was set in the U.S.–China climate agreement when China indicated 2030 as the year that coal use would peak, allowing plenty of time for the continued use of coal.
With this diversity and growing emissions concerns, there will not be an immediate shift away from coal. Demand for it as an energy source is considered too significant.15
China ChallengesAs China continues to deliver on its commitment to diversify power sources, coal plants face the same challenges that those in developed countries are facing now.
With China’s focus on upgrading and retrofitting coal plants across the nation to meet some of the toughest requirements in the world, both old and new plant operators are faced with the best way to achieve improved flexibility, lower emissions and higher efficiency. There are system and mechanical retrofits that can be applied to improve performance and with some older plants it may be the first primary step. However, digital applications can either further improve or fully change the operating performance of a plant at a much lower cost and with shorter implementation time. Advanced data science and analytics are applied to optimize emissions and efficiency while expanding the operating parameters of the plant to meet changing grid demands.
Year end Dec. 2014 2015 % change GW added
Thermal 918.6 990.2 7.8% 71.6
Nuclear 20.1 26.1 29.9% 6.0
Hydro 304.5 319.4 4.9% 14.9
Wind 96.9 129.3 33.5% 32.5
Solar 24.9 43.2 73.7% 18.3
1,365.0 1,508.3 10.5% 143.3
Source: China’s National Bureau of Statistics Data, Institute for Energy Economics and Financial Analysis (IEEFA) Calculations.
China’s electricity generation capacity (GW) by energy source

© 2017 General Electric Company. All rights reserved. 9
India
In India, coal has been and will remain vital to the country’s energy infrastructure and economic development. Coal accounts for approximately 62.1% of India’s installed electricity capacity, representing 185.2 GW distributed among central, state and private sector entities.16
Growth in industrial activity, population, economic prosperity and urbanization along with per-capita energy consumption will continue to drive increases in power demand for years to come. These forces have also made India’s electricity generation sector one of the fastest-growing in the world. Net electricity generation in India is expected to grow at an annual rate of 3.5% per year from 1,052 TWh in 2012 to 2,769 TWh in 2040.17
During the past few years India has developed more aggressive renewable goals. The EIA projects that India will grow its installed hydroelectric and renewable generating capacity by 5% annually to 2040, from 66 GW in 2012 to 154 GW in 2020 and 261 GW in 2040. In 2015, India’s Finance Minister Arun Jaitley announced a target of 175 GW of renewable energy capacity by 2022, which includes 100 GW solar power, 60 GW of wind power, 10 GW of biomass-fired power and 5 GW of small hydropower.
Although India’s electricity generation mix moving forward will include a greater percentage of renewables, coal-based electricity generation will continue to increase through 2040 to more than 1.5 TkWh and remain India’s largest fuel source. Today 85% of the coal plants are based on sub-critical technology. By 2040, India will have 50% super-critical coal plants that will boost average coal plant efficiency from 34% to 38%.18
Coal will also be required to provide continuity and reliability in energy supply. Despite abundant sunshine, solar photovoltaic displaces conventional sources during the daytime to save fuel costs, but will not help to meet peak demand needs in the evening.
India Challenges Renewables will increase in India resulting in pressures on coal plants that is similar to other regions regarding emissions and maintenance costs. However, India coal plants also suffer from efficiency challenges and operating costs as a result of fuel mix. Digital solutions can optimize existing coal plants to drive efficiency up while also pinpointing areas of loss within the plant that can be addressed with retrofits and upgrades. In addition, through advanced analytics that leverage plant data significant reliability improvements can be recognized while simultaneously managing maintenance costs.
Coal, 185.2, 62.1%Gas, 24.5, 8.2%
Oil, 1.0, 0.3%
Hydro, 42.8, 14.4%
Nuclear, 5.8, 1.9%
RES, 38.8, 13.0% Total 298 GW
Installed capacity in India — as of Mar 2016
Source: “Executive Summary of Power Sector”, Central Electricity Authority, Ministry of Power, Government of India, New Delhi. March 2016.
3.0
2.5
2.0
1.5
1.0
0.5
02012 2020 2025 2030 2035 2040
Natural gasLiquids
Nuclear
Renewables
Coal
India electricity generation by fuel source, 2012–2040 (trillion kilowatthours)
Source: “India Energy Outlook”, International Energy Agency (2015), World Energy Outlook 2015, OECD Publishing, Paris.
10 Future of Energy: Digital for Coal-Fired Plants
Japan
Japan, South Korea, and other countries in Asia with few indigenous energy sources are naturally reliant on energy imports. Even more so for Japan as it has substantially reduced its energy generation from nuclear power.
Nuclear power amounted for 27% of electricity generation before 2011. After the Fukushima earthquake all of the countries nuclear reactors were eventually shut down. As a result, Japan spent about $270 billion, or around 58% more, for fossil fuel imports in the three years following the Fukushima accident.19 Japan is in the process of restarting some of its nuclear plants to mitigate reliance on fossil fuel imports. Currently 42 reactors are operable and potentially able to restart, and 24 of these are in the process of restart approvals. The first two restarted in 2015.
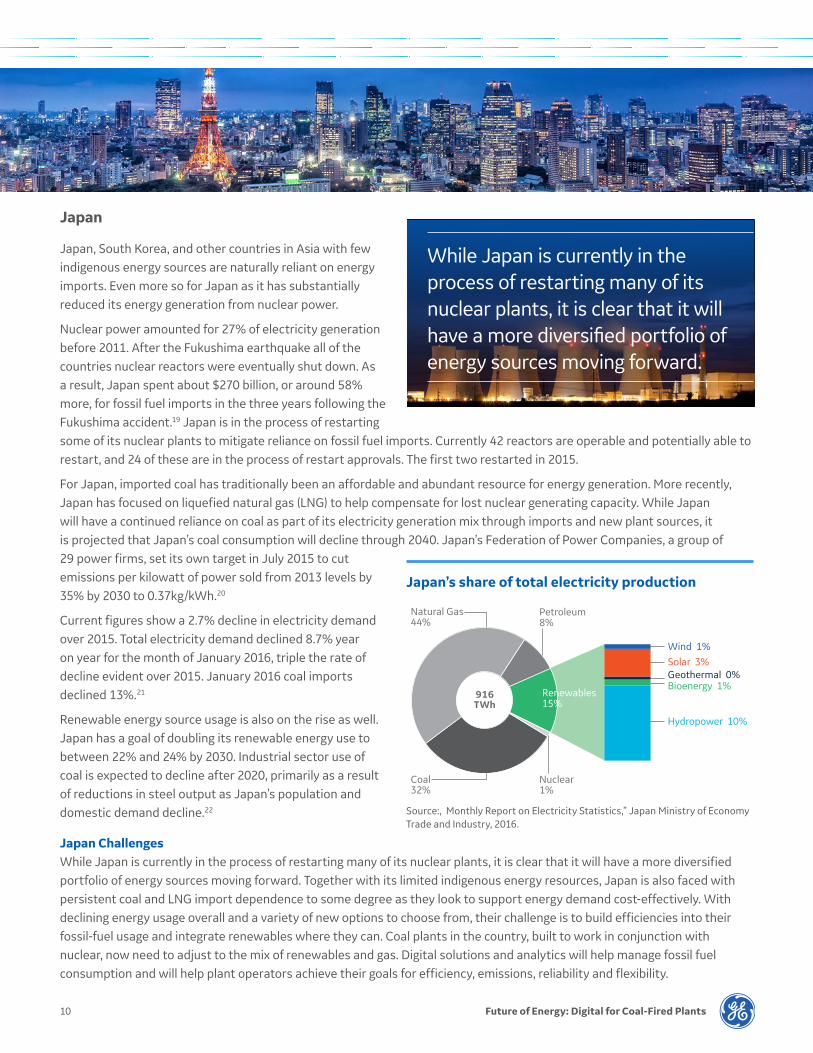
For Japan, imported coal has traditionally been an affordable and abundant resource for energy generation. More recently, Japan has focused on liquefied natural gas (LNG) to help compensate for lost nuclear generating capacity. While Japan will have a continued reliance on coal as part of its electricity generation mix through imports and new plant sources, it is projected that Japan’s coal consumption will decline through 2040. Japan’s Federation of Power Companies, a group of 29 power firms, set its own target in July 2015 to cut emissions per kilowatt of power sold from 2013 levels by 35% by 2030 to 0.37kg/kWh.20
Current figures show a 2.7% decline in electricity demand over 2015. Total electricity demand declined 8.7% year on year for the month of January 2016, triple the rate of decline evident over 2015. January 2016 coal imports declined 13%.21
Renewable energy source usage is also on the rise as well. Japan has a goal of doubling its renewable energy use to between 22% and 24% by 2030. Industrial sector use of coal is expected to decline after 2020, primarily as a result of reductions in steel output as Japan’s population and domestic demand decline.22
Japan ChallengesWhile Japan is currently in the process of restarting many of its nuclear plants, it is clear that it will have a more diversified portfolio of energy sources moving forward. Together with its limited indigenous energy resources, Japan is also faced with persistent coal and LNG import dependence to some degree as they look to support energy demand cost-effectively. With declining energy usage overall and a variety of new options to choose from, their challenge is to build efficiencies into their fossil-fuel usage and integrate renewables where they can. Coal plants in the country, built to work in conjunction with nuclear, now need to adjust to the mix of renewables and gas. Digital solutions and analytics will help manage fossil fuel consumption and will help plant operators achieve their goals for efficiency, emissions, reliability and flexibility.
Nuclear1%
Coal32%
Petroleum8%
Natural Gas44%
916TWh
Wind 1%Solar 3%Geothermal 0%Bioenergy 1%
Hydropower 10%
Renewables15%
Source:, Monthly Report on Electricity Statistics,” Japan Ministry of Economy Trade and Industry, 2016.
Japan’s share of total electricity production
While Japan is currently in the process of restarting many of its nuclear plants, it is clear that it will have a more diversified portfolio of energy sources moving forward.
© 2017 General Electric Company. All rights reserved. 11
Southeast Asia
Southeast Asian countries have typically been dependent on coal as an affordable and abundant imported energy source. They are considering developing nuclear power and renewables to displace some of their reliance on imported coal, but it will take time for these alternate sources to increase production to levels of the current fossil fleet. They are in the early stages of nuclear power plant development. Planning and development of these plants take many years, sometimes requiring more than a decade, so nuclear will not meaningfully mitigate reliance on imported coal in the near term. In the meantime, these countries need to make their existing plants as efficient and flexible as possible.
Energy demand in Southeast Asia is expected to double by 2030. Coal is expected to be the dominant energy source that will help meet that demand.23
Renewables are growing in availability and usage as well. Governments are currently revising their energy plans to include more renewables and energy efficient technologies. But given the scope of growth, fossil fuel dependence will continue into the near future.24
There are plans to scale up renewable energy in Southeast Asia. For example, Indonesia is planning to scale its use of renewables from 6% in 2015 to 25% by 2025. Along with Indonesia, Thailand and Vietnam are among the Southeast Asian countries that have their eye on becoming major growth markets.25
Southeast Asia Challenges To fuel growth and energy demand in Southeast Asia, energy suppliers are expected to act quickly to meet the expected demand. Renewable energy will be a part of the mix and there will be growth opportunities for coal power plants in countries throughout Southeast Asia as well.
Plants will be expected to meet growing environmental scrutiny and be able to adjust as renewable energy grows in usage. The challenge, as this growth rolls out, is for utilities to leverage coal intelligently and in a way that will optimally balance output, efficiency and reliability with the reduction of emissions.
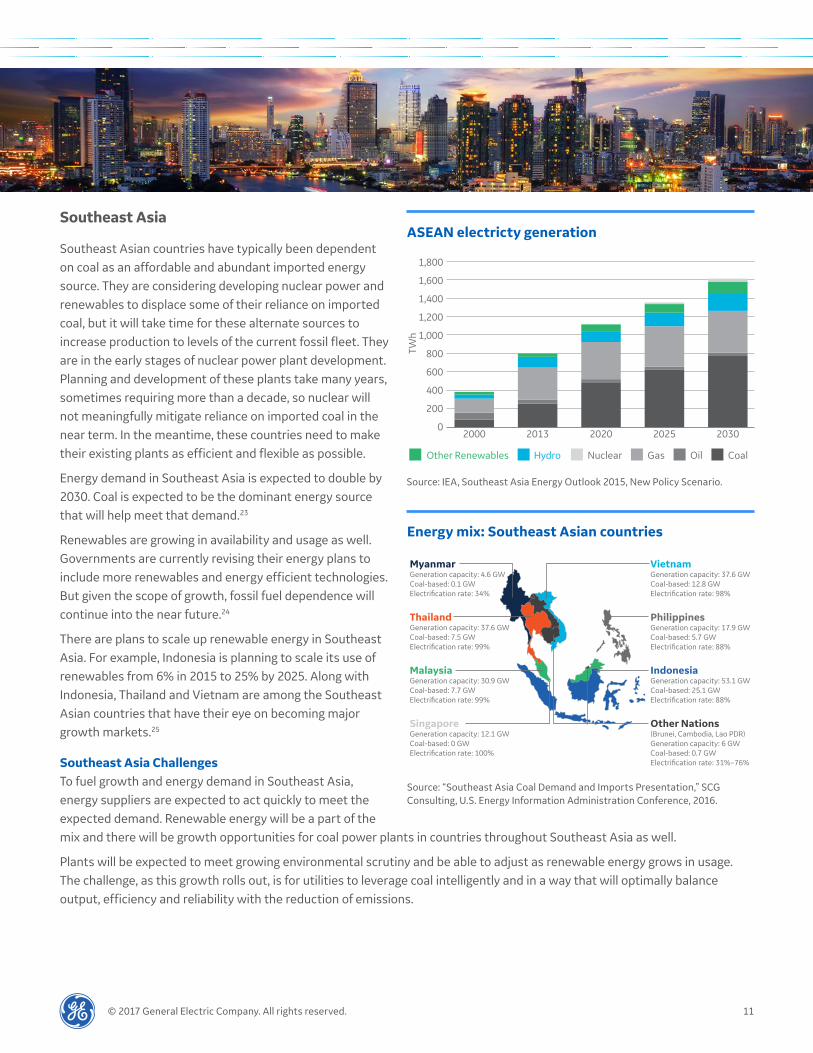
VietnamGeneration capacity: 37.6 GWCoal-based: 12.8 GWElectrification rate: 98%
PhilippinesGeneration capacity: 17.9 GWCoal-based: 5.7 GWElectrification rate: 88%
IndonesiaGeneration capacity: 53.1 GWCoal-based: 25.1 GWElectrification rate: 88%
Other Nations(Brunei, Cambodia, Lao PDR)Generation capacity: 6 GWCoal-based: 0.7 GWElectrification rate: 31%–76%
MyanmarGeneration capacity: 4.6 GWCoal-based: 0.1 GWElectrification rate: 34%
ThailandGeneration capacity: 37.6 GWCoal-based: 7.5 GWElectrification rate: 99%
MalaysiaGeneration capacity: 30.9 GWCoal-based: 7.7 GWElectrification rate: 99%
SingaporeGeneration capacity: 12.1 GWCoal-based: 0 GWElectrification rate: 100%
Source: “Southeast Asia Coal Demand and Imports Presentation,” SCG Consulting, U.S. Energy Information Administration Conference, 2016.
Energy mix: Southeast Asian countries
1,800
1,600
1,400
1,200
1,000
800
600
400
200
0
Hydro Nuclear Gas CoalOil
2000 2025 203020202013
Other Renewables
TWh
ASEAN electricty generation
Source: IEA, Southeast Asia Energy Outlook 2015, New Policy Scenario.
12 Future of Energy: Digital for Coal-Fired Plants
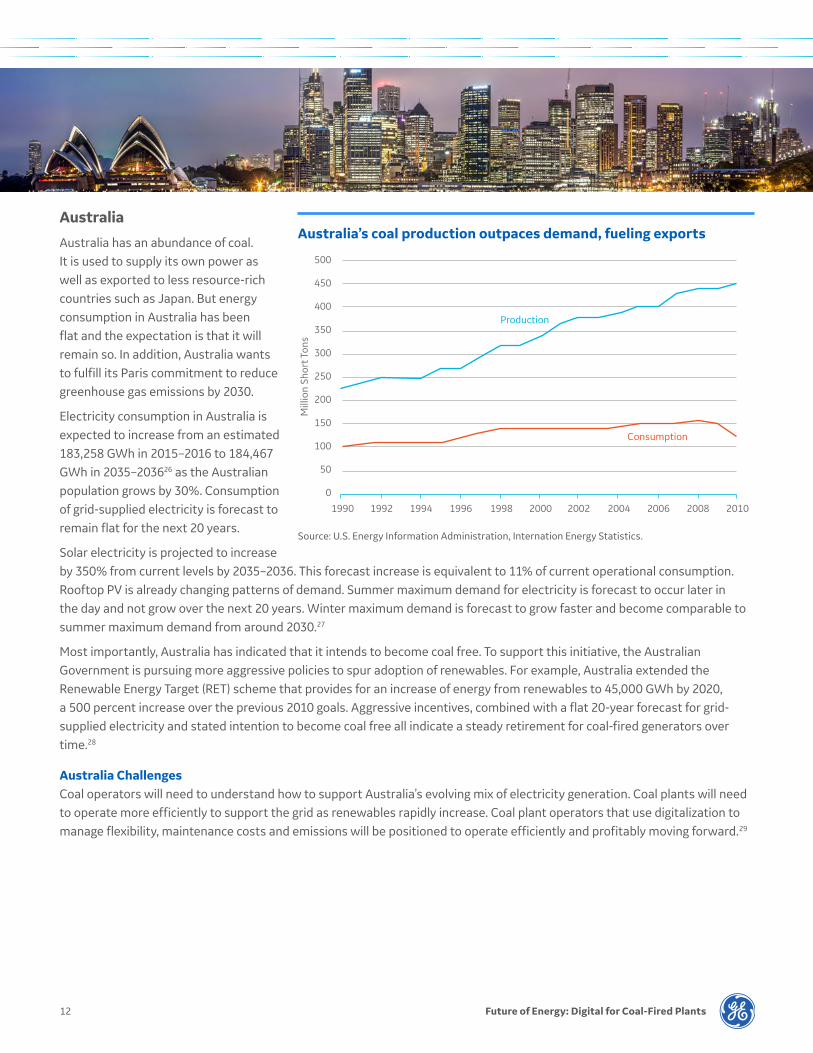
AustraliaAustralia has an abundance of coal. It is used to supply its own power as well as exported to less resource-rich countries such as Japan. But energy consumption in Australia has been flat and the expectation is that it will remain so. In addition, Australia wants to fulfill its Paris commitment to reduce greenhouse gas emissions by 2030.
Electricity consumption in Australia is expected to increase from an estimated 183,258 GWh in 2015–2016 to 184,467 GWh in 2035–203626 as the Australian population grows by 30%. Consumption of grid-supplied electricity is forecast to remain flat for the next 20 years.
Solar electricity is projected to increase by 350% from current levels by 2035–2036. This forecast increase is equivalent to 11% of current operational consumption. Rooftop PV is already changing patterns of demand. Summer maximum demand for electricity is forecast to occur later in the day and not grow over the next 20 years. Winter maximum demand is forecast to grow faster and become comparable to summer maximum demand from around 2030.27
Most importantly, Australia has indicated that it intends to become coal free. To support this initiative, the Australian Government is pursuing more aggressive policies to spur adoption of renewables. For example, Australia extended the Renewable Energy Target (RET) scheme that provides for an increase of energy from renewables to 45,000 GWh by 2020, a 500 percent increase over the previous 2010 goals. Aggressive incentives, combined with a flat 20-year forecast for grid-supplied electricity and stated intention to become coal free all indicate a steady retirement for coal-fired generators over time.28
Australia ChallengesCoal operators will need to understand how to support Australia’s evolving mix of electricity generation. Coal plants will need to operate more efficiently to support the grid as renewables rapidly increase. Coal plant operators that use digitalization to manage flexibility, maintenance costs and emissions will be positioned to operate efficiently and profitably moving forward.29
500
450
400
350
300
250
200
150
100
50
01990 2002 2004 2006 2008 20101994 1998 200019961992
Production
Consumption
Mill
ion
Shor
t Ton
s
Australia’s coal production outpaces demand, fueling exports
Source: U.S. Energy Information Administration, Internation Energy Statistics.
© 2017 General Electric Company. All rights reserved. 13
South Africa
More than 85% of South Africa’s installed electric generating capacity is powered by coal. Although the government prefers a diversified generation portfolio with more renewable power — especially in the face of severe drought conditions — chronic power shortages combined with the economic advantage of coal-fired generation suggest that coal will continue growing as a primary source of energy supply for South Africa.30
50-plus billion tons of coal reserves fuel 90% of the country’s electrical generating capacity and provide a third of its liquid fuels. Total coal consumption in Africa will increase from just under 5 quadrillion Btu in 2012 to 7 quadrillion Btu in 2040, mainly as a result of demand in the electric power sector and metallurgical industries.31
On the renewables front, South Africa is in the nascent stages of the transformation. However, it does have a target of 6,000 new megawatts of renewable generating capacity by 2020 and 18,000 by 2030. There are 13 wind power plants and 31 solar generating stations operating in South Africa and $6 billion has been invested in renewable energy installations. About 45 wind and solar projects are either in construction, financing or permitting stages.32
South Africa ChallengesDrought in South Africa is creating challenges for a country with a preference for coal, as a lack of water reduces hydroelectric generation while simultaneously hindering the use of water by the coal industry. Water scarcity is just another element for South Africa to balance as they look towards the future and make decisions now that will serve their future energy needs. As energy sources become more diversified, they will benefit from using digital tools to improve reliability, efficiency and maintenance costs as they focus on near-term energy challenges while transitioning to a new, longer-term energy mix.
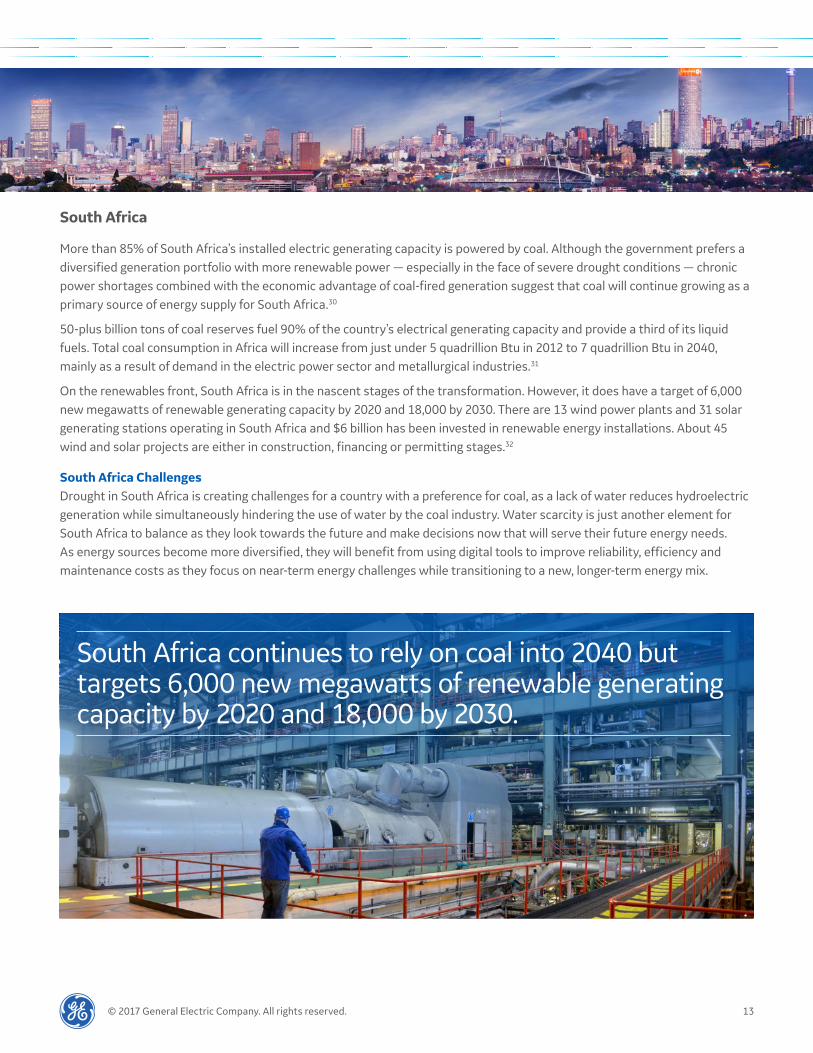
South Africa continues to rely on coal into 2040 but targets 6,000 new megawatts of renewable generating capacity by 2020 and 18,000 by 2030.
14 Future of Energy: Digital for Coal-Fired Plants
Global ChallengesRegardless of where a nation falls on the transformation spectrum, power generators and utilities that rely on coal-fired power plants must adapt to support the new energy mix.
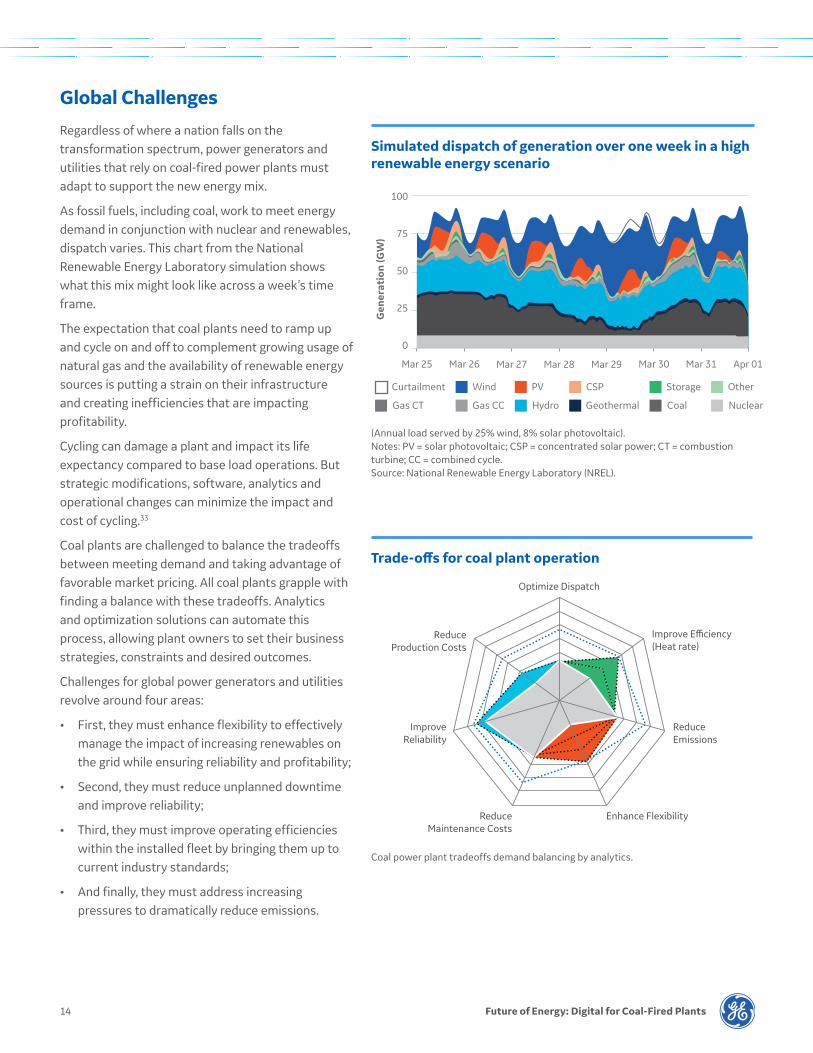
As fossil fuels, including coal, work to meet energy demand in conjunction with nuclear and renewables, dispatch varies. This chart from the National Renewable Energy Laboratory simulation shows what this mix might look like across a week’s time frame.
The expectation that coal plants need to ramp up and cycle on and off to complement growing usage of natural gas and the availability of renewable energy sources is putting a strain on their infrastructure and creating inefficiencies that are impacting profitability.
Cycling can damage a plant and impact its life expectancy compared to base load operations. But strategic modifications, software, analytics and operational changes can minimize the impact and cost of cycling.33
Coal plants are challenged to balance the tradeoffs between meeting demand and taking advantage of favorable market pricing. All coal plants grapple with finding a balance with these tradeoffs. Analytics and optimization solutions can automate this process, allowing plant owners to set their business strategies, constraints and desired outcomes.
Challenges for global power generators and utilities revolve around four areas:
• First, they must enhance flexibility to effectively manage the impact of increasing renewables on the grid while ensuring reliability and profitability;
• Second, they must reduce unplanned downtime and improve reliability;
• Third, they must improve operating efficiencies within the installed fleet by bringing them up to current industry standards;
• And finally, they must address increasing pressures to dramatically reduce emissions.
Coal power plant tradeoffs demand balancing by analytics.
Improve Efficiency(Heat rate)
Optimize Dispatch
ReduceProduction Costs
ReduceMaintenance Costs
Enhance Flexibility
Reduce Emissions
ImproveReliability
Trade-offs for coal plant operation
Mar 31 Apr 01Mar 25 Mar 26 Mar 27 Mar 28 Mar 29 Mar 30
Coal
Storage
Nuclear
OtherCurtailment
Gas CT
Wind
Gas CC
PV
Hydro
CSP
Geothermal
Gen
erat
ion
(GW
)
100
75
50
25
0
(Annual load served by 25% wind, 8% solar photovoltaic). Notes: PV = solar photovoltaic; CSP = concentrated solar power; CT = combustion turbine; CC = combined cycle. Source: National Renewable Energy Laboratory (NREL).
Simulated dispatch of generation over one week in a high renewable energy scenario

© 2017 General Electric Company. All rights reserved. 15
Digital is Redefining the Future of Coal Coal-fired power plants play a critical role in supplying global energy and will remain a major contributor into the future. But inefficiencies, high emissions, low reliability, low plant load factors and the expansion of renewables and solar will continue to be major challenges. By leveraging new digital solutions and analytics, power generators can successfully address these challenges.
In fact, GE digital solutions can add 1–2% improvement in heat rate for a typical power plant and even higher values for older, less efficient plants. Improvements in fuel consumption improve heat rates, lower emissions, and lower power consumption in auxiliary equipment, thereby lowering production costs. The environmental impact of thermal improvement for an average plant could result in a reduction of CO2 by 21 Mt per year.
GE Operations OptimizationA vital digital technology for improving coal-fired power plants is Operations Optimization. GE Operations Optimization improves plant productivity by pushing the operations envelope to be more flexible when markets demand while minimizing emissions, outage and maintenance costs. It improves the ability to cycle when needed with greater efficiency using visibility, insights, recommendations, and actions through powerful digital solutions. GE Operations Optimization is comprised of Operations Evaluation and Plant Optimization.
OPERATIONS OPTIMIZATION
Operations Evaluation Plant Optimization
M T W T F SS
Efficiency Flexibility Availability Capacity Emissions
Drives improvement in thermal performance, operational flexibility, system availability, capacity and emissions by providing a consistent, accurate and easy-to-understand view of operations, performance metrics and decision support across the fleet.
Helps Improves overall MW & HR across the plant against baseline by helping central operations increase production, improve heat rate and manage operating margins across the fleet.
Improves start time, start fuel, ramp rate and minimum load by providing insights that help Plant Managers identify optimal configuration, process, or operational settings of each major component within the plant.
Improves the company’s return on assets with more accurate dispatch offerings at lower operating costs including cycle efficiency, uptime, flexibility and start costs especially when participating in capacity markets.
Improves MW & HR forecasts vs. ambient conditions by determining the recommended configuration to achieve dispatch targets including start up, ramp, operating costs and margin goals.
Effectively manages and lowers emission rates for NOX, SOX and CO2 by determining the operating thresholds during start up, turndown, full load or part load in compliance with regulatory guidelines and emission goals.
Edge to Cloud
ReliabilityReal-Time ActionsAsset Performance
Management
OperationsOptimization
ProductivityBetter, Faster Decisions
BusinessOptimization
ProfitabilityDeeper Insights
GE’s Expanded Digital Portfolio
16 Future of Energy: Digital for Coal-Fired Plants
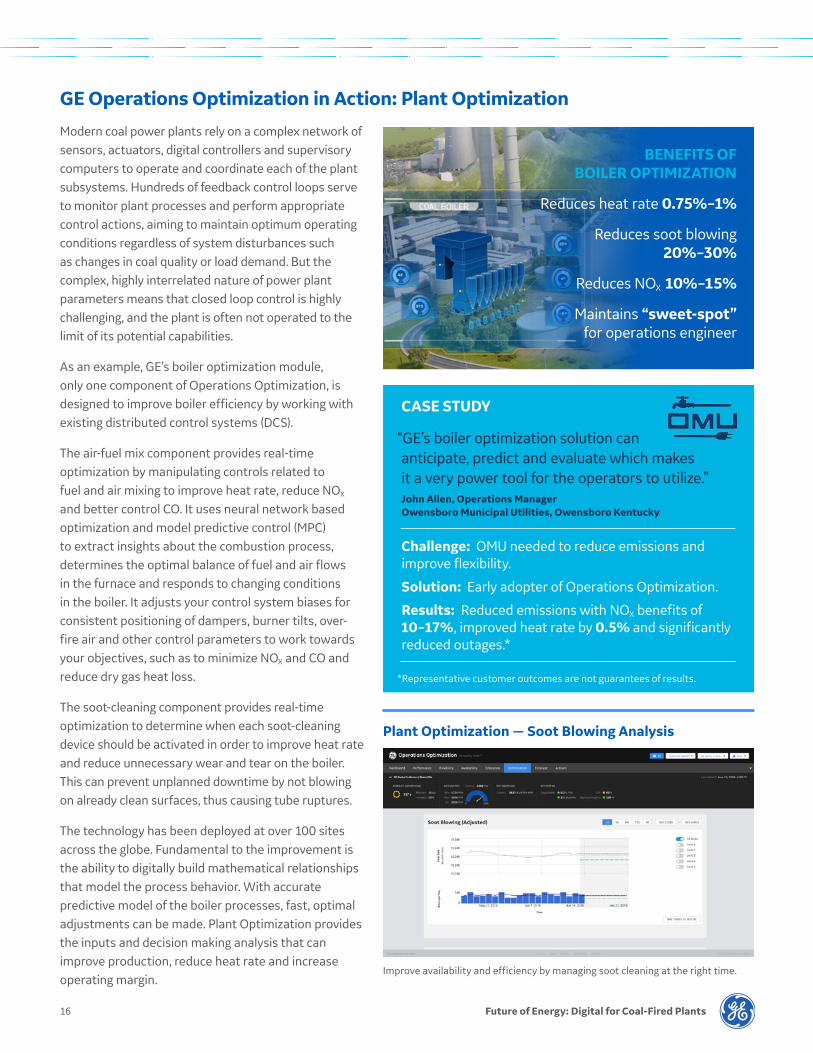
GE Operations Optimization in Action: Plant OptimizationModern coal power plants rely on a complex network of sensors, actuators, digital controllers and supervisory computers to operate and coordinate each of the plant subsystems. Hundreds of feedback control loops serve to monitor plant processes and perform appropriate control actions, aiming to maintain optimum operating conditions regardless of system disturbances such as changes in coal quality or load demand. But the complex, highly interrelated nature of power plant parameters means that closed loop control is highly challenging, and the plant is often not operated to the limit of its potential capabilities.
As an example, GE’s boiler optimization module, only one component of Operations Optimization, is designed to improve boiler efficiency by working with existing distributed control systems (DCS).
The air-fuel mix component provides real-time optimization by manipulating controls related to fuel and air mixing to improve heat rate, reduce NOX and better control CO. It uses neural network based optimization and model predictive control (MPC) to extract insights about the combustion process, determines the optimal balance of fuel and air flows in the furnace and responds to changing conditions in the boiler. It adjusts your control system biases for consistent positioning of dampers, burner tilts, over- fire air and other control parameters to work towards your objectives, such as to minimize NOX and CO and reduce dry gas heat loss.
The soot-cleaning component provides real-time optimization to determine when each soot-cleaning device should be activated in order to improve heat rate and reduce unnecessary wear and tear on the boiler. This can prevent unplanned downtime by not blowing on already clean surfaces, thus causing tube ruptures.
The technology has been deployed at over 100 sites across the globe. Fundamental to the improvement is the ability to digitally build mathematical relationships that model the process behavior. With accurate predictive model of the boiler processes, fast, optimal adjustments can be made. Plant Optimization provides the inputs and decision making analysis that can improve production, reduce heat rate and increase operating margin.
BENEFITS OF BOILER OPTIMIZATION
Reduces heat rate 0.75%–1%
Reduces soot blowing 20%–30%
Reduces NOX 10%–15%
Maintains “sweet-spot” for operations engineer
Improve availability and efficiency by managing soot cleaning at the right time.
Plant Optimization — Soot Blowing Analysis
CASE STUDY
“GE’s boiler optimization solution can anticipate, predict and evaluate which makes it a very power tool for the operators to utilize.”John Allen, Operations Manager Owensboro Municipal Utilities, Owensboro Kentucky
Challenge: OMU needed to reduce emissions and improve flexibility.
Solution: Early adopter of Operations Optimization.
Results: Reduced emissions with NOX benefits of 10–17%, improved heat rate by 0.5% and significantly reduced outages.*
*Representative customer outcomes are not guarantees of results.

© 2017 General Electric Company. All rights reserved. 17
Removing
~250 Millioncars globally35
Eliminating electrical use of
~70 Millionhomes annually
Adding
~118,442new wind generators
Burning
~1.1 Billion fewerbarrels of oil annually
Burning
500 Billion Pounds less coal annually
Removing 469 million Mt is equivalent to:34
The Numbers Add Up If GE’s Digital Power Plant were installed on compatible power plants globally and it improved efficiency by 1.5%, then annually carbon dioxide emissions from thermal power plants would fall from 11,226 million Mt to 10,757 million Mt. That is a CO2 reduction of 469 million Mt or 4.2% globally simply by adding digitalization to existing coal-fired power plants around the world!
10,000
12,000
11,226million Mt
10,757million Mt
CO2 before Digital Power Plant
CO2 after Digital Power Plant
CO2 reduction of
469million Mt
or
4.2%

18 Future of Energy: Digital for Coal-Fired Plants
Conclusion
With nearly 900 billion tons of coal reserves in the world today, coal will continue to be a viable, low-cost means for power production globally and it is imperative that we use these resources as efficiently as possible. Operations Optimization is designed to help power generators tackle increasingly complex and challenging operational issues, meet business demand, align people and systems, and reach “true” plant capacity while still reducing cost, downtime and emissions.
Operations Optimization isn’t just about expanding current plant capacity — it’s about redefining the future in a world increasingly dedicated to efficiency and the reduction of CO2 emissions. Operations Optimization provides the insight to act towards increased operational excellence in compliance with more stringent regulations and emissions goals.
Now power generation leaders can align operation priorities to business strategy at scale across their fleet, regardless of generation source. Whether the fleet has a portfolio of steam plants like coal, biomass, nuclear or plants that run gas, liquid fuel or renewable sources such as wind or hydro, Operations Optimization is capable of delivering results regardless of OEM.
Why GE?GE is transforming the electricity industry across the entire Electricity Value Network with the world’s most comprehensive set of digital solutions for power generation, transmission, distribution and customer management, making power more affordable, reliable, accessible and sustainable. With a unique understanding of the complex interrelationships across the ecosystem and implications to our customers and through it’s 130 year history in the energy sector, GE brings expertise in analytic software, engineering and operations to help drive compelling outcomes for power companies globally.

© 2017 General Electric Company. All rights reserved. 19
Footnotes1. “Roadmap for a Renewable Energy Future,” International
Renewable Energy Agency, 2016.
2. “Digital Transformation of Industries,” World Economic Forum, 2016.
3. “Annual Energy Outlook,” U.S. Energy Information Administration, 2016.
4. “Roadmap for a Renewable Energy Future,” International Renewable Energy Agency, 2016.
5. “Today in Energy,” U.S. Energy Information Administration, 2016.
6. “Annual Energy Outlook,” U.S. Energy Information Administration, 2016.
7. “Statistical Review of World Energy,” BP, 2014.
8. “Global Energy Trends,” Enerdata, 2016.
9. “International Energy Outlook,” U.S. Energy Information Administration, 2016.
10. “What future in Europe for ‘vilified’ coal and gas power plants?” PowerEngineering International, 2016.
11. “Wind in Power,” European Wind Energy Association, 2016.
12. “China Delivers Global Record Wind and Solar Installs While National Coal Consumption Drops,” Institute for Energy Economics and Financial Analysis, 2016.
13. “Statistical Communiqué of the People’s Republic of China on the 2015 National Economic and Social Development,” National Bureau of Statistics of China, 2016.
14. “On Promoting the Orderly Development of China’s Coal,” Chinese Government National Development and Reform Commission and the National Energy Administration, 2016.
15. “Coal Markets in Motion,” Brookings Institution, 2015.
16. “Executive Summary of Power Sector”, Central Electricity Authority, Ministry of Power, Government of India, New Delhi. March 2016.
17. “International Energy Outlook,” U.S. Energy Information Administration, 2016.
18. “International Energy Outlook,” U.S. Energy Information Administration, 2016.
19. “FY2013 Annual Report on Energy (Energy White Paper 2014),” Japan’s Ministry of Economy, Trade, and Industry, 2014.
20. “Electricity Generated and Purchased Bulletin,” Federation of Electric Power Companies of Japan, 2015.
21. “Japan’s Energy Transformation 2016, Japan Briefing,” Institute for Energy Economics and Financial Analysis, 2016.
22. “International Energy Outlook,” U.S. Energy Information Administration, 2016.
23. “South East Asia Coal Demand and Imports Presentation,” SCG Consulting, U.S. Energy Information Administration Conference, 2016.
24. “South East Asia Coal Demand and Imports Presentation,” SCG Consulting, U.S. Energy Information Administration Conference, 2016.
25. “Hot Growth Markets in the Spotlight,” EY, 2016.
26. “National Energy Forecasting Report,” Australian Energy Market Operator (AEMO) 2016.
27. “National Energy Forecasting Report,” Australian Energy Market Operator (AEMO) 2016.
28. “National Energy Forecasting Report,” Australian Energy Market Operator (AEMO) 2016.
29. “State of the Energy Market,” Australian Energy Regulator, 2016.
30. “International Energy Outlook,” U.S. Energy Information Administration, 2016.
31. “International Energy Outlook,” U.S. Energy Information Administration, 2016.
32. “State of Renewable Energy in South Africa,” South Africa Department of Energy, 2015.
33. “Power Plant Cycling Costs,” National Renewable Energy Laboratory, 2012.
34. Estimates based on the EPA Greenhouse Gas Equivalents Calculator.
35. Estimate based on the global average for vehicle emissions.

For information on GE Power Digital Solutions: www.ge.com/digital/power-utility
For information on Predix: www.predix.com
Tel: 1-855-your1GE Email: [email protected]
Copyright © 2017 General Electric
All rights reserved. No parts of this publication may be reproduced or transmitted in any form or by any means, electronical or mechanical, including photocopy, recording, or any information storage and retrieval system, without prior permission in writing from GE.