
Fusion of Unmanned Aerial Vehicle Range and Vision · PDF fileFusion of Unmanned Aerial...
18
Fusion of Unmanned Aerial Vehicle Range and Vision Sensors Using Fuzzy Logic and Particles Gregory L. Sinsley * , Lyle N. Long † , Brian R. Geiger ‡ , Joseph F. Horn § , and Albert F. Niessner ¶ The Pennsylvania State University, University Park, PA 16802. This paper presents a novel method for fusing data from a UAV’s range and vision sensors. The range sensor is used to build an elevation map of the flying area. Fuzzy logic is used to detect red barrels in camera images. The world location of a target on the ground is found by fusing the terrain map with image data using both an extended Kalman filter and a particle filter. The target detection system has been tested using images collected onboard a UAV. The terrain mapping system and the fusion system were both tested in simulation. Nomenclature (o x ,o y ) Pixel location of image center (x im ,y im ) Point in pixel coordinates M int Camera intrinsic parameter matrix R Rotation matrix f (·) State equation f Camera focal length h(·) Measurement equation H Jacobian matrix h terrain Terrain elevation h uav UAV altitude K Kalman gain M Jacobian matrix N Number of particles p(·) Probability density P Covariance matrix R Covariance matrix r Range s x Size of a pixel in the horizontal direction s y Size of a pixel in the vertical direction u Process noise v Measurement noise w Weight x State Y Set of measurements y Measurement z Vertical component of position * Graduate Research Assistant, Electrical Engineering, AIAA Student Member. † Distinguished Professor, Aerospace Engineering, AIAA Fellow. ‡ Graduate Research Assistant, Aerospace Engineering, AIAA Student Member. § Associate Professor, Aerospace Engineering, AIAA Associate Fellow. ¶ Senior Research Associate, Emeritus, Applied Research Laboratory. 1 of 18 American Institute of Aeronautics and Astronautics
Transcript of Fusion of Unmanned Aerial Vehicle Range and Vision · PDF fileFusion of Unmanned Aerial...

Fusion of Unmanned Aerial Vehicle Range and Vision
Sensors Using Fuzzy Logic and Particles
Gregory L. Sinsley∗, Lyle N. Long†, Brian R. Geiger‡,
Joseph F. Horn§, and Albert F. Niessner¶
The Pennsylvania State University, University Park, PA 16802.
This paper presents a novel method for fusing data from a UAV’s range and vision
sensors. The range sensor is used to build an elevation map of the flying area. Fuzzy logic
is used to detect red barrels in camera images. The world location of a target on the ground
is found by fusing the terrain map with image data using both an extended Kalman filter
and a particle filter. The target detection system has been tested using images collected
onboard a UAV. The terrain mapping system and the fusion system were both tested in
simulation.
Nomenclature
(ox, oy) Pixel location of image center(xim, yim) Point in pixel coordinatesMint Camera intrinsic parameter matrixR Rotation matrixf(·) State equationf Camera focal lengthh(·) Measurement equationH Jacobian matrixhterrain Terrain elevationhuav UAV altitudeK Kalman gainM Jacobian matrixN Number of particlesp(·) Probability densityP Covariance matrixR Covariance matrixr Rangesx Size of a pixel in the horizontal directionsy Size of a pixel in the vertical directionu Process noisev Measurement noisew Weightx StateY Set of measurementsy Measurementz Vertical component of position
∗Graduate Research Assistant, Electrical Engineering, AIAA Student Member.†Distinguished Professor, Aerospace Engineering, AIAA Fellow.‡Graduate Research Assistant, Aerospace Engineering, AIAA Student Member.§Associate Professor, Aerospace Engineering, AIAA Associate Fellow.¶Senior Research Associate, Emeritus, Applied Research Laboratory.
1 of 18
American Institute of Aeronautics and Astronautics
lnl
Text Box
Presented at the AIAA InfoTech@Aerospace Conference AIAA Paper No. 2009-2008 Seattle, WA, April, 2009

Subscripts
ABC Aircraft-body coordinatesk Time indexNED North-east-down coordinates
Symbols
θ Zenith bearingη Normalizing constantµ Meanφ Azimuth bearingφr UAV rollψy UAV yawΣ Covariance matrixσ2 Varianceθp UAV pitch
Superscripts
n Particle index
I. Introduction
In order to increase the autonomy level of unmanned aerial vehicles (UAVs) it is critical to effectivelyutilize sensor data to create an accurate model of the vehicle’s environment. Without such a model, a UAVwill not have the data it needs in order to make intelligent decisions. Therefore, this work will focus onutilizing data from a range sensor and visual camera to identify and locate objects on the ground. This datamay then be used by a path planner,1, 2 or an intelligent system such as the Penn State University AppliedResearch Lab Intelligent Controller,3, 4 SOAR,5 or many others.6
A range sensor is used in order to build a map of the terrain that the UAV flies over. There are manypossible uses for such a map. It could be used for finding a suitable landing area, ground vehicle pathplanning, or for topography. In this paper we use the terrain map primarily to aid in the geolocation ofground targets. A single image from a camera is a bearings-only measurement, so it can not uniquely locatea target. To uniquely locate a target requires a stereo camera, multiple images from a moving camera, orfusion with an additional sensor. In this paper, the third approach is used, although multiple images arealso used to improve upon the location.
In order to have a good environment map, it is vital to know the locations of important objects. Inthis paper a camera is used to locate a set of red barrels which line the edge of the flying field runway.The red barrels were chosen because they can very easily be identified from the air. They are also a usefulthing to identify because knowing where the red barrels are located will help the UAV find the runway. Thered barrels are found by using a technique based on fuzzy logic known as a Continuous Inference Network(CINet).7 A CINet is a network of fuzzy “and” and “or” nodes that determine a confidence that a certainproperty exists.
Oftentimes, a target will be visible in more than one image frame. If this is the case, it is possible toimprove upon the original position estimate by including the information from subsequent measurements.The most popular method for doing so is the Kalman filter, and its nonlinear variation, the extendedKalman filter (EKF).8 The Kalman filter is optimal for linear systems with Gaussian noise. The extendedKalman filter is suboptimal for nonlinear systems with non-Gaussian noise, but in practice works well if thenonlinearities are minor, and the noise is approximately Gaussian. A more recent approach is the particlefilter.9 Particle filters make no assumptions about the structure of a system or its noise characteristics.Instead of maintaining a state estimate as a mean and covariance like the Kalman filter does, a particle filterapproximates the state and its probability distribution as a collection of particles.
II. Related Work
There have been several studies on terrain mapping that are related to Unmanned Vehicles. One appli-cation uses light detection and ranging (LIDAR) to detect a hazard-free landing area for a Mars lander.10
In the reference, a scanning LIDAR sensor is used to generate a grid of elevation values. The grid is then
2 of 18
American Institute of Aeronautics and Astronautics

analyzed to find rough areas that constitute hazards that should be avoided. Another interesting approachis found in Leal et al.11 In this approach a 3D surface is represented as a distribution of particles. Thisapproach appears to be very accurate and flexible, the biggest problem seems to be the computational de-mands. They have tested it in simulation and on a ground vehicle, but it appears it should work on an airvehicle with sufficient computational resources.
The use of color filtering to identify large red balls is discussed in Ross et al.2 In the reference an image isconverted to the Hue-Saturation-Value (HSV) color space. The image is then filtered in order to find pixelsthat have a hue below 30 degrees or above 315 degrees (hue wraps around the color scale) and a saturationabove 0.3 (this excludes pixels that are “washed out”). This creates a hard classification. In this paper fuzzylogic is used in a similar manner to create a fuzzy classification.
Because surveillance is a major application for UAVs, locating and tracking objects on the ground hasbeen an important area of research. Ross et al.2 describes an algorithm for finding an object on the groundusing a single camera frame when a terrain map is known. In Pachter et al.12 an algorithm is describedthat accurately locates an object on the ground as a batch linear regression process. Their algorithm alsoestimates biases in the UAV’s attitude sensors. In Monda et al.13 an algorithm is developed to track amoving target using a UAV equipped with a gimbaled camera. This paper deals with the range ambiguity incamera images by assuming that the target is always at a known constant altitude. The target was trackedusing both an extended Kalman filter and an unscented Kalman filter (a variation of the Kalman filterthat represents the mean and covariance as a deterministic group of samples called sigma points). Finally,Campbell and Wheeler14 describe a system based on an unscented Kalman filter for locating both stationaryand moving targets. For the stationary target, the target’s elevation could be assumed to be known, or itcould be estimated using bearings measurements from the camera. The moving target’s altitude was assumedto be known.
Particle filters are a relatively new addition to the nonlinear estimation field, although they are based onolder techniques from other fields.15 Despite how new they are, particle filters have already gained a greatdeal of popularity because of their flexibility, especially in dealing with systems with severe nonlinearitiesand non-Gaussian noise. A recent book by Ristic et al.9 provides a good tutorial on particle filters, anddiscusses their applications to many important tracking problems such as bearings-only tracking, range-onlytracking, and radar tracking. Particle filters have also found a variety of applications in robotics. Thrunet al.16 describe applications of particle filters for robot localization and for simultaneous localization andmapping (SLAM) in their book. Particle filters have also found applications in distributed data fusion, suchas in Ong et al.17
III. Terrain Mapping
There are several options for range sensors. The most elaborate are scanning laser range finders, such asthe ones made by SICK.18 Another solution that is suitable for UAVs is Cloud Cap Technology’s AGL laseraltimeter.19 This sensor interfaces directly with Cloud Cap’s Piccolo autopilots, and provides very accuratemeasurements of the vehicles height above ground level. The AGL laser altimeter useful range is limited to370 meters with a maximum range of 1000 meters. A third alternative and by far the cheapest is the use ofa camera and optical flow. In Marlow and Langelaan20 it is shown that given a moving camera’s velocityand angular rotation, the range to a stationary obstacle can be determined using optical flow. Optical flowmeasurements tend to be very noisy, but have the advantage of using an inexpensive sensor. This papersimulates a general sensor that provides measurements of the form
z = huav − hterrain + vz (1)
where z is the measurement, huav is the height of the UAV, hterrain is the height of the terrain directlybelow the UAV, and vz is zero mean Gaussian noise, with variance σ2
z .In order to build the terrain map, the flying area is first divided into a grid. The finer the grid is, the
more accurate the map will be, but at the expense of additional memory and processing requirements. Inthis paper, the grid is fixed at 10 meters by 10 meters. Each grid cell is initialized with a mean height µh
and a height standard deviation σh. If some information about the terrain is known in advance, it shouldbe reflected in these values. Otherwise, the mean should be given a reasonable value (for the flying area inthis paper all grid cells are set to 390 meters above sea level), and the standard deviation should be given alarge value (in this case 25 m).
3 of 18
American Institute of Aeronautics and Astronautics

Because the system is linear, and has no process noise or dynamics, it can be updated by a simplerecursive least squares algorithm.8 The fact that each grid cell is one dimensional (i.e. terrain height is theonly relevant variable) makes the estimation problem even more simple. Each time a new estimate comesin, the grid is updated using the following algorithm:
1. Use range sensor to obtain an altitude measurement z = huav − hterrain + vz
2. Determine which grid cell the UAV is directly over.
3. Update the mean and variance of the grid cell using the recursive least squares estimator:
K =σ2
h
σ2h + σ2
z
(2)
µh = µh +K[(huav − z) − µh] (3)
σ2h = (1 −K)σ2
h (4)
IV. Target Identification
The red barrels which line the flying area are detected using a CINet. The CINet for determining if acolored blob in an image is a red barrel is shown in Figure 1. One advantage of fuzzy logic is that it utilizesnatural language statements. For instance, the barrel CINet can be read from right to left as follows, “anobject is a barrel if it is high or low hue, high saturation, and the size of a barrel”.
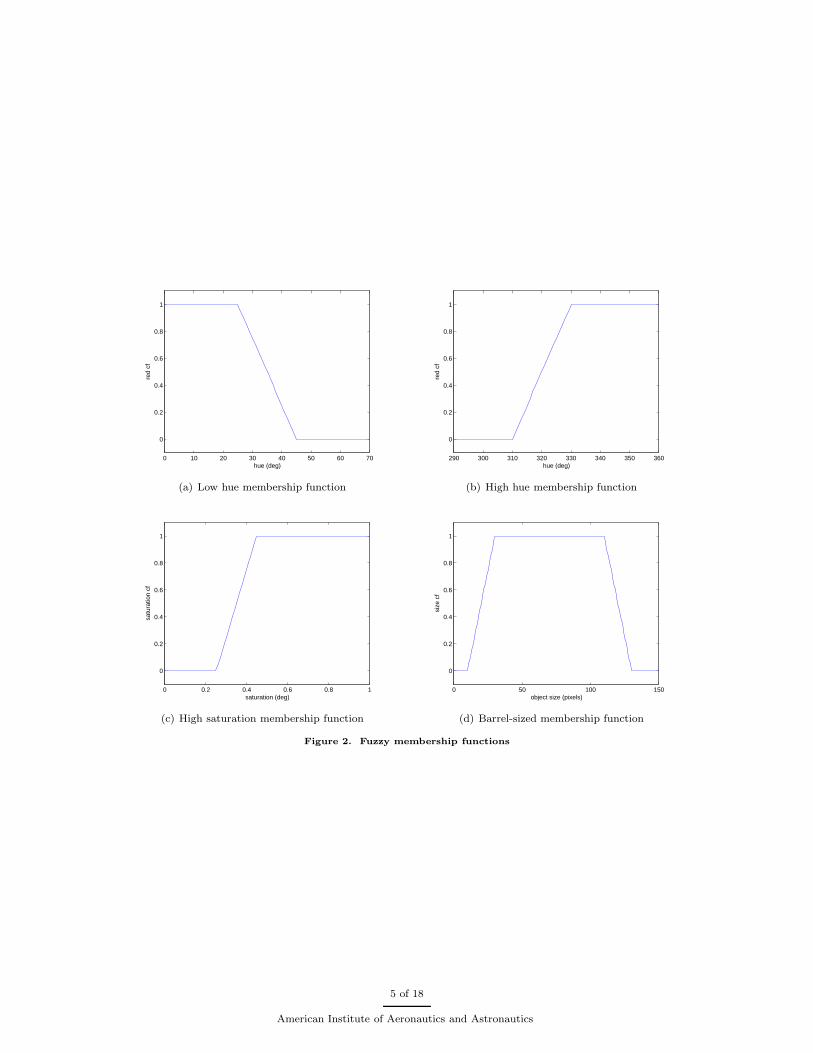
The first layer of the CINet is a “fuzzification” step that translates pixel values in the image into fuzzyconfidence levels. For instance, in order to translate the hue of a pixel into a red confidence level the hueis passed through the trapezoidal membership functions shown in Figures 2(a) and 2(b). The trapezoidalmembership function classifies hue values below 25 degrees as “definitely low” (confidence of 1), hue valuesbetween 25 degrees and 45 degrees as “possibly low”, and hue values above 45 degrees as “definitely not low”(confidence of 0). Figure 2(c) shows a similar membership function for saturation. For determining if a blobis an appropriate size, the number of pixels in a colored blob is counted and passed through the membershipfunction shown in Figure 2(d).
The second and third layers of the CINet represent fuzzy logic functions. Stover et al.7 describes elaboratefuzzy “and” and “or” functions with weights. In this paper, much simpler membership functions are used.A min is used for “and”, and a max is used for “or”. These simple functions were found to work fine foridentifying the red barrels.
Hue
Saturation
Size
Low
High
OR
High
Barrel
Sized
AND Barrel confidence
Figure 1. CINet for identifying a red barrel
4 of 18
American Institute of Aeronautics and Astronautics
0 10 20 30 40 50 60 70
0
0.2
0.4
0.6
0.8
1
hue (deg)
red
cf
(a) Low hue membership function
290 300 310 320 330 340 350 360
0
0.2
0.4
0.6
0.8
1
hue (deg)
red
cf
(b) High hue membership function
0 0.2 0.4 0.6 0.8 1
0
0.2
0.4
0.6
0.8
1
saturation (deg)
satu
ratio
n cf
(c) High saturation membership function
0 50 100 150
0
0.2
0.4
0.6
0.8
1
object size (pixels)
size
cf
(d) Barrel-sized membership function
Figure 2. Fuzzy membership functions
5 of 18
American Institute of Aeronautics and Astronautics
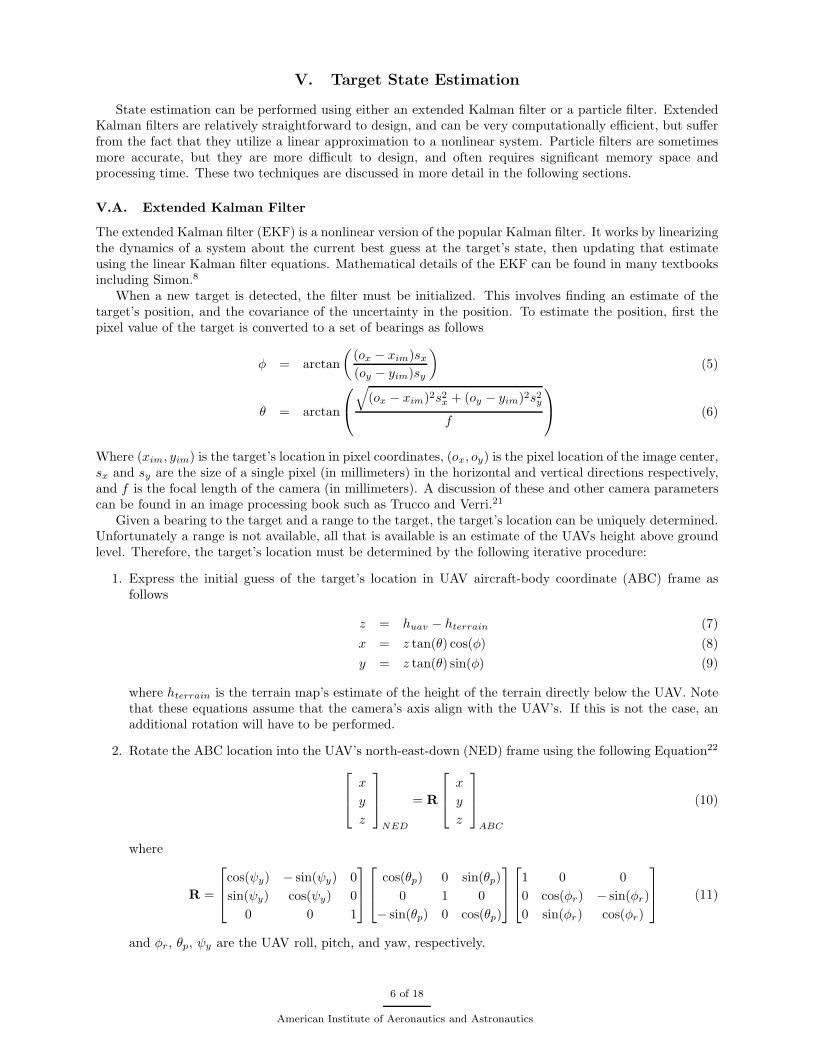
V. Target State Estimation
State estimation can be performed using either an extended Kalman filter or a particle filter. ExtendedKalman filters are relatively straightforward to design, and can be very computationally efficient, but sufferfrom the fact that they utilize a linear approximation to a nonlinear system. Particle filters are sometimesmore accurate, but they are more difficult to design, and often requires significant memory space andprocessing time. These two techniques are discussed in more detail in the following sections.
V.A. Extended Kalman Filter
The extended Kalman filter (EKF) is a nonlinear version of the popular Kalman filter. It works by linearizingthe dynamics of a system about the current best guess at the target’s state, then updating that estimateusing the linear Kalman filter equations. Mathematical details of the EKF can be found in many textbooksincluding Simon.8
When a new target is detected, the filter must be initialized. This involves finding an estimate of thetarget’s position, and the covariance of the uncertainty in the position. To estimate the position, first thepixel value of the target is converted to a set of bearings as follows
φ = arctan
(
(ox − xim)sx
(oy − yim)sy
)
(5)
θ = arctan
√
(ox − xim)2s2x + (oy − yim)2s2y
f
(6)
Where (xim, yim) is the target’s location in pixel coordinates, (ox, oy) is the pixel location of the image center,sx and sy are the size of a single pixel (in millimeters) in the horizontal and vertical directions respectively,and f is the focal length of the camera (in millimeters). A discussion of these and other camera parameterscan be found in an image processing book such as Trucco and Verri.21
Given a bearing to the target and a range to the target, the target’s location can be uniquely determined.Unfortunately a range is not available, all that is available is an estimate of the UAVs height above groundlevel. Therefore, the target’s location must be determined by the following iterative procedure:
1. Express the initial guess of the target’s location in UAV aircraft-body coordinate (ABC) frame asfollows
z = huav − hterrain (7)
x = z tan(θ) cos(φ) (8)
y = z tan(θ) sin(φ) (9)
where hterrain is the terrain map’s estimate of the height of the terrain directly below the UAV. Notethat these equations assume that the camera’s axis align with the UAV’s. If this is not the case, anadditional rotation will have to be performed.
2. Rotate the ABC location into the UAV’s north-east-down (NED) frame using the following Equation22
x
y
z
NED
= R
x
y
z
ABC
(10)
where
R =
cos(ψy) − sin(ψy) 0
sin(ψy) cos(ψy) 0
0 0 1
cos(θp) 0 sin(θp)
0 1 0
− sin(θp) 0 cos(θp)
1 0 0
0 cos(φr) − sin(φr)
0 sin(φr) cos(φr)
(11)
and φr, θp, ψy are the UAV roll, pitch, and yaw, respectively.
6 of 18
American Institute of Aeronautics and Astronautics

3. Set hterrain to the terrain map’s estimate of the height of the terrain at location (x, y)
4. Check for convergence (i.e. the new estimate of the target’s location is less than a certain distancefrom the old estimate) and either exit or return to step 1.
Once the target’s position in the UAV NED frame is found, it is translated into local coordinate frame thatis fixed at a given point on the flying field, this avoids the complexity of the target moving as the UAVmoves.
The initial uncertainty in the state estimate is somewhat difficult to estimate. There are many possiblesources of error including the UAV’s location, roll, pitch, and yaw, the uncertainty in the pixel location of thetarget, and the uncertainty in the terrain map. Even if all these errors are independent and Gaussian, theycan create correlated, non-Gaussian errors in the target location due to the nonlinearity of the measurement.Fortunately, it has been found that setting the diagonal elements of the covariance matrix to some largevalue (on the order of 100 meters squared), and the off-diagonal elements to some small value (on the orderof 10 meters squared) works just fine.
Every time a new measurement comes in, the target’s state estimate is updated using the extendedKalman filter equations. Normally, the EKF is used on a system with the following state and measurementequations
x(k) = f(x(k − 1), u(k − 1)) (12)
y(k) = h(x(k), v(k)) (13)
Where x(k) is the state at time k, y(k) is the output at time k, and w(k) and v(k) are zero-mean Gaussiannoise. Since we are only interested in a stationary target, however, the first equation can be omitted. Thisleaves us with the equation
[
φ
θ
]
= h(xtarget, xuav(k), w(k)) (14)
where dependence on the UAV’s state has been made explicit. The function h can be determined from thecamera model described in section VI.B. If the UAV is directly over the target, such that the range sensoris returning a range to target, a third measurement can be added so that
φ
θ
z
= h(xtarget, xuav(k), w(k)) (15)
From one of these two equations, we can calculate two matrices of partial derivatives
H =∂h
∂xtarget
∣
∣
∣
∣
∣
xtarget(k)
(16)
M =∂h
∂v
∣
∣
∣
∣
∣
xtarget(k)
(17)
The second matrix should account for all sources of uncertainty, but due to the difficulty of doing so, it isoften assumed that the measurement noise is additive, in which case
y = h(xtarget, xuav(k)) + w(k) (18)
M =
[
1 0
0 1
]
(19)
Also the covariance of the noise must be considered. It is assumed that v is zero mean and Gaussian andhas covariance
R = E(vvT ) (20)
7 of 18
American Institute of Aeronautics and Astronautics

Given the previous estimate of the state xk−1 and the covariance of the estimate, Pk−1, the EKF can beupdated at each time step using the following equations
Kk = Pk−1HT (HPk−1H
T +MRMT )−1 (21)
xk = xk−1 +Kk[yk − h(xk)] (22)
Pk = (I −KkH)Pk−1 (23)
V.B. Particle Filter
The particle filter serves as a general approximation to a recursive Bayes filter.8, 16 The Bayes filter seeks tocalculate p(x|Yk), the probability density of a state at time k, xk, conditioned on the measurements up totime k:
Yk = {y1, y2, ..., yk} (24)
using Bayes rule. This probability is very difficult to calculate in practice. For a linear system with Gaussiannoise, the Kalman filter calculates the probability. For other systems, some form of approximation mustbe used. The particle filter approximates this distribution as a set of particles (samples). Following theprocedure in Thrun et al. the particle filter algorithm may be stated as follows:
1. Initialize the particle filter by drawing N samples from the known probability density p(x0).
2. At each time step k, draw a sample from the state transition probability density for each particle x[n]k−1
x[n]k ∼ p(xk|uk, x
[n]k−1) (25)
3. Weight the new samples according to the latest measurement, zk
w[n]k = p(zk|x
[n]k ) (26)
4. Generate N new samples by drawing a particle at random (with replacement) with probability pro-
portionate to w[n]k
The last step in the procedure is known as the resampling or importance sampling step. The resamplingstep is important in that it ensures that the final particle distribution accurately approximates p(x|Yk).Unfortunately, the resampling step can reduce the information in the particle set. In the worst case, knownas sample impoverishment, all but one particle may be eliminated. This is especially true in systems withlow process noise, such as tracking a stationary target. In this case
p(xk|uk, x[n]k−1) = p(xk−1) (27)
so sampling x[n]k from this distribution will not induce any diversity into the sample set. The easiest way to
counteract this problem is to only resample occasionally instead of at every step. In this case, the weight ofeach particle will be updated by the following equation during steps where resampling does not take place
w[n]k = p(yk|x
[n]k )w
[n]k−1 (28)
In this paper, resampling only takes place when a target that has been in the camera’s field of view formultiple image frames finally leaves the camera’s field of view.
Another way to add more diversity to the particle set is to add a small number of the particles accordingto the measurement model instead of the motion model as follows
x[n]k ∼ p(yk|xk) (29)
8 of 18
American Institute of Aeronautics and Astronautics

It is difficult to determine what the importance weight of these new particles should be. In Thrun et al. itis suggested that the weights be determined by the integral
w[n]k =
∫
p(x[n]k |uk, xk−1)bel(xk−1)dxk−1 (30)
where bel(xk−1) is the belief calculated at the previous step. This integral can be difficult to compute, butthe authors have found that simply setting the weights of these new particles to the average of the weightsof the previously generated particles works well.
Given these mathematical preliminaries, a particle filter can be applied to tracking a stationary targetusing a terrain map and a visual camera. The first time a target is seen, it is initialized as follows:
1. Convert the camera’s pixel measurement to a bearing measurement using Equation 5.
2. Use the iterative procedure described in Section V.A to determine an initial guess of the target’sposition in the NED frame.
3. Generate N samples of the following random variables
vh ∼ N(0, σ2h) (31)
vφ ∼ N(0, σ2φ) (32)
vθ ∼ N(0, σ2θ) (33)
where σ2h is the uncertainty in the terrain map, as described in Section III and σ2
φ and σ2θ are the noise
in the bearing estimates, which is dependent on the camera and the image processing routine.
4. From the N samples of the noise variables, generate the ABC coordinates of the N particles using thefollowing equations:
z = huav − hterrain + vh (34)
φ = φ+ vφ (35)
θ = θ + vθ (36)
x = z tan(θ) cos(φ) (37)
y = z tan(θ) sin(φ) (38)
5. Transform the particle coordinates from the ABC frame to the NED frame using Equation 10, thentranslate the target location to the local frame.
6. Set the weight of each particle to
w[n] =1
N(39)
Now the that filter is initialized, it can be updated every time a new measurement comes in using thefollowing procedure:
1. Generate n new particles using the procedure described previously.
2. Set the likelihood of each of these particles to 1N
where N is the previous number of particles.
3. Update the the value of NNnew = Nold + n (40)
4. For each particle, n, determine the expected measurement
[
φ
θ
][n]
expected
= h(x[n], xuav, 0) (41)
where h is the measurement equation described in Section V.A.
9 of 18
American Institute of Aeronautics and Astronautics
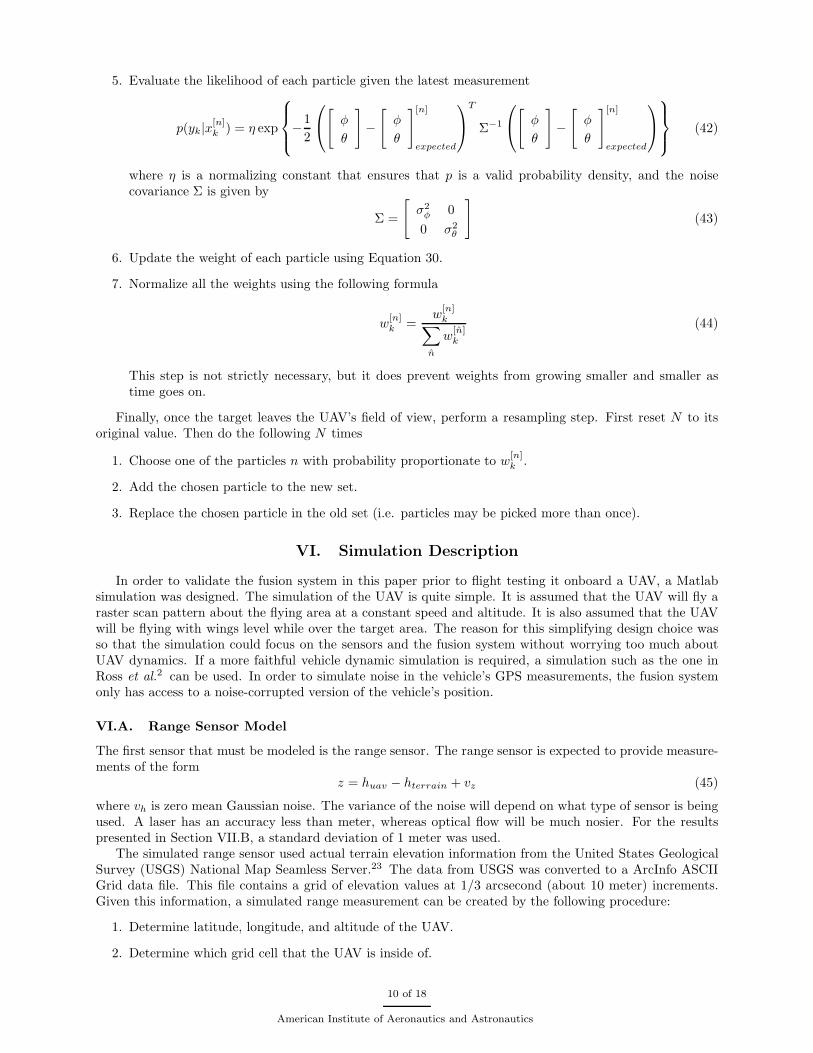
5. Evaluate the likelihood of each particle given the latest measurement
p(yk|x[n]k ) = η exp
−1
2
[
φ
θ
]
−
[
φ
θ
][n]
expected
T
Σ−1
[
φ
θ
]
−
[
φ
θ
][n]
expected
(42)
where η is a normalizing constant that ensures that p is a valid probability density, and the noisecovariance Σ is given by
Σ =
[
σ2φ 0
0 σ2θ
]
(43)
6. Update the weight of each particle using Equation 30.
7. Normalize all the weights using the following formula
w[n]k =
w[n]k
∑
n
w[n]k
(44)
This step is not strictly necessary, but it does prevent weights from growing smaller and smaller astime goes on.
Finally, once the target leaves the UAV’s field of view, perform a resampling step. First reset N to itsoriginal value. Then do the following N times
1. Choose one of the particles n with probability proportionate to w[n]k .
2. Add the chosen particle to the new set.
3. Replace the chosen particle in the old set (i.e. particles may be picked more than once).
VI. Simulation Description
In order to validate the fusion system in this paper prior to flight testing it onboard a UAV, a Matlabsimulation was designed. The simulation of the UAV is quite simple. It is assumed that the UAV will fly araster scan pattern about the flying area at a constant speed and altitude. It is also assumed that the UAVwill be flying with wings level while over the target area. The reason for this simplifying design choice wasso that the simulation could focus on the sensors and the fusion system without worrying too much aboutUAV dynamics. If a more faithful vehicle dynamic simulation is required, a simulation such as the one inRoss et al.2 can be used. In order to simulate noise in the vehicle’s GPS measurements, the fusion systemonly has access to a noise-corrupted version of the vehicle’s position.
VI.A. Range Sensor Model
The first sensor that must be modeled is the range sensor. The range sensor is expected to provide measure-ments of the form
z = huav − hterrain + vz (45)
where vh is zero mean Gaussian noise. The variance of the noise will depend on what type of sensor is beingused. A laser has an accuracy less than meter, whereas optical flow will be much nosier. For the resultspresented in Section VII.B, a standard deviation of 1 meter was used.
The simulated range sensor used actual terrain elevation information from the United States GeologicalSurvey (USGS) National Map Seamless Server.23 The data from USGS was converted to a ArcInfo ASCIIGrid data file. This file contains a grid of elevation values at 1/3 arcsecond (about 10 meter) increments.Given this information, a simulated range measurement can be created by the following procedure:
1. Determine latitude, longitude, and altitude of the UAV.
2. Determine which grid cell that the UAV is inside of.
10 of 18
American Institute of Aeronautics and Astronautics
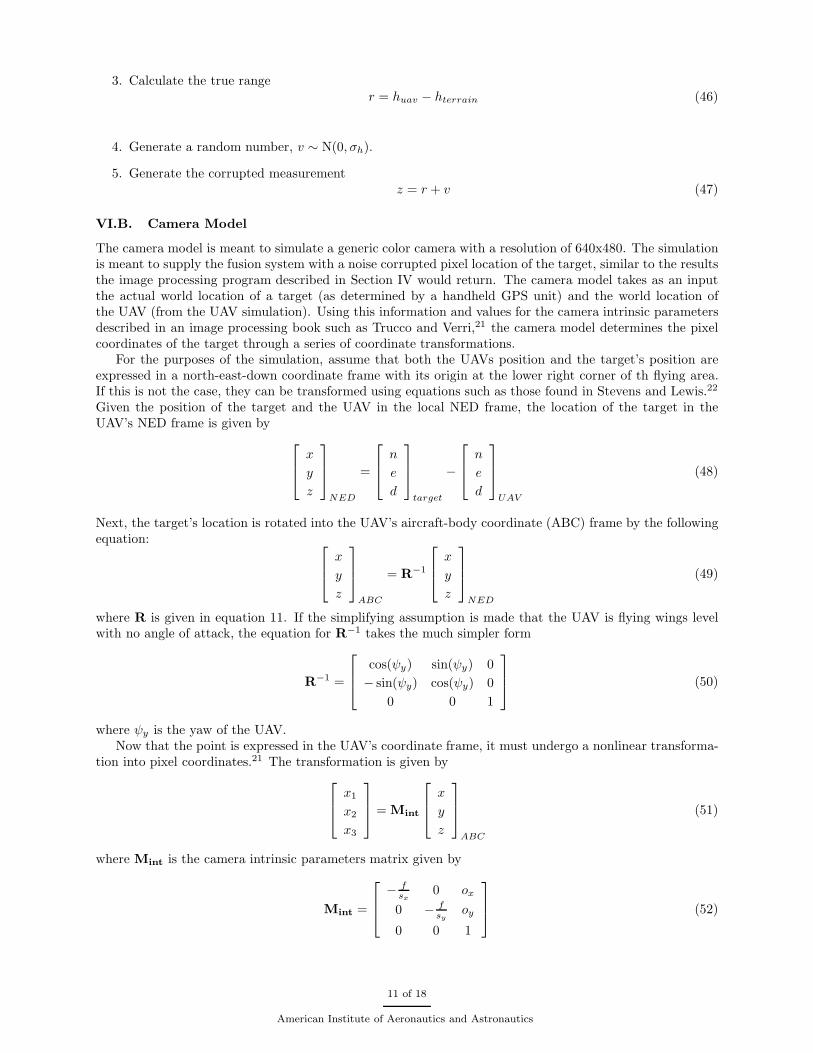
3. Calculate the true ranger = huav − hterrain (46)
4. Generate a random number, v ∼ N(0, σh).
5. Generate the corrupted measurementz = r + v (47)
VI.B. Camera Model
The camera model is meant to simulate a generic color camera with a resolution of 640x480. The simulationis meant to supply the fusion system with a noise corrupted pixel location of the target, similar to the resultsthe image processing program described in Section IV would return. The camera model takes as an inputthe actual world location of a target (as determined by a handheld GPS unit) and the world location ofthe UAV (from the UAV simulation). Using this information and values for the camera intrinsic parametersdescribed in an image processing book such as Trucco and Verri,21 the camera model determines the pixelcoordinates of the target through a series of coordinate transformations.
For the purposes of the simulation, assume that both the UAVs position and the target’s position areexpressed in a north-east-down coordinate frame with its origin at the lower right corner of th flying area.If this is not the case, they can be transformed using equations such as those found in Stevens and Lewis.22
Given the position of the target and the UAV in the local NED frame, the location of the target in theUAV’s NED frame is given by
x
y
z
NED
=
n
e
d
target
−
n
e
d
UAV
(48)
Next, the target’s location is rotated into the UAV’s aircraft-body coordinate (ABC) frame by the followingequation:
x
y
z
ABC
= R−1
x
y
z
NED
(49)
where R is given in equation 11. If the simplifying assumption is made that the UAV is flying wings levelwith no angle of attack, the equation for R−1 takes the much simpler form
R−1 =
cos(ψy) sin(ψy) 0
− sin(ψy) cos(ψy) 0
0 0 1
(50)
where ψy is the yaw of the UAV.Now that the point is expressed in the UAV’s coordinate frame, it must undergo a nonlinear transforma-
tion into pixel coordinates.21 The transformation is given by
x1
x2
x3
= Mint
x
y
z
ABC
(51)
where Mint is the camera intrinsic parameters matrix given by
Mint =
− fsx
0 ox
0 − fsy
oy
0 0 1
(52)
11 of 18
American Institute of Aeronautics and Astronautics
where (ox, oy) is the pixel location of the image center, sx and sy are the size of a single pixel (in millimeters)in the horizontal and vertical directions respectively, and f is the focal length of the camera (in millimeters).The pixel coordinates of the image point are then given by
xim =x1
x3(53)
yim =x2
x3(54)
Finally, to simulate inaccuracy in the pixel coordinates, zero mean Gaussian noise is added to xim and yim.
VII. Results
VII.A. Target Identification
The target identification subroutine was tested using flight data collected onboard a UAV equipped with awebcam. The UAV platform is based upon a modified SIG Kadet Senior model aircraft (Figure 3). Thewebcam used is a Logitech QuickCam with a resolution of 640x480. More information on the UAV platformcan be found in Sinsley et al.3, 4
An example image from the webcam is shown in Figure 4(a). Figure 4(b) shows the results of passingthis image through the membership functions “low hue or high hue”, i.e. it finds all pixels with a red hue.White pixels are definitely red, black pixels are definitely not red, and gray pixels are in between. Note thata number of pixels that don’t appear to be red in the original image, are nonetheless marked as red. This isdue to poor lighting. The saturation function takes care of this; Figure 4(c) shows the same image passedthrough the saturation membership function, now all the “washed out” pixels are excluded. Figure 4(d)shows the results of passing the two images through a fuzzy and. Notice that this image looks a lot like thesaturation image. This is because for most pixels the saturation confidence is lower than the hue confidence.Since a fuzzy “and” is a minimum, the lower value dominates. If this had been a well lit image with a lotof colors, hue would have dominated the calculation instead. Finally, Figure 4(e) shows the final processedimage with the three red barrels circled.
The accuracy of the barrel detection routine was fairly good for such a simple routine. In a sequence of105 images, with an average of 2 barrels per image, there were about 10 false alarms and 10 missed detections.The missed detections are not a very serious concern since most barrels appear in multiple images, and areusually detected in at least one of those images. The false alarms are a greater concern because they canstart false tracks (i.e. start to track the location of an object that does not exist) or they can incorrectlyupdate an existing track. The best way to deal with this is to check the fuzzy confidence of a detection todetermine whether or not to accept it.
The biggest problem with the barrel detection routine is its speed. Using Matlab on a computer with a1.8 GHz processor, the routine took an average of 2 seconds to process a single image. Probably the biggestreason for this slow speed was the use of Matlab. In Ross et al.2 a similar routine running in c++ usingIntel’s OpenCV computer vision library24 achieved real time performance. The use of fuzzy logic is alsomost likely slower than the hard thresholding method used in the reference.
VII.B. Terrain Mapping
The terrain mapping function has so far been tested in simulation as described in Section VI.A. To evaluatethe performance of the terrain mapping, the UAV flew a raster scan flight pattern about the flying area andrecorded range measurements 10 times a second. The generated map after one complete flight pattern wasthen compared to terrain data given in the USGS Seamless Data Distribution System.23
Figure 5(a) shows the map generated by the terrain mapping system. Figure 5(b) shows the map as foundin the USGS database. The units of both figures are meters from the reference origin. Qualitatively the twomaps are similar, but the estimated one is much rougher. To quantify the performance of the mapping bothmaps were divided into 10 m grids, and the difference in height between the two maps for each grid pointwas calculated. The mean square error was found to be 0.54 meters squared. This is sufficient accuracyfor most tasks. In terms of efficiency, a single update takes an average of 0.006 seconds in Matlab, with aworst-case update time of 0.045 seconds. Therefore, update frequency will be more a function of the sensorupdate time than the computing time.
12 of 18
American Institute of Aeronautics and Astronautics

Figure 3. SIG Kadet Senior UAV
VII.C. Target State Estimation
The target state estimation routine was tested using the simulation described in Section VI.B. Both theextended Kalman filter and the particle filter were tested by taking measurements 10 times a second as theUAV made a single pass over the target. At the end of the pass, the position estimate was compared to theactual position to determine the accuracy of the method.
Figure 6 shows a time history of the EKF for a single pass over the target. The solid lines show the x(north), y (east), and z (height) errors of the estimation. The dash-dot lines represent one standard deviationfrom the mean (as represented in the diagonal elements of the state covariance matrix). Notice that all threeerrors approach zero as the number of measurements increase, as is expected. Unfortunately, many of theerrors are more than one standard deviation from the mean. This is most likely due to the non-linear natureof the system.
Figure 7(a) shows the initial particle distribution for the particle filter. The x represents the actual barrellocation, the dots are particle locations, and the circle represents the weighted (by likelihood) average ofthe particle locations. The units are in degrees latitude and longitude. Figures 7(b) through 8(b) shows thetime history of the particle distributions at one second increments. Notice that as time goes on the averagegets closer and closer to the actual location until the circle is right on top of the x. Figure 8(c) shows thefinal particle distribution after a re-sampling step takes place. Note that the distribution collapses into justa few particles. This is a common problem with particle filters, known as sample impoverishment.8 This canbe a problem for tracking a maneuvering target because the sample set lacks the diversity to account for amaneuver. It is not such a big problem in this case since the target is stationary.
Table 1 shows a comparison of the performance of the two filters. The mean values are the average over100 runs. The run times are for Matlab running on a 1.4 GHz processor. As is expected, the EKF is muchfaster than the particle filter (although the particle filter would still be suitable for real-time implementationif it was coded in c++ as opposed to Matlab). Also the particle filter is slightly more accurate than the EKF.For this simple system it appears the EKF is a better choice due to its efficiency. In a more complicatedsystem, however the particle filter may yield better accuracy.
Table 1. Comparison of the two filters
Mean Runtime (seconds) Mean Error (meters)
EKF 6.3 × 10⁻⁴ 1.1
Particle Filter 0.17 0.78
13 of 18
American Institute of Aeronautics and Astronautics

(a) Original image
(b) Image passed through hue membership functions (c) Image passed through saturation membership functions
(d) Image passed through hue and saturation membershipfunctions
(e) Image with red barrels identified
Figure 4. Image processing results
14 of 18
American Institute of Aeronautics and Astronautics

0102030405060
0
10
20
30
380
385
390
395
400
405
(a) Estimated terrain map
0102030405060
0
10
20
30
380
385
390
395
400
405
(b) Actual terrain map
Figure 5. Comparison of the two terrain maps (units are meters relative to the reference origin
0 0.5 1 1.5 2 2.5 3 3.5 4 4.5−10
0
10
time (s)
x er
ror
(m)
0 0.5 1 1.5 2 2.5 3 3.5 4 4.5−20
0
20
time (s)
y er
ror
(m)
0 0.5 1 1.5 2 2.5 3 3.5 4 4.5−10
0
10
time (s)
z er
ror
(m)
Figure 6. Time history of EKF errors
15 of 18
American Institute of Aeronautics and Astronautics

−77.6594 −77.6593 −77.6592 −77.6591 −77.659 −77.6589 −77.658840.8099
40.81
40.81
40.81
40.8101
40.8102
40.8102
40.8102
40.8103
(a) Initial particle distribution
−77.6594 −77.6593 −77.6592 −77.6591 −77.659 −77.6589 −77.658840.8099
40.81
40.81
40.81
40.8101
40.8102
40.8102
40.8102
40.8103
(b) Particle distribution after 1 second
−77.6594 −77.6593 −77.6592 −77.6591 −77.659 −77.6589 −77.658840.8099
40.81
40.81
40.81
40.8101
40.8102
40.8102
40.8102
40.8103
(c) Particle distribution after 2 seconds
−77.6594 −77.6593 −77.6592 −77.6591 −77.659 −77.6589 −77.658840.8099
40.81
40.81
40.81
40.8101
40.8102
40.8102
40.8102
40.8103
(d) Particle distribution after 3 seconds
Figure 7. Time history of particle distribution (units are degrees latitude and longitude)
16 of 18
American Institute of Aeronautics and Astronautics

−77.6594 −77.6593 −77.6592 −77.6591 −77.659 −77.6589 −77.658840.8099
40.81
40.81
40.81
40.8101
40.8102
40.8102
40.8102
40.8103
(a) Particle distribution after 4 seconds
−77.6594 −77.6593 −77.6592 −77.6591 −77.659 −77.6589 −77.658840.8099
40.81
40.81
40.81
40.8101
40.8102
40.8102
40.8102
40.8103
(b) Particle distribution after 5 seconds
−77.6594 −77.6593 −77.6592 −77.6591 −77.659 −77.6589 −77.658840.8099
40.81
40.81
40.81
40.8101
40.8102
40.8102
40.8102
40.8103
(c) Final particle distribution after re-sampling
Figure 8. Time history of particle distribution (continued)
17 of 18
American Institute of Aeronautics and Astronautics

VIII. Conclusions
This paper has presented a novel method for fusing data from a range sensor and a camera in order toaccurately locate items on the ground. Using fuzzy logic, red barrels have been detected from a sequenceof aerial images with both the false alarm rate and the missed detection rate under five percent. Usingsimulated range data, a terrain map with a mean square error of less than a meter has been generated. Theterrain map has been fused with camera data using both an extended Kalman filter (EKF) and a particlefilter. Over 100 runs the mean error of the EKF was 1.1 meters and the particle filter was 0.78 meters.
Acknowledgment
This work was supported by the Intelligent Systems Lab at the Penn State Applied Research Laboratory(ARL/PSU) and by the ARL/PSU Exploratory and Foundational (E&F) Research Program.
References
1Geiger, B. R., Horn, J. F., Sinsley, G. L., Ross, J. A., Long, L. N., and Niessner, A. F., “Flight Testing a Real TimeImplementation of a UAV Path Planner Using Direct Collocation,” Journal of Guidance, Control, and Dynamics, Vol. 31,No. 6, Nov/Dec 2008.
2Ross, J. A., Geiger, B. R., Sinsley, G. L., Horn, J. F., Long, L. N., and Niessner, A. F., “Vision-Based Target Geolocationand Optimal Surveillance on an Unmanned Aerial Vehicle,” AIAA Guidance, Navigation, and Control Conference, Honolulu,HI, August 2008.
3Sinsley, G. L., Miller, J. A., Long, L. N., Geiger, B. R., Niessner, A. F., and Horn, J. F., “An Intelligent Controller forCollaborative Unmanned Air Vehicles,” IEEE Symposium Series in Computational Intelligence, Honolulu, Hawaii, April 2007.
4Sinsley, G. L., Long, L. N., Niessner, A. F., and Horn, J. F., “Intelligent Systems Software for Unmanned Air Vehicles,”46th AIAA Aerospace Sciences Meeting, Reno, NV, Jan 2008.
5Hanford, S. D., Janrathitikarn, O., and Long, L. N., “Control of Mobile Robots Using the Soar Cognitive Architecture,”Journal of Aerospace Computing, Information, and Communication, Vol. 6, No. 2, 2009.
6Long, L. N., Hanford, S. D., Janrathitikarn, O., Sinsley, G. L., and Miller, J. A., “A Review of Intelligent SystemsSoftware for Autonomous Vehicles,” IEEE Computational Intelligence for Security and Defense Applications Conference,Honolulu, Hawaii, 2007.
7Stover, J. A., Hall, D. L., and Gibson, R. E., “A Fuzzy-Logic Architecture for Autonomous Multisensor Data Fusion,”IEEE Trans. Ind. Electron., Vol. 43, 1996, pp. 403–410.
8Simon, D., Optimal State Estimation, John Wiley and Sons, 2006.9Ristic, B., Arulampalam, S., and Gordon, N., Beyond the Kalman Filter: Particle Filters for Tracking Applications,
Artech House, 2004.10Johnson, A. E., Klumpp, A. R., Collier, J. B., and Wolf, A. A., “Lidar-Based Hazard Avoidance for Safe Landing on
Mars,” Journal of Guidance, Control, and Dynamics, Vol. 25, No. 6, November-December 2002.11Leal, J., Scheding, S., and Dissanayake, G., “Stochastic Simulation in Surface Reconstruction and Application to 3D
Mapping,” IEEE International Conference on Robotics and Automation, Washington, D.C., May 2002.12Pachter, M., Ceccarelli, N., and Chandler, P. R., “Vision-Based Target Geo-Location Using Feature Tracking,” AIAA
Guidance, Navigation and Control Conference and Exhibit , No. AIAA 2007-6863, Hilton Head, South Carolina, August 2007.13Monda, M. J., Woolsey, C. A., and Reddy, C. K., “Ground Target Localization and Tracking in a Riverine Environment
from a UAV with a Gimbaled Camera,” AIAA Guidance, Navigation and Control Conference and Exhibit , No. AIAA 2007-6747,Hilton Head, South Carolina, August 2007.
14Campbell, M. E. and Wheeler, M., “A Vision Based Geolocation Tracking System for UAV’s,” AIAA Guidance, Navi-
gation, and Control Conference and Exhibit , No. AIAA 2006-6246, Keystone, Colorado, August 2006.15Iba, Y., “Population Monte Carlo Algorithms,” Transactions of the Japanese Society for Artificial Intelligence, Vol. 16,
No. 2, 2001, pp. 279–286.16Thrun, S., Burgard, W., and Fox, D., Probabilistic Robotics, The MIT Press, Cambridge, Massachusetts, 2006.17Ong, L., Upcroft, B., Ridley, M., Bailey, T., Sukkarieh, S., and Durrant-Whyte, H., “Decentralized Data Fusion with
Particles,” Australian Conference on Robotics and Automation, 2005.18“SICK laser range sensors,” http://www.sick.com/group/EN/home/Pages/Homepage1.aspx.19“AGL Laser Altimeter,” http://www.cloudcaptech.com/piccolo accessories laser altimeter.shtm.20Marlow, S. Q. and Langelaan, J. W., “Local Terrain Mapping for Obstacle Avoidance using Monocular Vision,” AHS
Unmanned Vehicles Specialist’s Forum, 2009.21Trucco, E. and Verri, A., Introductory Techniques for 3-D Computer Vision, Prentice Hall, Upper Saddle River, NJ,
1998.22Stevens, B. L. and Lewis, F. L., Aircraft Control and Simulation, John Wiley and Sons, 1992.23“USGS Seamless GIS Data,” http://seamless.usgs.gov, Last accessed on August 3, 2008.24“OpenCV 1.0,” Available at: http://www.intel.com/technology/computing/opencv, Last accessed on August 3, 2008.
18 of 18
American Institute of Aeronautics and Astronautics