FUSED SILICA DURING TRIGA REACTOR - NASA€¦ · NASA CR- 1031 TECH LIBRARY KAFB, NY ' 0060405...
68
NASA CONTRACTOR REPORT OPTICAL ABSORPTION IN FUSED SILICA DURING TRIGA REACTOR PULSE IRRADIATION by R. Gagosx, J. Waters, F, C. Doughs, ,. und M. A. DeCrescente Prepared by UNITED AIRCRAFT CORPORATION East Hartford, Conn. for . ., NATIONAL AERONAUTICS AND SPACE ADMINISTRATION WASHINGTON., D. C. ., APRIL, 1968 https://ntrs.nasa.gov/search.jsp?R=19680011655 2020-06-01T17:11:47+00:00Z
Transcript of FUSED SILICA DURING TRIGA REACTOR - NASA€¦ · NASA CR- 1031 TECH LIBRARY KAFB, NY ' 0060405...

N A S A C O N T R A C T O R
R E P O R T
OPTICAL ABSORPTION I N FUSED SILICA DURING TRIGA REACTOR PULSE IRRADIATION
by R. Gagosx, J. Waters, F, C. Doughs, ,. und M . A. DeCrescente
Prepared by UNITED AIRCRAFT CORPORATION East Hartford, Conn. for .
.,
N A T I O N A L A E R O N A U T I C S A N D S P A C E A D M I N I S T R A T I O N W A S H I N G T O N . , D. C. ., A P R I L , 1968
https://ntrs.nasa.gov/search.jsp?R=19680011655 2020-06-01T17:11:47+00:00Z

NASA CR- 1031 TECH LIBRARY KAFB, NY
' 0060405
OPTICAL ABSORPTION IN FUSED SILICA
DURING TRIGA REACTOR PULSE IRRADIATION
By R. Gagosz, J. Waters, F. C. Douglas, and M. A. DeCrescente
Distribution of this report is provided in the interest of information exchange. Responsibility for the contents resides in the author or organization that prepared it.
Issued by Originator as Report No. F-910485-1
Prepared under Contract No. NASw-847 by IDJPTED AIRCRAFT CORPORATION
East Hartford, Conn.
for
NATIONAL AERONAUTICS AND SPACE ADMINISTRATION
For sale by the Clearinghouse for Federal Scientific and Technicol Information Springfield, Virginia 22151 - CFSTI price $3.00


Optical Absorption i n Fused S i l i c a during TRIGA Reactor Pulse Irradiation
TABLE OF CONTENTS
Page ~
SUMMARY . . . . . . . . . . . . . . . . . . . . . . . . . . . . . . . . . . . . . 1
RESULTS . . . . . . . . . . . . . . . . . . . . . . . . . . . . . . . . . . . 2
INTRODUCTION . . . . . . . . . . . . . . . . . . . . . . . . . . . . . . . . . 3
DESCRIPTION OF EQUIPMENT . . . . . . . . . . . . . . . . . . . . . . . . . . . 4
System Configuration . . . . . . . . . . . . . . . . . . . . . . . . . . 4 Furnace Design . . . . . . . . . . . . . . . . . . . . . . . . . . . . . 5 Specimen Configuration . . . . . . . . . . . . . . . . . . . . . . . . . 5
EXPERlMENTAL PROGRAM . . . . . . . . . . . . . . . . . . . . . . . . . . . . . 7
Tes tprocedure . . . . . . . . . . . . . . . . . . . . . . . . . . . . . 7 Factors Affecting Transmission Data . . . . . . . . . . . . . . . . . . . 8 Ambient Temperature Studies a t 0.215 Microns . . . . . . . . . . . . . . 9 Elevated Temperature Studies a t 0.215 Microns . . . . . . . . . . . . . . 10 Studies a t Visible and Near-Infrared Wavelengths . . . . . . . . . . . . 13
REFERENCES . . . . . . . . . . . . . . . . . . . . . . . . . . . . . . . . . . 1 5
LIST OF SYMBOLS . . . . . . . . . . . . . . . . . . . . . . . . . . . . . . . 16
TAELES . . . . . . . . . . . . . . . . . . . . . . . . . . . . . . . . . . . . 17
FIGURES . . . . . . . . . . . . . . . . . . . . . . . . . . . . . . . . . . . 19
iii
...

Optical Absorpt ion in Fused S i l i c a
during TRIGA Reactor FUlse I r r ad ia t ion
SUMMARY
An experimental investigation was conducted t o determine the spectral t rans- mission character is t ics of fused s i l ica before , dur ing and after exposure t o r e a c t o r i r r ad ia t ion pu l se s . The transmission measurements were carr ied out at th ree wave- lengths (0.215, 0.625 and 1 .0 microns) and at a range of temperatures from ambient t o 900°C. Corning 7940 f u s e d s i l i c a specimens i n a corner cube configuration were mounted next to the reac tor core face of the Universi ty of I l l i n o i s ' TRIGA Mark I1 reac tor . Peak neutron and gamma fluxes obtained from t h i s r e a c t o r were approxi- mately 5.4 x 10¹⁵ n/cm2-sec and 6.1 x lo7 R/sec, respect ively. Neutron and gamma doses associated with these pulses were 2.3 x n/cm2 and 2.6 x 10 6 R, respec- t i v e l y . The effect ive t ime of the pulse obtained by d iv id ing t he t o t a l dose by the peak flux was approximately 0.043 sec. The transmission measurements were made immediately before, during and after the reactor pulses to monitor both the cre- a t ion of i r r a d i a t i o n induced absorption and the decay of the induced absorption a f te r the pu lse .
1

RESULTS
1. Ambient -temperature pulse irradiation studies at wavelengths of 1.0 t o 1.1 microns i n the infrared indica te no induced absorption i n t h e specimen.
2. Pu l se i r r ad ia t ion s tud ie s a t a wavelength of 0.625 microns i n t h e v i s i b l e ind ica te that :
a ) less than 0.01 cm-l of absorption i s induced by the i r r ad ia t ion ; and
b ) at a specimen temperature of 500 C, the bleaching (color removal) of 0
the i r radiat ion-induced absorpt ion i s eomplete i n l e s s t h a n 1 second.
3. Pulse i r rad ia t ion s tud ies a t a wavelength of 0.215 microns i n t h e u l t r a - v i o l e t at ambient specimen temperatures indicate that:
a ) no t ransient absorpt ion (color present only during the neutron pulse) occurs, since the growth of absorpt ion during the pulse is a smooth va r i a t ion w i t h time;
b) nearly 5@ of the absorption induced by the irradiation pulse i s bleached at room temperature during the 20 minutes between pulses; and
C ) defects may be completely removed by subsequent annealing at tempera- t u re s between 5 d o C and 862Oc.
4. In t e rp re t a t ion of the results of elevated-temperature pulse irradiation s tudies a t a wavelength of 0.215 microns i n t h e u l t r a v i o l e t w a s hampered by an indicated negative absorption during the pulse which was not present at lower temperatures and which could have been caused by fluorescence from the specimen. However, measurements made immediately after the pulse indicated tha t :
a ) the induced absorption created per pulse is on the order of 0.07 cm- ; 1
b ) the rate of decay of t h i s absorption i s f a s t e r at the higher tempera- tures , the bleaching time constant being approximately 0.3 seconds at gOO°C and 0.5 seconds at 500°C ( th i s bleaching time constant i s approximately two orders of magnitude less than bleaching t ime con- stants determined from post -reactor measurements ); and
c) the calculated equi l ibr ium absorpt ion at a continuous neutron flux e q u a l t o t h e pe.& t ransient neutron flux i n the tests is approxi- mately 0.7 cm-1 f o r a specimen temperature b f 9 0 0 0 ~ . This calculated equi l ibr ium absorpt ion coeff ic ient i s p ropor t iona l t o t he decay time constant, and, hence, i s less than that indicated from post-reactor measurements of decay time constant.
2

INTRODUCTION
A program is being conducted at the Research Laboratories of United Aircraft Corporation under Contract NMw-847 wi th the Jo in t AEC-NASA Space Nuclear Propulsion Off ice to de te rmine the feas ib i l i ty o f the nuc lear l igh t bu lb rocke t engine concept . This engine concept i s based on t h e t r a n s f e r of energy by thermal radiation from gaseous nuclear fuel through an internal ly cooled t ransparent wall t o seeded hydro- gen propellant. This concept requires that the t ransparent wall i n the engine remain transparent when subjected to the intense neutron and gamma i r r a d i a t i o n from the nuclear fuel . The program descr ibed in the present report i s one of t h ree programs which have been conducted to ob ta in in format ion on nuc lear i r rad ia t ion e f f ec t s i n cand ida te w a l l materials. The other two programs have r e l i e d on t r ans - mission measurements which have been made af te r the t ransparent mater ia l s have been removed from the reac tor , and are descr ibed in Refs . 1 and 2. Information on the t ransmiss ion charac te r i s t ics of unirradiated specimens i s contained in Ref. 3 as we l l as in Refs . 1 and 2.
Examination of the t ransmission character is t ics of opt ical mater ia ls fol lowing a nuc lear reac tor i r rad ia t ion can be used to ob ta in va luable in format ion regard ing the long-lived neutron-induced damage s i t e s produced during the irradiation process. These measurements may not, however, provide any information regarding the equili- brium absorption associated with short-l ived damage s i tes p resent dur ing the irradiation process, because annealing of neutron induced damage may occur during t h e cool-down cycle fol lowing the i r radiat ion. In addi t ion, the specimens receive a f i n i t e gamma i r r a d i a t i o n dose from the radioact ive capsule used to contain the specimens during the irradiation, thereby increasing the measured absorption (Ref. 2 ) . Careful ly control led i r radiat ions reduce the amount of uncer ta in ty in these experiments, but s t i l l do not yield exact information concerning the absorption present during the i r radiat ion process due t o s h o r t - l i v e d damage s i t e s .
A program w a s i n i t i a t e d at the United Aircraft Research Laboratories to examine the absorp t ion present in an op t ica l mater ia l , spec i f ica l ly fused s i l i ca , dur ing the i r rad ia t ion process . The first p a r t of t he program w a s t he development of t he o p t i c a l and electronic instrumentation required to perform the experiment i n a r ad ia t ion environment. The second p a r t of t he program w a s the experimental inves- t i g a t i o n performed at the Univers i ty o f I l l ino is ' TRIGA Mark I1 reac tor . Measure- ments of t he op t i ca l t r ansmiss ion cha rac t e r i s t i c s o f fu sed s i l i ca were made at 0.215, 0.625 and 1.0 microns immediately before, during and after TRIGA i r r a d i a t i o n pulses. Temperatures of the fused si l ica specimens ranged between ambient and goooc .
3
DESCRIPTION OF EQUIPMENT
System Configuration
The optical instrument developed for the in - reac tor s tud ies i s capable of making transmission measurements during the TRIGA pulse at any selected wavelength from 0.21 t o 1.1 microns and at specimen temperatures ranging from ambient t o 900°C with an overall response time of 3 milliseconds and to an accuracy of *5$. A schematic diagram of the op t ica l conf igura t ion of the instrument i s presented in Fig. 1. A s i nd ica t ed i n t he f i gu re , op t i ca l r ad ia t ion , s e l ec t ed from e i t h e r of t m light sources, passes through a condensing system which serves t o c o l l e c t t h e radiation and focus it on a var iable aper ture which ac t s as a point source for the coll imating optics. The l i g h t i s then col l imated using an off-axis parabol ic f i rs t surface mirror (Perkin-Elmer 098-0041) and directed towards the specimen loca ted i n the nuclear environment using a 45' prism si lvered on the two perpendicular faces. A va r i ab le f i e ld s top i s p resen t i n t he co l l ima t ing sys t em in o rde r t o limit the amount of l igh t rece ived by the specimen. The specimen i t s e l f i s a corner cube prism made of Corning 7940 U.V. g rade fused s i l i ca and i s mounted within a water cooled furnace assembly located a t the , i n t e rna l end of t he beam por t nex t t o t he reactor core face. In t ravers ing the specimen, t he light i s in t e rna l ly r e f l ec t ed such t h a t it i s redirected out of the nuclear environment paral le l to , but la teral ly displaced from, the incoming beam (an inherent charac te r i s t ic of the corner cube configurat ion) . The l igh t then s t r ikes the second s i lvered face of the 45' prism and is directed towards a second off-axis parabolic mirror (Perkin-Elmer 098-0041) which focuses the l igh t on the entrance s l i t of t he monochromator (Perkin-Elmer 99) and detector subsystem v i a an aux i l i a ry f i r s t su r f ace mi r ro r . I n o rde r t o ob ta in rap id da ta acquis i t ion o f t rans ien t e f fec ts , a Visicorder, equipped with 500 KC galvanometers, is employed to record the ou tput from the detector subsystem.
Different l ight sources and detector combinations can be used t o cover the various regions of the optical spectrum. However, during any one reactor pulse , the t ransmission measurement i s r e s t r i c t e d t o a single wavelength since the tran- s ien t pu lses of nuclear radiation produced by the TRIGA reac tor are on the order of 180 mill iseconds duration with a ha l f peak power width of only 30 milliseconds. Three regions are of primary i n t e r e s t for t he i n - r eac to r t e s t s . The f i r s t two a re the regions around 0.215 and 0.625 microns where irradiation-induced absorption bands a re loca ted as indicated by ear l ier post-reactor anneal ing experiments . The th i rd r eg ion i s at 1.0 microns where theory indicates that absorpt ion might be c rea ted by the presence of f ree e lectrons in the specimen. The l igh t sources and detectors were chosen t o i n s u r e t h a t a su f f i c i en t amount of radiant energy i s present in these regions.
For the region around 0.215 microns, the Hanovia 771-B-32 hydrogen discharge lamp was chosen In combination with a modified Cary ~ 2 8 photomultiplier detector.
4

The hydrogen discharge lamp with two permanently mounted Supras i l windows provides ample energy i n t h e u l t r a v i o l e t down t o 0.16 microns (85% transmission at 0.18 microns). The 1 ~ 2 8 photomultiplier tube, modified with an extremely thin entrance window, provides ample s igna l down to 0.20 microns.
For the 0.625 and 1.0 micron regions a tungsten r ibbon f i lament lamp (18~/~10/ I P - 6 ~ ) having a brightness temperature of 2200OC i s used in conjunct ion wi th a 7lO2 photomultiplier tube. The tungsten r ibbon lamp was se lec ted 0ve.r a Nernst glower due to the tungsten lamp's higher energy output a t 1.0 micron (approximately four t imes greater) . The 7102 photomult ipl ier has suff ic ient response out to 1.1 microns.
In add i t ion t o t he l imi t a t ion of one spec t ra l reg ion per pu lse , the re la t ive ly short nuclear radiat ion pulse a lso imposes a l imi t a t ion on the instrument operating mode; the detector subsystem cannot be operated in an optically chopped mode. This i n t u rn necess i t a t e s d-c opera t ion of the l igh t sources in o rder to p resent a non- vary ing s igna l to the de tec tors . The major problem created by t h i s requirement i s i n t h e power supply for the hydrogen discharge lamp which i s normally run i n a n a-c mode. A special current-regulated (*2$) power supply w a s fabr ica ted which i s capable of 2 k i l o v o l t s t o 3.5 kilovolts output at a cur ren t ra t ing of 0.2 amps t o 0.5 amps. This degree of current regulat ion (k27b) r e s t r i c t s t h e l i g h t i n t e n s i t y v a r i a t i o n t o *4$ which i s wi th in the no ise l eve l of t he ove ra l l system.
Furnace Design
For the purpose of making t e s t s at e levated specimen temperatures, a water cooled furnace was fabr ica ted . The furnace assembly i s composed of alundum ceramic wrapped with nichrome wire which i n t u r n i s wrapped with insulat ion. This ent i re assembly was contained within a water jacket in order to remove any p o s s i b i l i t y of the furnace damaging the reac tor beam por t from excessive heating. A closed circulating water system i s used i n connection with a heat exchanger t o t r a n s f e r any heat accumulation out of the system. In this way any radiation hazard due t o contaminants which might be formed in t he nuc lea r environment is minimized. A platinum-platinum-13-percent rhodium thermocouple w a s located within the furnace in the immediate v i c i n i t y of t he sample posi t ion to monitor both sample and furnace temperatures. This furnace assembly was capable of maintaining a sample temperature anywhere between ambient and 9oO°C.
Specimen Configuration
Since the reactor has no through port which passes next to the core , it i s necessary t o r e f l e c t t h e beam of op t i ca l r ad ia t ion back out a f t e r t r a v e r s i n g t h e sample under study during the irradiation (see Fig. 2 ) . Because of t he e f f ec t s of
5

nuclear i r rad ia t ion on mirror materials and alignment problems associated with passing a beam of l i g h t down an 8-foot-long small-diameter port, the specimen con- f igu ra t ion employed was a corner cube prism having a 1 1/2 in . usable diameter and a to t a l op t i ca l pa th l eng th of 6.2 cm, see Fig. 3. In t h i s manner a great degree of misalignment can be to le ra ted before mater ia l ly a f fec t ing the de tec ted s igna l . This was determined in p re l iminary bench tests by closely approximating the f i n a l design of the instrument with regard t o t h e p h y s i c a l r e l a t i o n s h i p of the corner cube prism, opt ica l pa th l engths and monochromator entrance s l i t dimensions. The results showed that the prism can be ro t a t ed illo about the optical axis before the inten.- s i t y is decreased by a f ac to r of two and that, fu r the r , no noticeable light var ia - t i o n r e s u l t s when the ro ta t ion angle was less than - 3 O . A s a comparison, a m i s - alignment on the order of minutes could not be tolerated i f t he specimen configura- t i o n was cy l ind r i ca l and a f la t mirror was used t o r e f l e c t t h e beam back out of the reac tor .
+
6

FXpERlMENTAL PROGRAM
Test Procedure
The experimental program was designed t o accomplish three objectives:
1. To t e s t fo r abso rp t ion due t o free electrons produced during the i r radia- t ion process , which would be most apparent at infrared wavelengths.
2. To measure the abso rp t ion a t t he cen te r s of the irradiation-induced absorp- t i o n bands a t 0.215 microns and 0.Q microns during and a f t e r an i r r ad ia t ion pu l se and a t a range of temperatures (ambient t o 9 0 0 O C ) .
3. To t e s t f o r t h e e x i s t e n c e of t rans ien t absorp t ion , tha t is, absorption which is present only during the irradiation pulse.
The University of I l l i n o i s TRIGA Mark I1 reac tor was operated in the pulse mode to u t i l i ze t he h igh peak powers (on the order of 500 Megawatts ) a t t a i n a b l e i n t h i s mode of ope ra t ion . Pu l ses a t t h i s power level supply peak neutron and gamma f luxes of approximately 5.4 x 10'5 n/cm2-sec and 6.1 x lo7 R/sec respectively with a pulse width a t h a l f peak power of th i r ty mi l l i seconds . The neutron flux spectrum for pulses of t h i s power is given in Table I. Figure 4 i l lus t ra tes the neut ron and gamma f l u e s typically obtained from the TRIGA Reactor. Total integrated neutron and gamma doses provided by the reactor were of the order 2.3 x n/cm2 and 2.6 x 10 6 R respect ively.
Table I1 summarizes the test conditions associated with each experiment. Five specimens were exposed t o a t o t a l of 50 i r radiat ion pulses . In addi t ion, f ive bypass runs were made i n which the l i gh t beam d i d not enter the reactor or t raverse the specimen located therein. These runs were necessary to determine the effects of the reactor pulse upon the instrumentation and t o o b t a i n a co r rec t ion f ac to r t o apply to the data runs. Forty- two i r radiat ion pulses were made t o measure the specimen transmission a t an o p t i c a l wavelength of 0.215 microns; six runs were made a t wavelengths between 1.0 and 1.1 microns; and two runs were made a t 0.62 microns. Two of the specimens, SC62-4 and sc62-5,* were given i r radiat ion pulses while a t elevated temperatures (between 300°C and gOO°C) t o examine the t r ans i en t e f f ec t s of the reactor pulse on the specimen absorption.
* 'The code used t o r e f e r t o t h e specimens is the same as has been used in preceding work except that the f i rs t number re fers to the pa th l ength of l ight through the specimens ra ther than specimen thickness ( that is, t h e l i g h t t r a v e l s 62 mm t o t a l dis tance i n traversing the corner cube specimen).
7

Data was recorded on the Visicorder which p lo t ted the s igna l l eve l genera ted by the photomultiplier (detector output) as a funct ion of time immediately before, during, and up t o 1 second a f t e r t he r eac to r pu l se . In add i t ion t o mon i to r ing t he detector output, the Visicorder also recorded the peak port ion of the reactor pulse and the output of a reference time mark generator for correlat ion purposes .
Source currents and detector vol tages were monitored p r i o r t o each pulse and the condi t ions are summarized i n Table 11. A s noted in t h i s t ab l e , t he hydrogen discharge lamp was unstable during the D-1 through D-11 pulses. This was corrected during the subsequent series by provid ing addi t iona l a i r cool ing to the lamp i t s e l f .
In addi t ion, for runs D - 1 through D-11 and E-1 through E-16, the transmission of a standard specimen mounted ex te rna l t o t he r eac to r was recorded immediately before each pulse to maintain a check on t h e s t a b i l i t y and r e l i a b i l i t y of the t rans- mittance measuring system.
Factors Affecting Transmission Data
Several factors were encountered during the t e s t program which l e d t o problems in i n t e rp re t ing t he da t a . The most important of these was an apparent increase in the transmission of the specimens during the i r radiat ion pulse , especial ly a t e le- vated temperatures. Some of this apparent increase is d i r e c t l y a t t r i b u t a b l e t o t h e influence of t he i r r ad ia t ion pu l se i t s e l f upon the op t i ca l and electronic recording systems when operat ing the system in the ul t raviolet a t 0.215 microns.Figure 5 shows th is rad ia t ion in f luence upon the instrumentation system for three bypass runs, that is, runs in which the op t i ca l r ad ia t ion bypassed the reac tor beam por t in which the specimen was mounted. The radiat ion therefore went d i r e c t l y from the source cham- b e r t o t h e monochromator subsystem. Curve C - 1 1 in F ig . 5 shows tha t t he s igna l level using the or iginal configurat ion increased some 19% during the peak of the pulse. Modifications were made in an e f for t to reduce th i s increase in s igna l level during the pulse. Since gamma i r r ad ia t ion can interact with photomultiplier tubes causing an effective increase in gain, two inches of lead shielding was placed around the 1P28 photomultiplier (curve D-13). No improvement resul ted, a l though in th i s case the hydrogen discharge lamp was unstable (throughout runs D - 1 through D - 1 3 ) . The l ight source chamber-cover was removed fo r t he nex t s e t of runs t o pro- vide more e f f ic ien t cool ing of the lamp i n an a t tempt to increase i ts s t a b i l i t y . Curve E-11 i l l u s t r a t e s t h e improvement obtained. Although not completely removed, the increase in s igna l l eve l due to t he r eac to r pu l se i s less than 7% which corres- ponds t o an effect ive decrease in absorpt ion of 0.011 cm-l when appl ied to spec i - mens with 6.2 cm path length. Unfortunstely, bypass runs could not be made simul- taneously with specimen runs because of the single-beam method of operation and therefore the bypass correct ions appl ied to the data m u s t be assumed as approximate correct ions. The correct ions were made a s shown i n F i g s . 6 through 9.
8

Figure 6 i l l u s t r a t e s a typ ica l cor rec t ion as a p p l i e d t o R u n €3-1 us ing the C-ll bypass run. It was assumed tha t the reac tor pu lse d id no t a f fec t the ga in of any component i n the recording system but did add a no i se s igna l t o t he t rue s igna l pe r - mit t ing a d i rec t subt rac t ion to ob ta in the cor rec t ion . The change in the increase during the bypass run ( C - 1 1 ) was therefore subtracted from the specimen run (B-1) t o obtain the corrected s ignal . No correct ions were necessary before and a f t e r t h e pulse and therefore the data points of specimen run and corrected run agree.
Bypass data used to correct the e levated temperature runs are shown in F igs . 7 through 9. Figure 7 shows the bypass s ignal ( run E-11) and th ree specimen runs at elevated temperatures: run E-8 a t 3 0 0 ° C , run E-1 a t 5 0 0 ° C and run E-5 a t 9OO0C. Figure 8 i l l u s t r a t e s t h e t y p i c a l s i g n a l l e v e l s aft,er subtract ing the change. in the s igna l l eve l which occurred during the bypass run. In Fig. 9 the s igna l l eve ls have been converted to t ransmit tance values by comparing the s igna l l eve l s t o t he s t an - dard specimen s igna l l eve ls which were obtained prior to each run. Since a s ingle- beam technique was employed, long term measurements (greater than a second) are subject to inaccuracies due t o long term d r i f t of the l ight source, photomult ipl ier and associated electronics. This is not c r i t i ca l dur ing a s ingle pulse s ince the transmittance change during a single pulse can be compared t o t h e immediate pre- pulse transmittance (70 milliseconds before the peak of the pulse ) t o ob ta in t he change in t ransmiss iv i ty and absorption during and immediately a f t e r a pa r t i cu la r pulse. A standard specimen was in se r t ed i n to t he op t i ca l beam p r io r t o t he pu l se during runs D and E t o measure and reduce the effect of d r i f t on the long-term mea- surements. Since the standard specimen could not be mounted in i den t i ca l ly t he same pos i t ion as the specimens, t h i s measurement was incorporated into the data to account for t he r e l a t ive changes of specimen transmission between the pulses and not as an absolute value of the transmittance. For example, the infrared and red spec- t r a l runs show tha t t he specimen transmits more s ignal than the s tandard, as much as 2.15 times. Since these spectral runs were made with a narrower s l i t width (0.171 mm as opposed t o 0.40 mm i n t h e u l t r a v i o l e t ) and s ince the posi t ion of the 45' prism was maximized for t h e t e s t specimen and not the standard, it is possible that the standard specimen deviated the beam s l i g h t l y so as not to intercept the entrance s l i t of the monochromator i n t h e same way a s t he t e s t specimens.
Ambient Temperature Studies a t 0.215 Microns
Two specimens, sc62-2 and sc62-3, were r u n i n t h e u l t r a v i o l e t a t 0.215 microns a t ambient temperature. The tes t condi t ions and post i r radiat ion heat ing schedule a r e summarized i n Table 11. Each specimen was separately exposed t o a t o t a l of 10 pulses consis t ing of two s e r i e s of f ive pulses each. Between the two ser ies , the specimens were removed from the reac tor and hea t t r ea t ed i n a small furnace. Speci- men SC62-2 was heated a t 5 0 8 O C f o r 15 minutes whereas specimen sc62-3 was heated a t 862OC f o r 30 minutes.
9

The t o t a l accumulated absorption coefficient after each step for specimen sc62-2 is shown i n F i g . 10. Although some ambient temperature bleaching occurs between the pulses, this bleaching i s incomplete in the twenty minute interim period. Also indicated in Fig. 10 is the incomplete defect annealing by the heat treatment a t 5 0 8 O C . Ser ies 6 through 10 shows t h a t a more rapid growth of absorption occurs during pulses B-6 and B-7 t han fo r B-1 and B-2. This is i n t e r p r e t e d a s f i l l i n g defects created during the first s e r i e s which were not annealed during the heat treatment.
The t o t a l accumulated absorption coefficient after each step for specimen sc62-3 is shown in F ig . 11. The data is s i m i l a r t o t h a t f o r sc62-2 i n F i g . 10 with one exception. The heat treatment of 862OC f o r 30 minutes apparently annealed the defects produced during pulses C - 1 through C-5 more completely since the growth of color in pulses C-6 through C-10 i s near ly ident ica l to the p receding f ive pu lses .
Figures I 2 through 15 i l lust rate the s ingle pulse data obtained with each ambi- ent temperature specimen. For specimen sc62-2, pulses €3-1 through B-5 a r e shown i n Fig. I 2 and pulses B-6 through B-10, a f te r the hea t t rea tment , in F ig . 13. Figures 14 and 15 show similar da ta f o r specinen sc62-3. In each case the transmissivity before, during and immediately a f te r the reac tor pu lse is p lo t ted . The transmissiv- i t y is obtained by comparing the s igna l l eve l du r ing t he pu l se t o t he s igna l l eve l immediately before the pulse (at time equal to -70 milliseconds ). The curves there- fore show the reduct ion in t ransmiss iv i ty induced by the reactor pulse. Succeeding pulses produce incrementally more absorp t ion ind ica t ing aga in tha t on ly par t ia l room-temperature bleaching of the irradiation-induced defects is occurring between pulses which are colored in succeeding pulses.
Elevated Temperature Studies a t 0.215 Microns
Twenty-two t e s t r u n s were made a t 0.215 microns over a range of specimen tem- peratures from 300°C t o 9OO0C using two samples, SC62-4 and sc62-5. The t e s t condi- t ions associated with these runs (Ser ies D and E ) are given in Table 11. Figures 16 and 17 i l l u s t r a t e t he p re -pu l se ' and post-pulse (200 mill iseconds af ter the pulse peak) absorpt ion coeff ic ient of these two specimens. The data are p lo t t ed a s a funct ion of pulse number f o r each series indicating the temperature history during the pulsing sequence. The data , as plot ted, include the absorpt ion due t o temperature, that is, the values plot ted are the sum of the i r rad ia t ion- induced absorption coefficient and the increase in absorp t ion due t o t h e normal temperature shif t of the u l t rav io le t cu tof f in fused s i l i ca ( see Ref . 1). The pre- pulse absorption coefficients are plotted in Fig. 18 t o i l l u s t r a t e t h e f a m i l i a r increase in absorption with temperature as a r e l a t i v e l y smooth var ia t ion . These values are higher than those obtained in Ref. 1 but probably include temperature dependent experimental factors, especially the large specimen-to-monochromator dis tance. A s previously mentioned, the increase in absorption coefficient with each
10

successive pulse a t ambient temperature is a t t r i b u t e d t o t h e f a i l u r e t o b l e a c h radiation-induced damage a t ambient temperature and thus represents a build-up or growth of damage. It would appear from Figs. 16 and 17 t h a t complete recovery did not occur af ter a l l the pulses a t h igh temperature . This , however, is a t t r i b u t e d t o s ca t t e r i n t he da t a . Th i s s ca t t e r fo r run s e r i e s D is somewhat g rea t e r t han fo r run se r ies E and is be l ieved to be due to the unsteadiness in the l ight source which accompanied run s e r i e s D. Complete thermal recovery of the damage appears t o occur in every case.
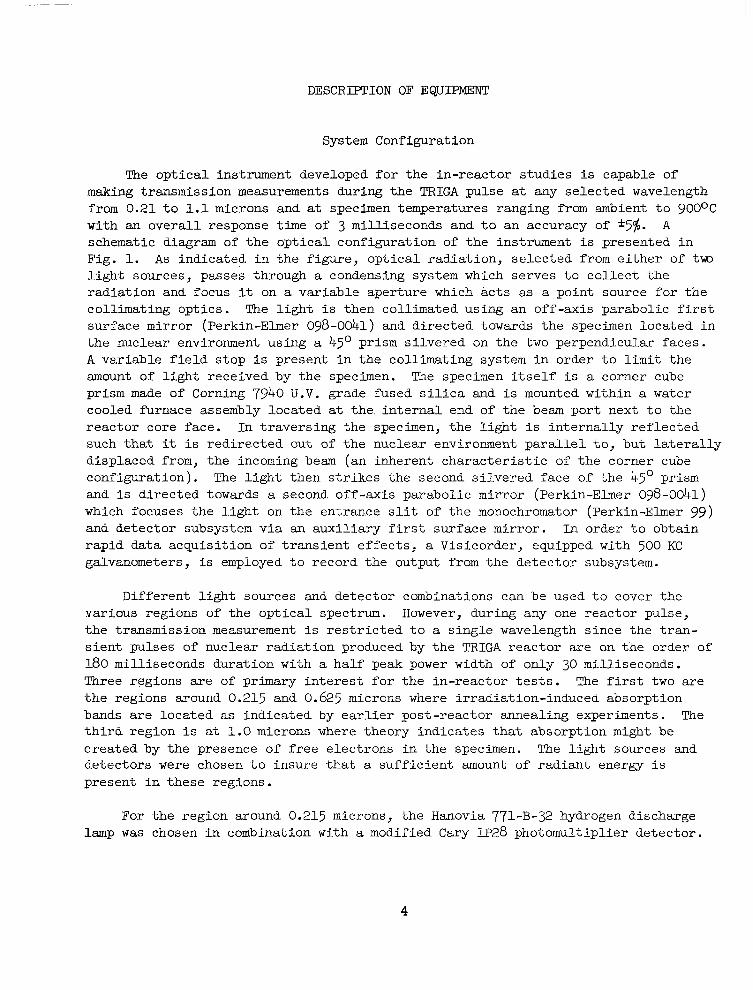
The s ingle-pulse da ta for these se r ies is p lo t ted i n Figs. 19 through 32. Again the s ignal during the pulse is compared to tha t before the pu lse to ob ta in the t rue t ransmissivi ty during and af te r the reac tor pu lse . Two s e t s of f igures a re used f o r each specimen temperature. One s e t covers the time range from 70 mil l i sec- onds be fo re t o 160 mi l l i seconds a f te r the peak of t he pu l se t o examine the transmis- s ivi ty during the pulse . The o the r s e t condenses the time scale from 100 t o 1000 mill iseconds af ter the peak of the pu lse to examine the bleaching of the i r radia- tion-induced color. Especially for run se r ies D, the bypass correction was too sma l l t o co r rec t for a l l t h e s i g n a l l e v e l i n c r e a s e which occurred during the peak of the pulse. A portion of t h i s e f f e c t may be a t t r ibu ted to the uns teadiness of the hydrogen discharge lamp during these runs.
A l l the curves show additional absorption being produced in t he sample some 140 t o 150 mi l l i seconds a f te r the peak of the pulse even though no absorption may have been present during the pulse. Init ially, this was considered t o be an experimental problem associated with gamma heating of the specimen and unequal cooling causing a sch l i e ren - l ike e f f ec t t o dev ia t e t he l i gh t beam, thus moving it off the s l i t and causing an apparent decrease in l ight intensity. Subsequent calculat ions indicated t h a t (1) gamma heating would produce less than a 5OC temperature r ise, and ( 2 ) the sample would require on the order of a minute t o r e t u r n t o i t s original temperature. However, as seen in the curves , th is absorpt ion shows a r e l a t i v e l y f a s t decay con- s t an t , and consequently cannot be attr ibuted to gamma heating. It may be caused by a temperature dependent secondary radiation, e.g. fluorescence, or have some inher- ent t ime delay (half- l i fe) for creat ion, but a t present it is not understood.
Figure33 shows a comparison of typical data obtained a t var ious temperatures a t times up t o one second a f t e r t he pu l se . The f i rs t pulse in each temperature series has been selected t o remove any ambiguities due t o incomplete bleaching (especially in the cases of ambient and 300°C runs ). It can be seen tha t the absorp t ion a t 150 milliseconds is g r e a t e s t a t gOO°C and nea r ly equa l a t 500°C and 300°C. This absorp- t i o n is, however, removed more rap id ly a t e leva ted t empera tures : a t gOO°C the sample has returned t o i ts pre-pulse value in less than one second; a t 500°C, 75% recovery of the damage was observed a f t e r one second; and a t 300°C, 60$ recovery of the dam- age was observed a f t e r one second.
It is now of in te res t to es t imate the equi l ibr ium absorp t ion in a fused s i l i ca specimen if the specimen were subjected t o a cont inuous f lux equal to the peak f lux
11

i n the TRIGA reac tor . During such equilibrium operation, the rate of creation of absorption is given by the following equation:
If no other processes are important, this can be in t eg ra t ed t o g ive
a = k$n t (2 1
If the absorption is assumed t o be bleached by a f i r s t -order k ine t ic p rocess ,
” - - d a - a t a e
A t times greater than approximately 50 mill iseconds following the TRIGA pulse, where t h e r a t e of c rea t ion of absorp t ion s i tes is negl igible , the absorpt ion w i l l decay by a logarithmic process which can be obtained by in tegra t ion of Eq. (3) .
For small values of absorpt ion coeff ic ient , the absorpt ivi ty absorpt ion coeff ic ient . Therefore ,
(1 - = (1 - r lo e-t/e
Values of reference absorpt ivi ty (1 - T )o were determined by t r a t ed i n F igs . 34 through 40 and a r e summarized in Fig. 41. determined from the data shown in these f igures a re shown as
is propor t iona l to
the constructions illus- The time constants
a funct ion of specimen temperature in Fig. 42. The l i n e drawn through the data points has been weighted wi th the se r ies E data s ince it is be l ieved to be more r e l i a b l e . Note tha t t hese decay time constants are approximately two orders of magnitude less than those in- dicated by the post-reactor decay time constants reported in Ref. 2.
By analogy with Eqs. ( 4 ) and (5 ) , Eq. (2 ) can be approximated a s
or
The quant i ty to i n Eqs . (6) and (7) represents the value of t ime equa l t o t he t o t a l dose divided by the peak flux. This quant i ty for the TRIGA reactor pulses employed i n t h e p r e s e n t t e s t program is equal to approximately 2.3 x 10¹⁴ neutrons/cm2 d iv i - ded by 5.3 x 10¹⁵ neutrons/cm2-sec, o r 0.043 sec .
12
_. .. . .. . -. . .

I
The equi l ibr ium absorpt ion coeff ic ient , ae, for long exposure times can be obtained by equat ing the expression for the ra te of c rea t ion of absorpt ion in Eq. (1) to the nega t ive va lue of the express ion for the ra te of annealing of absorption i n Eq. (3). Therefore,
o r ae = k4n8
Subst i tut ing from Eq. (2) yie lds
ae = eao/to
( 9
Plot ted as a funct ion of temperature in Fig. 43 are values of equilibrium absorption coeff ic ient as calculated from the data in Figs . 41 and 42 and a value of to of 0.043 sec. These values apply for a cont inuous f lux equal to the peak TRIGA f lux of 5.3 x 10¹⁵ n/cm2-sec. A t gOO°C the equilibrium absorption coefficient is estimated t o be approximately 0.7 crn-l. The peak TRIGA fas t neut ron f lux is approximately half of t he f l ux i n a 4600 Megawatt nuclear l ight bulb reactor according to the s tud ies of Ref. 4. The resul t ing indicated equi l ibr ium absorpt ion coeff ic ient of 1.4 cm'l f o r the engine a t t h e middle of an absorption band centered a t a wavelength of 0.215 microns (twice that calculated for the peak TRIGA f lux ) should have l i t t l e adverse effect on a nuclear l ight bulb reactor . However, the calculated equilibrium absorpt ion coeff ic ient would be two orders of magnitude higher if the decay times from the post-reactor tes ts of Ref. 2 were employed; this increased equilibrium absorpt ion coeff ic ient would have a subs tan t ia l adverse e f fec t on the character is- t i c s of a nuclear l ight bulb reactor .
Studies a t V i s i b l e and Near-Infrared Wavelengths
Eight runs were made a t wavelengths other than 0 2 1 5 microns : s i x a t 1.0 t o 1.1 microns and two a t 0.625 microns. The region at 0.625 microns i s of i n t e r e s t because it is the center of an irradiation-induced absorption band a s reported in Ref. 1. Figure 44 shows the t ransmissivi ty data obtained a t 0.625 microns with specimen sc62-5 a t ambient temperature and a t 500°C. The ambient temperature run shows an almost immediate production of absorption whereas a t 500°C the absorp- t i o n peaks some 160 t o 180 mil l i seconds a f te r the pu lse ( s imi la r to the u l t rav io le t high-temperature runs). The maximum absorption induced was 0.01 cm-l and, i n t h e case of the 500°C t e s t , was e n t i r e l y removed i n l e s s t h a n 1 second.
The infrared region (1.0 t o 1.1 microns)was monitored during s i x p u l s e s t o t e s t for f ree e lec t ron absorp t ion , s ince in high-gamma-flux f i e lds su f f i c i en t f r ee e l ec - trons could be produced t o cause measurable absorption. In the da ta for specimen
13

SC62-1 ( run Ser ies A, Table 11) no change in t ransmi t tance was observed f o r runs A - 1 and A-2. hall changes were observed a t 1.05 and 1.1 microns which were i n t h e d i r ec t ion of increased signal, corresponding t o a negat ive absorpt ion coeff ic ient of 0.015 cm-l. Since a ca l ib ra t ion bypass run was not' made fo r t h i s se r ies , the da ta is not presented. However, Fig. 45 shows the r e su l t s fo r run E-15 f o r which a by- pass run was made. The t ransmissivi ty change is immeasurable ind ica t ing tha t no absorption due t o f r e e e l e c t r o n s was detected.
14

1. Douglas, F. C. and R. M. Gagosz: Experimental Investigations of Thermal Annealing of Nuclear-Reactor-Induced Coloration i n Fused Silica. United A i r - c r a f t Research Laboratories Report D-910082-7, March 1965. Also issued as NASA CR-304.
2. Douglas, F. C. , R. Gagosz, and M. A. DeCrescente: Optical Absorption i n Transparent Materials Following High Temperature Reactor Irradiation. United Aircraf t Research Laboratories Report F-910485-2, September 1967. To be issued as NASA CR Report.
3. Edwards, 0. J.: Optical Absorption Coefficients of Fused S i l i c a i n t h e Wave- length Range 0.17 t o 3.5 Microns from Room Temperature t o 980Oc NASA TN D-3257 February 1966.
4. Latham, T. S.: Nuclear Cr i t ica l i ty S tudies of Specific Nuclear Light Bulb and Open Cycle Gaseous Nuclear Rocket Engines. United Aircraft Research Laborato- r i e s Report F-910375-2, September 1967. To be issued as NASA CR Report.
15

LIST OF SYMBOLS
k
t
t 0
a
a 6
a e
e r
+n
Constant governing variation of absorpt ion coeff ic ient with neutron f lux [see ~ q . (2)], cm/neutron
Time, sec
Value of t ime determined by dividing total neutron dose by peak TRIGA neutron flux, sec
Absorption coefficient, cm
Absorption at beginning of time in t e rva l , cm
-1
-1
Calculated equilibrium absorption coefficient for continuous operation a t peak TRIGA neutron flux, em-’.
Time constant for decay of radiation-induced absorption [see Eq. (4)1, sec
Transmissivity, I/Io
Neutron f lux, neutron/cm2-sec
16

TABLE I
Neutron Flux Spectrum for a Typical TRIGA Pulse
Energy Range
Thermal Epithermal 1 Kev t o 0.75 Mev 0.75 t o 1.50 Mev 1.50 t o 2.90 Mev 2.90 Mev t o d,
2.12 .55 .86
1.05 * 5 1
39 -2 10.3 16.0 19.5 9.5
5.5 100.0
17

T A B 5 11
ThlCh In-Reactor Irradiation Test Conditions
prclmen 3ypypass Run b e d LO Correct Data
~~
Source Current, S l i t YIdCh, Photomultiplier, h P S Millimeters Vol twe
18 0.20 1200
" I "
0.303 703 ' C.40
., 1 I.
, 9.
, ,I
1
, I ,
1
0.300 1 700 0.40
" I
wave1enet4 speclmen 1emperature IM1rrmh Degrees Centigrade
1.0 Ambient 1 .0 1.55 1.1 1.1
0.215 h b i e n t
un 143.
- A - 1
2 3
5
B - 1 2 3
5 6 ( a ) 7 8 9
4
-
4
10 - c-1
2 3 4 5 6 ( b ) 7 E 9
SC62-1 ' 5.18 2.28 5.25 2.30 5.19 2 .dB 5.81 2.56
2.58
5.25 5.2, 2 . jo
5.90 5 . 8 8 1 2.58
2.68 2.38
sc62-2 r l , .,2 5.22 1 2.29 1 5.87
2.28 L. 3 7 2.56 j 2.57 5. 311 2.3c 5.28 I 2. jO . 5.91
5.99 1 2.58
C-U
2.58 2.58 2.61 2.60
5 2 9 5.40
5.36 5. js
5.35 i 2.31 5.99
2 .30 2 . p ! 6.06
5.9L
2.,1 6.-
2.31 6.01
5.34 ~ 2.31 5.99 I I 2.60 ' " I 2.60 ' "
2.60 , " 1 -r t sc62-3 5.31
5.29 2. 30
5.31 2.30 2.30
5. 3 j ~ 2.35 5.31, 5.34 2 . jo
2.31
5.54 2.30 5.33 2.31
5.96 5.94 5.96 5 . 9 5.99 5.99 5.99 5.98 6.01 6 . w 6.@3
2.58 >' 0.215 2.58 2.58 , I*
' ., !
Ambient C-ll
2.64 2.60 2.58 2.58 2.60 2.60 2 .e: 2.62
I
-r
I
, I
I
i-
-c !
D - 1 5.116 I 2.31 I 6.13
3 5.53 2.28 4 5.48
6.21
5 2 .28 j 6.15
5.46 2 .d6 6 5.116
6.13 , 2.28
7 > . I , ?
6 .13
8 5.46 2:29 1 6.Q 2.25 1 6.13
9 5.46 2.32 6.13 10 . 5.45 2.25 6.Q
5.45 2.24 12 5.41 2.24
6 . Q 6 . d
1 3 ( c ) 5.43 2.24 6.10
2 5.52 2.35 j 6.20
11
1
1 i-
700 0.40 ~ 0-13 0.40 ~
0.40 , 0.40 0.40 I
0.40
- :&-I4 2.60
2.64 1 2.56 2.56
2.56 2.57 , 2.53 2 .61
2.54 1 ' 0.40
0.40 I 0.bO
0.40 0.40
2.53 2.52 I "
2.52 2.52 I "
0.215 +" 0.40
0.40 0.40 0.40 0.40 0.40
"
1
E-ll
E-13
E-lb E-13
5.40 2.24 6.06 5.33
2.52 2.24 6.04 1 2.52
5.36 2.24 0.W I 2.52 5.37 2.25 6.03 2.53 5.40 2.24 6.c6 2.52
2.28 6.06 2.56 2.25
5.61 5.99
2 . ,1 2 . > j
6.30 , 2.60 5.46 2.25 ' 6.13 5.40 2.,0
2 .53 6.06 j 2.58
6.05 , 2.52
3 , 4
' 2 5.40
1 ;
i :: ( c ) ' 5.38 2.28 6.04 2.56
5.34
, 9
5 . 2 I 2.24 5.34 2.25 5.99 2.53
0.300
18
' " I 100 :: j 300
66
1 15 1s ( c ) 5.34 2.24
5 . 2 2.26 ' 6.W 2.54 1.0 ~ 16 , 5.34 , 2.24 I 5.99 ' 2.52 ,' 0.62
5.99 1 2.52 ' l.C h b i e n t

OPTICAL SCHEMATIC FOR IN-REACTOR TRANSMISSION MEASUREMENTS
REACTORCORE
CORNERCUBE TEST SPECIMEN
I i l!I
REMOVABLE PLANE MIRROR FOR SOURCE SELECTION 294 MM
\ -.. VARIABLE FIELD '\ '. STOPS ( 12 MM
SOURCE
OPTICAL SOURCES MIRROR
DIA)
PLAN E MIRROR MONOCHROMATOR AND DETECTOR SUBSYSTEM

co 0
LOCATION OF SPECIMEN AND INSTRUMENTATION RELATIVE TO TRIGA REACTOR CORE
E L E C T ~ L EQUIPMENT UPPORTING
CONDENSING AND COLLIMATING OPTICS REACTOR
CORE BLOCK HOUSE
WEST BEAM TEST PORT
MONOCHROMATOR REFOCUSING AND
OPTICS
n ? h)

FIG. 3
CORNER CUBE SPECIMEN
21

FIG. 4.
TYPICAL NEUTRON .AND GAMMA FLUX PROFILES OF TRIGA PULSE RUN D-7
7
6
u 5 W v)
W 2 2
1
0
1 SY!OL 1 .FLUX 1 NEUTRON
GAMMA
-40 -20 0 20 40
TIME FROM PEAK OF TRfGA PULSE, t-MILLISEC
60
22

FIG. 5 COMPARISON OF RECORDED BYPASS SIGNAL LEVEL DURING TRIGA REACTOR PULSE
WAVELENGTH,A = 0.215 MICRON
SYMBOL
A
0
0
RUN
c-11
D-13
E-11
NOTES
ORIGINAL CONFIGURATION
LEAD SHIELDING ADDED. LIGHT SOURCE INTENSITY UNSTEADY
- 40 -20 0 20 40 60
TIME FROM PEAK OF TRIGA PULSE, t-MILLISEC
23

FIG. 6
TYPICAL DATA FOR AMBIENT SPECIMEN
SPECIMEN SC 62-2
WAVELENGTH,h= 0.215 MICRON
r i SYMBOL
TEMPERATURE
~~
- J U Z : n W
u I- W oi oi 0 u 0 I- * J Z 0 v)
J w n n a Y
0
1 Wi
-
u z 4 I-
L Z a oi I-
v)
TIME FROM PEAK OF TRIGA PULSE, t-MILLISEC
24

FIG. 7
TYPICAL RECORDED SIGNAL LEVELS FOR HIGH SPECIMEN TEMPERATURES
SPECIMEN SC 62-5
WAVELENGTH,h= 0.215 MICRON
TEMPERATURE
500 C E-5 900 C E-11 BYPASS
1 0 20 40 - 60
TIME FROM PEAK OF TRIGA PULSE, t-MILLISEC
25

FIG. 8 TYPICAL SIGNAL LEVELS AFTER SUBTRACTING SIGNAL LEVEL OF BYPASS RUN
FOR HIGH SPECIMEN TEMPERATURES SPECIMEN SC 62-5
WAVELENGTH,A= 0.215 MICRON
SYMBOL TEMPERATURE
500 c E-5 900 C
3
TIME FROM PEAK OF TRIGA PULSE, t-MILLISEC
26

. ..
FIG. 9
TYPICAL TRANSMITTANCE FOR HIGH SPECIMEN TEMPERATURE
SPECIMEN'SC 62-5
WAVELENGTH, A = 0.215 MICRON
-40
SYMBOL I RUN I .TEMPERATURE I I ~~
0 0 a
0 20 40 60 TIME FROM PEAK OF TRIGA PULSE, t-MILLISEC
27

ABSORPTION COEFFICIENTS MEASURED BEFORE AND AFTER SUCCESSIVE FIG. 10
28

FIG. 11
ABSORPTION COEFFiCIENTS MEASURED BEFORE AND AFTER SUCCESSIVE TRlGA PULSES FOR RUN SERIES C
SPECIMEN SC 62-3
WAVELENGTH, X = 0.215 MICRON
0 BEFORE TRlGA P U L S E 0 100.MILLISEC AFTER PEAK 0.F TRIGA PULSE
TIME BETWEE'N PULSES - 20 MINUTES
4 6 8 PULSE NUMBER (C SERIES)
10
29

TRANSMISSIVITY DURING RUNS B-1 THROUGH B-5 AT AMBIENT
SPECIMEN SC 62-2
WAVELENGTH,h = 0.215 MICRON
I I I I FRACTIONAL BYPASS I SYMBOL 1 RUN I ( VIo) R E F I CORRECTION TO IA,, AT t= 0
a
0.538 8-5 A 0.581 0 - 4 0 0.699 8 - 3 0 0.796 8-2 0.216
0.246 0.296
0.320
FIG. 12 TEMPERAT-URE
-40 0 40 80 120 160" 9x10⁵ TIME FROM PEAK OF TRIGA PULSE, t-MILLISEC
30

FIG. 13
TRANSMISSIVITY DURING RUNS B-6 THROUGH B-10 AT AMBIENT TEMPERATURE
SPECIMEN SC 62-2
WAVELENGTH h = 0.215 MICRON
-40
FRACTIONAL BYPASS C_ORRECTIO%i
R E F TO l/lo A T 2
1.00 0.182
0.568 0.320
0 A66 0.391 0364 0.500
0.272 0.67
TIME FROM PEAK OF TRIGA PULSE, t-MILLISEC
31

FIG. 14
TRANSMISSIVITY DURING RUNS C-1 THROUGH C-5 AT AMBIENT 'TEMPERATURE
SPECIMEN SC 62-3
WAVELENGTH, x = 0.215 MICRON
SYMBOL
0 a 0 0 A
RUN
c-1 c - 2
c -3 c -4 c - 5
('''0) R E F
1.0
0.692 0.617 0.588 0.588 1 FRACTIONAL BYPASS
CORRECTION TO 1/1 A T t=O
0.271
0.307 0.320 0 320
TIME FROM PEAK OF TRIGA PULSE, t-MILLISEC
32

FIG. 15
TRANSMISSIVITY DURING RUNS C-6 THROUGH C-10 AT AMBIENT TEMPERATURE
SPECIMEN SC 62-3
WAVELENGTH, A = 0.215 MICRON
FRACTIONAL BYPASS
0 C-6 1 .o 0.174
a 0.588 C-8 0
0.696 C-7
0 0.544 C-9
A 0.522 C-10
0.250
0.296
0 320
0.334
-40 0 40 80 120 160 " 9x10⁵ TIME FROM PEAK OF TRIGA PULSE, t-MILLISEC
33

FIG. 16
ABSORPTION COEFFICIENTS MEASURED BEFORE AND AFTER SUCCESSIVE TRIGA PULSES FOR RUN SERIES D
0 BEFORE TRIGA PULSE
0 200 MlLLlSEC AFTER PEAK
OF TRlGA PULSE
I I U I
0 2 4 6 8 10 12 PULSE NUMBER ( D SERIES 1
34

FIG.. -11
1
ABSORPTloN COEFFICIENTS MEASURED BEFORE AND AFTER SUCCESSIVE TRIGA PULSES FOR RUN :SERIES E
0 BEFORE TRlGA PULSE
0 200 MlLL lSEC AFTER PEAK OF TRlGA PULSE
2 4
m 111il~t\
I T E M P
;900 C
6
PULSE NUMBER (E SERIES)
8 10 12
35

FIG. 18
EFFECT OF SPECIMEN TEMPERATURE ON ABSORPTION COEFFICIENTS MEASURED BEFORE TRIGA PULSES FOR SERIES B -THROUGH E
WAVELENGTH, A = 0.215 MICRON
SYMBOL RUN SERIES
0 B
0
E 0
D n C
36

TRANSMISSIVITY DURING
1.2
1 .o L w K 0
h
'1 - - ' 0.8 h - 0
'1 - I
: 0.6 z v) m - 111 " z E + a
n W 0.4 a u n E
I-.
0.2
C - 0 -40
FIG. 19
RUNS D-1 THROUGH D-4 AT 700 C FOR TIMES UP .TO 160 MlLLlSEC AFTER TRIGA PULSE
SPECIMEN SC 62-4
WAVELENGTH, A = 0.215 MICRON
FRACTIONAL. BY PASS RUN ( 111 o ) R E F CORRECT_IO_N_
( 1/1 - ) AT t= 0 ~- .~
D- 1
D-2
D-3
D-4
0 3 9 1 0.497
0.359 0.523 I 0.352 0.494
40 TIME FROM PEAK OF ~TRlGA PULSE, t-MILLISEC
37

FIG. 20
TRANSMISSIVITY DURING RUNS D-1 THROUGH D-4 AT 700 C FOR TIMES LONGER THAN 100 MlLLlSEC AFTER TRIGA PULSE
SPECIMEN SC 62-4
WAVELENGTH,X = 0.215 MICRON
SYMBOL RUN
D- 1
D-2
D-3
D-4
("'0' R E F I 0.492
0.391
0.359
0.352
TIME FROM PEAK OF TRIGA PULSE, t-MILLISEC

TRANSMISSIVITY DURING RUNS D-5 AND D-6 AT 800 C FOR TIMES UP TO 160 FIG. 21
MlLLlSEC AFTER TRIGA PULSE
-80 -40 40 80
01295 0.388
120
0.633 w
TIME FROM PEAK OF TRIGA PULSE, t-MILLISEC
39

FIG. 22 TRANSMISSIVITY DURING RUNS 0-5 AND D-6 AT 800 C FOR TIMES LONGER
THAN 100 MlLLlSEC AFTER TRIGA PULSE
SPECIMEN SC 62-4
WAVELENGTH, x = 0.215 MICRON
TIME FROM PEAK OF TRIGA PULSE, t-MILLISEC
40

TRANSMISSIVITY DURING RUNS D-7 AND D-8 AT 900 C FOR TIMES FIG. 23
UP TO 160 MlLLlSEC AFTER TRIGA PULSE
SPECIMEN SC 62-4 WAVELENGTH, h.= 0.215 MICRON
0 40 a0 12( 160 TIME FROM PEAK OF TRIGA PULSE, t-MILLISEC
41

FIG. 24
TRANSMISSIVITY DURING RUNS D-7 AND D-8 AT 900 C FOR TIMES LONGER THAN 100 MlLLlSEC AFTER TRIGA PULSE
SPECIMEN SC 62-4 WAVELENGTH,h= 0.215 MICRONS
F SYMBOL RUN ( V I o ) R E F
600 800 TIME FROM PEAK OF TRIGA PULSE, t "ILLISEC
42
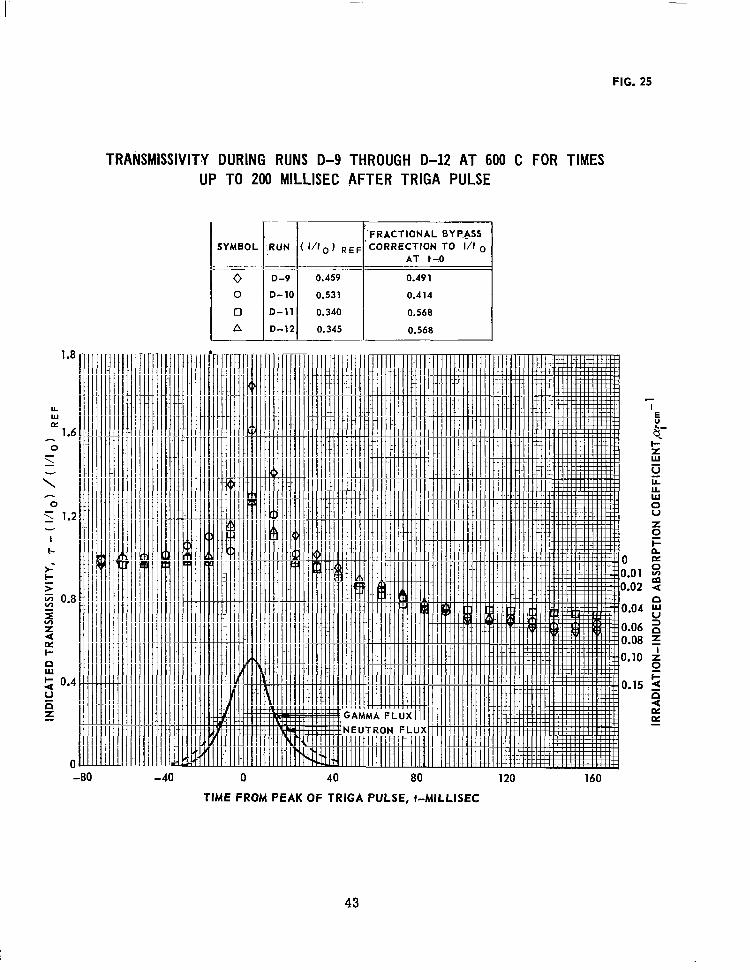
FIG. 25
0 . il -80
TRANSMISSIVITY DURING RUNS D-9 THROUGH D-12 AT 600 C FOR TIMES UP TO 200 MlLLlSEC AFTER TRIGA PULSE
SYMBOL
0 0
O
n
~~
RUN
__ D-9
D- 10
D-11
D-12
'FRACTIONAL BYP.ASS
A T t=O
0.459 0.49 1
0.531
0.340
0.345
0.414
0.568
0.568
-40 0 40 80 120 160
TIME FROM PEAK OF TRIGA PULSE, t-MILLISEC
43
FIG. 26
TRANSMISSIVITY DURING RUNS D-9 THROUGH D-12 AT 600 C FOR TIMES LONGER THAN 100 MlLLlSEC AFTER TRIGA PULSE
SPECIMEN SC 62 - 4
WAVELENGTH, = 0.215 MICRON "ioL 1 1 (''rI3:EF
0.459
D - 1 1 0.340 a D-12 0.345
TIME FROM PEAK OF TRIGA PULSE, t-MILLISEC
44

I
FIG. 27
TRANSMISSIVITY DURING. RUNS E-1 THROUGH E-4 AT 500 C FOR TIMES UP TO 160 MILLISEC AFTER TRIGA PULSE
SPECIMEN SC 62-5
WAVELENGTH, x = 0.215 MICRON
SYMBOL
0 0 A 0
RUN FRACTIONAL BY PASS
CORRECTION ( "'0 ) R E F TO l / I n A T t = O
0.725
0.738 0.725 0.718
0.080 0.086 0.085
o n87
TIME FROM PEAK OF TRIGA PULSE, t-MILLISEC
45

FIG. 28
TRANSMISSIVITY DURING RUNS E-1 THROUGH E-4 AT 500 C FOR TIMES LONGER THAN 100 MILLISEC AFTER TRIGA PULSE
SPECIMEN SC 62-5
WAVELENGTH& 0 2 1 5 MICRON
0.725 0.738
E-3 0.725
E-4 O.Tl8
1.2
1 .o
l- 0.6
n
a u n z
w l-
0.2
0
46

I
TdANsMlSSlVlTY DURING RUNS E-5 THROUGH E-7 AT 900 C FOR TIMES UP TO 160 FLG. 29
MILLISEC AFTER TRIGA PULSE SPECIMEN SC 62-5
WAVELENGTH, = 0.215 MICRON
-40 0 40 120 160 ' 9 x 1 0 5 TIME FROM PEAK OF TRIGA PULSE, t-MILLISEC
47
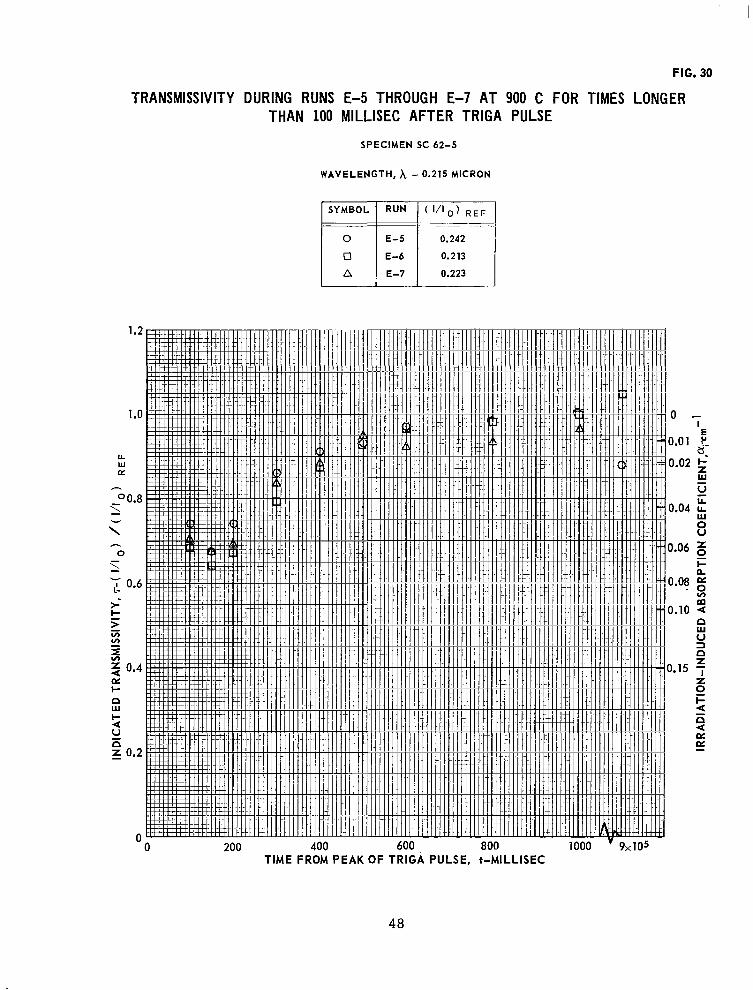
FIG. 30
TRANSMISSIVITY DURING RUNS E-5 THROUGH E-7 AT 900 C FOR TIMES LONGER THAN 100 MlLLlSEC AFTER TRIGA PULSE
SPECIMEN SC 62-5
WAVELENGTH, A = 0.215 MICRON
I SYMBOL RUN
E-5
E-6
E-7
( '"0) R E F
0.242
0.213
0.223
" 0 200 400 600 aoo 1000 TIME FROM PEAK OF TRIGA PULSE, t-MILLISEC
48

FIG. 31
TRANSMISSIVITY DURING RUNS E-8 THROUGH E-10 AT 300 C FOR TIMES UP TO 160 MlLLlSEC AFTER TRIGA PULSE
SPECIMEN SC 62-5
WAVELENGTH, A = 0.215 MICRON
SYMBOL
0 0 A
RUN
~ ~
~
E-8
E-9
E-11
0
T [I
FRACTIONAL BYPASS ( 111 0 ) R E F CORRECTION
TO I / IoAT t= 0
0.774
0.835
0.080 0.894
0.081
0.088
. . ~
40 a0 120 160 9 x 10⁵
TIME FROM PEAK O F T R I G A PULSE, t-MILLISEC
49

FIG. 32
TRANSMISSIVITY DURING RUNS E-8 THROUGH E-10 AT 300 C FOR TIMES LONGER THAN 100 MlLLlSEC AFTER TRIGA PULSE
SPECIMEN SC 62-5
WAVELENGTH, X = 0.215 MICRON
SYMBOL
0 0 a
TIME FROM PEAK OF TRIGA PULSE, t-MILLISEC
50

FIG. 33
COMPARISON OF TRANSMISSIVITIES AT DIFFERENT TEMPERATURES
WAVELENGTH, X = 0.215 MICRON
SC 62-2 AMBIENT SC 62-5 300 c SC 62-5 E-1 500 C SC 62-5 E-5 900 C
I
I-
51

FIG. 34
SEMI-LOGARITHMIC DECAY OF ABSORPTIVITY FOLLOWING RUNS D-1 THROUGH D-4 A T 700 C
SPECIMEN SC 62-4 WAVELENGTH A = 0.215 MICRON
D-3
A D-4
TIME FROM PEAK OF TRIGA PULSE, t-MILLISEC
52

FIG. 35
SEMI-LOGARITHMIC DECAY OF ABSORPTIVITY FOLLOWING RUNS D-5 AND D-6 AT 800 C
SPECIMEN SC 62-4
WAVELENGTH, A = 0.215 MICRON
0
TIME FROM PEAK OF TRlGA PULSE, t-MILLISEC
53

FIG. 36
SEMI-LOGARITHMIC DECAY OF ABSORPTIVITY FOLLOWING RUNS D-7 AND'D-8 AT 900 C
SPECIMEN SC 62-4
WAVELENGTH , X = 0.215 MICRON
0.5
1
0.02
0.01 0 200 400 600 800 1000
TIME FROM PEAK OF TRIGA PULSE, t-MILLISEC
54

FIG. 37
SEMI-LOGARITHMIC DECAY OF ABSORPTIVITY FOLLOWING RUNS D-9 AND D-12 AT 600 C
SPECIMEN SC 62-4
WAVELENGTH = 0.215 MICRON
SYMBOL
A
q D-12
55
"

FIG. 38
SEMI-LOGARITHMIC DECAY OF ABSORPTIVITY FOLLOWING RUNS E-1 THROUGH E-4 AT 500 C
SPECIMEN SC 62-5
WAVELENGTH, x = 0.215 MICRON
E - 2
E - 4
56

1
0.5
0.2
0.1
0.02
0.01
SEMI-LOGARITHMIC DECAY OF ABSORPTIVITY FOLLOWING RUNS E-5 THROUGH E-7 AT 900 C
SPECIMEN SC 62-5
WAVELENGTH h = 0.215 MICRON
FIG. 39
0 200 400 600 800 1000
TIME FROM PEAK OF TRIGA PULSE, t-MILLISEC
57

FIG. 40
SEMI-LOGARITHMIC DECAY OF ABSORPTIVITY FOLLOWING RUNS E-8 THROUGH E-10 A T 300 C
SPECIMEN SC 62-5
WAVELENGTH, X = 0.215 MICRON
E-10
b K
0, m 4
Z I
I- 2 a n - 4 K K
TIME FROM PEAK OF TRlGA PULSE, t-MILLISEC
. . . .
58

.FIG. 41
VARIATION WITH TEMPERATURE OF REFERENCE IRRADIATION-INDUCED ABSORPTIVITY
WAVELENGTH, A = 0.215 MICRON
I &YJMBgL
D-1 THROUGH D-12
E-1 THROUGH E-10
( 1 - T ) o DEFINED AS VALUE OF STRAIGHT-LINE ,APPROXIMATION OF L0GARI:THMIC DECAY CURVE A T ' t = 0 (SEE FIGS. 34-'40)
W 0 U Z
I- 0 b
SPECIMEN TEMPERATURE-DEG C
59

FIG. 42
VARIATION WITH TEMPERATURE OF TIME CONSTANT FOR BLEACHING IRRADIATION-INDUCED ABSORPTIVITY
WAVELENGTH,X= 0.215 MICRON
I SYMBOL I RUNS
D-1 THROUGH D-12 E-1 THROUGH E-10
OF
60

FIG. 43
VARIATION WITH TEMPERATURE OF
WAVELENGTH
EQUILIBRIUM ABSORPTION
X = 0.215 MICRON
COEFFICIENT
I SYMBOLI RUNS I
0 ' E - 1 THROUGH E-10
200 400 600 800 1000 SPECIMEN TEMPERATURE - DEG C
61

TRANSMISSIVITY DURING RUNS E-12 AND E-16 AT
SPECIMEN SC 62-5
WAVELENGTH
SYMBOL
0 0
WAVELENGTH, x = 0.625 MICRON
E-16 500 C
FIG. 44
OF 0.625 MICRON
I FRACTIONAL BYPASS
-40 40 80 120 160" 1000 TlME-FROM PEAK OF TRIGA PULSE, t-MILLISEC
62
" . . . . .. - . . . . . .

FIG. 45
TRANSMISSIVITY DURING RUN E-15 AT WAVELENGTH OF 1.0 MICRON
SPECIMEN1 SC 62-5
BYPASS CORRECTION ZERO
( V I o ) R E F = 1.73
TEMPERATURE = AMBIENT
63

National Aeronautics and Space Administration WASHINGTON. D. C.
OFFICIAL BUSINESS -
FIRST CLASS MAIL NATIONAL AERONAUTICS AND
SPACE ADMINISTRA'IION
POSTAGE AND FEES PAm
"The aeronautical and space actiuities of the United States shall be conducted so as to contribute . . . to the expansion of human knowl- edge of phenomena in the atmosphere and space. The Administration shall provide for the widest practicable and appropriate dissemination of information concerning its activities and the results thereof."
"NATIONAL hRONAUTICS AND SPACE ACT OF 1958
NASA SCIENTIFIC AND TECHNICAL PUBLICATIONS
TECHNICAL REPORTS: Scientific and technical information considered important, complete, and a lasting contribution to existing.knowle&e.
TECHNICAL NOTES: Information less broad in scope but nevertheless of importance as a contribution to existing knowledge.
TECHNICAL MEMORANDUMS: Information receiving limited distribu- tion because of preliminary data, security classification, or other reasons.
CONTRACTOR REPORTS: Scientific and technical information generated under a NASA contract or grant and considered an important contribution to existing knowledge.
TECHNICAL TRANSLATIONS: Information published in a foreign language considered to merit NASA distribution in English.
SPECIAL PUBLICATIONS: Information derived from or of value to NASA activities. Publications include conference proceedings, monographs, data compilations, handbooks, sourcebooks, and special bibliographies.
TECHNOLOGY UTILIZATION PUBLICATIONS: Information on tech- nology used by NASA that may be of particular inteere; in commercial and other non-aerospace applications. Publications include Tech Briefs, Technology Utilization Reports and Notes, and Technology Surveys.
Details on the availability of these publications may be obtained from:
SCIENTIFIC AND TECHNICAL INFORMATION DIVISION
NATIONAL AERONAUTICS AND SPACE ADMINISTRA.TION
Washington, D.C. 90546