further processing
140
ANNUAL REPORT 2012
Transcript of further processing

ANNUALREPORT
2012

Wh
o w
e ar
e Marel is the leading global provider
of advanced equipment, systems and
services to the poultry, fish, meat and
further processing industries.
GLOBAL PRESENCEWith more than 4,000 employees worldwide, offices and
subsidiaries in some 30 countries, and a network of more than
100 agents and distributors, Marel is in a unique position to
serve its customers wherever they may be located.
ONE COMPANY ... SERVING FOUR INDUSTRIESOur four Industry Centers gather together all the knowledge, expertise and decades of experience accumulated
across our company in each of the four core industries we serve.
FURTHER
PROCESSINGPOULTRY MEATFISH
A SINGLE SOURCEOur brands – Marel, Stork Poultry Processing and
Townsend Further Processing – are among the most
respected in the industry. United in one company, we
offer our customers the convenience of a single source
for products to meet their every need.
INNOVATION: IT’S IN OUR DNAOur annual investment of 5-7% of revenues in
research and development has led to breakthrough
innovations that have transformed the way food is
processed around the world.
POULTRY PROCESSING:
Marel Stork Poultry
Processing product range
offers integrated systems
for processing broilers,
turkeys and ducks.
FISH PROCESSING:
Marel provides advanced
equipment and systems
for salmon and whitefish
processing, both farmed
and wild, onboard and
ashore.
MEAT PROCESSING:
Marel Meat Industry
Center specializes in the
key processes of deboning
and trimming, case ready,
food service and bacon
processing.
FURTHER PROCESSING:
Marel offers an extensive range
of products for portioning,
coating, heat treatment and
sausage-making under the
brand name of Townsend
Further Processing.
See corporate video in online report:marel.com/corpvideo

TA B L E O F C O N T E N T SMarel in figures . . . . . . . . . . . . . . . . . . . . . . . . . . . . . . . . . . . . . . . . . . . . . . . . . . . . . . . . . . 2
Chairman’s address . . . . . . . . . . . . . . . . . . . . . . . . . . . . . . . . . . . . . . . . . . . . . . . . . . . . . . . 4
CEO’s address . . . . . . . . . . . . . . . . . . . . . . . . . . . . . . . . . . . . . . . . . . . . . . . . . . . . . . . . . . . . 6
I. Strategy and finance . . . . . . . . . . . . . . . . . . . . . . . . . . . . . . . . . . . . . . . . . . . . . . . . . . . . 9
Vision . . . . . . . . . . . . . . . . . . . . . . . . . . . . . . . . . . . . . . . . . . . . . . . . . . . . . . . . . . . . . . . . . 10
Strategy . . . . . . . . . . . . . . . . . . . . . . . . . . . . . . . . . . . . . . . . . . . . . . . . . . . . . . . . . . . . . . . 11
Milestones, achievements and events . . . . . . . . . . . . . . . . . . . . . . . . . . . . . . . . . . . . . . . . 12
Financial performance . . . . . . . . . . . . . . . . . . . . . . . . . . . . . . . . . . . . . . . . . . . . . . . . . . . . 14
II. Market overview . . . . . . . . . . . . . . . . . . . . . . . . . . . . . . . . . . . . . . . . . . . . . . . . . . . . . . . 19
Maintaining leadership in a challenging environment . . . . . . . . . . . . . . . . . . . . . . . . . . . . 20
Poultry processing: Innovation creates value . . . . . . . . . . . . . . . . . . . . . . . . . . . . . . . . . 22
Customer story: Hazeldene’s in Australia . . . . . . . . . . . . . . . . . . . . . . . . . . . . . . . . . . . . . . 25
Fish processing: Important role in a growing industry . . . . . . . . . . . . . . . . . . . . . . . . . . . 26
Customer story: Morrisons in Grimsby, UK . . . . . . . . . . . . . . . . . . . . . . . . . . . . . . . . . . . . . . . 29
Meat processing: Food safety and yield are important drivers . . . . . . . . . . . . . . . . . . . . . 30
Customer story: Krasno in the Czech Republic . . . . . . . . . . . . . . . . . . . . . . . . . . . . . . . . . . . . 33
Further processing: Building on customer relationships . . . . . . . . . . . . . . . . . . . . . . . . . 34
Customer story: Salm Partners in the United States . . . . . . . . . . . . . . . . . . . . . . . . . . . . . 37
III. Business operations . . . . . . . . . . . . . . . . . . . . . . . . . . . . . . . . . . . . . . . . . . . . . . . . . . . . 39
Market penetration: Aligning our resources worldwide . . . . . . . . . . . . . . . . . . . . . . . . . . . 40
Service: Sharpening the service edge . . . . . . . . . . . . . . . . . . . . . . . . . . . . . . . . . . . . . . . . 42
Innovation: Innovation is our passion . . . . . . . . . . . . . . . . . . . . . . . . . . . . . . . . . . . . . . . . . 44
Operational excellence: A way of thinking . . . . . . . . . . . . . . . . . . . . . . . . . . . . . . . . . . . . 47
Our people . . . . . . . . . . . . . . . . . . . . . . . . . . . . . . . . . . . . . . . . . . . . . . . . . . . . . . . . . . . . . 48
IV. To our shareholders . . . . . . . . . . . . . . . . . . . . . . . . . . . . . . . . . . . . . . . . . . . . . . . . . . . . . 51
Shares and shareholders . . . . . . . . . . . . . . . . . . . . . . . . . . . . . . . . . . . . . . . . . . . . . . . . . . . 52
CEO and Board of Directors . . . . . . . . . . . . . . . . . . . . . . . . . . . . . . . . . . . . . . . . . . . . . . . . 54
Investor relations . . . . . . . . . . . . . . . . . . . . . . . . . . . . . . . . . . . . . . . . . . . . . . . . . . . . . . . . 56
Risk management . . . . . . . . . . . . . . . . . . . . . . . . . . . . . . . . . . . . . . . . . . . . . . . . . . . . . . . . 58
Corporate governance . . . . . . . . . . . . . . . . . . . . . . . . . . . . . . . . . . . . . . . . . . . . . . . . . . . . 60
V. Consolidated Financial Statements for 2012 . . . . . . . . . . . . . . . . . . . . . . . . . . . . . . . . . 65
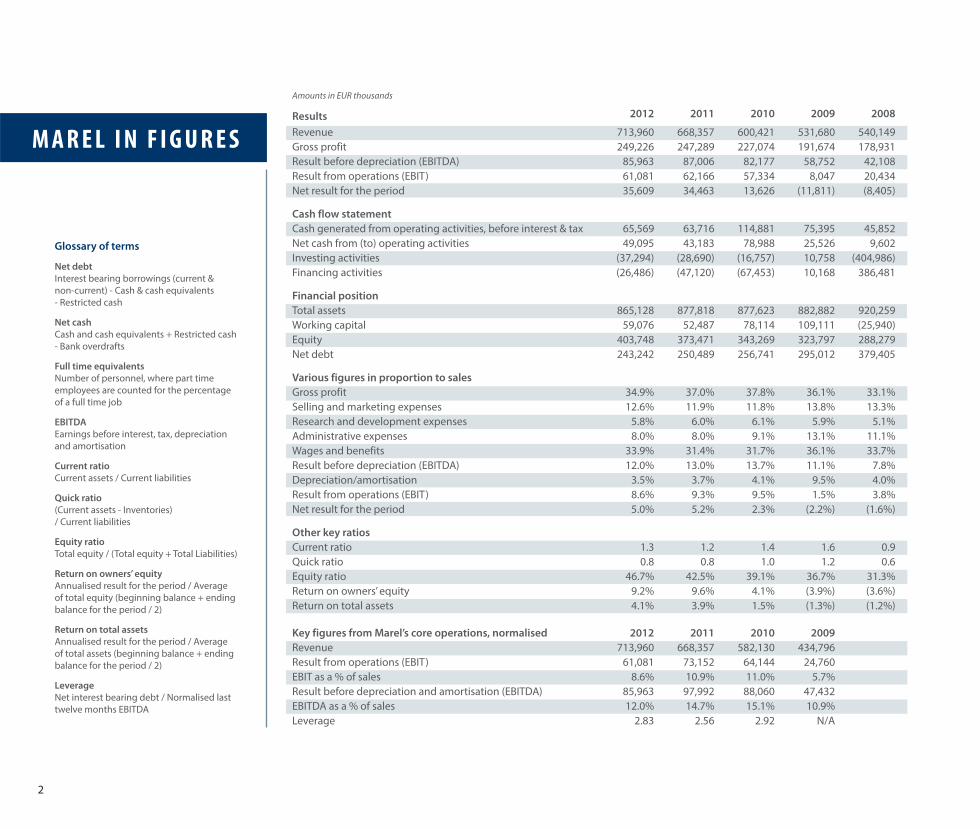
2
Amounts in EUR thousands
Results 2012 2011 2010 2009 2008
Revenue 713,960 668,357 600,421 531,680 540,149
Gross profit 249,226 247,289 227,074 191,674 178,931
Result before depreciation (EBITDA) 85,963 87,006 82,177 58,752 42,108
Result from operations (EBIT) 61,081 62,166 57,334 8,047 20,434
Net result for the period 35,609 34,463 13,626 (11,811) (8,405)
Cash flow statement
Cash generated from operating activities, before interest & tax 65,569 63,716 114,881 75,395 45,852
Net cash from (to) operating activities 49,095 43,183 78,988 25,526 9,602
Investing activities (37,294) (28,690) (16,757) 10,758 (404,986)
Financing activities (26,486) (47,120) (67,453) 10,168 386,481
Financial position
Total assets 865,128 877,818 877,623 882,882 920,259
Working capital 59,076 52,487 78,114 109,111 (25,940)
Equity 403,748 373,471 343,269 323,797 288,279
Net debt 243,242 250,489 256,741 295,012 379,405
Various figures in proportion to sales
Gross profit 34.9% 37.0% 37.8% 36.1% 33.1%
Selling and marketing expenses 12.6% 11.9% 11.8% 13.8% 13.3%
Research and development expenses 5.8% 6.0% 6.1% 5.9% 5.1%
Administrative expenses 8.0% 8.0% 9.1% 13.1% 11.1%
Wages and benefits 33.9% 31.4% 31.7% 36.1% 33.7%
Result before depreciation (EBITDA) 12.0% 13.0% 13.7% 11.1% 7.8%
Depreciation/amortisation 3.5% 3.7% 4.1% 9.5% 4.0%
Result from operations (EBIT) 8.6% 9.3% 9.5% 1.5% 3.8%
Net result for the period 5.0% 5.2% 2.3% (2.2%) (1.6%)
Other key ratios
Current ratio 1.3 1.2 1.4 1.6 0.9
Quick ratio 0.8 0.8 1.0 1.2 0.6
Equity ratio 46.7% 42.5% 39.1% 36.7% 31.3%
Return on owners’ equity 9.2% 9.6% 4.1% (3.9%) (3.6%)
Return on total assets 4.1% 3.9% 1.5% (1.3%) (1.2%)
Key figures from Marel’s core operations, normalised 2012 2011 2010 2009
Revenue 713,960 668,357 582,130 434,796
Result from operations (EBIT) 61,081 73,152 64,144 24,760
EBIT as a % of sales 8.6% 10.9% 11.0% 5.7%
Result before depreciation and amortisation (EBITDA) 85,963 97,992 88,060 47,432
EBITDA as a % of sales 12.0% 14.7% 15.1% 10.9%
Leverage 2.83 2.56 2.92 N/A
Glossary of terms
Net debt
Interest bearing borrowings (current &
non-current) - Cash & cash equivalents
- Restricted cash
Net cash
Cash and cash equivalents + Restricted cash
- Bank overdrafts
Full time equivalents
Number of personnel, where part time
employees are counted for the percentage
of a full time job
EBITDA
Earnings before interest, tax, depreciation
and amortisation
Current ratio
Current assets / Current liabilities
Quick ratio
(Current assets - Inventories)
/ Current liabilities
Equity ratio
Total equity / (Total equity + Total Liabilities)
Return on owners’ equity
Annualised result for the period / Average
of total equity (beginning balance + ending
balance for the period / 2)
Return on total assets
Annualised result for the period / Average
of total assets (beginning balance + ending
balance for the period / 2)
Leverage
Net interest bearing debt / Normalised last
twelve months EBITDA
M A R E L I N F I G U R E S

A N N UA L R E P O R T 2 0 1 2 3
Others2% Fish
18%
Poultry54%
Meat13%
FurtherProcessing
13%
Sales in 2012, by business segments
North America25%
Other countries26%
Iceland1%
Europe other45%
Sales in 2012, by geographical location
The Netherlands 3%
Note: The figures to the left are from the
consolidated accounts of Marel. For key
figures from Marel’s normalised core
operations, see relevant section on page 2.
For further information, see chapter on
Financial performance on pages 14-17.
Revenues
2008 2009 2010 2011 2012
700
600
500
400
300
200
100
0
EU
R m
illio
n
EBITDA
2008 2009 2010 2011 2012
100
80
60
40
20
0
Equity ratio
2008 2009 2010 2011 2012
75%
50%
25%
0
Revenues and profi t from operations (EBIT)
as percentage of revenues
2008 2009 2010 2011 2012
700
600
500
400
300
200
100
0
Revenues EBIT as ratio of revenues
14%
12%
10%
8%
6%
4%
2%
0%
Number of employees (FTEs), average per year
2008 2009 2010 2011 2012
4,000
3,000
2,000
1,000
0
EU
R m
illio
n
EU
R m
illio
n
6.5%
6.0%
5.5%
5.0%
4.5%
4.0%
R&D expenses R&D expenses as % of revenues
Research and development expenses
2008 2009 2010 2011 2012
50
40
30
20
10
0
EU
R m
illio
n

4
We are proud of what we have accomplished. We are equally excited about
Marel’s future potential. Marel is at the center point of prevailing trends
which are driving global economic development.
Our commitment to providing sustainable value has led to continuous
advancement in how food is processed, benefitting consumers all over the
world. Marel is the partner of choice in the production of high-quality food
that is affordable, convenient, nutritious and environmentally friendly.
With a proven business model based on market penetration, innovation
and operational excellence, Marel has grown revenues organically by 29%
in the past four years, a period which has been economically challenging.
At the same time we have introduced a steady pipeline of new products
and strengthened our sales and service network.
Sales network in all regions of the world
Marel is a truly global company with around 50% of new equipment
sales originating from markets outside the more established markets in
North America and Western Europe, compared with around 20% a few
years back.
Sales of greenfield projects today will increase the installment base in
new markets, leading to additional sales of standard equipment and
maintenance services down the road. We serve our clients on a global
basis through our extensive sales and service network that spans over 30
countries in all regions. All in all, Marel´s underlying quality of earnings
remains high.
Last year I had the opportunity to visit our dedicated employees and
long-term customers in Argentina, Uruguay and Brazil. Our clients in
those countries operate highly automative and advanced beef and poultry
processing plants. I am convinced that our opportunities in this region are
immense in the near future.
The global middle class is growing
Our industry is directly benefitting from prevailing trends. Urbanization
continues at an enormous pace in emerging markets, resulting in a
rise in average family incomes, which in turn drives increased protein
consumption. Moreover, the demand for convenience food is rising on a
global scale.
C H A I R M A N ’ S A D D R E S S

A N N UA L R E P O R T 2 0 1 2 5
In the past 20 years, our industry has been growing at a fast pace. That
will continue. In the next two decades or so, the economic landscape will
totally transform. The number of active consumers will be relatively stable
in North America and Europe, including Russia, while we can expect to
see multiple growths in South America, Africa and Asia Pacific resulting in
the total number of active consumers rising to around 5 billion, compared
with around 2 billion currently. An active consumer is defined as a person
belonging to a family that has a steady income stream high enough to
serve for base consumption.
Sustainability is a core driver
For decades, Marel has worked closely with the world’s most forward
thinking food processors in their unceasing quest for new ways of
optimizing their processes and increasing yield.
Arni Oddur Thordarson
Chairman of the Board
3,228
654
1,002
1,740
473
1,036
525
318
1,002
5,000
4,000
3,000
2,000
1,000
0
Mill
ion
s
20302010 2020
x6
x2
x1
Multiplier
The number of active consumers is growing globally
8,3006,900
60%30%
World population in millions
Active consumers as % of population
Source: OECD (households with daily expenditures [PPP] from 10-100 USD per person)
Today, business is not only about increasing yield, it is about reducing
Marel’s customers’ reliance on scarce resources. A great example of
this is our poultry AeroScalder that enables our customers to reduce
water usage by 75% and energy consumption by 50%, thus lowering
considerably CO2 emissions. Another important example of how Marel
meets the challenges facing processers is the advanced flowlines and
Innova software, which enable automatic traceability through the entire
value chain.
Ready for the future
Marel’s clients in historically strong markets in USA and Europe
have been delaying modernization of their equipment in the recent
economic turmoil, while underlying demand for healthy and convenient
food continues to grow. It is clear that the US market, especially, is
underinvested, which will most likely result in increased demand for
advanced solutions and standard equipment in the near-term.
Now acting as one company and a market driven organization, Marel
is fully ready to serve current and future customers in all regions of
the world. In recent years, Marel has invested well in market oriented
infrastructure. Marel is committed to continue investing above industry
standards in innovation, thereby securing a strong pipeline of new
solutions tailored to market needs.
I want to thank the Marel team for their committed work in recent years.
Our competitive position is excellent, and we are well positioned to
capture great value from prevailing trends. At the same time, we need to
stay vigilant with strict focus on lean operations with the aim of delivering
increased value to customers and shareholders.
Asia Pacific
Latin America,
Middle-East & Africa
North-America and
Europe, incl. Russia

6
Marel’s two-phased strategy was announced during the Annual General
Meeting in 2006. We are now implementing the second phase of this
strategy. In phase one, Marel’s growth was fuelled by acquisitions, which
were concluded with the acquisition of Stork Food Systems in 2008.
We are now in the middle of the second phase, where our focus is on
strong organic growth.
Healthy growth in 2012
Despite rather difficult market conditions in 2012, Marel’s revenues
grew by a healthy 6.8% compared to the previous year. The market
showed some slowdown in 2012 and therefore the growth rate of recent
years could not be maintained. Growth drivers are our global market
presence and commitment to innovation. Marel also made steps forward
in operational excellence, such as significant improvements in several
manufacturing locations.
Market situation
In general, the market situation in 2012 was not favorable. Nevertheless,
Marel’s revenue growth was well above market growth.
The major markets for Marel’s Poultry Industry Center are Western Europe
and USA. These two markets were difficult last year due to the global
economic situation, but above all because of higher feed costs. Poultry
customers were unable to raise their prices to offset higher feed costs,
which put their margins under pressure. In the second half of 2013, we
expect significant improvements in this situation, especially in USA. Marel
realized important projects in growing markets such as China, South Korea
and Brazil.
Moreover, the pork market was not in a strong position in 2012. Pork
producers were struggling on account of higher feed prices as well as
from overproduction in their markets. Several pork producers faced quite
difficult situation in 2012.
Marel maintained a solid revenue base in Further Processing and showed
very strong growth in the Fish segment. All in all, Marel revenues grew by a
solid 6.8% in the face of challenging economic conditions, which I see as a
great achievement by the hard working team at Marel.
C E O ’ S A D D R E S S

A N N UA L R E P O R T 2 0 1 2 7
Innovation
Innovation is one of the cornerstones of our strategy. Marel invests 5-7%
of revenues in innovation annually, and in 2012 we launched 57 new
products. By continuously bringing new products and solutions to our
customers, Marel contributes to improved profitability in the industry. Our
aim is that each new product has a payback time shorter than two years.
In all our industries we had major releases of new products. At the Brussels
seafood exhibition we introduced the new MS 2730 filleting machine. In
the further processing market, Marel launched the unique ModularOven,
which gives our customers endless new cooking possibilities. A new
version of the StreamLine has been launched in the meat industry, and
the first sales have already been concluded. Finally, during the EuroTier
show, Marel received a prestigious innovation award for the AeroScalder -
an innovation which reduces both energy and water consumption and is
therefore recognized as a major contribution to sustainability.
To sum up, as in previous years we launched great innovations in 2012,
which will improve the profitability of our customers while ensuring future
revenues for Marel.
Market oriented organization
Two years ago Marel changed from a more or less product oriented
organization into a market oriented one. We established four industry
centers: Poultry, Meat, Fish and Further Processing. These industry centers
are all focused on the four markets we are serving. Excellent first results of
this reorganization are clearly seen in all our industries. In particular, our
activity serving the fish industry has brought about very strong growth of
21%, which we attribute to the new market oriented approach. In 2013,
we expect that our four industry centers will further strengthen, enabling
Marel to become even more focused on our core markets and loyal
customers.
Outlook
Supported by recent industry reports, we expect our market to continue
growing in coming years. Marel is excellently positioned to serve this
ever-expanding market. With our wide global network and focus, Marel is
capable of achieving strong growth in coming years. Looking at 2013, we
expect that our major poultry markets in Europe and USA will improve.
We could start to see this in the second half of the year, when Marel will be
poised to resume the growth rate of past years.
Finally, I want to express my appreciation to our employees. When I am
travelling to our operations, I am always impressed by the dedication and
passion our employees have for what they are doing. Therefore, we pay
special attention to the Marel team in this year’s Annual Report.
Theo Hoen
Chief Executive Officer
See video introduction in online report:
marel.com/ceo

8
COLOMBIA,where Marel recently
opened an offi ce, produces
more than a million tonnes
of chicken a year
In the last decade,
BRAZILhas overtaken the
European Union as both the
2nd largest producer of beefand the 3rd largest of
chicken, and is currently
the world‘s largest
exporter of chicken
S-AMERICA
PERUis the world‘s largest
producer of
pelagic fi shand the 3rd largest of
seafood
In 2012, a new regional structure for South America was implemented
Close to 200 people work for Marel in fi ve
locations across South America

A N N UA L R E P O R T 2 0 1 2 9
STRATEGYAND
FINANCE

10
V I S I O N
Marel’s vision is to be
the customers’ choice in
supplying integrated systems,
products and services to
the poultry, fish and
meat industries.

A N N UA L R E P O R T 2 0 1 2 11
S T R AT E G Y In 2012, Marel celebrated 20 years of being listed on Nasdaq OMX Iceland.
Now a market leader in providing systems, products and services to the protein
industry, the Company has grown from its humble beginnings as a research project
at the University of Iceland. Today, Marel is the largest company listed with more than
2,000 shareholders. It is fair to say that the continued support of shareholders and
other fi nancial partners has supported Marel in becoming an international leader.
The year 2012 was about maintaining strategic focus in a climate of challenging
economic conditions, especially in Europe and North America. The growth strategy
set in 2006 has been Marel’s guiding light in all parts of its operations. Its foothold is
the new market-driven organisation that aims to bring all employees together in one
Marel, serving customers in the fi sh, meat and poultry industries.
Marel keeps its ear to the ground, communicating constantly with its customers
worldwide. This is refl ected in the Company’s strong commitment to innovation for
the benefi t of its customers, consumers, shareholders and all other stakeholders.
An important factor in executing the Company’s strategy is strengthening and
expanding the sales and service network around the globe, which is Marel’s fi rst line
of contact for customers at the local level. The Marel promise is to bring fi rst-rate
service, consistency and continuity to its partnership with customers.
Many other projects are underway to align the Company’s resources towards reaching
strategic goals. The management of the Company is well aware that the key to any
successful business is the people who work together as a team to deliver benefi ts to
customers.
The 4,000 people of Marel are based in over 30 locations on six continents. They have
diff erent backgrounds, education and experience but they share common Marel
values and goals. The following summary of milestones shows only a fraction of what
the Marel team has achieved in 2012, and how their activities are supporting the
Company’s strategy.
S T R A T E G Y A N D F I N A N C E
External growth Integration Organic growth
2005 2006 2007 2008 2009 2010
* Target
2015*
129
1,000
2011
714
2012
6.5%
6.0%
5.5%
5.0%
4.5%
4.0%
R&D expenses R&D expenses as % of revenues
Research and development expenses
2008 2009 2010 2011 2012
50
40
30
20
10
0
EU
R m
illi
on
Marel’s growth strategy

12
JANUARY FEBRUARY MARCH APRIL MAY JUNE
Sales and Service Unit in Benelux launches local website
2012
4
24-26International Poultry
Expo, Atlanta
The 11th annual Marel Salmon ShowHow inNorresundby, Denmark
1
Marel awarded ‘Knowledge Company of the Year’ in Iceland
15
A new internal communications
platform launched
17
27-30Anuga FoodTec
exhibition, Cologne
Marel Blues Project plays at Reykjavik
Blues Festival
3
Top results for Marel at the Seafood Processing
show, Brussels
24-26
Marel’s Meat and FurtherProcessing sales divisions join
forces in North America
21
Marel’s Further Processing Industry
Center moves to a new offi ce in Boxmeer
4 Marel Live TV for sales training
premieres
20
Twenty years of trading on Nasdaq OMX Iceland
29
was an exciting and productive year
for Marel. The people of Marel around
the globe have shown that through
team work and commitment important
milestones can be achieved. The Company
is well placed for future endeavours.
M I LESTON ES, ACHIEVEMENTS AND EVENTS
23The Poultry Industry
Center opens new website
22-24VIV India exhibition,
Bangalore

A N N UA L R E P O R T 2 0 1 2 13
JULY AUGUST SEPTEMBER DECEMBER
20-31‘Make It with Marel Days’ Event in the Lenexa Innovation Center
‘Tour de Marel’ raises close to €50,000 for local charities
15
New HR section launched on marel.com
16
Marel opens theNasdaq market in Times Square, NY
18
Meat ShowHow 2012 in Aarhus, Denmark
23
A regional Salesand Service Unit for Scandinavia is launched
1
Marel wins ‘Marketing Company of the Year 2012’ in Iceland
8
Eleven brand new poultry processing solutions unveiled at EuroTier 2012
EuroTier Golden Innovation Award for AeroScalder
13-16
Coating Customer Event in Boxmeer
21-22
Marel now off ers 19 local websites in 15 languages
29A successful Avicola Porcinos trade show in Buenos Aires
11-13
5-9Sponsoring the World’s Poultry Congress
The success of the 2012 VIV China trade show was a proof of Marel’s strong local
presence in China
23-25
We introduced
57 new products this year
We have
224 active patent families
We applied for a patent on
24 new inventions
We took part in
45 trade shows
We arranged
8 ShowHows and customer events
S T R A T E G Y A N D F I N A N C E
21 Marel extends maturity of fi nancing and converts all loans to senior level
OCTOBER NOVEMBER

14
F I N A N C I A L P E R F O R M A N C E
Marel kicked off 2012 with a strong first quarter, both
in terms of revenues and orders received. As the year
progressed the strong growth of previous quarters slowed
in line with prevailing trends in the global economy.
Overall, 2012 was a good year for Marel with revenues
amounting to EUR 714.0 million compared to EUR 668.4
million in 2011, an increase of 6.8%. The EBIT margin was
8.6%, which is below the Company’s target of 10-12%
return on revenues for the year.1
Order book at acceptable level
Following very good performance in 2011, the year 2012 got off to a good
start with substantial growth in revenues and a strong order book at the
end of first quarter. The rest of the year was marked by slower growth and
a decrease in orders received. Food processors delayed their investment
decisions because of higher feed prices and difficult economic conditions.
The order book at the end of 2012 amounted to EUR 125.4 million
compared to 188.9 million at the end of 2011.
“The year has been challenging due to slower recovery in our most
important markets,” says Erik Kaman, CFO of Marel. “On the positive
side, we know that our customers are delaying their investments; we
are not seeing cancellations of orders. We have maintained our focus on
strengthening our global network, and streamlining our sales and service
teams in order to enhance our customer relationships. We have also
continued to invest considerably in research and development.
1 The figures for 2011 were normalised for one-off costs of 11.1 million in Q2 2011 related to a principle
agreement on the future arrangement of the pensions currently managed by the Stork Pension Fund.
Development of order book in 2012
In EUR million Total Q1 Q2 Q3 Q4 Total 2011 2012 2012 2012 2012 2012
Orders received* 702.4 185.4 179.6 133.1 152.3 650.4
Order book 188.9 189.4 182.6 151.4 125.4 125.4
* Includes service revenues
Erik Kaman,
CFO of Marel.
„The Company can expand
its production capacity
without heavy investments
in facilities and equipment.“

A N N UA L R E P O R T 2 0 1 2 15
2012 results in comparison to normalised core operations of 2011
In EUR mln 2012 2011 Change in %
Revenues 714.0 668.4 7%
Cost of sales (464.7) (421.1) 10%
Gross profit 249.3 247.3 1%
Gross profit margin 35% 37% (6%)
Other operating income 0.5 (0.3) –
Selling and marketing expenses (90.1) (79.8) 13%
Research and development expenses (41.6) (40.3) 3%
Administrative expenses (56.9) (53.7) 6%
Result from operations (EBIT) 61.1 73.2 (17%)
EBITDA 86.0 98.0 (12%)
We aim to strengthen our position as a market leader by bringing a steady
pipeline of innovative products to food processors worldwide that cater
the ever-changing consumer needs.”
The Company’s revenue base remains strong and can generally be divided
into three approximately equal components: 1) the sale of large systems,
often for greenfield projects, 2) the sale of stand-alone equipment and
smaller standardised systems, and 3) service and spare parts. However, last
year large projects generated around 40% of revenues, whereas standard
solutions accounted for less than 25%, lagging behind the previous two
years, resulting in lower gross profit in 2012. Marel’s poultry industry
sector still accounts for over 50% of the company’s revenues; however
there are signs that other segments may grow faster in the coming years.
S T R A T E G Y A N D F I N A N C E
Marel‘s Board of Management
From left:
Sigsteinn Gretarsson, Chief Operating Officer
Theo Hoen, Chief Executive Officer
Erik Kaman, Chief Financial Officer

16
Response to economic environment
In the present economic situation, Marel’s key emphasis will be on
keeping the sustainability of the cost level without lowering the resources
allocated to research and development. According to the strategy laid
out in 2006, Marel is now in its organic growth phase. The Company can
expand its production capacity without heavy investments in facilities
and equipment. “We have taken many important steps in recent years in
order to align the Company’s resources, and to become more efficient
in processes throughout the Company’s operations. This will be the
foundation which supports our long-term business goals. Our guiding
light is operational excellence in every aspect of our business,” says Erik.
“We continue to restrict our investments in working capital by accelerating
our cash conversion cycle. During 2012, we were once again able to
improve our Days of Sales Outstanding and our Inventory Turnover Rate.
However, we were unable to compensate for the impact of decreased
orders received, which resulted in lower down payments on our Work in
Progress at the end of 2012.”
EBIT and cost efficiency
In 2012, the operational profit (EBIT) was 61.1 million, or 8.6% compared to
normalised EBIT of EUR 73.2 million (10.9%) in 2011. “We feel this is a good
result in a difficult environment even though it falls below our target range
of 10-12% of revenues,” says Erik. “The gross profit margin must improve,
and our target is to reach 40% in 3-5 years. We will continue to maintain
a strict focus on rationalisation, manufacturing efficiency and costs.
There are many ongoing projects which aim at streamlining the business
and further reducing Marel’s cost base in a sustainable manner despite
continued growth in line with strategic goals.”
F I N A N C I A L P E R F O R M A N C E
200
180
160
140
120
100
80
60
40
20
0
20%
18%
16%
14%
12%
10%
8%
6%
4%
2%
0%Q1
2011Q2
2011*Q3
2011Q4
2011Q1
2012Q2
2012Q3
2012Q4
2012
Revenues EBIT as % of revenues
EU
R m
illi
on
Revenues of core operations and
normalised EBIT as % of revenues
30
25
20
15
10
5
0
EU
R m
illi
on
Normalised EBITDA from core operations
Q2 2011*
Q32011
Q42011
Q12012
Q22012
Q32012
Q42012
Q12011
* Results are normalised

A N N UA L R E P O R T 2 0 1 2 17
ChangeAt end of quarter Q4 Q1 Q2 Q3 Q4 from Q4 in EUR million 2011 2012 2012 2012 2012 2011
Non-current borrowings 254.3 267.0 262.8 255.0 239.7 (14.6)
Current borrowings 27.1 19.4 19.5 19.5 19.4 (7.7)
Total borrowings 281.4 286.4 282.3 274.5 259.1 (22.2)
Cash and equivalents 30.9 32.2 20.3 13.4 15.9 (15.0)
Net interest bearing debt 250.5 254.2 262.0 261.1 243.2 (7.3)
275
250
225
200
Development of net interest bearing debt
EU
R m
illi
on
Financing
In December 2012, Marel signed agreements with its lenders to amend
and extend the term of present loan facilities from November 2010 by
one year, or to the end of 2016. This important achievement in global,
turbulent financial markets will lead to more efficient financing and
lower financing cost.
Marel’s remaining ISK denominated EUR 7.6 million equivalent bond
issue was repaid during 2012. Thus Marel has removed the remaining
exposure to the Icelandic krona (ISK) in the Group Financing and is now
only financed in EUR and USD in a proportion that gives a good natural
hedge to exposure.
Key events during the year
A dividend of 0.95 euro cents per share, EUR 6.9 million, was paid out
to shareholders, corresponding to about 20% of Company profits for
the year 2011. The Company also purchased treasury shares to cover
employee stock option agreements.
On 1 January 2012, management of the pensions previously under
the purview of the Stork Pension Fund was officially taken over by the
industry-wide Pension Fund for the Metal and Electrical Engineering
Industries (PME) in the Netherlands. The agreement and subsequent
transfer of the pension arrangements to PME is beneficial to Marel as
it eliminates open-ended financial exposure to pension obligations
in the future. At the same time, it safeguards employees’ interests by
establishing a stable and more secure foundation for the pension plans
for the long-term future.
S T R A T E G Y A N D F I N A N C E

18
ASIA & OCEANIAMarel opened
a sales and serviceunit in India
Over 200 people work for Marel in twelve
locations across Asia and Oceania
In three years,
INDIAhas overtaken Australia,
Brazil and the United States
to become
the world‘s leading exporter of
beef
CHINAconsumes more than
half of the global
pork production
NewZealandis the world‘s
largest exporter of
lamb meat,
followed
by Australia

A N N UA L R E P O R T 2 0 1 2 19
MARKETOVERVIEW

20
In 2012, Marel’s strengths as a market oriented organisation with a solid
international network of sales and service, and an unrivalled commitment
to innovation, were put to the test.
The year started off strong, with the order book at the end of first quarter
being at a similar level to the record fourth quarter of 2011. As the year
progressed Marel’s main markets, Europe and North America, struggled
with difficult economic conditions and slower recovery than anticipated.
Food processors were also pressured by higher feed prices. The result was
fewer orders received in the latter half of the year.
M A I N TA I N I N G L E A D E R S H I P I N A C H A L L E N G I N G E N V I R O N M E N T
Global ranking - top 20 processors in meat and poultry in 2012
JBS
Tyson
Smith
field
Cargill
Brasil
Foods
Vion
Marf
rigD
anish C
row
nYuru
n Foods
CPPeople
’s Food
Perdue
Shinew
aySanders
on
Bigard
Bacchoco
Tönnie
s
Hormel
Wayne
Koch Foods
10,000
9,000
8,000
7,000
6,000
5,000
4,000
3,000
2,000
1,000
0
1,0
00
to
nn
es
Poultry
Pork
Beef
Marel’s geographical spread and broad range of solutions spanning from
standard products to large systems for new factories, present Marel with
opportunities to shift emphasis to meet different needs in various markets.
Marel relies on partnerships within the industry based on its longstanding
commitment to innovation. The goal is to bring further benefits to Marel’s
customers and improve the profitability of the protein processing industry
as a whole. There has been consolidation in the food processing industry
resulting in larger players worldwide. Currently, most of the top twenty
meat and poultry processors in the world are long-term Marel customers.
So
urc
e: R
ab
ob
an
k

A N N UA L R E P O R T 2 0 1 2 21
Marel’s four industry centers are experiencing the benefits of the market
oriented structure. Focusing on customers’ needs means that Marel teams
worldwide work together in supporting the customers in their ongoing quest
for improved yield, more efficient processes and new equipment to serve
changing consumer habits.
In conclusion, Marel maintained its leadership position in a challenging
environment by building further on the Company’s strengths. The Company
grew faster than the market during last year, showing a solid revenue growth
of 6.8%. Industry reports predict that the global fish, poultry, pork and beef
markets will grow by 40% until 2030, which increases further the demand for
advanced processing equipment. Marel is well placed to capture the future
growth, and well equipped to deal with fluctuations of demand.
Industry drivers bring social benefits
Marel’s commitment to providing sustainable value has led to continuous
advancement in how food is processed, benefiting consumers all over the world.
• By reducing our customers’ reliance on energy and water,
we promote sustainability and conservation of scarce resources.
• By helping food processors reduce costs and increase efficiency,
we make food more affordable.
• By rapidly responding to ever-changing consumer demand,
we contribute to making mealtime a quality time for families worldwide.
• By improving the handling of raw material and embracing hygienic design principles,
we elevate the quality and nutritional value of food.
• By developing highly advanced inspection and traceability systems,
we ensure that the food we eat is safer.
• By reducing waste by-products and increasing efficiency in food processing,
we help protect the environment.
2000 2020f1980 1990 2010 2030f
600
500
400
300
200
100
0
Fish
25%
Poultry
60%
Pork
42%
Beef
25%
Growth
2010–2030
Mill
ion
to
nn
es
Global production of fish, poultry, pork and beef
40% increase in protein productionin the next twenty years
Sou
rce:
FA
O a
nd
Ra
bo
ba
nk
M A R K E T O V E R V I E W
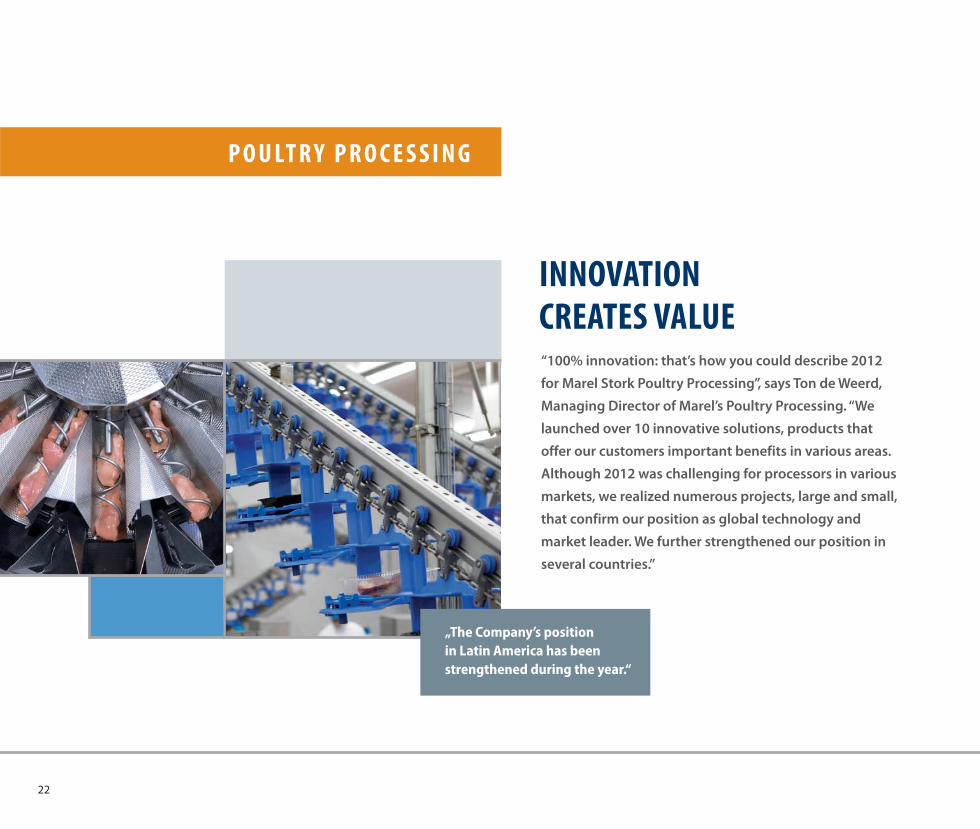
22
“100% innovation: that’s how you could describe 2012
for Marel Stork Poultry Processing”, says Ton de Weerd,
Managing Director of Marel’s Poultry Processing. “We
launched over 10 innovative solutions, products that
offer our customers important benefits in various areas.
Although 2012 was challenging for processors in various
markets, we realized numerous projects, large and small,
that confirm our position as global technology and
market leader. We further strengthened our position in
several countries.”
INNOVATION CREATES VALUE
P O U LT R Y P R O C E S S I N G
„The Company’s position
in Latin America has been
strengthened during the year.“
A N N UA L R E P O R T 2 0 1 2 23
Innovation
Important drivers behind the many innovative Marel Stork solutions
launched in 2012 are the challenges that many processors face day in day
out. Those challenges include rising costs, e.g. for feed, energy and water,
the availability of labor and the ever growing demand for more and safer
end products.
This is where Marel’s innovative solutions like TrayTrack, SmartWeigher
and IRIS contribute to better selection and product allocation in various
steps in the process by raising overall process efficiency. Ton de Weerd
explains: “Our new Final Inspection Machine (FIM-20 RotoVac RS) sets the
new standard in product cleanliness and solutions like the new Linear
RoboBatcher and the Multihead Weigher Fresh Products lower giveaway.”
The new products, developed in cooperation with our customers, were
well received during their launch at EuroTier. The AeroScalder was awarded
with the Golden Medal for Innovation by the EuroTier organization. The
innovations will contribute to further growth of the Company over the
next few years.
Growth and consolidation
In the Far East Marel successfully realized several key projects, among
them large scale greenfield plants that offer the most complete, automatic
high speed processing solutions for processing broilers and a high
capacity duck processing line (6,000 bph). In China we strengthened local
presence further by scaling up the sales and service teams and by starting
the production of parts of the processing lines in the Marel facility.
Besides high speed primary processing, chances for further automation
of cut-up and also further processing are being capitalized. Food safety
and full traceability are important themes, especially for the growing
international food service and fast food companies in this region. With its
expertise Marel is optimally suited to support these important distribution
channels of poultry products.
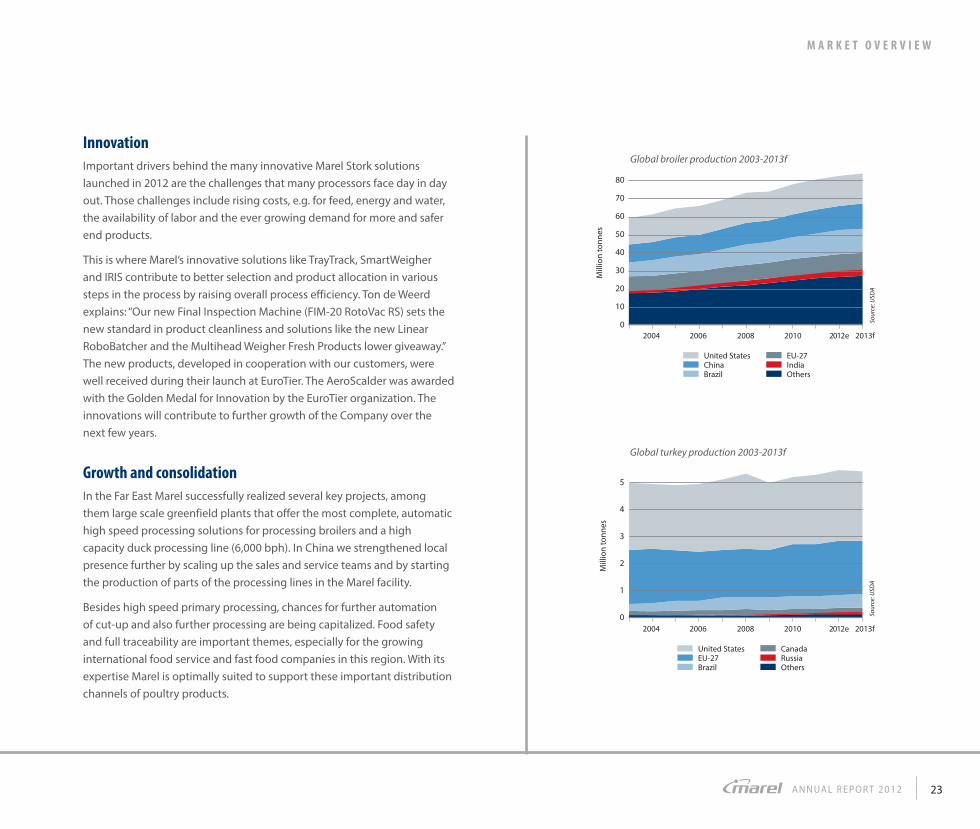
80
70
60
50
40
30
20
10
0
United StatesChinaBrazil
EU-27IndiaOthers
Global broiler production 2003-2013f
Mill
ion
to
nn
es
Sou
rce:
USD
A
2004 2006 2008 2010 2013f2012e
5
4
3
2
1
0
United StatesEU-27Brazil
CanadaRussiaOthers
Global turkey production 2003-2013f
Mill
ion
to
nn
es
Sou
rce:
USD
A
2004 2006 2008 2010 2013f2012e
M A R K E T O V E R V I E W
24
M E E T O U R P E O P L Emarel.com/people
Marel is a place where
commitment,quality,teamwork
second to none and service are
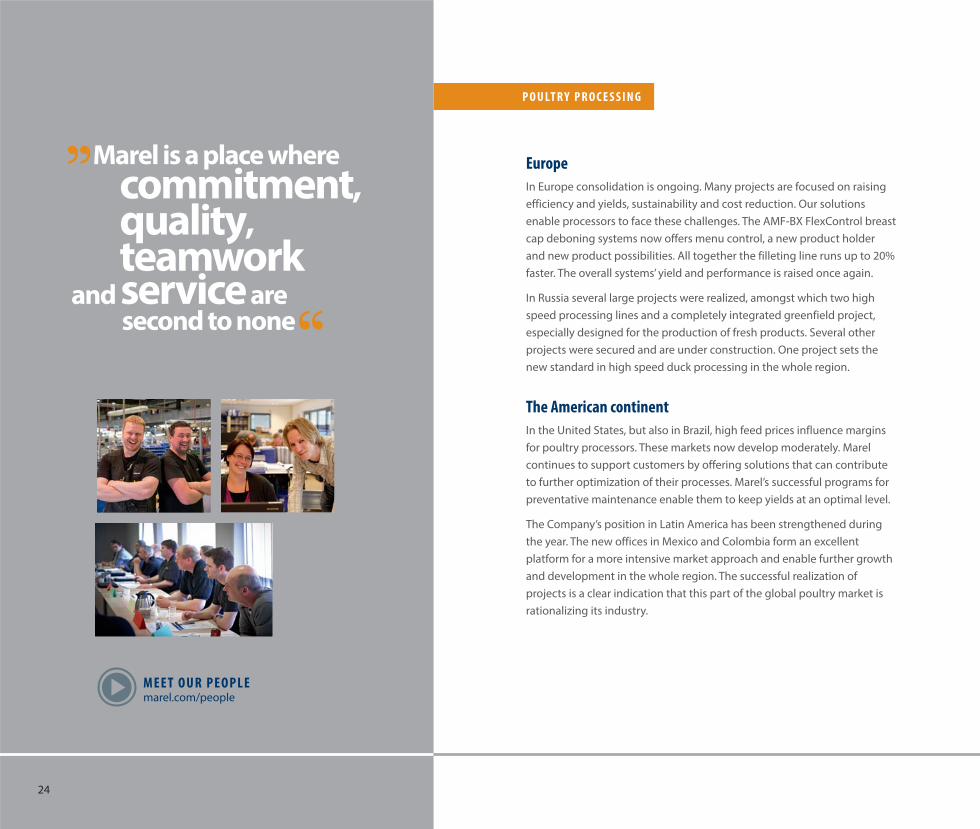
Europe
In Europe consolidation is ongoing. Many projects are focused on raising
efficiency and yields, sustainability and cost reduction. Our solutions
enable processors to face these challenges. The AMF-BX FlexControl breast
cap deboning systems now offers menu control, a new product holder
and new product possibilities. All together the filleting line runs up to 20%
faster. The overall systems’ yield and performance is raised once again.
In Russia several large projects were realized, amongst which two high
speed processing lines and a completely integrated greenfield project,
especially designed for the production of fresh products. Several other
projects were secured and are under construction. One project sets the
new standard in high speed duck processing in the whole region.
The American continent
In the United States, but also in Brazil, high feed prices influence margins
for poultry processors. These markets now develop moderately. Marel
continues to support customers by offering solutions that can contribute
to further optimization of their processes. Marel’s successful programs for
preventative maintenance enable them to keep yields at an optimal level.
The Company’s position in Latin America has been strengthened during
the year. The new offices in Mexico and Colombia form an excellent
platform for a more intensive market approach and enable further growth
and development in the whole region. The successful realization of
projects is a clear indication that this part of the global poultry market is
rationalizing its industry.
P O U LT R Y P R O C E S S I N G

A N N UA L R E P O R T 2 0 1 2 25
CUSTOMER STORY
Adam Hazeldene, Technical Services Manager at Hazeldene’s
See AeroScalder at EuroTier:
marel.com/aeroscalder
M A R K E T O V E R V I E W
Product spotlight
SmartWeigher SmartWeigher is the all new whole product weighing module of the
ACM-NT high-speed cut-up system for broilers. The system gives
excellent weighing results at very high speed. It combines Marel’s
latest knowledge of accurate weighing in the dynamic environment
of the northern seas with decades of experience in poultry processing.
Hanging in the cut up shackle and without acceleration or deceleration,
products are weighed in line.
The SmartWeigher’s design is simple, robust and very compact. Once
installed it is virtually maintenance-free. The cost of ownership is
extremely low. SmartWeigher is made to work: it is a perfect example of
how Marel makes equipment simpler by integrating technical solutions
in an intelligent way.
Hazeldene’s in Australia
“The Stork AeroScalder has improved efficiencies and streamlined our
operation. It’s just another in a long line of Marel Stork Poultry Processing
solutions that we have invested in at Hazeldene’s and it will not be the last,”
says Adam Hazeldene, Technical Services Manager at Hazeldene’s (Bendigo,
Australia).
The all new AeroScalder, that uses moisturized air to scald broilers,
integrates seamlessly into the GP live bird handling system and the CAS
Multiphase Stunning systems that Hazeldene’s acquired earlier. The new
setup makes Hazeldene’s the most modern poultry processing plant in
Australia. Adam Hazeldene says: “The new equipment has proven to be a
successful upgrade on all fronts. The AeroScalder is good for the product
quality, the productivity and the environment. It uses up to 75% less water
and up to 50% less energy than conventional systems.”
The Stork AersoScalder helps significantly in reducing Hazeldene’s carbon
footprint. With the cost of carbon now being a major factor for Australian
businesses, a reduction in carbon use is paramount.
See SmartWeigher in action:
marel.com/smartweigher

26
F I S H P R O C E S S I N G
“Marel has facilitated innovation in our customers’ fish
processing operations throughout 2012, and it is clear that
facilitating and driving innovation will remain Marel’s key
role in the seafood industry’s bright future,” says Jón Birgir
Gunnarsson, General Manager of Marel’s Fish Industry
Center. “We use our extensive knowledge of fish processing
to focus on defining the needs of our customers, and
provide advice on how we can add value with machinery,
innovations and ongoing service.“
IMPORTANT ROLE IN A GROWING INDUSTRY
Customer focus in foreground
In 2012, Marel’s fish industry team has followed its strategy that puts fish
processing and customer focus in the foreground. The strategy builds
on the three pillars of sales – service – innovation. In practice, this means
strategically implementing processing knowledge into systems on all levels,
thereby raising the overall service level to Marel’s customers. It is Marel’s
goal to add even further value to customers by systematically integrating
processing knowhow into our solutions. „Many of the Company’s greatest innovations
originate from partnerships where we
have combined the customer’s processing
knowledge with our technical know-how.“

A N N UA L R E P O R T 2 0 1 2 27
Marel has always placed much emphasis on developing strong
partnerships within the industry. Many of the Company’s greatest
innovations originate from partnerships where we have combined
the customer’s processing knowledge with our technical know-how.
In today’s challenging marketplace, many companies are very much
driven by ongoing improvements to their efficiency, yield and value
creation, which make them an ideal fit with Marel.
The fish industry is very dynamic, but various external factors affect
industry players differently. Since Marel is serving both captured and
farmed fish needs, the Company responds to different challenges
in both segments. The general slowdown in the world economy in
2012 has affected the seafood industry, and has not passed Marel
unnoticed. At the same time, these challenging market conditions
present opportunities for Marel to provide individual customers with
solutions to improve overall efficiency in their operations.
In 2012, we put great emphasis on maintaining our strong position
in the traditional salmon and whitefish producing markets, where we
delivered several important projects during the year. Moreover, we
are aware of the strategic importance of reaping growth potentials
in emerging markets where we are expanding our presence to grow
opportunities.
Building on previous successes in China
Marel had a strong focus on China in 2012. The combination of a
challenging labor market and higher operating costs has increased
the demand for more automation in China. This creates a niche for
Marel’s economic and labor-saving solutions, which deliver faster
processing times, increased yield and improved product handling, as
well as better management tools.
5
4
3
2
1
0
Pacifi c cod Atlantic cod
Global production of farmed tilapia and pangasius
Global production of cod
Global production of farmed salmon
2003 2004 2005 2006 2007 2008 2009 2010 2011 2012e 2013f
2003 2004 2005 2006 2007 2008 2009 2010 2011 2012e 2013f
2003 2004 2005 2006 2007 2008 2009 2010 2011 2012e 2013f
Mill
ion
to
nn
es
Mill
ion
to
nn
es
Mill
ion
to
nn
es
1.5
1.0
0.5
0
2.0
1.5
1.0
0.5
0
TilapiaPangasius
(incl. channel catfi sh)
Pacifi c salmon Atlantic salmon
M A R K E T O V E R V I E W
So
urc
e: F
AO
an
d G
rou
nd
fish
Fo
rum
So
urc
e: F
AO
an
d G
rou
nd
fish
Fo
rum
So
urc
e: F
AO
an
d G
rou
nd
fish
Fo
rum

28
M E E T O U R P E O P L Emarel.com/people
Early in 2012, Marel concluded its largest-ever single sale to the fish
processing industry with a seafood processor in northeast China. The new
whitefish processing flowlines feature solutions specifically developed to
meet the requirements of Chinese fish processors. Furthermore, rapidly
changing consumer behavior will create further opportunities for more
sophisticated Marel products in the future.
Aligning resources
A running theme in 2012 has been to align the Company’s resources to
achieve further synergies between the three key components of sales,
service and innovation. We have begun to reap the benefits of our clear
strategy, which is feeding into increasing profits and is expected to
continue to build on Marel’s successes.
Innovation and research in fish processing technology are at the core
of Marel’s Fish Industry Center. There has been a switch in focus from
‘machines’ to ‘processing technology’ with a strong emphasis on research
projects. To strengthen further its position in the fish industry, Marel
created a new research team. The company believes that it is critical
to understand the underlying mechanisms of “why things work“
or “why things do not work“ before transferring knowledge
into equipment.
F I S H P R O C E S S I N G
Workingin a global team
in a global company,really feelslike you can
make a difference!

A N N UA L R E P O R T 2 0 1 2 29
Morrisons in Grimsby, UK
Morrisons is the first supermarket chain in the UK to take on responsibility for the
whole fish processing chain, from source to shelf. Marel was Morrison’s partner of
choice for complete processing lines for white fish and salmon.
“It was very important to us early on in the project to select people that we knew
and trusted, and because of the short time frame – effectively we had to complete
the first phase in six months – we wanted Marel,” says Howard Sims, Managing
Director of the Grimsby plant. “We’re absolutely delighted with the equipment that
we’ve got. It was on time, within budget, and it’s working well.”
Howard Sims and Rob Smith, Head of Operations, are the innovators behind this
business idea. In addition to securing the supply of fish to Morrisons, improving
quality and freshness were at the core of the business plan. “We’re going directly
to the source,” says Rob, “making sure that we shorten the logistics chain into this
business, trying to take four days out of it in order to get the freshest fish possible
into the facility. Using the Innova system – giving it traceability all the way through
– the factory is helped tremendously.”
CUSTOMER STORY
Howard Sims, Managing Director of the Grimsby plant
Rob Smith, Head of Operations
M A R K E T O V E R V I E W
See fish industry video:
marel.com/fishvideo
See video interviews and factory buildup:
marel.com/morrisons
Product spotlight
Standard FlowlineMarel’s Standard Flowline for the fish industry, with a focus
on Tilapia, was demonstrated for the first time at the Seafood
Exhibition, in Brussels. The new flowline for manual trimming
and filleting is developed specifically to meet the requirements
of processors in China and other emerging markets, where
processing needs are changing as this traditional labor-intensive
industry develops in favor of a higher level of automation. The
flowline provides quality control assurance and full product
traceability throughout processing, and gives processors more
flexibility to compete in a very competitive industry.
30
M E AT P R O C E S S I N G
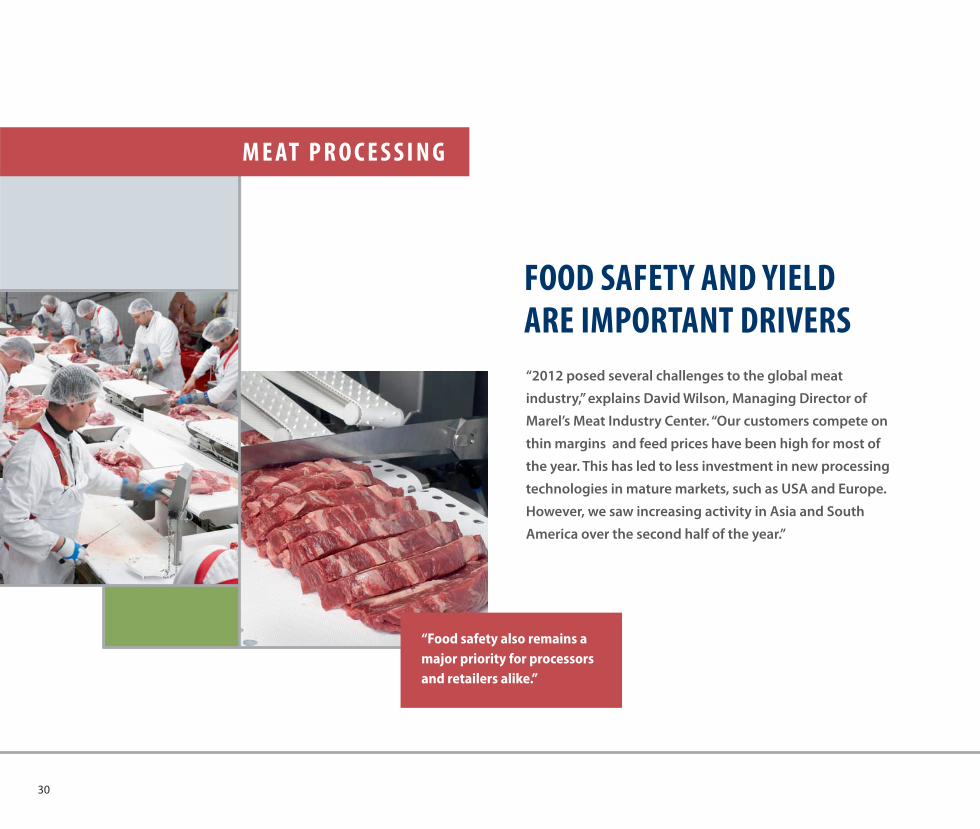
“2012 posed several challenges to the global meat
industry,” explains David Wilson, Managing Director of
Marel’s Meat Industry Center. “Our customers compete on
thin margins and feed prices have been high for most of
the year. This has led to less investment in new processing
technologies in mature markets, such as USA and Europe.
However, we saw increasing activity in Asia and South
America over the second half of the year.”
FOOD SAFETY AND YIELD ARE IMPORTANT DRIVERS
“Food safety also remains a
major priority for processors
and retailers alike.”
A N N UA L R E P O R T 2 0 1 2 31
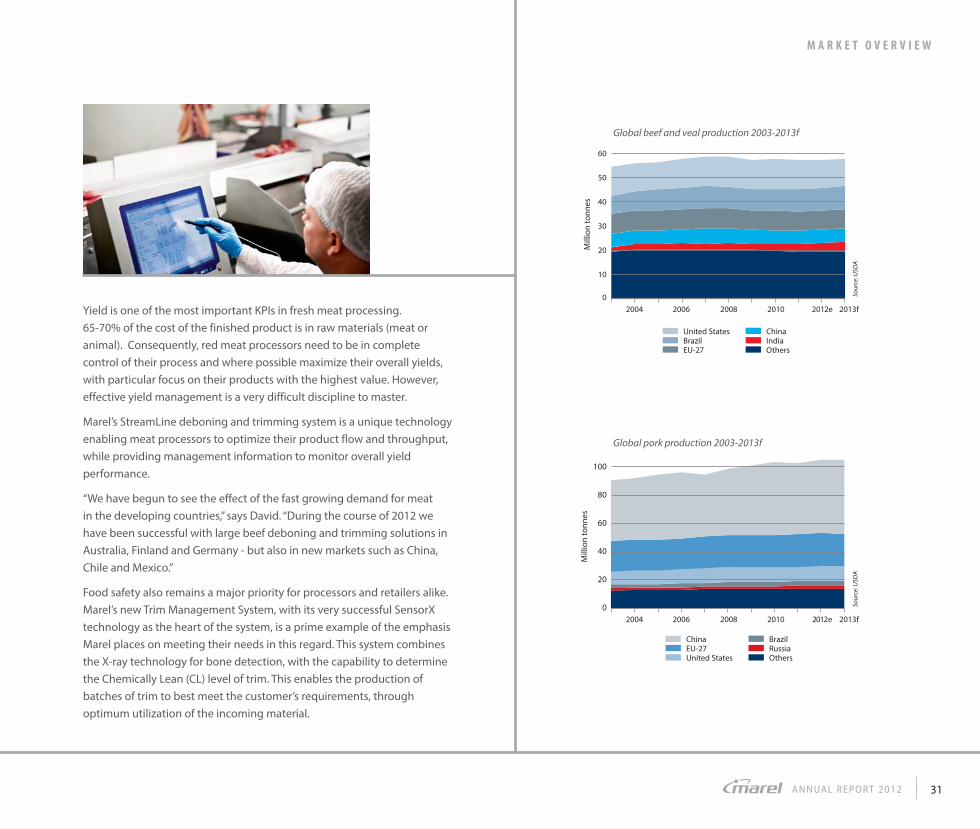
Yield is one of the most important KPIs in fresh meat processing.
65-70% of the cost of the finished product is in raw materials (meat or
animal). Consequently, red meat processors need to be in complete
control of their process and where possible maximize their overall yields,
with particular focus on their products with the highest value. However,
effective yield management is a very difficult discipline to master.
Marel’s StreamLine deboning and trimming system is a unique technology
enabling meat processors to optimize their product flow and throughput,
while providing management information to monitor overall yield
performance.
“We have begun to see the effect of the fast growing demand for meat
in the developing countries,” says David. “During the course of 2012 we
have been successful with large beef deboning and trimming solutions in
Australia, Finland and Germany - but also in new markets such as China,
Chile and Mexico.”
Food safety also remains a major priority for processors and retailers alike.
Marel’s new Trim Management System, with its very successful SensorX
technology as the heart of the system, is a prime example of the emphasis
Marel places on meeting their needs in this regard. This system combines
the X-ray technology for bone detection, with the capability to determine
the Chemically Lean (CL) level of trim. This enables the production of
batches of trim to best meet the customer’s requirements, through
optimum utilization of the incoming material.
Global pork production 2003-2013f
Mill
ion
to
nn
es
Sou
rce:
USD
A
2004 2006 2008 2010 2013f2012e
100
80
60
40
20
0
ChinaEU-27United States
BrazilRussiaOthers
Global beef and veal production 2003-2013f
60
50
40
30
20
10
0
Mill
ion
to
nn
es
Sou
rce:
USD
A
United StatesBrazilEU-27
ChinaIndiaOthers
2004 2006 2008 2010 2013f2012e
M A R K E T O V E R V I E W

32
M E E T O U R P E O P L Emarel.com/people
placewhere I forget
The
time
At its very successful Meat ShowHow event, Marel recently exhibited
solutions which support the value optimization from by-products.
Maximizing yield and minimizing give-away of such by-products is
extremely important to maintain a competitive edge. Examples of these
systems include Marel’s Pig Head Deboning system and the newly
developed Multihead Weigher.
In the Case Ready sector, which is an increasingly competitive industry,
fresh food processors must be able to keep pace with the ever-increasing
demands of supermarkets, the food service industry and consumers. In
Australia one of the major supermarket chains recently purchased a Case
Ready line for red meat including a StreamLine trimming solution, an
I-Crust freezer, and an I-Cut 55 portioning machine.
It is important to understand the business models and drivers of our
customers in various parts of the world. In Oceania, and North and
South America, the focus is on lower cost production to match a growing
export market; whereas in Europe the drivers are more towards synergy in
distribution. In Russia and Asia we see more local market growth. To serve
these markets and work according to these trends Marel meat specialists
are constantly in contact with our local customers, putting their expertise,
knowledge, experience and extensive product portfolio at our customers’
service.
In 2012 we continued to be successful in the high end red meat markets,
where customers are looking ever more towards cost control and yield
monitoring. Our solutions in combination with our unique Innova
software, as a monitoring tool providing management information and
feedback from the production floor, are gaining ever more popularity.
See meat industry video:
marel.com/meatvideo
M E AT P R O C E S S I N G

A N N UA L R E P O R T 2 0 1 2 33
Krasno in the Czech Republic A yield improvement of 1.3% and productivity increase of 20% is reality at Krasno,
the largest pork processor in the Czech Republic after having installed a StreamLine
deboning and trimming system in one of their production facilities.
“Seeing the positive results of the line, we should have made it bigger from the
start” says Mr. Pilcik, Director and owner of Krasno – about the StreamLine system
which was installed in 2011, “We spent some time getting the line fully tuned in
to our production and getting the operators trained, but once those things were
sorted the results have been really positive.”
Purchasing Director Tomas Lesa continues, “We bought the StreamLine system to
better control and measure yield, get a transparent evaluation of the operators and
of course increase productivity. We have reached all of that plus more.” In addition
to the mentioned measurables, Krasno has also experienced positive side effects,
including a very successful connection to their warehouse system, faster run-
through time of raw material, and new ways of thinking of the operators as well as
quality evaluation of supplies.
CUSTOMER STORY
Mr Pilcik, Director and owner of Krasno
Tomas Lesa,Purchasing Director
See video interview:
marel.com/krasno
M A R K E T O V E R V I E W
Product spotlight
StreamLine MeatThe Marel StreamLine deboning and trimming system enables meat
processors to monitor and collect data on yield, throughput and quality
throughout the entire processing cycle. StreamLine can be configured
for a variety of tasks, including deboning, trimming, membrane
skinning, tying and sawing, allowing processors to cater entirely to their
customers’ specifications.
See StreamLine Meat in action:
marel.com/streamline

34
„Marel has a loyal customer base that
is growing steadily. This trend has the
positive flow-on effect of boosting
Marel’s after-sales business.“
F U R T H E R P R O C E S S I N G
“The year 2012 can be summed up in two words for
Marel Further Processing: steady growth,” says Bert
Jan Hardenbol, Managing Director of Marel’s Further
Processing Industry Center.
“Throughout 2012, Marel’s Further Processing industry segment has
seen the most growth in South America, Eastern Europe and the Far
East, due largely to the high number of start-ups.” There are strong
developments in these parts of the world, apparent from the many
investments in complete production lines. The demand for co-extrusion
sausage equipment in these and other regions has increased further
and is expected to continue to do so over the coming years.
BUILDING ON CUSTOMER RELATIONSHIPS

A N N UA L R E P O R T 2 0 1 2 35
In North America, Marel installed no fewer than three QX sausage
production lines for one customer in 2012. This trend is likely
to continue, as more sausage producers become aware of the
technology available to them and the advantages that it brings.
As prices for natural casings have risen sharply, sausage producers
have been looking for alternatives. Gel casings have proven to fit
the bill as they can come closest to the original specifications of the
product in bite, color and taste. Marel has achieved much in this area,
thanks to a considerable investment in research and development.
Gel casings, applied through co-extrusion technology, result in much
lower costs, increased process efficiency and shelf-life. There is far
less human involvement, decreasing costs and increasing hygiene.
In other parts of the world, many customers have expanded by
adding new solutions to their existing Marel Townsend equipment
portfolio or by replacing certain machinery with a higher capacity
model. Marel has a loyal customer base that is growing steadily. This
trend has the positive flow-on effect of boosting Marel’s after-sales
business. In response to this, new service products are continuously
being developed, such as Service Level Agreements, customer
training courses and spare parts kits.
Internationalisation of selected quick service restaurants
0 5 10 15 20 25 30 35
Subway
McDonald’s
KFC
Burger King
28%
57%
72%
41%
Thousands of units
Sou
rce:
co
mp
an
y w
ebsi
tes
US Non-US
M A R K E T O V E R V I E W

36
M E E T O U R P E O P L Emarel.com/people
Marel,where mind meets
imaginationand innovation
is born
In June, the Marel Further Processing Industry Center headquarters in
Boxmeer moved to a brand new building. After a construction period
of a little less than a year, the new office building for the approximately
165 Marel employees was ready. The new building consists of two floors
of office space with two large production halls towards the rear of the
building. The empty offices left behind have since been filled by Marel
Poultry Processing colleagues, who welcomed the extra space.
This expansion of facilities was necessary following sustained growth,
both in personnel and machines in development, and to prepare for
future growth. The new building will allow the Further Processing Industry
Center to increase its focus on the business units and the market, since
almost all functions are now under one roof. There will be more capacity to
specialize, more integrated project work and greater efficiency, as well as
an increased ability to be flexible when responding to customers.
F U R T H E R P R O C E S S I N G
See industry video for further processing:
marel.com/fpvideo

A N N UA L R E P O R T 2 0 1 2 37
Product spotlight
Co-extrusion technologyCo-extrusion is a completely automated process for producing sausage
with a gel casing. A uniform thin layer of gel is applied ingeniously to
the outside of the sausage just as it is being formed, eliminating human
contact with the sausage product. This allows producers to produce
higher volumes set against lower costs, with results that are almost
indistinguishable from traditional production methods. Marel Further
Processing has amassed a great deal of knowledge on the different types
of gels (collagen, alginate, hybrids) that can be used in an extremely wide
range of fresh and cooked/smoked sausage applications.
Salm Partners in the United States
Salm Partners is a manufacturer of smoked sausage and hot
dog products for brand marketing customers. They use an
innovative production process, which is why they have chosen
Marel Townsend Further Processing solutions several times in
a row. “They have an inventive nature about them,” says CEO
Chris Salm. He sees the partnership with Marel as a two-way
relationship, “From them to us and us to them.” He explains how
the partnership has enhanced both his business and Marel’s
Further Processing: “There have been changes made at Marel
because of experiences we had. They not only allow us to have
these experiences with the equipment, but they turn around and
they listen and make changes as a result.”
CUSTOMER STORY
Christopher P. Salm, CEOSalm Partners LLC
See co-extrusion production in action:
marel.com/salm
M A R K E T O V E R V I E W
See co-extrusion in action:
marel.com/coextrusion

38
AFRICA
SUDANovertook Germany
in 2008 and became
the world‘s 10th largest
producer of beef
EGYPTis the world‘s 2nd largest
producer of tilapiaand has tripled its
production in only
ten years
Marel opened a sales and service
unit in South Africa in 2007
Marel‘s regional sales and service unit is in South-Africa,
supported by Marel in Europe and local partners
SOUTHAFRICA
overtook Japan in 2009
and became the world‘s
10th largest producer of
chicken

A N N UA L R E P O R T 2 0 1 2 39
BUSINESSOPERATION

40
Important steps were taken to strengthen Marel’s
geographical network in 2012. “In recent years we have
expanded significantly into new markets. Now the focus
is on clustering areas together in a critical mass so that
we can best serve our customers, as well as gearing up for
new areas. We are aligning our resources worldwide to be
better equipped for the future,” says Petur Gudjonsson,
Managing Director of Marel‘s International Sales and
Service Network.
ALIGNING OUR RESOURCES WORLDWIDE
M A R K E T P E N E T R AT I O N
In South Africa, all business activities have been placed under the umbrella
of the Marel office, a move that has been well received by our customers.
“In Brazil, we had a very successful year delivered by our fully integrated
Marel offices, and UK didn’t show any signs of economic downturn and
performed well,” adds Peter Gudjonsson.
Summing up the year 2012, the results show that Marel is penetrating
its target markets with more strength every year. The Company’s global
network is well balanced to address industry downturns in certain areas
and growth in others.

A N N UA L R E P O R T 2 0 1 2 41
China still in focus
Marel’s groundwork and strategic penetration into China and other fast-
growing new markets has resulted in great successes during 2012. China
is taking significant automation steps in protein processing, and Marel
intends to be a major player in the modernization taking place at Chinese
food processors. Marel successfully sold large high level systems to all of
its core industries of fish, poultry and meat. Furthermore, Marel’s single
largest sale to the fish industry in 2012 was in China. Marel strengthened
local presence further by scaling up the sales and service teams and by
starting the production of parts of the processing lines in the Marel facility.
New Marel offices
Committed to broadening its sales and service network, Marel opened an
office in Mexico in mid-year, and has already had an impact on the market.
The Marel brand is gaining more attention and becoming well known in all
industries. We are already realizing our first projects in the region.
Marel formally opened its office in India during the latter part of the year
where we experienced a successful first year, especially in freezers. ”We
expect this market to be a key one in the future as India is likely to take
a giant leap in the next five to ten years, similar to what we saw in China
roughly five years ago,” says Petur.
Regional approach
In 2012, Marel clustered two areas into regional concepts: Scandinavia and
South America. The Scandinavian region consists of Norway, Sweden and
Denmark, which is now headed by one management team. The idea is to
better tap into our specialists’ knowledge and experience in each industry,
so that Marel’s customers will receive expert service at all times.
The South America region includes Chile, Peru, Uruguay, Argentina and
Paraguay as the primary countries. In addition, Marel conducted business
in other countries in the northern part of the continent with very good
results in 2012. Marel views South America as one of its most important
market regions going forward.
B U S I N E S S O P E R A T I O N
Training across the globe
Operating an international network of sales and services comes with many
logistical and cultural challenges. One challenge is how to keep all the
sales people around the world updated on new equipment and solutions
that Marel steadily introduces to the market. To be more effective in
training its sales teams, Marel launched its very own live broadcast channel
for its people located all around the globe. In fact, this is a mobile Internet
TV station operated by Marel’s multimedia and communications experts.
In live broadcasts, Marel’s newest solutions are introduced monthly by
sales specialists. At the end of each session, the Marel viewers can send in
questions which are answered in real-time by the specialists. The aim is to
expand this to service training, and other ideas are also being discussed.
See video on Marel LIVE:
marel.com/marellive

42
In 2012, alignment and optimization of Marel’s resources
were particularly important for the service part of
operations. The Company’s product portfolio covers a
broad scope that calls for a new and enhanced service
structure. “We still have some work to do in aligning
and optimizing the supply chain and service offerings
between industries, product lines and markets. However,
the customer expects reliable and responsive service at all
times, as any disturbance can negatively affect the bottom
line. We are constantly gearing the Company to meet that
challenge with better coverage and service offerings,” says
Trausti Arnason, Global Service Director.
SHARPENING
THE SERVICE EDGE
S E R V I C EIntegration work continued as former Stork and Marel service teams
worked together to strengthen Marel’s workforces, and bring them
closer to customers. Brazil, Australia, Spain, China and Poland are now
fully integrated. “We have also integrated smaller offices on the regional
level, and our service teams in Romania and Poland are now under one
management. We are completing integration in Norway, Sweden and
Denmark, and South America is now under one service management,” says
John Prendergast, Global Service Advisor.
Expanding Marel’s geographical coverage ranks high on the to-do list.
India and Vietnam are the latest markets to join the company’s global
service organization, two very exciting markets with new opportunities
and challenges.
Service vision and strategy
Marel’s service vision is to support the customers’ preferred balance
between maximum uptime (throughput), minimal cost of ownership, and
maximum yield (performance).
Marel’s service strategy is to generate added value for customers by
developing, maintaining and improving customer relationships, as
well as to create a balanced service triangle for each customer, thereby
transforming from a product oriented organization to a customer based
entity.
The Company’s service portfolio covers everything from help desk and
remote support, to preventive maintenance programs, emergency
support, process consultancy, user training and spare-parts deliveries.
“The customer expects us to outperform in all areas, including cost,
knowhow and logistics. We have now aligned our spare-parts business
to be market compliant on prices and logistics, and to fulfill customer
expectations as well as our own strategic objectives and vision. While we
optimize our reactive service levels, we will also continue to build up and
develop managed services regarding proactive maintenance concepts and
performance agreements,” says Trausti.

A N N UA L R E P O R T 2 0 1 2 43
A knowledge driven service organization
Marel provides professional service solutions to the food processing industry
worldwide with a service organization that spans 30 countries comprising
more than 600 employees, who perform an average of 1000 customer visits
daily.
Being a major market leader in its field, Marel is constantly challenged to
develop innovative products and solutions, in addition to meeting customer
demands for excellent service. Marel needs to be a dynamic, knowledge
driven organization to remain a market leader. To this end the Marel Academy
was established, and has been growing steadily. In 2012, the Marel Academy
conducted more courses and graduated more students than ever before: 80
service courses were held for 650 participants.
“Every year, hundreds of engineers and customers take our training programs,
either through traditional classroom and hands-on courses, or through
e-learning and online webinars. Our ability to deliver quality service comes
down to the ability and motivation of our employees. Our service engineers,
consultants and service coordinators are on the frontline of Marel’s customer
experience, and they are expected to deliver value every day. A skilled and
efficient service workforce is therefore critical to provide our customers with
the quality service they expect and deserve,” says Trausti.
B U S I N E S S O P E R A T I O N
„The customer
expects reliable
and responsive
service at all
times.“
Taking the worry out of service
Marel’s approach to service can best be described in terms of two
concepts: “think global, act local” and “big enough to cope, small
enough to care.” This means that we constantly seek to ensure that
our systems perform at an optimal level and meet our customers’
needs, each and every day.
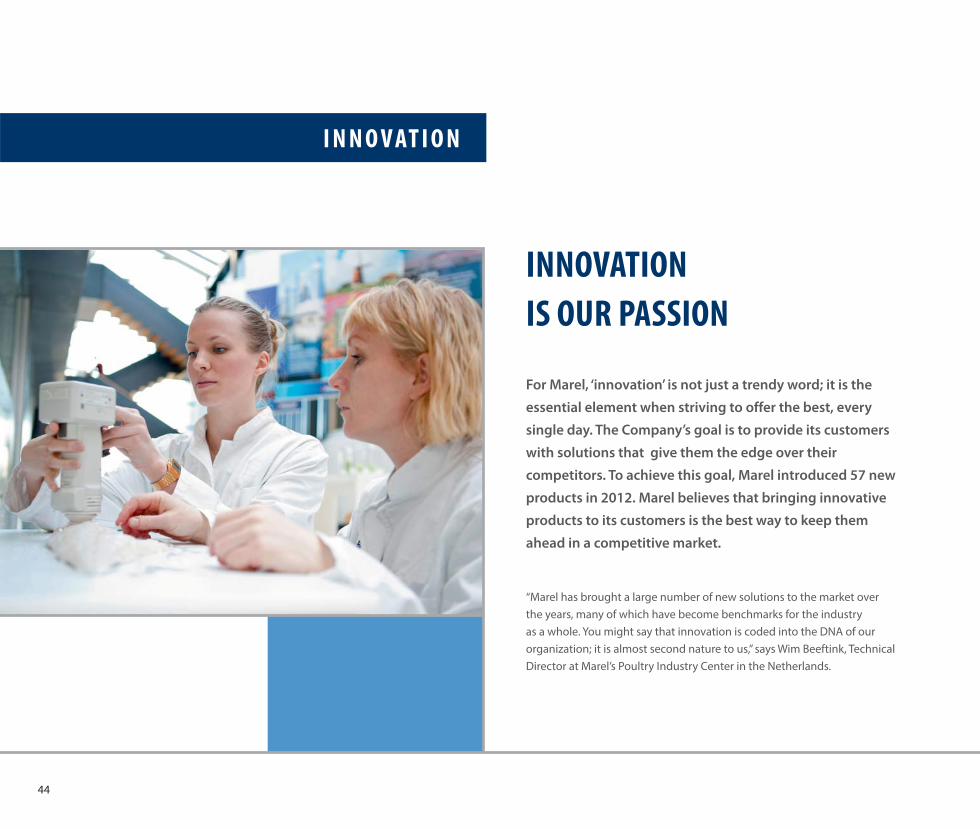
44
“Marel has brought a large number of new solutions to the market over
the years, many of which have become benchmarks for the industry
as a whole. You might say that innovation is coded into the DNA of our
organization; it is almost second nature to us,” says Wim Beeftink, Technical
Director at Marel’s Poultry Industry Center in the Netherlands.
I N N O V AT I O N
INNOVATION
IS OUR PASSION
For Marel, ‘innovation’ is not just a trendy word; it is the
essential element when striving to offer the best, every
single day. The Company’s goal is to provide its customers
with solutions that give them the edge over their
competitors. To achieve this goal, Marel introduced 57 new
products in 2012. Marel believes that bringing innovative
products to its customers is the best way to keep them
ahead in a competitive market.

A N N UA L R E P O R T 2 0 1 2 45
Investment in innovation is key
The structure of Marel reflects our emphasis on innovation. For every
market and application, Marel designates a team of sales, service and
innovation specialists to make sure there is a continuous flow of valuable
ideas being developed into new additions to the product portfolio.
Innovation is not luck, but hard work that involves leaving the office to
learn and work in the field with customers.
The ultimate aim is to simplify existing processing methods and use
intelligent thinking to develop the breakthroughs that mean real changes
for the industry and consumers. With the current product and high speed
requirements of protein processing, this is becoming more and more
challenging, which is why Marel maintains a large and strong research and
development team. Marel enjoys good relations with many suppliers of
knowledge and solutions. The Company’s annual investment in innovation
is well above the industry average. Investment in innovation means
investing in people who are dedicated to finding increasingly ingenious
ways to benefit customers and consumers.
Understanding our customers
The literature states that good innovation starts with the market. At
Marel, we commit to understanding the business models and drivers of
our customers in various parts of the world. We have created not only
an environment but also a formal process to make sure that the market
plays a central role throughout the whole development cycle. Intensive
cooperation between Marel’s team of experts – in sales, service, innovation
and manufacturing – and the Company’s entrepreneurial customers is the
real reason Marel excels in innovation each year. This partnership ensures
that Marel can assist its customers in reacting to ever-changing consumer
habits and in rising against challenges in the external environment such
as the need to save energy and water or improve the yield of the protein
being processed.
Marel’s new Standard Flowline for manual trimming and filleting is
developed specifically to meet the requirements of tilapia processors in
China and other emerging markets, where processing needs are changing
as this traditional labor-intensive industry develops in favor of a higher
level of automation.
In Oceania, North and South America, the focus of meat processors is on
low-cost production with a growing export market, whereas in Europe the
drivers are more towards synergy in distribution. To serve these markets
and work according to these trends, Marel meat specialists are constantly
working with customers, putting their expertise, experience and extensive
product portfolio at the customers’ service.
100% Innovation at EuroTier
Marel’s theme for EuroTier 2012 in Hannover was “100% innovation” and
all the products the company exhibited at the show were genuinely
new. The eleven innovative new products Marel launched at the show
targeted “higher yields”, “process control”, “food safety” and “sustainability”
in order to offer customers profitable improvements to their processing
operations. Marel proudly received a EuroTier Golden Innovation Award for
its AeroScalder, one of the innovations exhibited at EuroTier. The benefits
of the AeroScalder include water reduction of up to 75% and an energy
reduction of up to 50%.
B U S I N E S S O P E R A T I O N

46
M E E T O U R P E O P L Emarel.com/people
I N N O V AT I O N
Benefits of integration
We are already seeing the results of Marel’s successful integration process
on the product portfolio. Key technology of hardware and software
modules has been introduced across the entire Company to enable
seamless communication and data integration in INNOVA, the backbone
of many processing plants. A less visible example of active knowledge
sharing is the SmartWeigher for weighing whole poultry carcasses in
overhead conveyors, a new and much simpler weighing concept giving
excellent weighing results at very high speed. It is a true example of
the knowledge transfer that takes place in the new organization, as the
system combines the best solutions for accurate weighing in dynamic
environments with years of experience in poultry processing.
At the core of Marel’s strong culture of innovation is a team of over 400
engineers and food scientists, supported by an annual investment of
5-7% of revenues in research and product development. Marel maintains
close ties with leading universities and research institutes, and its close
partnerships with some of the most forward thinking processors in the
industry have been a key factor in the many breakthrough successes in
product development over the years.
Patents and inventions
Patent protection is vital to Marel. In 2012, the company applied for a
patent on 24 new inventions. The current patent portfolio consists of
224 granted patent families. Marel introduced 57 new products during
the year.
Marel is a place for unified
creativity and
innovationformed through roots of diversity

A N N UA L R E P O R T 2 0 1 2 47
Manufacturing
As part of the ongoing implementation of the Marel Manufacturing
System (MMS), all 16 manufacturing sites have ongoing initiatives aimed at
process improvement and increasing flexibility and speed. Some sites have
been undergoing a transformation process; rethinking their operations
entirely to create value. We have being seeing that cooperation in the
global community is creating energy and presenting new opportunities,
and the success stories that have been reported from different corners of
the world confirm our belief in one shared vision.
The Marel team is well aware that this journey to continuously improve
business processes is a never-ending task. At Marel, we believe in
constantly challenging the status quo; yesterday’s thinking will not solve
tomorrow’s problems. For that reason, we strive to get as many people as
possible involved in the improvement process. Our motto – “everybody
every day” – reminds us that doing little things all the time generates big
achievements over time. An intensive focus will now be placed on making
the overall vision and strategy within manufacturing accessible for all
manufacturing employees. “This will enable us to carry the momentum
forward to create an MMS force that will transform our process making
and help us achieve the Company’s overall goals,” says Fred Vijverstra,
Global Director of Manufacturing.
We are now considering which products can be transferred from current
manufacturing locations to new manufacturing locations like Slovakia,
China, Brazil and the USA, to better utilise all locations, to reduce overall
costs and/or be closer to the market.
Operational excellence
An important prioritisation has been made in defining three strategic
focus points: improved customer service, improved data integrity and
modularisation of products. Each of these strategic focus points call for
operational excellence practices to enhance performance and make it
possible to realise strategic goals. In 2012, we promoted operational
excellence in several parts of the organisation and as a result we see
increased activity in the operating units.
Mariette Ferrari, Corporate Director of Finance: “By analysing the total
value stream and creating transparency in the cash conversion cycle, we
are identifying and creating awareness of the improvement potential in
many parts of the Company.” In the Modularisation program, as well as
the Working capital/business process improvement program, activities
are defined to make the cash conversion cycle shorter, which should help
the organisation in many ways; such as minimising time-to-market in
innovation or shortening the processes of delivering products and services
to our customers.
In our Corporate Procurement program we have realised and are
continuously identifying further potential improvements in creating
global contracts and long-term relationships with our suppliers. We strive
to increase the volumes in these contracts by standardising our parts. All
these initiatives lead to improved bottom-line results, but will at the same
time improve control on our working capital.
By promoting operational excellence we encourage our people to
become problem solvers so that as many employees as possible are
improving processes as part of their daily work and are identifying further
improvement potential while doing so. The result should be that Marel
will do more with less; i.e. increase throughput with minimal capital
investments, with resulting positive effects on our profit margins. We use
operational excellence to free up time, energy and space for our valuable
employees to create breakthrough products, penetrate new markets and
fulfil the needs of our existing and future customers.
A WAY OF THINKING
O P E R AT I O N A L E X C E L L E N C E
B U S I N E S S O P E R A T I O N

48
M E E T O U R P E O P L Emarel.com/people
2012 was an interesting and rewarding year in HR, where
the first fruits, growing from a challenging integration
process of past years, were picked and harvested,” says
Hrund Rudolfsdottir, Corporate Director of Human
Resources.
2012 was the first year when we really could see everything come together
like a nicely finished jigsaw. New teams were created in 2011 and this was
their first whole year. One could see that geographic border became blurry
or disappeared, making Marel a truly global company.
Last pieces of implementation were made by appointing managers for
some of our key positions and it was rewarding to see that in most of
our appointments of global positions there was no shortage of internal
management talent.
Human resources are our most important ones. Therefore, developing
our people is a major task. During the year our first Management
Development Program came to an end after 9 challenging months for the
25 participants involved. The general conclusion was that the program
fitted the company’s need very well and the participants felt that the
program helped them in terms of personal development and networking
and furthermore increased their knowledge in key areas.
O U R P E O P L EMarel is by far
the best
I have everworked for
company

A N N UA L R E P O R T 2 0 1 2 49
Management and personal development will continue to be a core subject for the HR in 2013,
but now also under the umbrella of the Marel Academy, which was established in 2012. The
Marel Academy is the framework we will use for moving the company towards more professional
learning organisation.
Important side of growing our people is to ensure a regular, honest and meaningful feedback
to all our employees, to ensure they have a realistic view on their performance. It also ensures
fair recognition and rewarding for outstanding performance, as well as securing support when
needed. It was therefore a high priority to implement a standardised online review system, which
now covers 90% of our employees and particularly supports managers which work with global
teams.
In the autumn of 2012 the HR part of marel.com was improved dramatically, using pictures, audio
and video to invite all interested people to have a look at how it´s like to work for Marel. It is
Marel´s employees throughout the world who share their views and feelings.
Growth in numbers
The numbers of employees have grown in context with increased activity and general growth
of the Company. The number of employees at year end 2012 were 4,069 full time equivalents,
increasing by 4% from last year.
Number of employees (FTEs) by
geographical location at year end 2012Number of employees, average per year
2008 2009 2010 2011 Year-end
2012
4,000
3,500
3,000
2,500
2,000
1,500
1,000
500
02012
Netherlands
US
Iceland
Denmark
UK
Other countries18%
13%
8%
23%30%
8%
B U S I N E S S O P E R A T I O N

50
N-AMERICA
More
chickenis produced
in MEXICO and
CENTRAL AMERICAthan in France, Germany
and the UK put
together
MEXICOrecently overtook
Russia as the 6th largest
producer of beefin the world
Marel‘s latest addition in North America is its SSU
in Mexico City
52% of the
food budget in the
UNITED STATESis spent on food prepared
outside of the home
Over 700 people work for Marel in fi ve
locations across North America

A N N UA L R E P O R T 2 0 1 2 51
TO OURSHARE-
HOLDERS

52
Share performance
Marel celebrated twenty years of trading in 2012 as the Company’s shares
have been listed on the NASDAQ OMX Nordic Exchange Iceland since 1992
under the symbol MARL. Marel’s share price stood at ISK 140.50 at the end
of 2012, compared to ISK 125.50 at the end of 2011, an increase of 12.0%.
In euros, the shares stood at 83 cents per share at year end compared to 79
cents at the beginning of the year.
Shareholders
The number of shareholders in Marel was recorded in the shareholders
register to be 2,144 at year-end 2012, compared to 1,799 shareholders at
year-end 2011. As of 31 December 2012, Marel holds 4,128,950 treasury
shares.
Eyrir Invest hf. is Marel’s largest shareholder, with 33.1% of shares, followed
by Grundtvig Invest A/S (8.4%) and Lífeyrissjóður verzlunarmanna – the
Pension Fund of Commerce (7.4%). The ten largest shareholders hold 69.9%.
In total, Icelandic pension funds hold around 28% of Marel’s share capital.
Non Icelandic shareholding was 18% at year-end 2012. The free float of
Marel shares was 67% and free float adjusted market value of the company
was EUR 407 million.
Share capital
At year-end, Marel’s shares totalled 735.6 million, all in one class; thereof
Marel holds 4.1 million treasury shares.
In 2012, Marel purchased 4.1 million shares for EUR 3.6 million to fulfil future
stock option obligations, and sold 6.7 million treasury shares for a total
amount of EUR 3.7 million to fulfil the employees’ stock option programme.
Stock options are granted to management and selected key employees.
Total granted and unexercised stock options at end of the year 2012 were
28.9 million shares, of which 9.7 million are exercisable at the end of 2012
and the remainder will become exercisable in the years 2013 to 2018.
Shareholder No of shares %
1 Eyrir Invest hf. Investment company 243,366,838 33.1%
2 Grundtvig Invest A/S Investment company 61,560,494 8.4%
3 Lífeyrissjóður verzlunarmanna Pension fund 54,775,042 7.4%
4 Columbia Acorn International Asset management 35,982,499 4.9%
5 Gildi - lífeyrissjóður Pension fund 29,039,331 3.9%
6 Lífeyrissjóður starfsmanna ríkisins A-deild Pension fund 20,220,000 2.7%
7 Stefnir – ÍS 15 Asset management 19,805,192 2.7%
8 Stafir lífeyrissjóður Pension fund 17,322,964 2.4%
9 Sameinaði lífeyrissjóðurinn Pension fund 16,619,878 2.3%
10 Stefnir – ÍS 5 Asset management 15,623,589 2.1%
Top 10 total 514,315,827 69.9%
Others 221,253,170 30.1%
Total issued shares 735,568,997 100.0%
TOP 10 SHAREHOLDERS AS OF 31 DECEMBER 2012
S H A R E S A N D S H A R E H O L D E R S
Eyrir Invest
Pension funds, Icelandic
Foreign investors
Other Icelandic institutional investors
Retail investors, Icelandic
28.1%
17.7%
10.9%
10.2%
33.1%
HOLDINGS BY T YPE OF INVESTOR AS OF 31 DECEMBER 2012
See online report for top 20 shareholders: marel.com/top20

A N N UA L R E P O R T 2 0 1 2 53
At the Company’s 2010 Annual General Meeting, the shareholders
authorised the Board of Directors to increase the Company’s share
capital by 45 million shares to fulfil stock option agreements. Thereof, 8.4
million shares have been issued at end of 2012. The Company’s Board of
Directors is also authorised to increase its share capital by up to ISK 240
million nominal value, where ISK 146.8 million have already been issued.
Shareholders waived their pre-emptive rights.
Liquidity of shares
Marel has made agreements with Landsbankinn hf. and MP Bank hf.
regarding market making for the issued shares of Marel. The purpose of
the agreements is to improve liquidity and to enhance transparent price
formation in the Company’s shares on NASDAQ OMX Iceland. The duration
of these agreements is unspecified but they can be terminated with one
month‘s notice.
Shares in Marel were traded 1,702 times in 2012 for a total market value of
ISK 27.4 billion (up from ISK 25.5 billion in 2011), which corresponds to a
turnover rate of 26.5%. This places Marel with the highest turnover on the
NASDAQ OMX Nordic Exchange Iceland in 2012. The average end-of-day
spread of Marel was 0.95%. The market value of the Company at year-end
2012 was ISK 103.3 billion (EUR 607.6 million) compared to ISK 92.3 billion
(EUR 579.5 million) at year-end 2011, an increase of ISK 11.0 billion (EUR
28.1 million). As the Company‘s shares are traded in ISK, the fluctuations
of the Icelandic krona during the year 2012 affects the market value, when
converted into EUR.
Dividend
The Board of Directors will propose to the 2013 Annual General Meeting
that EUR cents 0.97 dividend per share will be paid for the operational
year 2012, equalling approximately EUR 7.1 million or 20% of the total
profit of EUR 35.6 million for the year 2012, and refers to the financial
statements regarding appropriation of the profit for the year and changes
in shareholders’ equity.
DISTRIBUTION OF SHARES AS OF 31 DECEMBER 2012
Number of Shares Shareholders % Shares %
1 - 9,999 1,329 61.99% 5,010,771 0.68%
10,000 - 99,999 616 28.73% 18,751,412 2.55%
100,000 - 199,999 86 4.01% 11,135,488 1.51%
200,000 - 799,999 56 2.61% 20,294,143 2.76%
800,000 - 1,399,999 11 0.51% 11,520,503 1.57%
1,400,000 - 2,999,999 17 0.79% 36,057,844 4.90%
3,000,000 - 9,999,999 16 0.75% 84,141,704 11.44%
10,000,000 - 99,999,999 12 0.56% 305,290,294 41.50%
100,000,000 - >100,000,000 1 0.05% 243,366,838 33.09%
2,144 100.00% 735,568,997 100.00%
STOCK OPTIONS AS OF 31 DECEMBER 2012
Program Number of shares Exercise priceinitiated in thousands per share Exercisable in
June 2008 5,750 ISK 87.41 2013
May 2010 12,652 EUR 0.537–0.582 2013–2015
June 2012 10,458 EUR 1.066–1.153 2015–2018
Total 28,860
MAREL’S STOCK PRICE COMPARED TO THE OMXI6 PI ISK INDEX
Note: Indexed numbers, set at 100 at beginning of year 2012.
130
120
110
100
90
1/12012
1/22012
1/32012
1/42012
1/52012
1/62012
1/72012
1/82012
1/92012
1/102012
1/112012
1/122012
31/122012
Marel shares in ISK Marel shares in EUR OMXI6 PI ISK
T O O U R S H A R E H O L D E R S

54
Asthildur Margret Otharsdottir,Vice Chairman of the Board
• Education: MBA, Rotterdam School of Management,
The Netherlands, 1996; Cand. Oecon.,
University of Iceland, 1992.
• Elected: 2010.
• Holdings in Marel, including those of financially related
parties: 32,000.
Asthildur Margret Otharsdottir is an independent consultant with extensive
prior business experience as a Director of Treasury and Corporate Development
at Össur hf. from 2006 to 2010, Senior Account Manager at Kaupthing Bank hf.,
now Arion bank, from 2004 to 2006, and Consultant at Accenture from 1996 to
2000. She is a member of the Board of Directors of Icelandair Group hf., Marorka
ehf. and Lagerinn Dutch Holding BV.
Arnar Thor Masson
• Education: M.Sc. in Comparative Politics, the London
School of Economics and Political Science, U.K., 1997. BA
in Political Science, University of Iceland, 1996. Studied
securities brokerage in 2007.
• Elected: 2001.
• Holdings in Marel, including those of financially related
parties: 0.
Arnar Thor Masson is the Director General of the Department of Administrative
and Social Development at the Prime Minister’s Office in Iceland. Prior to that,
he was Deputy Director General of the Financial Management Department at
the Ministry of Finance. Masson was an adjunct lecturer at the Department of
Political Science of the University of Iceland from 2000 until 2008. He does not
sit on the board of any other company than Marel.
C E O A N D B O A R D O F D I R E C T O R S
Chief Executive Officer
Theo Hoen
• Education: Masters degree in mechanical engineering,
Technical University of Eindhoven, The Netherlands,
1984.
• Holdings in Marel, including those of financially
related parties: 1,500,000.
Chairman of the Board
Arni Oddur Thordarson
• Education: MBA, IMD, Switzerland, 2004; Cand. Oecon.
in Business Administration, University of Iceland, 1993.
• Elected: 2005.
• Holdings in Marel by Eyrir Invest hf and financially
related parties: 243,498,707.
Theo Hoen became CEO of Marel in March 2009 after having served as CEO
of Stork Food Systems since January 2006. He first joined Stork PMT in 1986,
originally in manufacturing, and later became the company’s Technical and
Manufacturing Director. He was appointed General Manager of Stork Titan in
2001 and Managing Director Stork PMT, Stork Gamco and Stork Titan in 2002.
Arni Oddur Thordarson is co-founder of Eyrir Invest and has been the
company’s CEO since foundation in the year 2000. He has extensive
international experience in various businesses. Prior to co-founding Eyrir
Invest, Thordarson was Head of Corporate Finance & Capital Markets at
Bunadarbanki Islands, which later merged with Kaupthing, now Arion Bank.
He has been board member of Stork BV since 2008, that owns and operates
Fokker Technologies and Stork Technical Services (STS). As of 1 January 2013,
both Fokker and STS have their own two-tier Board where Thordarson serves
as non executive board member.
Board Members

A N N UA L R E P O R T 2 0 1 2 55
The Board of Directors (from left to right):
Theo Bruinsma, Arnar Thor Masson, Fridrik Johannsson, Margret Jonsdottir,
Helgi Magnusson, Asthildur Margret Otharsdottir and Arni Oddur Thordarson.
Fridrik Johannsson
• Education: Cand. Oecon., University of Iceland, 1983;
Certified Public Accountant, 1987.
• Elected: Alternate 1997-2004. Board member since 2004.
Chairman of the Board from the AGM 2005 until October
2005.
• Holdings in Marel, including those of financially related
parties: 4,300,000.
Fridrik Johannsson is a partner of Icora Partners, a corporate finance advisory
firm. He served previously as CEO of Straumur-Burðarás Investment Bank hf. from
June 2006 to May 2007, and CEO of Burðarás hf. from March 2004 to September
2005. Mr. Johannsson is a member of the Board of Vörður tryggingar hf., A1988 hf.
(Eimskipafélag Íslands), Áning ehf. and Icora Partners ehf.
Helgi Magnusson
• Education: Business Administration, University of Iceland,
1974; Certified Public Accountant, 1975.
• Elected: 2005.
• Holdings in Marel, including those of financially related
parties: 5,105,000.
Helgi Magnusson is a member of the Board of Directors and the Executive Board
of the Confederation of Icelandic Employers. He served as Chairman of the
Federation of Icelandic Industries 2006-2012. He is Chairman of the Board of the
Pension Fund of Commerce, Blue Lagoon hf., Harpa Holding Ltd, Husasmidjan
and serves as board member of several other Icelandic companies including
N1 hf., the Esso oil distributor. Mr. Magnusson served previously as a board
member of Islandsbanki hf, Framsyn Pension Fund and the Icelandic Chamber
of Commerce. For several years, he was the Chairman of the Board of Harpa and
Harpa-Sjöfn Paint Factory and Flügger Iceland Paint Factory.
Margret Jonsdottir
• Education: Master of Accounting and Auditing, University
of Iceland, 2006; Cand. Oecon. in Business Administration,
University of Iceland, 1983.
• Elected: 2006.
• Holdings in Marel, including those of financially related
parties: 200,419.
Margret Jonsdottir is the CFO of Eyrir Invest hf. Previously, she was the Director of
Finance at Edda Publishing hf from December 2001 until October 2002. She was
Director of Finance at Kreditkort hf from August 2000 until December 2001, and
Manager of Accounts and Planning at FBA Investment Bank (now Íslandsbanki),
and Director of Finance at the Industrial Loan Fund (FBA Investment Bank
predecessor), from September 1988 until June 2000.
Theo Bruinsma
• Education: Atheneum (HBSb); Service Management,
Technical University; Certified pilot.
• Elected: 2010.
• Holdings in Marel, including those of financially related
parties: 1,000,000.
After having worked independently for a number of years in various
international patent and translation offices, Theo Bruinsma joined Townsend
Engineering in 1976 as Service Coordinator. He was named Technical Director
in 1979 and held a number of positions in the European and USA operations
of the Company before being appointed General Manager in 1992. He was
named President in 2000. When Townsend Engineering was acquired by Stork
in 2006, Bruinsma became a member of Stork Food Systems’ management
team, with responsibility for meat operations. He sits on the board of Salm
Partners/USA and is an honorary member of the Dutch Service Management
Association and representative in the European Standardization Committee
for the Food Industry.
T O O U R S H A R E H O L D E R S

56
M E E T O U R P E O P L Emarel.com/people
Providing investors with equal access to timely and accurate information
about Marel’s operations and business environment is the central aim
of the Company’s information policy. Marel believes that dissemination
of honest, consistent and transparent information, within the bounds of
commercial sensitivity, is key in building trust with current shareholders
and potential investors
Regular information disclosure
All price-sensitive information, regulatory announcements about Marel
and announcements regarding performance and future prospects are
published in a timely manner, initially on the website of NASDAQ OMX
Iceland, nasdaqomxnordic.com, and subsequently on Marel’s official
website, marel.com. Financial results are issued quarterly in accordance
with the requirements of NASDAQ OMX Iceland.
I N V E S T O R R E L AT I O N S
150
100
50
0
Marel’s long term share price development
Diverse,demandingand above all...
fun and
exciting
2010 2011 2012
Sh
are
pri
ce in
de
x
EUR indexed
ISK indexed
Note: Indexed numbers, price per share 1/1 2008 = 100
2008 2009 2013

A N N UA L R E P O R T 2 0 1 2 57
Meetings with the investor community
In addition to stock exchange and Company announcements, the main
channels of communication with investors and analysts are the regular
investor meetings that follow the publication of the Company’s quarterly
results, Annual General Meetings and other meetings held on an ad-hoc
basis.
Quarterly investor meetings are webcast and presentations from the
meetings are published via the NASDAQ OMX news system.
In May 2012, Marel participated in a Capital Markets Day event organised
by Arion Bank in Iceland, where the Company was presented to investors
and analysts.
Website and Annual Report
Marel’s website contains detailed information about the Company,
its history, operations and activities. Current and past press releases,
presentations and annual reports are archived on the Investor relations
section of the website and available for download, and the Company’s
current and historic share prices are available for review against key
indices.
A hard copy of the Annual Report is available upon request by writing to
Publication schedule for 2013-2014
Annual General Meeting 2013 6 March 2013
1st quarter 2013 22 April 2013
2nd quarter 2013 24 July 2013
3rd quarter 2013 23 October 2013
4th quarter 2013 5 February 2014
Annual General Meeting 2014 5 March 2014
Marel celebrated twenty years of
trading by opening the Nasdaq
market at New York‘s Times Square
on 18 October 2012. Arni Oddur
Thordarson, Chairman, and
Theo Hoen, CEO, rang the Opening
Bell together.
T O O U R S H A R E H O L D E R S
See opening bellceremony:
marel.com/nasdaq
58
M E E T O U R P E O P L Emarel.com/people
Marel’s activities expose the Company to a variety of financial risks: market
risk, including foreign exchange risk and price risk, credit risk, liquidity
risk, cash flow risk and fair value interest-rate risk. The Company’s overall
risk management programme focuses on the unpredictability of financial
markets and seeks to minimise potential adverse effects on the Company’s
financial performance. The Company uses derivative financial instruments
to hedge certain risk exposures when needed to manage its exposure to
interest rate and foreign exchange rate risk. Risk management is carried
out within the company, where applicable, under policies approved by the
Board of Directors. Financial risk is monitored and managed centrally in
group treasury.
Foreign exchange risk
The Company operates internationally and is exposed to foreign exchange
risk arising from various currency exposures, primarily with respect to
the EUR/USD, EUR/GBP and EUR/ISK on the cost side. The general policy
is to apply natural currency hedging to the extent possible and prohibit
any speculative trading of financial instruments. The Company funding is
denominated in the main operational currencies to create natural hedging
in the balance sheet. Where needed, financial exposure is hedged in
accordance with Company’s general policy on permitted instruments and
exposure limits.
R I S K M A N A G E M E N TCompleting
the challengescan be very
satisfying and
motivating
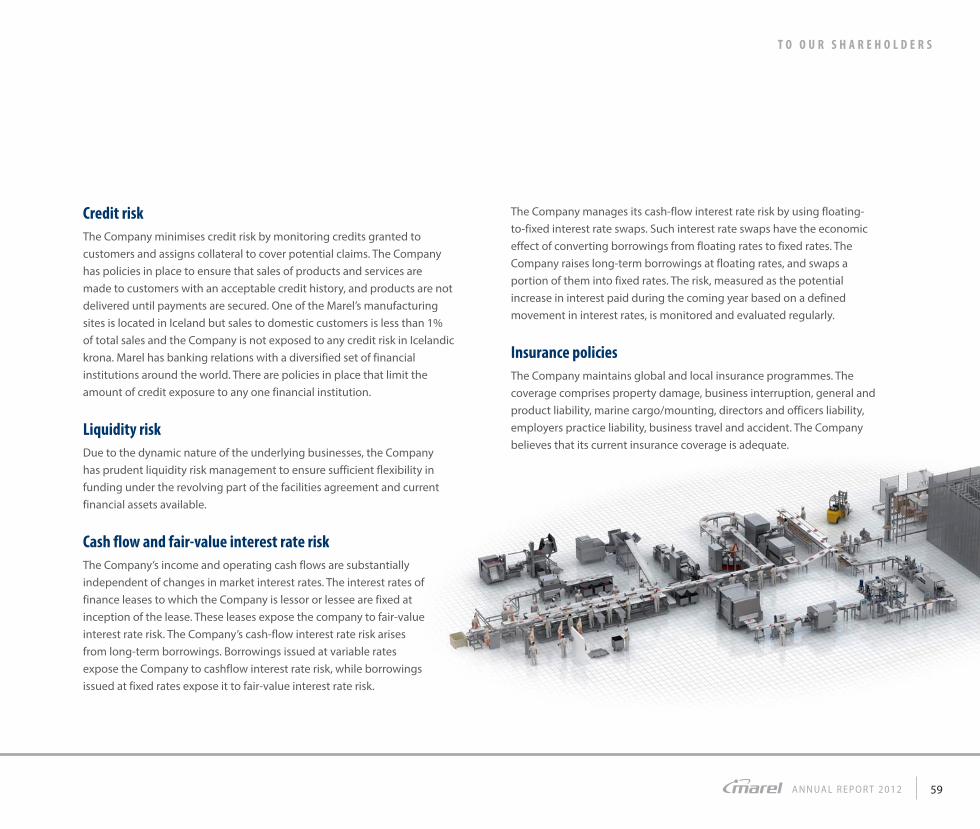
A N N UA L R E P O R T 2 0 1 2 59
Credit risk
The Company minimises credit risk by monitoring credits granted to
customers and assigns collateral to cover potential claims. The Company
has policies in place to ensure that sales of products and services are
made to customers with an acceptable credit history, and products are not
delivered until payments are secured. One of the Marel’s manufacturing
sites is located in Iceland but sales to domestic customers is less than 1%
of total sales and the Company is not exposed to any credit risk in Icelandic
krona. Marel has banking relations with a diversified set of financial
institutions around the world. There are policies in place that limit the
amount of credit exposure to any one financial institution.
Liquidity risk
Due to the dynamic nature of the underlying businesses, the Company
has prudent liquidity risk management to ensure sufficient flexibility in
funding under the revolving part of the facilities agreement and current
financial assets available.
Cash flow and fair-value interest rate risk
The Company’s income and operating cash flows are substantially
independent of changes in market interest rates. The interest rates of
finance leases to which the Company is lessor or lessee are fixed at
inception of the lease. These leases expose the company to fair-value
interest rate risk. The Company’s cash-flow interest rate risk arises
from long-term borrowings. Borrowings issued at variable rates
expose the Company to cashflow interest rate risk, while borrowings
issued at fixed rates expose it to fair-value interest rate risk.
The Company manages its cash-flow interest rate risk by using floating-
to-fixed interest rate swaps. Such interest rate swaps have the economic
effect of converting borrowings from floating rates to fixed rates. The
Company raises long-term borrowings at floating rates, and swaps a
portion of them into fixed rates. The risk, measured as the potential
increase in interest paid during the coming year based on a defined
movement in interest rates, is monitored and evaluated regularly.
Insurance policies
The Company maintains global and local insurance programmes. The
coverage comprises property damage, business interruption, general and
product liability, marine cargo/mounting, directors and officers liability,
employers practice liability, business travel and accident. The Company
believes that its current insurance coverage is adequate.
T O O U R S H A R E H O L D E R S

60
Icelandic law and Marel’s corporate governance framework determine the
duties of the various bodies within the Company. Corporate governance
defines the way in which the company is directed and controlled – it
involves the broader interworkings of the day-to-day management, the
Board of Directors, the shareholders at large, and other interested parties
to formulate and implement corporate strategy.
1. Rules on corporate governance which the Company follows
The Company’s corporate governance policy is based on the Guidelines
on Corporate Governance issued in March 2012 by the Iceland Chamber of
Commerce, NASDAQ OMX Iceland hf. and the Confederation of Icelandic
Employers, in accordance with Clause 2.27 in the Rules for issuers of
financial instruments on NASDAQ OMX Iceland issued in December 2009.
The Guidelines can be found and accessed on the website of the Iceland
Chamber of Commerce, chamber.is/english.
2. Departures from the Guidelines on Corporate Governance
In general, the Company is in compliance with the Guidelines on
Corporate Governance. The Board of Directors evaluates at least once a
year the performance of the CEO, but not specifically the performance of
other members of the Board of Management. The CEO is responsible to
the Board of Directors for the performance of the Board of Management.
The Board of Directors has not established a nomination committee,
as such a committee is currently not considered necessary, taking into
account the balanced and relevant expertise and experience of the current
Board members. Furthermore, the Rules of Procedure for the Board of
Directors clearly stipulate what items shall be taken into consideration
when preparing the nomination of Directors.
3. Main aspects of internal controls and the Company‘s risk management in connection with the preparation of financial statements
External audit
An independent auditing firm is elected at the Annual General Meeting
(AGM) for a term of one year. The auditor shall examine the Company’s
annual accounts in accordance with generally accepted accounting
standards, and shall for this purpose inspect account records and other
material relating to the operation and financial position of the Company.
KPMG hf. was elected as the Company’s auditor at the AGM on 29 February
2012. Auditors on its behalf are Saemundur Valdimarsson and Kristrun H.
Ingolfsdottir, both State Authorized Public Accountants. They have audited
and signed without reservation Marel’s consolidated financial statements
for the year 2012.
Internal audit and control
The Company’s risk management and internal controls, in relation
to financial processes, are designed with the purpose of effectively
controlling the risk of material misstatements in financial reporting. Marel’s
internal auditor, a position which was established in late 2010, plays a
key role in relation to internal control along with the external auditors, as
applicable.
4. The Company‘s values, code of conduct and social responsibility policy
Values
Marel‘s company values are shared ideals and standards that provide
direction in day to day operations. As part of the integration process
in 2010, employees had a direct hand in defining the values that the
C O R P O R AT E G O V E R N A N C E

A N N UA L R E P O R T 2 0 1 2 61
company will henceforth embrace. The outcome was a set of eight values:
commitment, partnerships with customers, diversity, teamwork, learning
and excellence, open communication, humour and fun, and success.
Initiatives have been launched throughout the company to promote and
embed these values in daily operations.
Code of Conduct
The Board of Directors of Marel approved a Code of Conduct with global
application in October 2012. It is closely linked with Marel’s company
values and is built on four pillars, i.e. Employees’ (including officers and
directors) commitment to: (i) each other; (ii) customers and marketplace;
(iii) shareholders; and (iv) partners, communities and the environment.
Corporate social responsibility
Being a responsible corporate citizen means going beyond statutory legal
requirements to aligning all business operations with socially accepted
principles and contributing to society in a positive way. Following the
formal conclusion of the company‘s integration process, focus is now on
the development of a global social responsibility policy for the whole
company.
5. Composition and activities of the Board of Directors, Board of Management and sub-committees of the Board of Directors
Board of Directors
The Company’s Board of Directors is the supreme authority in the
affairs of the Company between shareholders’ meetings. It is elected by
shareholders at the AGM for a term of one year and operates in accordance
with the Company’s Articles of Association and the Board‘s Rules of
Procedure. The Board currently comprises seven members who were
elected at the Company’s AGM on 29 February 2012.
The Board is responsible for the organisation of the Company and for
ensuring the proper conduct of its operation at all times. The Board of
Directors shall decide on all matters regarded as extraordinary or of major
consequence. The same applies to major borrowing requiring pledging
of the Company’s property and assets. The Board shall establish goals
for the Company in accordance with the Company’s objectives and shall
formulate the policy and strategy required to achieve these goals.
Regular board meetings are held with management over the course
of the year, including quarterly results meetings, a strategy meeting
in autumn and a next-year budget meeting in December. In addition,
the Board of Directors meets twice a year without the management.
Additional meetings are convened as needed. All matters brought before
a Board meeting shall be decided by majority vote, provided that the
Board meeting has been lawfully convened. In the event of a tie vote,
the Chairman of the Board casts the deciding vote. However, important
decisions shall not be taken unless all members of the Board have had the
opportunity to discuss the matter, if possible.
Profiles of the Board members are provided on pages 54-55.
Board sub-committees
The Board’s work is supported by its working committees: Remuneration
Committee and Auditing Committee. Members of the Remuneration
Committee are Arnar Thor Masson, Arni Oddur Thordarson and Asthildur
Margret Otharsdottir. Its field of work involves negotiating wages and
other benefits for the CEO and senior management, and framing the
company’s remuneration policy, including wage incentives and stock
option rights for company shares. Members of the Auditing Committee are
Asthildur Margret Otharsdottir, Fridrik Johannsson and Margret Jonsdottir.
Its field of work includes monitoring Marel’s financial status and evaluating
the Company’s internal monitoring and risk management systems,
management reporting on finances, whether laws and regulations are
followed, and the work of the Company’s statutory auditors.
Board of Management
The Board of Management is composed of the Chief Executive Officer
(CEO), Chief Financial Officer (CFO) and Chief Operating Officer (COO).
Theo Hoen, CEO, is responsible for daily operations of the company. A
further description of the CEO‘s responsibilities is provided under item 12
below. Other members of the Board of Management are: Erik Kaman, CFO,
and Sigsteinn P. Gretarsson, COO.
T O O U R S H A R E H O L D E R S

62
6. Arrangement of the appointment of sub-committee members
Sub-committee members are appointed by the Board of Directors for a
term of one year, in accordance with the rules of each sub-committee
adopted by the Board.
The Audit Committee is composed of either three or four members of
the Board of Directors, unless the Board decides otherwise. The majority
of the Audit Committee shall be independent of the Company and its
external auditors. At least one member of the Audit Committee shall be
independent of shareholders that hold 10% or more of the total share
capital of the Company. The members of the Audit Committee shall
possess the knowledge and expertise needed to perform the tasks of the
Audit Committee. At least one Member of the Audit Committee shall have
solid knowledge and experience in the field of financial statements or
auditing.
The Remuneration Committee is composed of either three or four
members of the Board of Directors, unless the Board decides otherwise.
The majority of the Remuneration Committee shall be independent of the
Company. The members of the Remuneration Committee shall possess the
knowledge and expertise needed to perform the tasks of the Committee.
7. Information on the number of Board Meetings and sub-committee meetings as well as their attendance
The Board of Directors convened 11 times in 2012, with a weighted
average attendance of 95%. The sub-committees of the Board of Directors,
the Audit Committee and Remuneration Committee, convened 4 and 4
times respectively in 2012. They were all fully attended.
8. Access information for the written rules of procedure for the Board of Directors and its sub-committees
The rules of procedures for the Board of Directors and its sub-committees
can be found on the Company‘s website: marel.com/investors/Corporate-
Governance/
9. Members of the Board of Directors
Profiles of the members of the Board of Directors are provided on pages
54-55.
10. Information on which Board Members are independent of the Company and its major shareholders
The Board of Directors has made an assessment on which Board
members are independent according to the Guidelines on Corporate
Governance. Four of seven Board members are considered independent
of the Company: Arnar Thor Masson, Asthildur Margret Otharsdottir,
Fridrik Johannsson and Helgi Magnusson. Furthermore, five of seven
Board members are considered independent of the Company’s major
shareholders; Arnar Thor Masson, Asthildur Margret Otharsdottir, Fridrik
Johannsson, Helgi Magnusson and Theo Bruinsma.
11. Principal aspects in the Board of Directors’ performance assessment
At least once a year, the Board of Directors evaluates the work, results, size
and composition of the Board, as well as the work and results of individual
Board members and the Board’s sub-committees. Furthermore, the
Board evaluates the work and results of the CEO according to previously
established criteria, including whether the CEO has prepared and carried
out a business strategy which is consistent with the established goals. The
Board shall discuss the results of the assessment and decide which actions
are to be taken, if any.
C O R P O R AT E G O V E R N A N C E

A N N UA L R E P O R T 2 0 1 2 63
At least once a year the CEO shall evaluate the work and results of the
Board of Management, for which he is responsible, according to previously
established criteria. The CEO shall discuss the results of the assessment
with each member of the Board of Management and decide which actions
shall be taken, if any.
At least once a year, the Chairman and the CEO shall have a meeting to
discuss the results of the Board’s assessment of the CEO’s work and results
and the proposed actions to be taken, if any. The CEO shall inform the
Chairman of the results of his/her evaluation of the Board of Management
and which actions will be taken, if any. The Chairman shall inform the
Board of Directors of the discussions with the CEO as he/she deems
necessary and appropriate.
12. Information on the Company’s CEO and a description of his main duties
A profile of Theo Hoen, CEO of Marel, is provided on page 54.
The principal duties of the CEO are as follows:
1 The CEO is responsible for daily operations and is obliged to follow
the Board’s policy and instructions in that regard. The daily operations
do not include measures which are unusual or extraordinary. The CEO
may only take such measures if specially authorised by the Board,
unless it impossible to wait for the Board’s decision without substantial
disadvantage to the Company’s operations. In such an event, the CEO
shall inform the Board of his/her measures, without delay.
2. The CEO shall act as chairman in the Company’s material subsidiaries
which are connected with the sales and manufacturing activities and/or
the core activities of the Company, unless the Board decides otherwise.
3. The CEO is responsible for the work and results of the Board of
Management. See further information of this part of his duties in item
no. 11 above.
4. The CEO shall ensure that the accounts of the Company conform to the
law and accepted practices and that the treatment of the property of
the Company is secure. The CEO shall provide any information that may
be requested by the Company’s Auditors.
13. Information on violations of laws and regulations that the appropriate supervisory or ruling body has determined
No violations of laws and regulations have been determined in 2012 by
supervisory or ruling body.
14. Arrangement of communications between shareholders and the Board of Directors
Shareholders’ meetings, within the limits established by the Company’s
Articles of Association and statutory law, are the supreme authority
in Marel’s affairs as well as the primary communication between
shareholders and the Board of Directors. AGM is scheduled once a year,
before the end of August, and other shareholders’ meetings are convened
when necessary. The AGM is advertised publicly with at least three-week’s
notice in accordance with Icelandic law.
Additionally, Marel‘s communication to shareholders and furthermore to
the market shall be in compliance with relevant regulatory bodies at all
times and disseminated via recognised distribution channels.
15. Analysis of environmental factors and social factors
The Company’s Annual Report contains analysis of environmental factors
and social factors that help to understand the development, success and
position of the Company. The Annual Report is available on the Company’s
website: marel.com/investors.
T O O U R S H A R E H O L D E R S
See Code of Conduct
marel.com/code

64
EUROPEMarel‘s operations
in Scandinavia have recently been
consolidated
2900 people work for Marel in
seventeen countries across Europe
NORWAYis the leading producer
of salmon in
the world, with close to
a million tonnes a year
RUSSIAhas more than tripled
its production of chickenin the last ten years
and is set to overtake
Mexico as the world‘s 4th
largest producer
DENMARKholds the
world record in
meat production
per capita

A N N UA L R E P O R T 2 0 1 2 65
CONSOLIDATED
FINANCIAL
STATEMENTS
FOR 2012

66
Marel is a leading global provider of advanced equipment, systems and services
for the poultry, fish, meat and further processing industries. Marel has offices
and subsidiaries in over 30 countries and a global network of more than 100
agents and distributors.
The Consolidated Financial Statements for the year 2012 comprise the financial
statements of Marel hf. (“the Company”) and its subsidiaries (together “the
Group”). The Consolidated Financial Statements are prepared in accordance with
International Financial Reporting Standards (IFRS) as adopted by the European
Union (EU) and additional Icelandic disclosure requirements.
Operations in 2012
According to the Consolidated Statement of Comprehensive Income, the
Group’s operating revenue amounted to EUR 714.0 million in 2012, compared
to EUR 668.4 million in 2011. Profit for the period amounted to EUR 35.6 million
(2011: EUR 34.5 million). Total comprehensive income amounted to EUR 36.6
million (2011: EUR 33.2 million).
No acquisitions or divestments were made in 2012.
According to the Consolidated Statement of Financial Position, the Company’s
assets amounted to EUR 865.1 million at the end of 2012 (2011: EUR 877.8
million). Equity amounted to EUR 403.7 million at the end of 2012 (at year-end
2011: EUR 373.5 million) or 46.7% of total assets (at year-end 2011: 42.5%). Net
interest bearing debt decreased from EUR 250.5 million at the end of 2011 to
EUR 243.2 million at the end of 2012. The Group was in full compliance with
bank covenants in 2012.
The Company repaid its ISK (Icelandic krona) bond issue, equivalent to EUR 7.6
million and has by that removed exposure to the ISK in the financing of the
Group. Financing is now dominated in EUR and USD in a proportion providing
natural hedging to exposures.
Marel signed an amendment to its current long-term financing entered into in
November 2010. By that a junior loan was converted into senior debt, resulting
in an all senior facility. The facility was extended by one year with final maturity
in November 2016 and the interest terms were favorably adjusted, leading to
further reduction in interest costs.
According to the Company’s 2012 Annual General Meeting decision, a dividend
of EUR 6.9 million or 0.95 euro cents per share was paid out to shareholders,
corresponding to about 20% of Company’s profit for the year 2011.
The goodwill of the Group was tested for impairment at year-end by calculating
its recoverable amount. The results of these impairment tests were that there
was no need for impairment as the recoverable amount of the goodwill was well
above book value.
A challenging economic environment lead to a slow down in orders received in
2012, compared to the previous year. At the end of 2012, the Company’s order
book amounted to EUR 125 million (2011: EUR 189 million), with orders from
across different geographic areas and industries.
The management and the Board of Directors of the Group believe that they are
taking all the necessary measures to support the sustainability and growth of
the Group’s business in the current circumstances. Accordingly they continue
to adopt the going concern basis in preparing the annual report and financial
statements.
The management of the Group believes it is well placed to manage its business
risks successfully based on the present economic outlook.
Share Capital and Articles of Association
At year-end, Marel’s shares totalled 735.6 million, all in one class; thereof Marel
holds 4.1 million treasury shares. The number of shareholders at year-end
2012 was 2,144 compared to 1,799 at the end of 2011. One shareholder had a
holding interest of more than 10% in the Company, Eyrir Invest hf., with 33.1%.
In 2012, Marel purchased 4.1 million shares for EUR 3.6 million to fulfil future
stock option obligations, and sold 6.7 million treasury shares for a total amount
of EUR 3.7 million to fulfil the employees’ stock option programme.
Share purchase options are granted to management and selected employees.
Total granted and unexercised share purchase options at end of the year 2012
were 28.9 million shares, of which 9.7 million are exercisable at the end of 2012
and the remainder will become exercisable in the years 2013 to 2018.
At the Company’s 2010 Annual General Meeting, the shareholders authorised
the Board of Directors to increase the Company’s share capital by 45 million
shares to fulfil stock option agreements. Thereof, 8.4 million shares have been
issued at end of year 2012. The Company’s Board of Directors is also authorised
to increase its share capital by up to ISK 240.0 million nominal value, where ISK
146.8 million have already been issued. Shareholders waived their pre-emptive
rights.
The Board of Directors will propose to the 2013 Annual General Meeting
that EUR cents 0.97 dividend per outstanding share will be paid for the
operational year 2012, corresponding to approximately EUR 7.1 million or 20%
of total profit of EUR 35.6 million for the year 2012, and refers to the financial
statements regarding appropriation of the profit for the year and changes in
shareholders’ equity.
Corporate Governance
The Company’s corporate governance policy is based on the Guidelines
on Corporate Governance issued in March 2012 by the Icelandic Chamber
The Board of Directors’ and CEO’s Report

A N N UA L R E P O R T 2 0 1 2 67
of Commerce, NASDAQ OMX Iceland hf. and Confederation of Icelandic
Employers, which is in accordance with Clause 2.27 in the Rules for issuers
of financial instruments on NASDAQ OMX Iceland issued in December 2009.
In compliance with the guidelines, the Board of Directors has prepared a
Corporate Governance Statement which is distributed with the Consolidated
Financial Statements 2012 and disclosed in the Annual Report 2012.
Candidates for the Board of Directors of the Company have to notify the Board
of Directors in writing at least five full days before the beginning of the Annual
General Meeting. The Company’s Articles of Association can only be amended
with the approval of 2/3 of casted votes and approval of shareholders who
control at least 2/3 of the shares represented in a legal shareholders’ meeting,
provided that the notification calling the meeting thoroughly informs on such
amendment and what the amendment consists in.
Statement by the Board of Directors and the CEO
According to the Board of Directors‘ best knowledge these Consolidated
Financial Statements comply with International Financial Reporting
Standards (IFRS) on annual accounts, as adopted by the EU and additional
Icelandic disclosure requirements for consolidated financial statements of
listed companies. According to the Board of Directors‘ best knowledge, the
statements give a true and fair view of the Group´s assets and liabilities,
financial position as at 31 December 2012, operating performance and
the cash flow for the year ended 31 December 2012 as well as describe the
principal risk and uncertainty factors faced by the Company. The report
of the Board of Directors provides a clear overview of developments and
achievements in the Company’s operations and its situation.
The Board of Directors and CEO of Marel hf. hereby ratify the Consolidated
Financial Statements of Marel hf. for the year 2012 with their signatures.
Garðabær, 5 February 2013
Board of Directors
Árni Oddur Þórðarson
Chairman of the board
Friðrik JóhannssonArnar Þór Másson
Margrét JónsdóttirHelgi Magnússon
Ásthildur Margrét OtharsdóttirTheo BruinsmaChief Executive Officer
Theo G.M. Hoen
68
To the Board of Directors and Shareholders of Marel hf.
We have audited the accompanying consolidated financial statements of
Marel hf., which comprise the Consolidated Statement of Financial Position
as at 31 December 2012, the consolidated statements of comprehensive
income, changes in equity and cash flows for the year then ended, and
notes, comprising a summary of significant accounting policies and other
explanatory information.
Management’s Responsibility for the Financial Statements
Management is responsible for the preparation and fair presentation of
these consolidated financial statements in accordance with International
Financial Reporting Standards as adopted by the EU, and for such internal
control as management determines is necessary to enable the preparation of
consolidated financial statements that are free from material misstatement,
whether due to fraud or error.
Auditors’ Responsibility
Our responsibility is to express an opinion on these consolidated financial
statements based on our audit. We conducted our audit in accordance
with International Standards on Auditing. Those standards require that we
comply with ethical requirements and plan and perform the audit to obtain
reasonable assurance whether the consolidated financial statements are free
from material misstatement.
An audit involves performing procedures to obtain audit evidence about
the amounts and disclosures in the consolidated financial statements. The
procedures selected depend on our judgment, including the assessment of
the risks of material misstatement of the consolidated financial statements,
whether due to fraud or error. In making those risk assessments, we
consider internal control relevant to the entity’s preparation and fair
presentation of the consolidated financial statements in order to design
audit procedures that are appropriate in the circumstances, but not for
the purpose of expressing an opinion on the effectiveness of the entity’s
internal control. An audit also includes evaluating the appropriateness of
accounting policies used and the reasonableness of accounting estimates
made by management, as well as evaluating the overall presentation of the
consolidated financial statements.
We believe that the audit evidence we have obtained is sufficient and
appropriate to provide a basis for our audit opinion.
Opinion
In our opinion, the consolidated financial statements give a true and fair
view of the consolidated financial position of Marel hf. as at 31 December
2012, and of its consolidated financial performance and its consolidated
cash flows for the year then ended in accordance with International
Financial Reporting Standards as adopted by the EU.
Report on the Board of Directors Report
Pursuant to the legal requirement under Article 106, Paragraph 1, Item 5 of
the Icelandic Financial Statement Act No. 3/2006, we confirm that, to the
best of our knowledge, the report of the Board of Directors accompanying
the financial statements includes the information required by the Financial
Statement Act if not disclosed elsewhere in the Financial Statements.
Reykjavik, 5 February 2013
Independent auditors’ report on consolidated financial statements
KPMG ehf.
Sæmundur Valdimarsson Kristrún H. Ingólfsdóttir

A N N UA L R E P O R T 2 0 1 2 69
2012 2011Notes
Revenues ............................................................................................................................................... 5 713,960 668,357 Cost of sales .......................................................................................................................................... (464,734) (421,068) Gross profit 249,226 247,289
Selling and marketing expenses ....................................................................................................... (90,119) (79,815) Research and development expenses ............................................................................................ (41,566) (40,323) Administrative expenses ..................................................................................................................... (56,945) (53,693) Other operating income (expenses) ................................................................................................. 6 485 (11,292)
Result from operations 61,081 62,166
Finance costs ........................................................................................................................................ 7 (18,366) (19,852) Finance income ..................................................................................................................................... 7 336 1,744 Net finance costs .................................................................................................................................. 7 (18,030) (18,108)
Result before income tax 43,051 44,058
Income tax ............................................................................................................................................. 9 (7,442) (9,595) Profit for the period 35,609 34,463
Other Comprehensive Income
Currency translation differences ........................................................................................................ (229) 779 Cash flow hedges ................................................................................................................................. 1,602 (2,686) Income tax relating to cash flow hedges and currency translation differences ........................ (400) 672 Other comprehensive income for the period, net of tax 973 (1,235) Total comprehensive income for the period 36,582 33,228
Profit (loss) attributable to:Shareholders of the Company ........................................................................................................... 35,609 34,463
35,609 34,463
Comprehensive income attributable to:Shareholders of the Company ........................................................................................................... 36,582 33,228
36,582 33,228 Earnings per share for result attributable to equity holders of the company during the period (expressed in EUR cent per share): - basic .................................................................................................................................................... 10 4.88 4.70 - diluted ................................................................................................................................................. 10 4.83 4.65
Earnings per share for total comprehensive income attributable to equity holders of the company during the period (expressed in EUR cent per share): - basic .................................................................................................................................................... 5.01 4.53 - diluted ................................................................................................................................................. 4.96 4.48
Consolidated Statement of Comprehensive Income
Marel hf., Consolidated Financial Statements 31 December 2012
All amounts in EUR*1000
unless otherwise stated.
The Notes on pages 74-132 are an
integral part of the Consolidated
Financial Statements
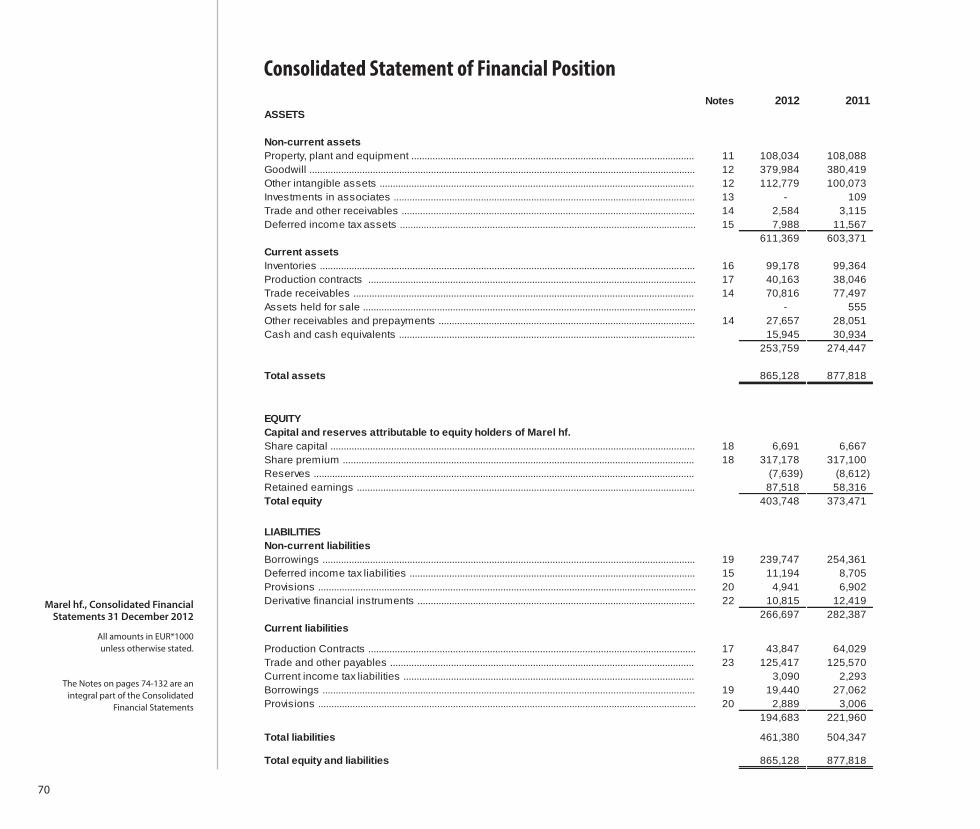
70
Notes 2012 2011ASSETS
Non-current assetsProperty, plant and equipment ........................................................................................................... 11 108,034 108,088 Goodwill .................................................................................................................................................. 12 379,984 380,419 Other intangible assets ....................................................................................................................... 12 112,779 100,073 Investments in associates .................................................................................................................. 13 - 109 Trade and other receivables ............................................................................................................... 14 2,584 3,115 Deferred income tax assets ................................................................................................................ 15 7,988 11,567
611,369 603,371 Current assetsInventories .............................................................................................................................................. 16 99,178 99,364 Production contracts ............................................................................................................................ 17 40,163 38,046 Trade receivables ................................................................................................................................. 14 70,816 77,497 Assets held for sale .............................................................................................................................. - 555 Other receivables and prepayments ................................................................................................. 14 27,657 28,051 Cash and cash equivalents ................................................................................................................ 15,945 30,934
253,759 274,447
Total assets 865,128 877,818
EQUITYCapital and reserves attributable to equity holders of Marel hf.Share capital .......................................................................................................................................... 18 6,691 6,667 Share premium ..................................................................................................................................... 18 317,178 317,100 Reserves ................................................................................................................................................ (7,639) (8,612) Retained earnings ................................................................................................................................ 87,518 58,316 Total equity 403,748 373,471
LIABILITIESNon-current liabilitiesBorrowings ............................................................................................................................................. 19 239,747 254,361 Deferred income tax liabilities ............................................................................................................ 15 11,194 8,705 Provisions ............................................................................................................................................... 20 4,941 6,902 Derivative financial instruments ......................................................................................................... 22 10,815 12,419
266,697 282,387 Current liabilities
Production Contracts ............................................................................................................................ 17 43,847 64,029 Trade and other payables ................................................................................................................... 23 125,417 125,570 Current income tax liabilities .............................................................................................................. 3,090 2,293 Borrowings ............................................................................................................................................. 19 19,440 27,062 Provisions ............................................................................................................................................... 20 2,889 3,006
194,683 221,960
Total liabilities 461,380 504,347
Total equity and liabilities 865,128 877,818
Consolidated Statement of Financial Position
Marel hf., Consolidated Financial Statements 31 December 2012
All amounts in EUR*1000
unless otherwise stated.
The Notes on pages 74-132 are an
integral part of the Consolidated
Financial Statements

A N N UA L R E P O R T 2 0 1 2 71
Share Capital
Share premium *)
Hedge reserve
Translation reserve
Retained earnings Total equity
Balance at 1 January 2011 6,694 320,250 (7,300) (77) 23,703 343,269
Profit for the year ............................................................. 34,463 34,463 Total other comprehensive income ............................ (2,014) 779 (1,235)
Employee share option scheme:Treasury shares purchased ......................................... (65) (5,618) (5,683) Treasury shares sold .................................................... 4 221 225 Treasury shares, transaction costs ............................ (17) (17) Value of services provided ............................................ 411 411 Value of services provided released .......................... (529) 150 (379) Issue of share capital regarding Stock Options ....... 34 2,383 2,417 Issue of share capital, transaction costs ................... (1) (1)
(27) (3,150) (2,014) 779 34,613 30,201
Balance at 31 December 2011 6,667 317,100 (9,314) 702 58,316 373,471
Profit for the year ............................................................. 35,609 35,609 Total other comprehensive income ............................ 1,202 (229) 973
Employee share option scheme:Treasury shares purchased ......................................... (38) (3,544) (3,582) Treasury shares sold .................................................... 62 3,625 3,687 Treasury shares, transaction costs ............................ (10) (10) Dividend paid .................................................................. (6,900) (6,900) Value of services provided ............................................ 582 582 Value of services provided released .......................... (575) 493 (82)
24 78 1,202 (229) 29,202 30,277
Balance at 31 December 2012 6,691 317,178 (8,112) 473 87,518 403,748
Attributable to equity holders of the Company
*) Includes reserve for share based payments as per 31 December 2012 of EUR 1,617 (2011: EUR 1,610). Dividend per share In March 2012 a dividend of EUR 6,900 (EUR 0.95 cent per share) was declared. All has been paid. No dividends were paid in 2011.
Consolidated Statement of Changes in Shareholders’ Equity
Marel hf., Consolidated Financial Statements 31 December 2012
All amounts in EUR*1000
unless otherwise stated.
The Notes on pages 74-132 are an
integral part of the Consolidated
Financial Statements

72
Notes 2012 2011
Cash flows from operating activitiesResult from operations ........................................................................................................................ 61,081 62,166 Adjustments to reconcile result from operations to net cash provided by operating activities:Depreciation and impairment of property, plant and equipment ................................................. 11 9,945 10,899 Amortisation and impairment of intangible assets ........................................................................ 12 14,937 13,941 Gain on sale of property, plant and equipment .............................................................................. (190) (71) Changes in non current receivables ................................................................................................. 531 554 Working capital provided by / (used in) operating activities 86,304 87,489
Changes in working capital:Inventories and production contracts ................................................................................................ (23,132) (51,469) Trade and other receivables ............................................................................................................... 3,972 9,623 Trade and other payables ................................................................................................................... 340 18,278 Provisions ............................................................................................................................................... (1,915) (205) Changes in operating assets and liabilities (20,735) (23,773)
Cash generated from operating activities 65,569 63,716
Income tax paid ..................................................................................................................................... (1,341) (3,133) Interest and finance costs paid .......................................................................................................... (15,133) (17,400) Net cash from operating activities 49,095 43,183
Consolidated Statement of Cash Flows
Marel hf., Consolidated Financial Statements 31 December 2012
All amounts in EUR*1000
unless otherwise stated.
The Notes on pages 74-132 are an
integral part of the Consolidated
Financial Statements

A N N UA L R E P O R T 2 0 1 2 73
Notes 2012 2011
Cash flows from Investing activitiesInterest received .................................................................................................................................... 333 682 Purchase of property, plant and equipment ..................................................................................... (11,279) (8,850) Investments in intangibles .................................................................................................................. (28,153) (20,715) Proceeds from sale of property, plant and equipment .................................................................. 1,807 193 Other changes ....................................................................................................................................... (2) - Net cash used in investing activities (37,294) (28,690)
Cash flows from financing activitiesProceeds from issue of ordinary shares .......................................................................................... - 2,417 Purchase of treasury shares .............................................................................................................. (3,592) (5,700) Sale of treasury shares ........................................................................................................................ 3,687 225 Proceeds from borrowings ................................................................................................................. 47,520 20,363 Repayments of borrowings ................................................................................................................. (67,201) (64,652) Loans to third parties ........................................................................................................................... - 500 Dividends paid ....................................................................................................................................... (6,900) - Other changes ....................................................................................................................................... - (273) Net cash used in financing activities (26,486) (47,120)
Net decrease in net cash (14,685) (32,627)
Exchange (loss) / gain on net cash ................................................................................................... (304) (342) Net cash at beginning of the period .................................................................................................. 30,934 63,903 Net cash at end of the period 15,945 30,934
Cash and cash equivalents ................................................................................................................ 15,945 30,934 Net cash at end of the period 15,945 30,934
Marel hf., Consolidated Financial Statements 31 December 2012
All amounts in EUR*1000
unless otherwise stated.
The Notes on pages 74-132 are an
integral part of the Consolidated
Financial Statements

Marel hf., Consolidated Financial
Statements 31 December 2012
All amounts in EUR*1000
unless otherwise stated.
Notes to the Consolidated
Financial Statements
74
Notes to the Consolidated Financial Statements
1 General information Marel hf. ("the Company") is a limited liability company incorporated and domiciled in Iceland. The address of its registered office is Austurhraun 9, Gardabaer. The Consolidated Financial Statements of the Company as at and for the year ended 31 December 2012 comprise the Company and its subsidiaries (together "the Group"). The Group is primarily involved in the manufacture, development, distribution and sales of solutions for use in all major sectors of the food processing industry. All amounts are in EUR*1000 unless otherwise stated. The Company has its listing on the Nasdaq OMX Nordic Exchange in Iceland. The Financial Statements as presented in this report are subject to the adoption by the Annual General Meeting of Shareholders, to be held on 6 March 2013.
2 Summary of significant accounting policies The principal accounting policies applied in the preparation of these Consolidated Financial Statements are set out below. These policies have been consistently applied to the years presented, unless otherwise stated.
2.1 Basis of preparation
A. Statement of Compliance The Consolidated Financial Statements of the Group have been prepared in accordance with International Financial Reporting Standards (IFRSs) as adopted by the European Union (EU) and additional Icelandic disclosure requirements for consolidated financial information of listed companies in accordance with Icelandic Financial Statements Act No. 3/2006 and rules for issuers of financial instruments in Nasdaq OMX in Iceland. These Consolidated Financial Statements have been approved for issue by the Board of Directors on 5 February 2013. The accounting policies, as adopted by the EU, depart from full IFRS in few standards, interpretations and amendments that will have minor effects on future reporting of the Group. B. Basis of Measurement These Consolidated Financial Statements have been prepared under the historical cost convention, as modified by the revaluation of available-for-sale financial assets and financial assets (including derivative instruments) at fair value through profit or loss or other comprehensive income. C. Functional and presentation currency Items included in the Financial Statements of each entity in the Group are measured using the currency that best reflects the economic substance of the underlying events and circumstances relevant to that entity (“the functional currency”). The Consolidated Financial Statements are presented in Euro (EUR), which is the Group's reporting currency. All financial information presented in Euro has been rounded to the nearest thousand.

Marel hf., Consolidated Financial
Statements 31 December 2012
All amounts in EUR*1000
unless otherwise stated.
Notes to the Consolidated
Financial Statements
A N N UA L R E P O R T 2 0 1 2 75
D. Use of estimates and judgements The preparation of the Consolidated Financial Statements in accordance with IFRS requires the use of certain critical accounting estimates. It also requires management to exercise judgment in the process of applying the Group's accounting policies. The areas involving a higher degree of judgment or complexity, or areas where assumptions and estimates are significant to the Consolidated Financial Statements are disclosed in note 4. Estimates and underlying assumptions are reviewed on an ongoing basis. Revisions to accounting estimates are recognised in the period in which the estimates are revised and in any future period affected. E. Changes in accounting policies Standards, amendments and interpretations to existing standards that are not yet effective have not been early adopted by the Group.
The following standards and amendments to existing standards have been published and have an effective date on or after 1 January.
Amendments to IFRS 7 Disclosures – Transfers of Financial Assets (Effective for annual periods beginning on or after 1 July 2011) have been adopted as per 1 January 2012 and have a limited effect on the Group’s Consolidated Financial Statements of 2012;
Amendments to IAS 12 Deferred Tax – Recovery of Underlying Assets (Effective for annual periods beginning on or after 1 January 2012) have been adopted as per 1 January 2012 and have a limited effect on the Group’s Consolidated Financial Statements of 2012.
The Group has not applied the following new and revised IFRSs that have been issued but are not yet effective: Effective for annual periods beginning on or after 1 January 2013: IFRS 10 Consolidated Financial Statements IFRS 11 Joint Arrangements IFRS 12 Disclosure of Interests in Other Entities IFRS 13 Fair Value Measurement IAS 19 (as revised in 2011) Employee Benefits Effective for annual periods beginning on or after 1 January 2015: IFRS 9 Financial Instruments
The impact on the Group's financial statements of these changes in guidelines is estimated to be limited.

Marel hf., Consolidated Financial
Statements 31 December 2012
All amounts in EUR*1000
unless otherwise stated.
Notes to the Consolidated
Financial Statements
76
2.2 Consolidation
Subsidiaries Subsidiaries are all entities over which the Group has the power to govern the financial and operating policies of an entity so as to obtain benefits from its activities generally accompanying a shareholding of more than one half of the voting rights. The existence and effect of potential voting rights that are presently exercisable or presently convertible are considered when assessing whether the Group controls another entity. Subsidiaries are fully consolidated from the date on which control is transferred to the Group. They are de-consolidated from the date on which control ceases. The principal subsidiaries are listed in note 29. The purchase method of accounting is used to account for the acquisition of subsidiaries by the Group. The cost of an acquisition is measured as the fair value of the assets given, equity instruments issued and liabilities incurred or assumed at the date of exchange. Identifiable assets acquired and liabilities and contingent liabilities assumed in a business combination are measured initially at their fair values at the acquisition date. The excess of the cost of acquisition over the fair value of the Group's share of the identifiable net assets acquired is recorded as goodwill. If the cost of acquisition is less than the fair value of the net assets of the subsidiary acquired, the difference is recognised directly in the Consolidated Statement of Comprehensive Income. Intercompany transactions, balances and unrealised gains on transactions between Group companies are eliminated. Unrealised losses are also eliminated unless the transaction provides evidence of an impairment of the asset transferred. Accounting policies of subsidiaries have been changed where necessary to ensure consistency with the policies adopted by the Group. Transactions and non-controlling interests Transactions that result in changes in ownership interests while retaining control are accounted for as transactions with equity holders in their capacity as equity holders. As a result, no gain or loss on such changes is recognised in profit or loss but rather in equity. Also, no change in the carrying amounts of assets (including goodwill) or liabilities is recognised as a result of such transactions. This approach is consistent with NCI being a component of equity. Associates Associates are all entities over which the Group has significant influence but not control, generally accompanying a shareholding of between 20% and 50% of the voting rights. Investments in associates are accounted for by the equity method of accounting and are initially recognised at cost. The Group’s investment in associates includes goodwill identified on acquisition, net of any accumulated impairment loss. See note 2.7 for the impairment of non-financial assets including goodwill. The Group's share of its associates' post-acquisition profits or losses is recognised in the Statement of Comprehensive Income, and its share of post-acquisition movements in reserves is recognised in reserves. The cumulative post-acquisition movements are adjusted against the carrying amount of the investment. When the Group's share of losses in an associate equals or exceeds its interest in the associate, including any other unsecured receivables, the Group does not recognise further losses, unless it has incurred obligations or made payments on behalf of the associate. Unrealised gains on transactions between the Group and its associates are eliminated to the extent of the Group's interest in the associates. Unrealised losses are also eliminated unless the transaction provides evidence of an impairment of the asset transferred. Accounting policies of associates have been changed where necessary to ensure consistency with the policies adopted by the Group. Dilution gains and losses arising in investments in associates are recognised in the Statement of Comprehensive Income.

Marel hf., Consolidated Financial
Statements 31 December 2012
All amounts in EUR*1000
unless otherwise stated.
Notes to the Consolidated
Financial Statements
A N N UA L R E P O R T 2 0 1 2 77
2.3 Segment information
An operating segment is a component of the Group that engages in business activities from which it may earn revenues and incur expenses, including revenues and expenses that relate to transactions with any of the Group's other components. All operating segments' operating results are reviewed regularly by the Group's CEO and strategic decisions are based on these operating segments. The operating structure in the Group is developing further towards the operating segments.
2.4 Foreign currency translation
Transactions and balances Foreign currency transactions are translated into the respective functional currencies of Group entities, and from there into the Group's reporting currency using the exchange rates prevailing at the dates of the transactions or valuation where items are revaluated. Foreign exchange gains and losses resulting from the settlement of such transactions and from the translation at year-end exchange rates of monetary assets and liabilities denominated in foreign currencies are recognised in the Statement of Comprehensive Income, except when deferred in equity as permanent loan, as qualifying cash flow hedges and qualifying net investment hedges as explained in note 2.9. Foreign exchange gains and losses that relate to borrowings and cash and cash equivalents as well as all other foreign exchange gains and losses are recognised immediately in the Statement of Comprehensive Income within 'Finance income' or 'Finance costs'. Group companies The results and financial position of all the Group entities (none of which has the currency of a hyperinflationary economy) that have a functional currency different from the presentation currency are translated into the presentation currency as follows: (i) assets and liabilities presented are translated at the closing rate at the date of that Consolidated Statement of Financial Position; (ii) income and expenses for each Statement of Comprehensive Income are translated at average exchange rates, unless this average is not a reasonable approximation of the cumulative effect of the rates prevailing on the transaction dates, in which case income and expenses are translated at the dates of the transactions; and (iii) all resulting exchange differences are recognised as a separate component of equity (Translation reserve). On consolidation, exchange differences arising from the translation of the net investment in foreign operations, and of borrowings and other currency instruments designated as hedges of such investments, are recognised in Translation reserve. When a foreign operation is partially disposed of or sold, exchange differences that were recorded in other comprehensive income are recognised in the profit or loss for the period as part of the gain or loss on sale. Goodwill and fair value adjustments arising on the acquisition of a foreign entity are treated as assets and liabilities of the foreign entity and translated at the closing rate. In case of a non-wholly-owned subsidiary, the relevant proportionate share of the translation difference is allocated to the non-controlling interests. When a foreign operation is disposed of such that control, significant influence or joint control is lost, the cumulative amount in the translation reserve related to that foreign operation is reclassified to profit or loss as part of the gain or loss on disposal. When the Group disposes of only part of its interest in a subsidiary that includes a foreign operation while retaining control, the relevant proportion of the cumulative amount is reattributed to non-controlling interests. When the Group disposes of only part of its investment in an associate or joint venture that includes a foreign operation while retaining significant influence or joint control, the relevant proportion of the cumulative amount is reclassified to profit or loss.

Marel hf., Consolidated Financial
Statements 31 December 2012
All amounts in EUR*1000
unless otherwise stated.
Notes to the Consolidated
Financial Statements
78
2.5 Property, plant and equipment
Land and buildings comprise mainly factories and offices. All property, plant and equipment (PPE) is recognised at cost less subsequent depreciation and impairment, except for land, which is shown at cost less impairment. Cost includes expenditure that is directly attributable to the acquisition of the items. Subsequent costs are included in the asset’s carrying amount or recognised as a separate asset, as appropriate, only when it is probable that future economic benefits associated with the item will flow to the Group and the cost of the item can be measured reliably. The carrying amount of the replaced part is derecognised. All other repairs and maintenance are charged to the Consolidated Statement of Comprehensive Income for the period during the financial period in which they are incurred. Land is not depreciated. Depreciation on assets is calculated using the straight-line method to allocate the cost of each asset to its residual value over its estimated useful life, as follows:
Buildings..................................................................................................................... 30-50 years Plant and machinery................................................................................................... 4-15 years Vehicles & equipment................................................................................................. 3-7 years
Major renovations are depreciated over the remaining useful life of the related asset or to the date of the next major renovation, whichever is sooner. The assets’ residual values and useful lives are reviewed, and adjusted if appropriate, at each reporting date. An asset’s carrying amount is written down immediately to its recoverable amount if the asset’s carrying amount is greater than its estimated recoverable amount (see note 2.7). Gains and losses on disposals are determined by comparing proceeds with carrying amount. These are recognised within other operating income (expenses) in the Statement of Comprehensive Income. Borrowing cost is expensed as incurred except when directly attributable to acquisition or construction of an asset that necessarily takes a substantial period of time to get ready for its intended use. Such borrowing cost is capitalised as part of the cost of the asset when it is probable that it will result in future economic benefits to the entity and the cost can be measured reliably.

Marel hf., Consolidated Financial
Statements 31 December 2012
All amounts in EUR*1000
unless otherwise stated.
Notes to the Consolidated
Financial Statements
A N N UA L R E P O R T 2 0 1 2 79
2.6 Intangible assets
Goodwill Goodwill represents the excess of the cost of an acquisition over the fair value of the Group’s share of the net identifiable assets of the acquired subsidiary at the date of acquisition. Goodwill is tested annually for impairment and carried at cost less accumulated impairment losses. Gains and losses on the disposal of an entity include the carrying amount of goodwill relating to the entity sold. Goodwill on some acquisitions that occurred prior to 1 January 2004 has been charged in full to retained earnings in shareholders’ equity, such goodwill has not been retroactively capitalised. Goodwill is allocated to cash-generating units for the purpose of impairment testing. The allocation is made to those cash-generating units or groups of cash-generating units that are expected to benefit from the business combination in which the goodwill arose. Research and development Research expenditure is recognised as an expense as incurred. Costs incurred on development projects relating to the design and testing of new or improved products are recognised as intangible assets when it is probable that the project will generate future economic benefits, considering its commercial and technological feasibility, and costs can be measured reliably. Other development expenditures are recognised as an expense as incurred. Development costs previously recognised as an expense are not recognised as an asset in a subsequent period. Development costs that have a finite useful life and that have been capitalised are amortised from the commencement of the commercial production of the product on a straight-line basis over the period of its expected benefit, not exceeding five years. Patents & Trade name Expenditure to acquire patents, trademarks and licenses is capitalised and amortised using the straight-line method over their useful lives, but not exceeding 8 years, or 11 years in case of trademarks, with the exception of one particular case. These intangible assets are not revaluated. Other intangible assets Costs associated with maintaining computer software programmes are recognised as an expense as incurred. Development costs that are directly attributable to the design and testing of identifiable and unique software products controlled by the group are recognised as intangible assets when the following criteria are met: – it is technically feasible to complete the software product so that it will be available for use; – management intends to complete the software product and use or sell it; – there is an ability to use or sell the software product; – it can be demonstrated how the software product will generate probable future economic benefits; – adequate technical, financial and other resources to complete the development and to use or sell the software product are available; and – the expenditure attributable to the software product during its development can be measured reliably. Directly attributable costs capitalised as part of the software product include the software development employee costs and an appropriate portion of relevant overheads. Other development expenditures that do not meet these criteria are recognised as an expense as incurred. Development costs previously recognised as an expense are not recognised as an asset in a subsequent period. Computer software development costs recognised as assets are amortised over their estimated useful lives, which can vary from 3 to 5 years.

Marel hf., Consolidated Financial
Statements 31 December 2012
All amounts in EUR*1000
unless otherwise stated.
Notes to the Consolidated
Financial Statements
80
2.7 Impairment of non-financial assets
Assets that have an indefinite useful life are not subject to amortisation and are tested annually for impairment. Assets that are subject to amortisation are reviewed for impairment whenever events or changes in circumstances indicate that the carrying amount may not be recoverable. Non-financial assets other than goodwill that suffer impairment are reviewed for possible reversal of the impairment at each reporting date. For the purpose of assessing impairment of assets which are not subject to amortisation, assets are grouped at the lowest levels for which there are separately identifiable cash flows, the cash-generating units (CGU). An impairment loss is recognised for the amount by which the asset’s carrying amount exceeds its recoverable amount. The recoverable amount of an asset or CGU is the higher of an asset’s fair value less costs to sell and value in use. In assessing value in use, the estimated future cash flows are discounted to their present value using a discount rate that reflects current market assessments of the time value of money and the risks specific to the asset or CGU. Impairment losses recognised in respect of CGUs are allocated first to reduce the carrying amount of any goodwill allocated to the CGU, and then to reduce the carrying amounts of the other assets in the CGU on a pro rata basis. An impairment loss in respect of goodwill is not reversed. For other assets, an impairment loss is reversed only to the extent that the asset’s carrying amount does not exceed the carrying amount that would have been determined, net of depreciation or amortisation, if no impairment loss had been recognised.
2.8 Financial assets
The Group classifies its investments in the following categories: financial assets at fair value through profit or loss, held-to-maturity financial assets, receivables and available-for-sale financial assets. The classification depends on the purpose for which the investments were acquired. Management determines the classification of its investments at initial recognition. Financial assets at fair value through profit or loss A financial asset is classified at fair value through profit or loss if it is classified as held for trading or is designated as such upon initial recognition. Financial assets are designated at fair value through profit or loss if the Group manages such investments and makes purchase and sale decisions based on their fair value in accordance with the Group’s documented risk management or investment strategy. Upon initial recognition attributable transaction costs are recognised in profit or loss as incurred. Financial assets at fair value through profit or loss are measured at fair value, and changes therein are recognised in profit or loss. If the Group has the positive intent and ability to hold debt securities to maturity, then such financial assets are classified as held-to-maturity. Held-to-maturity financial assets If the Group has the positive intent and ability to hold debt securities to maturity, then such financial assets are classified as held to maturity. Held-to-maturity financial assets are recognised initially at fair value plus any directly attributable transaction costs. Subsequent to initial recognition held-to-maturity financial assets are measured at amortised cost using the effective interest method, less any impairment losses. Any sale or reclassification of a more than insignificant amount of held-to-maturity investments not close to their maturity would result in the reclassification of all held-to-maturity investments as available for sale, and prevent the Group from classifying investment securities as held to maturity for the current and the following two financial years. Receivables Receivables are non-derivative financial assets with fixed or determinable payments that are not quoted in an active market. They are included in current assets, except for maturities greater than 12 months after the reporting date. These are classified as non-current assets. The Group’s receivables comprise ‘trade receivables’ and ‘cash and cash

Marel hf., Consolidated Financial
Statements 31 December 2012
All amounts in EUR*1000
unless otherwise stated.
Notes to the Consolidated
Financial Statements
A N N UA L R E P O R T 2 0 1 2 81
equivalents’ in the Consolidated Statement of Financial Position (notes 2.12 and 2.13) and are recognised initially at fair value and subsequently measured at amortised cost using the effective interest method. Available-for-sale financial assets Available-for-sale financial assets are non-derivatives that are either designated in this category or not classified in any of the other categories. They are recognised initially at fair value and included in non-current assets unless management intends to dispose of the investment within 12 months of the reporting date. Regular purchases and sales of financial assets are recognised on trade-date, the date on which the Group commits to purchase or sell the asset. Investments are initially recognised at fair value plus transaction costs for all financial assets not carried at fair value through profit or loss. Financial assets are derecognised when the rights to receive cash flows from the investments have expired or have been transferred and the Group has transferred substantially all risks and rewards of ownership. Available-for-sale financial assets are subsequently carried at fair value. The fair values of quoted investments are based on current bid prices. If the market for a financial asset is not active (and for unlisted securities), the Group establishes fair value by using valuation techniques. These include the use of recent arm’s length transactions, reference to other instruments that are substantially the same and discounted cash flow analysis refined to reflect the issuer’s specific circumstances. The Group assesses at each reporting date whether there is objective evidence that a financial asset or a group of financial assets is impaired. In the case of equity securities classified as available for sale, a significant or prolonged decline in the fair value of the security below its cost is considered as an indicator that the securities are impaired. If any such evidence exists for available-for-sale financial assets, the cumulative loss – measured as the difference between the acquisition cost and the current fair value, less any impairment loss on that financial asset previously recognised in profit or loss – is removed from Equity and recognised in the Consolidated Statement of Comprehensive Income for the period. Impairment losses recognised in the Consolidated Statement of Comprehensive Income for the period on equity instruments are not reversed through the Consolidated Statement of Comprehensive Income for the period. Impairment testing of receivables is described in note 2.12. The carrying value less impairment provision of trade receivables and payables are assumed to approximate their fair values due to the short-term nature of trade receivables. The fair value of financial liabilities for disclosure purposes is estimated by discounting the future contractual cash flows at the current market interest rate that is available to the Group for similar financial instruments. The fair value of investments traded in active markets (such as trading and available-for-sale securities) is based on quoted market prices at the reporting date. The fair value of investments that are not traded in an active market is determined by using valuation techniques. The Group uses a variety of methods and makes assumptions that are based on market conditions existing at each reporting date.
2.9 Derivative financial instruments and hedging activities
Derivatives are initially recognised at fair value on the date a derivative contract is entered into and are subsequently revaluated at their fair value. The method of recognising the resulting gain or loss depends on whether the derivative is designated as a hedging instrument, and if so, the nature of the item being hedged. The Group designates certain derivatives as either: (a) hedges of a particular risk associated with a recognised asset or liability or a highly probable forecast transaction (cash flow hedge); or (b) hedges of a net investment in a foreign operation (net investment hedge).

Marel hf., Consolidated Financial
Statements 31 December 2012
All amounts in EUR*1000
unless otherwise stated.
Notes to the Consolidated
Financial Statements
82
The Group documents at the inception of the transaction the relationship between hedging instruments and hedged items, as well as its risk management objectives and strategy for undertaking various hedging transactions. The Group also documents its assessment, both at hedge inception and on an ongoing basis, of whether the derivatives that are used in hedging transactions are highly effective in offsetting changes in fair values or cash flows of hedged items. Movements on the hedging reserve in Equity are shown in the Statement of Equity. The full fair value of a hedging derivative is classified as a non-current asset or liability when the remaining hedged item is more than 12 months and as a current asset or liability when the remaining maturity of the hedged item is less than 12 months. Trading derivatives are classified as current asset or liabilities. (a) Cash flow hedge The effective portion of changes in the fair value of derivatives that are designated and qualify as cash flow hedges is recognised in other comprehensive income and presented in the hedging reserve in equity. The profit or loss relating to the ineffective portion is recognised immediately in the Statement of Comprehensive Income within Finance income or Finance costs. Amounts accumulated in equity are recycled in the Consolidated Statement of Comprehensive Income for the period in the periods when the hedged item affects profit or loss. However, when the forecast transaction that is hedged results in the recognition of a non-financial asset (for example, inventory or non-current assets) the gains and losses previously deferred in equity are transferred from equity and included in the initial measurement of the cost of the asset. The deferred amounts are ultimately recognised in cost of goods sold in case of inventory or in depreciation in case of non-current assets. When a hedging instrument expires or is sold, or when a hedge no longer meets the criteria for hedge accounting, any cumulative gain or loss existing in shareholders' equity at that time remains in shareholders' equity and is recognised when the forecast transaction is ultimately recognised in the Statement of Comprehensive Income. When a forecast transaction is no longer expected to occur, the cumulative gain or loss that was reported in equity is immediately transferred to the Statement of Comprehensive Income within Finance income or Finance costs. (b) Net investment hedge Hedges of net investments in foreign operations are accounted for similarly to cash flow hedges. Any gain or loss on the hedging instrument relating to the effective portion of the hedge is recognised in other comprehensive income and presented in the hedging reserve in equity. The gain or loss relating to the ineffective portion is recognised immediately in the Statement of Comprehensive Income within Finance income or Finance costs. Gains and losses accumulated in equity are included in profit or loss when the foreign operation is partially disposed of or sold. (c) Derivatives at fair value through profit or loss are accounted for at fair value through profit or loss. Certain derivative instruments do not qualify for hedge accounting. Changes in the fair value of any of these derivative instruments are recognised immediately in the Consolidated Statement of Comprehensive Income within Finance income or Finance costs. The fair value of financial instruments traded in active markets (such as trading and available-for-sale securities) is based on quoted market prices at the reporting date. The quoted market price used for financial assets held by the Group is the current bid price. The fair value of financial instruments that are not traded in an active market is determined by using valuation techniques. The Group uses a variety of methods and makes assumptions that are based on market conditions existing at each reporting date.

Marel hf., Consolidated Financial
Statements 31 December 2012
All amounts in EUR*1000
unless otherwise stated.
Notes to the Consolidated
Financial Statements
A N N UA L R E P O R T 2 0 1 2 83
2.10 Inventories
Inventories are stated at the lower of historical cost or net realisable value. Cost is determined using the weighted average method and an adjustment to net realisable value is considered for items, which have not moved during the last 12 months. The cost of finished goods and work in process comprises raw materials, direct labour, other direct costs and related production overheads based on normal operating capacity but excludes borrowing costs. Net realisable value is the estimated selling price in the ordinary course of business, less the costs of completion and applicable variable selling expenses. Costs of inventories include the transfer from equity of gains or losses on qualifying cash flow hedges relating to production cost.
2.11 Production contracts
Production costs are recognised when incurred. When the outcome of a production contract can be estimated reliably and it is probable that the contract will be profitable, contract revenue is recognised over the period of the contract. When it is probable that total contract costs will exceed total contract revenue, the expected loss is recognised as an expense immediately. When the outcome of a production contract cannot be estimated reliably, contract revenue is recognised only to the extent of production costs incurred that are likely to be recoverable. The Group uses the ‘percentage of completion method’ to determine the appropriate amount to recognise in a given period. The stage of completion is measured by reference to the contract costs incurred up to the reporting date as a percentage of total estimated costs for each contract. Costs incurred in the year in connection with future activity on a contract are excluded from contract costs in determining the stage of completion. They are presented as inventories, prepayments or other assets, depending on their nature. The Group presents as an asset the gross amount due from customers for contract work for all contracts in progress for which costs incurred plus recognised profits or less recognised losses exceeds progress billings. The Group presents as a liability the gross amount due to customers for contract work for all contracts in progress for which progress billings exceed costs incurred plus recognised profits or less recognised losses.
2.12 Receivables and prepayments
Trade receivables are recognised initially at fair value and subsequently measured at amortised cost using the effective interest method, less provision for impairment. A provision for impairment of trade receivables is established when there is objective evidence that the Group will not be able to collect all amounts due according to the original terms of receivables. Significant financial difficulties of the debtor, probability that the debtor will enter bankruptcy or financial reorganisation, and default or delinquency in payments (more than 90 days overdue) are considered indicators that the trade receivable is impaired. The amount of the provision is the difference between the asset’s carrying amount and the present value of estimated future cash flows, discounted at the effective interest rate. The carrying amount of the assets is reduced through the use of an allowance account, and the amount of the loss is recognised in the profit or loss within Administrative expenses. When a trade receivable is uncollectable, it is written off against the allowance account for trade receivables. Subsequent recoveries of amounts previously written off are credited against Administrative expenses in the Statement of Comprehensive Income.
Marel hf., Consolidated Financial
Statements 31 December 2012
All amounts in EUR*1000
unless otherwise stated.
Notes to the Consolidated
Financial Statements
84
2.13 Cash and cash equivalents
Cash and cash equivalents include cash in hand, deposits held at call with banks and other short-term highly liquid investments with original maturities of three months or less. Bank overdrafts are shown within borrowings in current liabilities on the Consolidated Statement of Financial Position.
2.14 Share capital
Ordinary shares are classified as equity. Incremental costs directly attributable to the issue of new shares or options are shown in shareholders' equity as a deduction, net of tax, from the proceeds. Where any group company purchases the Company’s equity share capital (treasury shares), the consideration paid, including any directly attributable incremental costs (net of income taxes), is deducted from equity attributable to the Company's shareholders until the shares are cancelled or reissued. Where such shares are subsequently sold or reissued, any consideration received (net of any directly attributable incremental transaction costs and the related income tax effects) is included in equity attributable to the Company's shareholders. Private placements need to be approved by the shareholders in the Company‘s Annual General Meeting. Based on such resolution, where the shareholders waive their pre-emptive rights, the Board of Directors can approve for a private placement.
2.15 Trade payables
Trade payables are recognised initially at fair value and subsequently measured at amortised cost using the effective interest method.
2.16 Borrowings
Borrowings are recognised initially at fair value, net of transaction costs incurred. Borrowings are subsequently stated at amortised cost; any difference between the proceeds (net of transaction costs) and the redemption value is recognised in the Statement of Comprehensive Income over the period of the borrowings using the effective interest method. Borrowings are classified as current liabilities unless the Group has an unconditional right to defer settlement of the liability for at least 12 months after the reporting date.
2.17 Current and deferred income tax
The tax expense for the period comprises current and deferred tax. Tax is recognised in the Statement of Comprehensive Income, except to the extent that it relates to items recognised directly in shareholders' equity. In this case, the tax on this item is included in deferred taxes; the net amount is recognised in shareholders' equity. The current income tax charge is calculated on the basis of the tax laws enacted or substantively enacted at the reporting date in the countries where the Company’s subsidiaries and associates operate and generate taxable income. Management periodically evaluates positions taken in tax returns with respect to situations in which applicable tax regulations are subject to interpretation and establishes provisions where appropriate on the basis of amounts expected to be paid to the tax authorities. Deferred income tax is provided in full, using the liability method, on temporary differences arising between the tax bases of assets and liabilities and their carrying amounts in the financial statements.

Marel hf., Consolidated Financial
Statements 31 December 2012
All amounts in EUR*1000
unless otherwise stated.
Notes to the Consolidated
Financial Statements
A N N UA L R E P O R T 2 0 1 2 85
Deferred income tax is determined using tax rates (and laws) that have been enacted or substantially enacted by reporting date and are expected to apply when the related deferred income tax asset is realised or the deferred income tax liability is settled. Deferred tax assets are recognised to the extent that it is probable that future taxable profit will be available against which the temporary differences can be utilised.
2.18 Employee benefits
Share-based compensation The Group operates a number of equity-settled, share-based compensation plans, under which the entity receives services from employees as consideration for equity instruments (options) of the Group. The fair value of the employee services received in exchange for the grant of the options is recognised as an expense. The total amount to be expensed is determined by reference to the fair value of the options granted, excluding the impact of any non-market service and performance vesting conditions (for example, profitability, sales growth targets and remaining an employee of the entity over a specified time period). Non-market vesting conditions are included in assumptions about the number of options that are expected to vest. The total amount expensed is recognised over the vesting period, which is the period over which all of the specified vesting conditions are to be satisfied. At reporting date, the entity revises its estimates of the number of options that are expected to vest based on the non-marketing vesting conditions. It recognises the impact of the revision to original estimates, if any, in the Statement of Comprehensive Income, with a corresponding adjustment to shareholders' equity. The proceeds received net of any directly attributable transaction costs are credited to share capital (nominal value) and share premium when the options are exercised. The fair value of the employee share options granted is measured using the Black-Scholes formula. Measurement inputs include share price on measurement date, exercise price of the options, expected volatility based on weighted average historic volatility adjusted for changes expected due to publicly available information, weighted average expected life of the instruments based on historical experience and general option holder behaviour, expected dividends, and the risk-free interest rate based on government bonds. Service and non-market performance conditions attached to the transactions are not taken into account in determining fair value. Profit sharing and bonus plans Under some circumstances, a liability for key employee benefits in the form of profit sharing and bonus plans is recognised in other provisions when there is no realistic alternative but to settle the liability and at least the condition is met that there is a formal plan and the amounts to be paid are determined before the time of issuing the financial statements. Liabilities for profit sharing and bonus plans are expected to be settled within 12 months and are measured at the amounts expected to be paid when they are settled. Pension plans Marel has several pension plans in accordance with local rules and conditions. Based on IAS 19, some of these plans have been classified as Defined Benefit plans up to the settlement of these plans in 2011 and 2012. After settlement of the two main defined benefit plans, only one arrangement with regards to early retirement rights can be classified as defined benefit until the moment of settlement expected in 2020 (VPL in the Netherlands). Because of its non material character, this arrangement is not disclosed separately. In general, the defined benefit plans were funded by payments to insurance companies or to funds administered by third parties. For the majority of its employees, the Group has pension plans in which the liabilities to the employees are based on the number of years of service and the salary levels. The liabilities of these pension plans are covered systematically by insurance contracts or by the inclusion of liabilities in the Statement of Financial Position. Investments are made primarily in fixed-interest securities, listed shares and related instruments, and real estate.

Marel hf., Consolidated Financial
Statements 31 December 2012
All amounts in EUR*1000
unless otherwise stated.
Notes to the Consolidated
Financial Statements
86
A defined contribution plan is a plan to provide benefits after retirement in which an entity makes fixed contributions to a separate entity, and legally has no constructive obligation to make further contributions. Obligations relating to defined contribution pension plans are charged to profit or loss as employee remuneration expenses when the contributions are payable. Contributions paid in advance are presented as assets to the extent that cash repayment or a reduction in future contributions is available.
2.19 Provisions
Provisions for restructuring costs and legal claims are recognised when the Group has a present legal or constructive obligation as a result of past events, it is probable that an outflow of resources will be required to settle the obligation, and the amount has been reliably estimated. Restructuring provisions comprise lease termination penalties and employee termination payments. Provisions are not recognised for future operating losses. The Group gives guarantee on certain products and undertakes to repair or replace items that fail to perform satisfactorily. If the Group expects a provision to be reimbursed, for example under an insurance contract, the reimbursement is recognised as a separate asset but only when the reimbursement is virtually certain. Provisions are measured at the present value of the expenditures expected to be required to settle the obligation using a pre-tax rate that reflects current market assessments of the time value of money and the risks specific to the obligation. The increase in the provision due to passage of time is recognised as interest expense.
2.20 Revenue recognition
Revenue comprises the fair value for the sale of goods and services net of value-added tax, rebates and discounts, and after eliminating sales within the Group Revenue from the sale of goods is recognised when significant risks and rewards of ownership of the goods are transferred to the buyer. The Group recognises revenue when the amount of revenue can be reliably measured; it is probable that future economic benefits will flow to the entity and when specific criteria have been met. The amount of revenue is not considered to be reliably measurable until all contingencies relating to the sale have been resolved. The Group bases its estimates on historical results, taking into consideration the type of customer, the type of transaction and the specifics of each arrangement. Revenue from fixed-price contracts for delivering design services and solutions is recognised under the percentage-of-completion (POC) method. Under the POC method, revenue is generally recognised based on the services performed and direct expenses incurred to date as a percentage of the total services to be performed and total expenses to be incurred. Interest income is recognised on a time proportion basis, taking account of the principal outstanding and the effective rate over the period to maturity. When a receivable is impaired, the Group reduces the carrying amount to its recoverable amount, being the estimated future cash flow discounted at original effective interest rate of the instrument, and continues unwinding the discount as interest income. Dividends are recognised when the right to receive payment is established.

Marel hf., Consolidated Financial
Statements 31 December 2012
All amounts in EUR*1000
unless otherwise stated.
Notes to the Consolidated
Financial Statements
A N N UA L R E P O R T 2 0 1 2 87
The interest element of the lease payment is charged to the profit or loss over the lease period so as to produce a constant periodic rate of interest on the remaining balance of the liability for each period. The property, plant and equipment acquired under finance leases are depreciated over the shorter of the useful life of the asset and the lease term. Leases where a significant portion of the risks and rewards of ownership are retained by the lessor are classified as operating leases. Payments made under operating leases, net of any incentives received from the lessor are charged to the profit or loss on a straight-line basis over the period of the lease.
2.22 Dividend distribution
Dividend distribution to the Company’s shareholders is recognised in the Group’s financial statements in the period in which the dividends are approved by the Company’s shareholders.
2.21 Leases
Leases of property, plant and equipment where the Group has substantially obtained all the risks and rewards of ownership are classified as finance leases. Finance leases are capitalised at the inception of the lease at the lower of the fair value of the leased property or the present value of the minimum lease payments. Each lease payment is allocated between the liability and finance charges so as to achieve a constant rate on the finance balance outstanding. The corresponding rental obligations, net of finance charges, are included in other long-term payables.

Marel hf., Consolidated Financial
Statements 31 December 2012
All amounts in EUR*1000
unless otherwise stated.
Notes to the Consolidated
Financial Statements
88
3 Financial risk management Financial risk factors
The Group’s activities expose to financial risk consisting of market risks (interest and currency risk), credit risk and liquidity risk. This note presents information about the Group´s exposure to each of the above mentioned risks, the Group’s objectives, policies and processes for measuring and managing the risk. Further quantitative disclosures are included throughout these Consolidated Financial Statements. Risk management framework Risk management is carried out by a central treasury department (Group Treasury) under policies and with instruments approved by the Board of Directors. Group Treasury identifies, evaluates and hedges financial risks in close co-operation with the Group’s operating units. The Group´s overall risk management program focuses on the unpredictability of financial markets and seeks to minimize potential adverse effects on the Group´s financial performance. The Group uses derivative financial instruments to hedge certain risk exposures and does not enter into financial contracts for speculative purposes. Group Treasury and Corporate Control staff meet with CFO weekly to monitor the risk management process. (a) Market risk
In November 2010, the Group entered into a facilities agreement with six international banks, led by ING bank, Rabobank and ABN Amro. The single financing package consists of credit facilities amounting to EUR 350 million, to be drawn in currencies reflecting the Group’s revenues and assets. Marel was able to amend & extend this facilities agreement with the consortium with effective date 31 December 2012, while the terms and conditions generally remain in line with Loan Market Association (LMA) corporate standards, the key amendments were:
The junior loan was converted into senior debt, making it an all senior facility; The remaining tenor was four years as the facility was extended by one year with final maturity in November
2016 as opposed to November 2015; Initial interest terms are EURIBOR/LIBOR +250 bps for the facility depending on leverage.
The Group has a financing structure which can accommodate the Group´s financing requirements till 2016 with USD and EUR borrowings matching the Group´s exposure in these currencies to a large extent. The ISK risk in borrowings is reduced to nil (2011: EUR 7.6 million) in February 2012 when bond issue MARL 06 1 matured. (i) Foreign exchange risk The Group operates internationally and is exposed to currency risk arising from mainly the USD and GBP, primarily with respect to the EUR, as the EUR is the Group´s reporting currency. Financial exposure is hedged in accordance with the Group´s general policy and within set limits. The Group monitors foreign exchange risk arising from commercial transactions, recognized assets and liabilities (transaction risk) that are determined in a currency other than the entity´s functional currency. Derivative hedging is applied if the exposure is outside of the risk tolerance band on a consolidated basis. Currency exposure arising from net assets of the Group´s major foreign operations (translation risk) is managed primarily through borrowings denominated in the relevant foreign currencies as the policy is to apply natural exchange rate hedging where possible. Economic risk is defined as the extent to which currency fluctuations can alter a company’s future operating cash flows, that is future revenues and costs. Economic risk is not hedged.

Marel hf., Consolidated Financial
Statements 31 December 2012
All amounts in EUR*1000
unless otherwise stated.
Notes to the Consolidated
Financial Statements
A N N UA L R E P O R T 2 0 1 2 89
The following table details the Group's sensitivity of transaction and translation risk to a 10% increase and decrease in the EUR against the relevant foreign currencies. 10% is the sensitivity rate used when reporting foreign currency risk internally to key management personnel and represents management's assessment of the reasonably possible change in foreign exchange rates. The sensitivity analysis includes only outstanding foreign currency denominated monetary items and adjusts their translation at the period end for a 10% change in foreign currency rates. The sensitivity analysis includes external loans as well as loans to foreign operations within the Group where the denomination of the loan is in a currency other than the functional currency of the lender or the borrower. A positive number below indicates an increase in profit or equity where the EUR strengthens 10% against the relevant currency. For a 10% weakening of the EUR against the relevant currency, there would be a comparable impact on the profit or equity, and the balances below would be opposite.
2012USD impact GBP impact USD impact GBP impact
(683) (1,033) (913) (887)0 0 0 0
Profit or (loss) ................................................................................................Equity ...............................................................................................................
2011
On the operational side, only a fraction of a percentage of revenues is denominated in ISK, while around 5.8% (2011: 4.9%) of costs is in ISK. In 2012 no borrowings were in ISK (2011: 2.7% of borrowings) these borrowings disappeared in February 2012 when bond issue MARL 06 1 matured. Other borrowings are mostly in EUR and USD.
Liabilities in currency recorded in EUR:
Finance lease
liabilities
Capitalised finance
chargesOther
borrowingsTotal 2012
69 0 8,929 8,998 0 (4,006) 153,500 149,494 0 0 0 0
235 (1,556) 101,949 100,628 67 0 0 67
371 (5,562) 264,378 259,187 (196) 1,390 (20,634) (19,440)
175 (4,172) 243,744 239,747
Liabilities in other currencies .....................................................................
Current matures ............................................................................................
Liabilities in DKK ..........................................................................................Liabilities in EUR ..........................................................................................Liabilities in ISK, partially index linked ......................................................Liabilities in USD ..........................................................................................
Liabilities in currency recorded in EUR:
Finance lease
liabilities
Capitalised finance
chargesOther
borrowingsTotal 2011
108 0 9,597 9,705 0 (3,873) 165,000 161,127 0 0 7,640 7,640
113 (1,543) 104,247 102,817 134 0 0 134 355 (5,416) 286,484 281,423
(195) 1,382 (28,249) (27,062)160 (4,034) 258,235 254,361
Liabilities in other currencies .....................................................................
Current matures ............................................................................................
Liabilities in DKK ..........................................................................................Liabilities in EUR ..........................................................................................Liabilities in ISK, partially index linked ......................................................Liabilities in USD ..........................................................................................

Marel hf., Consolidated Financial
Statements 31 December 2012
All amounts in EUR*1000
unless otherwise stated.
Notes to the Consolidated
Financial Statements
90
(ii) Cash flow and fair value interest rate risk The Group is exposed to interest rate risk on borrowings. Borrowings issued at variable rates expose the Group to cash flow interest rate risk. Borrowings issued at fixed rates expose the Group to fair value interest rate risk. The risk is managed by maintaining a mix between fixed and floating interest rate on borrowings. The Group adopts a policy of ensuring that between 50 – 70% of its exposure to changes in interest rates on core debt is hedged for the coming 3-5 years. Based on various scenarios, the Group manages its cash flow interest rate risk by using floating to fixed interest rate swaps. Generally the Group raises long term borrowings at floating rates and swaps them into fixed rates. Presently around 45% (2011: 49%) of the core debt has floating interest rates and the rest is fixed.
As at reporting date a total of EUR 135.5 million (2011: EUR 145.6 million) floating rate liabilities were swapped into fixed interest rates. Under the interest rate swaps the company agrees with banks to exchange at specified intervals (primarily quarterly) the difference between fixed contracts rates and floating rate interest amounts calculated by reference to the agreed notional amounts. The interest rate swaps mature between 2013 – 2015. The weighted fixed rate payable amounts to 3.29% (2011: 3.60%).
In 2008 the company started applying Cash flow hedge accounting to hedge the variability of interest cash outflows, between settlement date and maturity date, due to the change in 3 months EURIBOR/LIBOR interest rates for the Senior Secured Floating Rate Notes. Throughout the year 2012 as well as per year end the cash flow hedge accounting relationships were effective.
The effective part of the fair value changes of the interest rate swaps amounted to a EUR 1.2 million (2011: EUR 2.0 million loss) net of deferred taxes and was charged in other comprehensive income, resulting in a year end hedge reserve of EUR 8.1 million (2011: EUR 9.3 million). In 2011 an amount of EUR 1.2 million was reclassified from Other Comprehensive Income to other finance income. In 2012 no ineffectiveness was identified. The amounts deferred in equity at year-end are expected to affect interest costs within the coming 3 years. Among the actions taken to monitor the interest rate risk are stress tests to establish sensitivity to possible movements in rates and how they might affect the Group's results. (iii) Capital Management The Board of Directors’ policy is to maintain a strong capital base so as to maintain investor, creditor and market confidence and to sustain future development of the business. The Board monitors on leverage defined as Net Debt divided by EBITDA as well as on the return on capital, which the Group defines as result from operating activities divided by total Shareholders' Equity. The Board also monitors the level of dividends to ordinary shareholders. The Board's target is to arrange for maximum 6% of total share capital for shares held by employees of the Group under the stock option plans. At present employees will hold 3.95% (2011: 4.55%) of the shares, assuming that all outstanding share options vest and / or are executed. The Board seeks to maintain a balance between the higher returns on equity that might be possible with higher levels of borrowings and the advantages and security of a sound capital position. The Group uses the leverage ratio in their approach to capital management.
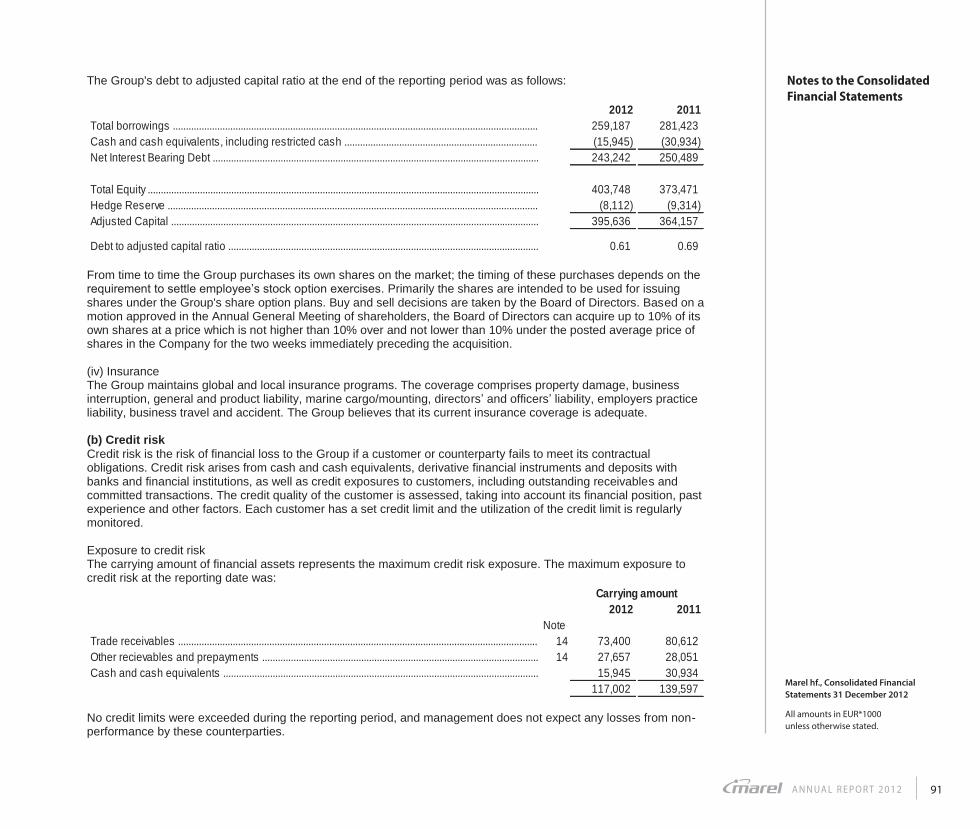
Marel hf., Consolidated Financial
Statements 31 December 2012
All amounts in EUR*1000
unless otherwise stated.
Notes to the Consolidated
Financial Statements
A N N UA L R E P O R T 2 0 1 2 91
The Group's debt to adjusted capital ratio at the end of the reporting period was as follows:
2012 2011259,187 281,423 (15,945) (30,934)243,242 250,489
403,748 373,471 (8,112) (9,314)
395,636 364,157
0.61 0.69
Total borrowings ............................................................................................................................................Cash and cash equivalents, including restricted cash ..........................................................................Net Interest Bearing Debt .............................................................................................................................
Total Equity ......................................................................................................................................................
Adjusted Capital .............................................................................................................................................Hedge Reserve ..............................................................................................................................................
Debt to adjusted capital ratio ....................................................................................................................... From time to time the Group purchases its own shares on the market; the timing of these purchases depends on the requirement to settle employee’s stock option exercises. Primarily the shares are intended to be used for issuing shares under the Group's share option plans. Buy and sell decisions are taken by the Board of Directors. Based on a motion approved in the Annual General Meeting of shareholders, the Board of Directors can acquire up to 10% of its own shares at a price which is not higher than 10% over and not lower than 10% under the posted average price of shares in the Company for the two weeks immediately preceding the acquisition. (iv) Insurance The Group maintains global and local insurance programs. The coverage comprises property damage, business interruption, general and product liability, marine cargo/mounting, directors’ and officers’ liability, employers practice liability, business travel and accident. The Group believes that its current insurance coverage is adequate. (b) Credit risk Credit risk is the risk of financial loss to the Group if a customer or counterparty fails to meet its contractual obligations. Credit risk arises from cash and cash equivalents, derivative financial instruments and deposits with banks and financial institutions, as well as credit exposures to customers, including outstanding receivables and committed transactions. The credit quality of the customer is assessed, taking into account its financial position, past experience and other factors. Each customer has a set credit limit and the utilization of the credit limit is regularly monitored. Exposure to credit risk The carrying amount of financial assets represents the maximum credit risk exposure. The maximum exposure to credit risk at the reporting date was:
2012 2011Note
14 73,400 80,612 14 27,657 28,051
15,945 30,934 117,002 139,597
Carrying amount
Trade receivables ..........................................................................................................................................Other recievables and prepayments ..........................................................................................................Cash and cash equivalents .........................................................................................................................
No credit limits were exceeded during the reporting period, and management does not expect any losses from non-performance by these counterparties.

Marel hf., Consolidated Financial
Statements 31 December 2012
All amounts in EUR*1000
unless otherwise stated.
Notes to the Consolidated
Financial Statements
92
The Group has no significant concentrations of credit risk. The Group has policies in place to ensure that sales of products and services are made to customers with an appropriate credit history and products are not delivered until payments are secured. The Group establishes an allowance for impairment that represents its estimate of incurred losses in respect of trade and other receivables. Marel has banking relations with a diversified set of financial institutions around the world, including one Icelandic bank. The Group has policies that limit the amount of credit exposure to any one financial institution and has ISDA agreements in place with counterparties in derivative transactions. (c) Liquidity risk Liquidity risk is the risk that the Group will encounter difficulty in meeting the obligations associated with its financial liabilities that are settled by delivering cash or another financial asset. Prudent liquidity risk management implies maintaining sufficient cash and committed credit facilities to give reasonable operating headroom. Due to the dynamic nature of the underlying businesses, the Group aims to maintain flexibility in funding by maintaining availability under committed credit lines. The Group has EUR 100 million of committed ancillary facilities, which can be used both as a revolver and to issue guarantees for down payments. At year end the Group had drawn EUR 23.6 million (2011: EUR 25.4 million) on the revolver and issued EUR 13.6 million (2011: 41.1 million) of guarantees under the facility, therefore the total usage is EUR 37.2 million (2011: 66.4 million), leaving a headroom of EUR 62.8 million (2011: EUR 33.5 million). All facilities are subject to operational and Consolidated Statement of Financial Position covenants (interest cover and leverage). At the end of 2012 there is sufficient headroom. Cash flow forecasts are done at the local levels and monitored by Group Treasury. Group liquidity reports are viewed by management on a weekly basis. The Group has recently set up a notional cash pool with the aim of making better use of the Group cash position and to further decrease the amount of idle cash. The table below analyses cash outflows per maturity group based on the remaining period at balance sheet date to the contractual maturity date. The amounts disclosed in the table are the contractual undiscounted cash flows.
At 31 December 2012Less than 1
yearBetween 1
and 5 yearsOver 5 years
19,244 233,808 5,764 7,854 20,251 976
0 0 0 196 176 0
125,417 0 0
4,625 5,577 0 Total 157,336 259,812 6,740
At 31 December 2011
19,228 247,228 6,973 11,476 25,525 1,137
7,639 0 0 195 160 0
125,570 0 0
3,931 8,488 0 Total 168,039 281,401 8,110
Interest on borrowings ...............................................................................................................................................................Borrowings ...................................................................................................................................................................................
Debentures ..................................................................................................................................................................................Finance lease liabilities .............................................................................................................................................................Trade and other payables .........................................................................................................................................................
Borrowings ...................................................................................................................................................................................
Interest rate swaps .....................................................................................................................................................................
Interest on borrowings ...............................................................................................................................................................Debentures ..................................................................................................................................................................................Finance lease liabilities .............................................................................................................................................................Trade and other payables .........................................................................................................................................................
Interest rate swaps .....................................................................................................................................................................

Marel hf., Consolidated Financial
Statements 31 December 2012
All amounts in EUR*1000
unless otherwise stated.
Notes to the Consolidated
Financial Statements
A N N UA L R E P O R T 2 0 1 2 93
Fair value estimation Fair value sensitivity analysis for fixed rate instruments The Group does not account for any fixed rate financial assets and liabilities at fair value through profit or loss, and the Group does not designate derivatives (interest rate swaps) as hedging instruments under a fair value hedge accounting model (references made to note 22). Therefore a change in interest rates at the reporting date would not affect profit or loss. Cash flow sensitivity analysis for variable rate instruments At year-end 2012, if EURIBOR interest rates had been 25 basis points higher/lower with all other variables held constant, post-tax profit for the year would have been EUR 139 (2011: EUR 142) lower/higher. At year-end 2012, if US LIBOR interest rates had been 25 basis points higher/lower, with all other variables held constant, post-tax profit for the year would have been EUR 160 (2011:EUR 154) lower/higher. The fair value of borrowings equals their carrying amount, as the impact of discounting is not significant. The fair values are based on cash flows discounted using a rate based on the borrowings rate of 4.85% (2011: 5.11%). The fair value of the finance lease liabilities equals their carrying amount, as the impact of discounting is not significant. The fair values are based on cash flows discounted using a rate based on the average interest rate of 7.49% (2011: 7.99%). The fair values of financial assets and liabilities, together with the carrying amounts shown in the Statement of Financial Position, are as follows:
2012 Note
Fair value- hedging
instrumentsLoans &
receivables
Other financial liabilities
Total carrying amount Fair Value
0 15,945 0 15,945 15,945 14 0 101,057 0 101,057 101,057
0 117,002 0 117,002 117,002
22 (10,815) 0 0 (10,815) (10,815)19 0 0 (258,816) (258,816) (258,816)19 0 0 0 0 0 19 0 0 (371) (371) (371)19 0 0 0 0 0 23 0 0 (125,417) (125,417) (125,417)
(10,815) 0 (384,604) (395,419) (395,419)2011
0 30,934 0 30,934 30,934 14 0 108,663 0 108,663 108,663
0 139,597 0 139,597 139,597
22 (12,419) 0 0 (12,419) (12,419)19 0 0 (261,253) (261,253) (261,253)19 0 0 (7,639) (7,639) (7,639)19 0 0 (355) (355) (355)19 0 0 (12,176) (12,176) (12,176)23 0 0 (125,570) (125,570) (125,570)
(12,419) 0 (406,992) (419,413) (419,413)
Interest rate swaps used for hedging .......................................................
Debentures ....................................................................................................Finance lease liabilities ...............................................................................Unsecured bank loan ...................................................................................Trade and other payables ...........................................................................
Cash and cash equivalents ........................................................................
Secured bank loans .....................................................................................
Receivables ...................................................................................................
Interest rate swaps used for hedging .......................................................Secured bank loans .....................................................................................Debentures ....................................................................................................Finance lease liabilities ...............................................................................Unsecured bank loan ...................................................................................Trade and other payables ...........................................................................
Cash and cash equivalents ........................................................................Receivables ...................................................................................................
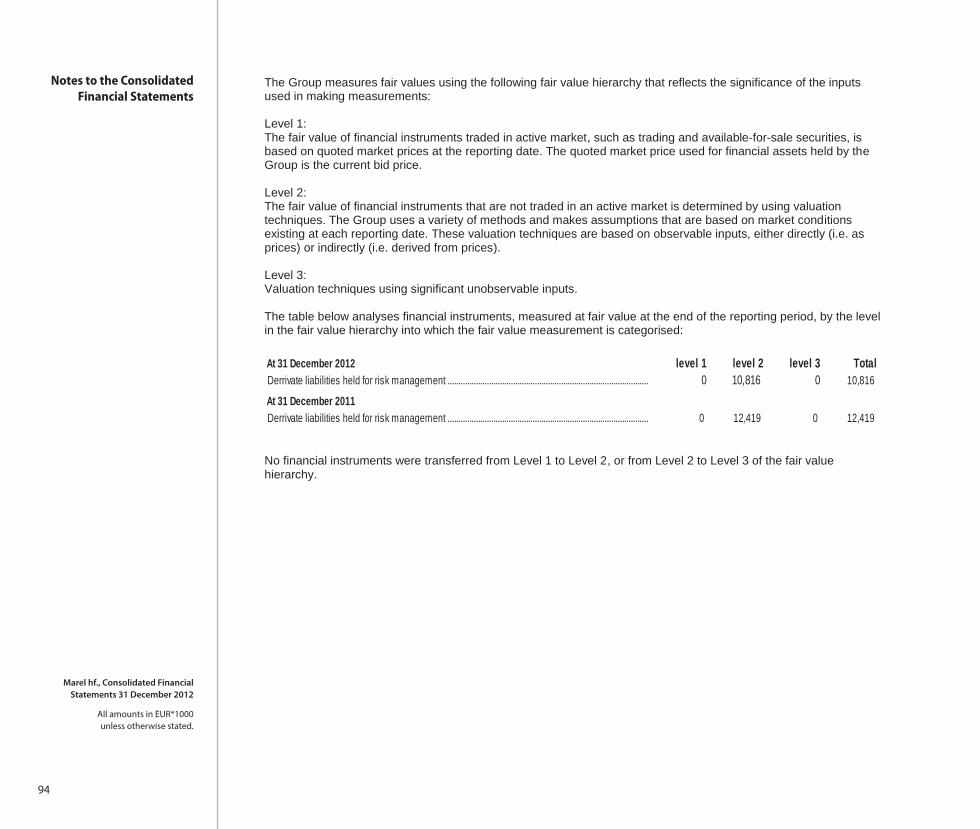
Marel hf., Consolidated Financial
Statements 31 December 2012
All amounts in EUR*1000
unless otherwise stated.
Notes to the Consolidated
Financial Statements
94
The Group measures fair values using the following fair value hierarchy that reflects the significance of the inputs used in making measurements: Level 1: The fair value of financial instruments traded in active market, such as trading and available-for-sale securities, is based on quoted market prices at the reporting date. The quoted market price used for financial assets held by the Group is the current bid price. Level 2: The fair value of financial instruments that are not traded in an active market is determined by using valuation techniques. The Group uses a variety of methods and makes assumptions that are based on market conditions existing at each reporting date. These valuation techniques are based on observable inputs, either directly (i.e. as prices) or indirectly (i.e. derived from prices). Level 3: Valuation techniques using significant unobservable inputs. The table below analyses financial instruments, measured at fair value at the end of the reporting period, by the level in the fair value hierarchy into which the fair value measurement is categorised:
At 31 December 2012 level 1 level 2 level 3 Total0 10,816 0 10,816
At 31 December 20110 12,419 0 12,419 Derrivate liabilities held for risk management ............................................................................................
Derrivate liabilities held for risk management ............................................................................................
No financial instruments were transferred from Level 1 to Level 2, or from Level 2 to Level 3 of the fair value hierarchy.

Marel hf., Consolidated Financial
Statements 31 December 2012
All amounts in EUR*1000
unless otherwise stated.
Notes to the Consolidated
Financial Statements
A N N UA L R E P O R T 2 0 1 2 95
4 Critical accounting estimates and assumptions Estimates and judgements are continuously evaluated and are based on historical experience and other factors, including expectations of future events that are believed to be reasonable under the circumstances. The Group makes estimates and assumptions concerning the future. The actual results will, by definition, seldom be exactly equal to the related accounting estimates used. The estimates and assumptions that have a significant risk of causing a material adjustment to the carrying amounts of assets and liabilities within the next financial year are discussed below. (a) Estimated impairment The Group tests annually whether goodwill has suffered any impairment, in accordance with the accounting policy stated in note 2.7. The recoverable amounts of cash-generating units have been determined based on value-in-use calculations. These calculations require the use of estimates (note 12). The Group tests annually whether financial assets have suffered any impairment, in accordance with the accounting policy stated in note 2.8. The recoverable amounts of cash-generating units have been determined based on value in use calculation. These calculations require the use of estimates. (b) Income taxes The Group is subject to income taxes in numerous jurisdictions. Significant judgement is required in determining the worldwide provision for income taxes. There are many transactions and calculations for which the ultimate tax determination is uncertain during the ordinary course of business. The Group recognises liabilities for anticipated tax audit issues based on estimates of whether additional taxes will be due. Where the final tax outcome of these matters is different from the amounts that were initially recorded, such differences will impact the income tax and deferred tax provisions in the period in which such determination is made. (c) Fair value of derivatives and other financial instruments The fair value of financial instruments that are not traded in an active market (for example, over-the-counter derivatives) is determined by using valuation techniques. The Group uses its judgment to select a variety of methods and make assumptions that are mainly based on market conditions existing at each reporting date. The Group uses discounted cash flow analysis for available-for-sale financial assets that are not traded in active markets. (d) Capitalised development cost The recoverability of the capitalised development cost is tested regularly, to verify if expected future economic benefits justify the values captured in the intangible fixed assets. The Group uses discounted cash flow analysis for this purpose.
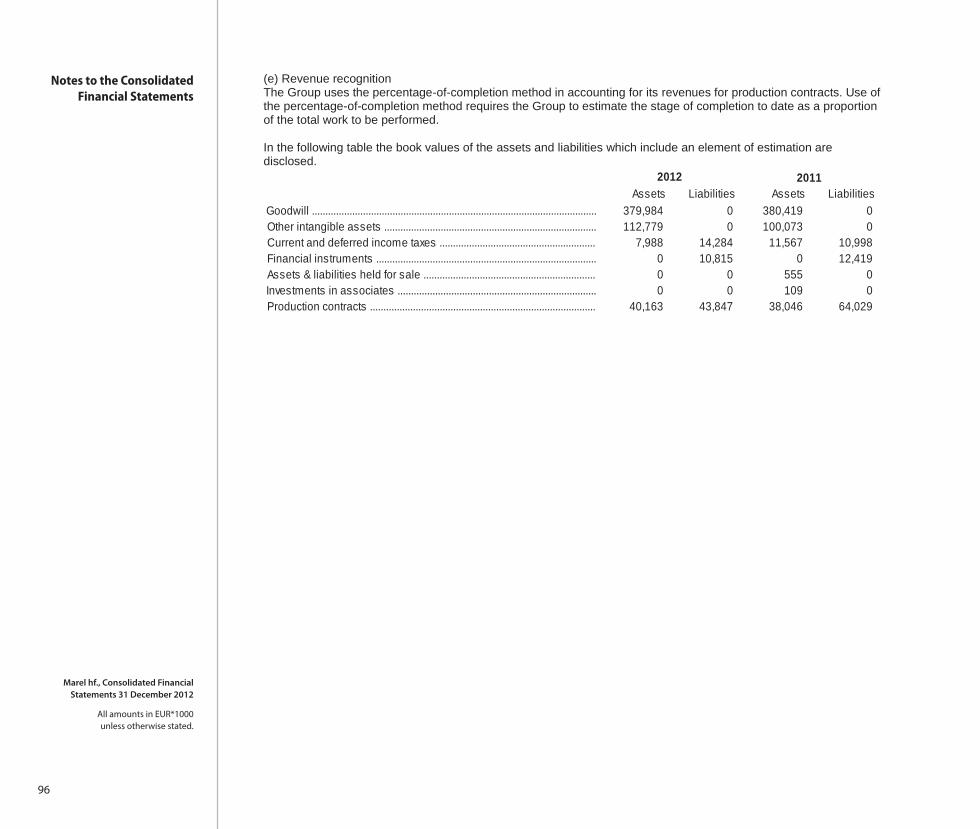
Marel hf., Consolidated Financial
Statements 31 December 2012
All amounts in EUR*1000
unless otherwise stated.
Notes to the Consolidated
Financial Statements
96
(e) Revenue recognition The Group uses the percentage-of-completion method in accounting for its revenues for production contracts. Use of the percentage-of-completion method requires the Group to estimate the stage of completion to date as a proportion of the total work to be performed. In the following table the book values of the assets and liabilities which include an element of estimation are disclosed.
Assets Liabilities Assets Liabilities379,984 0 380,419 0 112,779 0 100,073 0
7,988 14,284 11,567 10,998 0 10,815 0 12,419 0 0 555 0 0 0 109 0
40,163 43,847 38,046 64,029
2012 2011
Assets & liabilities held for sale ................................................................Investments in associates ..........................................................................Production contracts ....................................................................................
Goodwill ..........................................................................................................Other intangible assets ...............................................................................Current and deferred income taxes ..........................................................Financial instruments ..................................................................................

Marel hf., Consolidated Financial
Statements 31 December 2012
All amounts in EUR*1000
unless otherwise stated.
Notes to the Consolidated
Financial Statements
A N N UA L R E P O R T 2 0 1 2 97
5 Segment information Operating segments The segments comprise the industries, which form the basis for managerial decision taking. The following summary describes the operations in each of the Group’s reportable segments. Poultry processing: Our Stork Poultry Processing product range offers integrated systems for processing broilers, turkeys and ducks. Fish processing: Marel provides advanced equipment and systems for salmon and whitefish processing, both farmed and wild, onboard and ashore. Meat processing: Our Meat Industry Centre specializes in the key processes of deboning and trimming, case ready, food service and bacon processing. Further processing: Marel offers an extensive range of products for portioning, coating, heat treatment and sausage-making under the brand name of Townsend Further Processing. As of 1 January 2012 the Group has changed financial reporting according to its new organization structure. The reporting entities are reporting their revenues per operating segment based on the industry for which the customer is using Marel’s product range. Therefore inter segment sales do not exist, only intercompany sales within the same segment. Results are monitored and managed at the level of the identified operating segments, up to the result from operations. Decisions on Tax and Financing structures are taken on corporate level therefore no financial income and expenses nor tax are allocated to operating segments. The measure of profit or loss per operating segment is provided as result from operations and finance costs and taxes are reported in the column Total. Intercompany transactions are entered into under at arm’s length terms and conditions comparable to those available to unrelated parties. Information on liabilities per operating segment is not provided to the chief operating decision maker and as such not included in this disclosure. Following the introduction of the new market oriented business model with managerial responsibilities defined for the Group’s four core industries Poultry, Fish, Meat and Further Processing, financial reporting was aligned with this structure as per 2012. Herewith the Group realized improvements in the accuracy of the reporting on revenues and results realized per segment. The comparative segment information for 2011 is not based on the same structure as 2012 as the basis for reporting used in 2012 was not available in 2011. As a consequence 2011 segment information was not restated. Management believes that the segment information of 2011 is still appropriate based on the information available at the time. With regard to the 'Others' segment, this segment included in 2011 the holding companies (including goodwill) and a non-core activity. As from 2012, any revenues which do not belong to the core industries are reported in the `Others' segment as well.

Marel hf., Consolidated Financial
Statements 31 December 2012
All amounts in EUR*1000
unless otherwise stated.
Notes to the Consolidated
Financial Statements
98
The segment information for the year ended 31 December 2012 is as follows 1):
Fish Poultry MeatFurther
Processing Others Total
Total segment revenues .................................................... 130,982 388,172 88,356 92,386 14,064 713,960
Result from operations ....................................................... 12,024 52,516 (9,018) 4,930 629 61,081 Finance costs - net .............................................................. (18,030)
Result before income tax 43,051 Income tax ............................................................................. (7,442) Profit for the period 35,609
Assets .................................................................................... 88,966 197,399 70,462 92,802 415,499 865,128 Depreciation and amortisation ......................................... (3,858) (9,235) (3,524) (5,820) (2,445) (24,882) 1) To enable comparison of assets to 2011 numbers, Goodwill has been allocated to the ‘Others’ segment. The segment information for the year ended 31 December 2011 is as follows 2):
Fish Poultry MeatFurther
Processing Others Total
Total segment revenues .................................................... 107,966 366,830 88,070 98,957 6,534 668,357
Result from operations ....................................................... 12,672 46,219 6,864 7,173 (10,762) 62,166 Finance costs - net .............................................................. (18,108)
Result before income tax 44,058 Income tax ............................................................................. (9,595) Profit for the period 34,463
Assets .................................................................................... 72,955 215,769 79,973 88,778 420,343 877,818 Depreciation and amortisation ......................................... (3,692) (9,781) (3,824) (5,459) (2,085) (24,841) 2) The assets of 2011 have been restated to enable comparison to the 2012 numbers. In 2012 we implemented the Group’s cash pool which manages the Group’s cash at central level; therefore we excluded the cash from the assets of the four industries and included it in the ‘Others’ segment in both years.

Marel hf., Consolidated Financial
Statements 31 December 2012
All amounts in EUR*1000
unless otherwise stated.
Notes to the Consolidated
Financial Statements
A N N UA L R E P O R T 2 0 1 2 99
Geographical information The Group’s four operating segments operate in four main geographical areas, even though they are managed on a worldwide basis. The home country of the Group is Iceland. The two main operating companies are located in Iceland and the Netherlands; however, these companies realize most of their revenues in other countries. Revenues, allocated based on country where the customer is located. 2012 2011
4,772 2,779 19,342 26,743
318,325 277,062 181,255 145,675 190,266 216,098 713,960 668,357
Total assets149,074 145,624 427,324 419,752 272,785 281,508 849,183 846,884
The Netherlands .........................................................................................................................................................................Other countries ............................................................................................................................................................................
Iceland ..........................................................................................................................................................................................The Netherlands .........................................................................................................................................................................Europe other ................................................................................................................................................................................North America ..............................................................................................................................................................................Other countries ............................................................................................................................................................................
Iceland ..........................................................................................................................................................................................
In 2012 we implemented the Group’s cash pool which manages the Group’s cash at central level. To enable comparison we have excluded the cash and cash equivalents from the assets in the geographies in 2012 and 2011. Capital expenditure
7,239 5,145 21,108 14,671 11,085 9,749 39,432 29,565
Iceland ..........................................................................................................................................................................................
Other countries ............................................................................................................................................................................The Netherlands .........................................................................................................................................................................
6 Other operating income (expenses) 2012 License income and expenses amounted to EUR 485 (2011: EUR -/- 292). 2011 The industry-wide pension fund PME has taken over the execution of the pension plan from Stork Pension Fund (SPF) as of 1 January 2012. Marel is party to the agreement due to its acquisition of Stork Food Systems. The unusual costs for Marel of the pension related issues amounted to EUR 11.0 million.

Marel hf., Consolidated Financial
Statements 31 December 2012
All amounts in EUR*1000
unless otherwise stated.
Notes to the Consolidated
Financial Statements
100
7 Net finance costs
Finance costs: 2012 2011 (14,718) (16,632)
(28) (21) (2,565) (1,884) (1,055) (1,315)
(18,366) (19,852)
Finance income:336 515
0 1,229 336 1,744
(18,030) (18,108)
Subtotal Finance income ................................................................................................................................
Net Finance costs .............................................................................................................................................
Interest on borrowings .....................................................................................................................................Interest on finance leases ..............................................................................................................................Other finance expenses ..................................................................................................................................Net foreign exchange transaction losses ....................................................................................................Subtotal Finance costs ....................................................................................................................................
Interest income .................................................................................................................................................Other finance income .......................................................................................................................................
Other finance expenses/income consists of: The amortisation of capitalised finance charges, amounting to EUR 1,408 (2011: EUR 1,345) and Guarantee & commitment fees, amounting to EUR 939 (2011: EUR 428). Finance cost related to the amended financing in 2012 were accrued for and capitalized in the amount of EUR 1,554.
In 2010 EUR 1,455 was recorded in other finance expenses, these expenses were related to a terminated hedge relation in the amount of EUR 226 and the remainder of EUR 1,229 was related to the current hedge relation. All cash flows arising from the current hedge relation are effective and are accounted for as interest on borrowings therefore the ineffectiveness is no longer in place. As a result the 2010 finance expenses of EUR 1,229 are released in other finance income in 2011.
8 Staff costs
2012 2011203,570 182,499
24,592 21,632 582 811
13,492 13,114 242,236 218,056
Staff costs analyses as follows in the Consolidated Statement of Comprehensive Income:117,354 104,428
54,374 50,594 34,935 30,302 35,573 32,732
242,236 218,056
4,049 3,726
Research and development expenses ........................................................................................................Administrative expenses .................................................................................................................................
Average number of Full Time Equivalents ...................................................................................................
Selling and marketing expenses ...................................................................................................................
Salaries & Wages .............................................................................................................................................Related expenses ............................................................................................................................................
Post retirement costs .......................................................................................................................................
Cost of sales .....................................................................................................................................................
Expenses related to equity-settled share-based payments ....................................................................
The numbers for 2011 are restated to enable comparison to the 2012 numbers, caused by a change in reporting as of 2012.

Marel hf., Consolidated Financial
Statements 31 December 2012
All amounts in EUR*1000
unless otherwise stated.
Notes to the Consolidated
Financial Statements
A N N UA L R E P O R T 2 0 1 2 101
9 Income Tax
2012 2011 (1,856) (3,950) (5,586) (5,645) (7,442) (9,595)
Current tax ..........................................................................................................................................................Deferred tax ........................................................................................................................................................
The tax on the Group’s profit before tax differs from the theoretical amount that would arise using the weighted average tax rate applicable to profits of the consolidated companies as follows: Reconciliation of effective income tax
% %43,051 44,058
(8,610) 20.0 (8,812) 20.0 (2,564) 6.0 (2,362) 5.4
(11,174) 26.0 (11,174) 25.4
(163) 0.4 31 (0.1)2,981 (6.9) 2,137 (4.9)
401 (0.9) 385 (0.9)1,214 (2.8) (217) 0.5 (655) 1.5 (944) 2.1
(92) 0.2 141 (0.3)46 (0.1) 46 (0.1)
Tax charge included in the profit for the period (7,442) 17.3 (9,595) 21.7 Others .............................................................................................................
Income tax using Iceland rate ....................................................................Effect tax rates in other jurisdictions .........................................................Weighted average applicable tax ...............................................................
FX effect Iceland ............................................................................................R&D tax incentives ........................................................................................Permanent differences ................................................................................Tax losses (un)recognised .........................................................................
Effect of tax rate changes ............................................................................Impairment of tax losses .............................................................................
20112012
Result before income tax ............................................................................
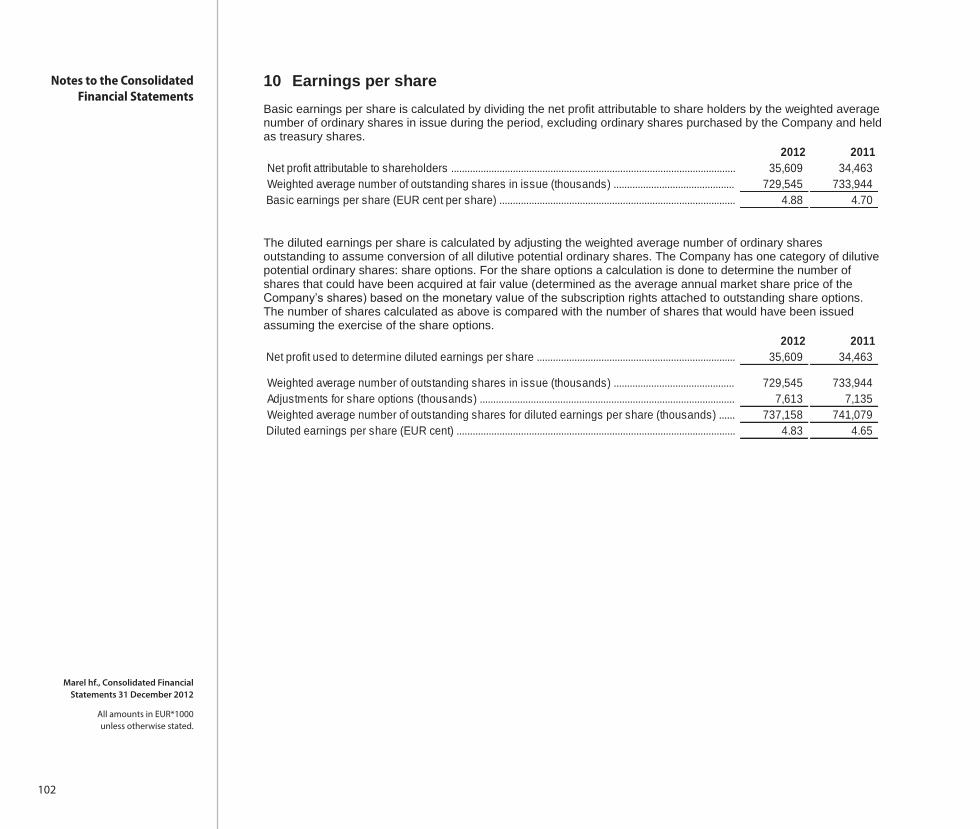
Marel hf., Consolidated Financial
Statements 31 December 2012
All amounts in EUR*1000
unless otherwise stated.
Notes to the Consolidated
Financial Statements
102
10 Earnings per share Basic earnings per share is calculated by dividing the net profit attributable to share holders by the weighted average number of ordinary shares in issue during the period, excluding ordinary shares purchased by the Company and held as treasury shares.
2012 201135,609 34,463
729,545 733,944 4.88 4.70 Basic earnings per share (EUR cent per share) ........................................................................................
Weighted average number of outstanding shares in issue (thousands) .............................................Net profit attributable to shareholders ..........................................................................................................
The diluted earnings per share is calculated by adjusting the weighted average number of ordinary shares outstanding to assume conversion of all dilutive potential ordinary shares. The Company has one category of dilutive potential ordinary shares: share options. For the share options a calculation is done to determine the number of shares that could have been acquired at fair value (determined as the average annual market share price of the Company’s shares) based on the monetary value of the subscription rights attached to outstanding share options. The number of shares calculated as above is compared with the number of shares that would have been issued assuming the exercise of the share options.
2012 201135,609 34,463
729,545 733,944 7,613 7,135
737,158 741,079 4.83 4.65
Weighted average number of outstanding shares for diluted earnings per share (thousands) ......Diluted earnings per share (EUR cent) ........................................................................................................
Adjustments for share options (thousands) ...............................................................................................Weighted average number of outstanding shares in issue (thousands) .............................................
Net profit used to determine diluted earnings per share ..........................................................................

Marel hf., Consolidated Financial
Statements 31 December 2012
All amounts in EUR*1000
unless otherwise stated.
Notes to the Consolidated
Financial Statements
A N N UA L R E P O R T 2 0 1 2 103
11 Property, plant and equipment
Land & Plant & Vehicles &
buildings machinery equipment Total At 1 January 2011
111,288 57,989 43,182 212,459 (27,126) (41,086) (34,829) (103,041)
84,162 16,903 8,353 109,418
Year ended 31 December 201184,162 16,903 8,353 109,418
449 133 259 841 662 5,409 2,779 8,850 156 (17) (261) (122)
(3,057) (4,676) (3,166) (10,899)82,372 17,752 7,964 108,088
At 1 January 2012112,621 63,895 44,800 221,316 (30,249) (46,143) (36,836) (113,228)
82,372 17,752 7,964 108,088
Year ended 31 December 201282,372 17,752 7,964 108,088
(217) (215) (258) (690)3,249 3,367 4,663 11,279
(65) (113) (520) (698) (2,982) (4,004) (2,959) (9,945)82,357 16,787 8,890 108,034
At 31 December 2012115,433 65,434 47,370 228,237 (33,076) (48,647) (38,480) (120,203)
82,357 16,787 8,890 108,034
Cost ................................................................................................................Accumulated depreciation ..........................................................................Net book amount ..........................................................................................
Additions ........................................................................................................Disposals ......................................................................................................Depreciation charge ....................................................................................Closing net book amount ............................................................................
Cost ................................................................................................................Accumulated depreciation ..........................................................................Net book amount ..........................................................................................
Opening net book amount .........................................................................Exchange differences ..................................................................................
Closing net book amount ............................................................................
Cost ................................................................................................................Accumulated depreciation ..........................................................................Net book amount ..........................................................................................
Opening net book amount .........................................................................Exchange differences ..................................................................................Additions ........................................................................................................Disposals ......................................................................................................Depreciation charge ....................................................................................

Marel hf., Consolidated Financial
Statements 31 December 2012
All amounts in EUR*1000
unless otherwise stated.
Notes to the Consolidated
Financial Statements
104
Depreciation of property, plant and equipment analyses as follows in the Consolidated Statement of Comprehensive Income:
2012 20116,383 6,932
795 800 373 359
2,394 2,808 9,945 10,899
Cost of sales .....................................................................................................................................................Selling and marketing expenses ...................................................................................................................Research and development expenses ........................................................................................................Administrative expenses .................................................................................................................................
As of 31 December 2012 mortgages included in interest bearing debt amounted to EUR 8,929 (2011: EUR 9,597), which are secured against a pledge on the real estate for the amount of EUR 12,363 (2011: EUR 12,406). As per 31 December 2012 an amount of EUR 2,560 has been committed for investments.

Marel hf., Consolidated Financial
Statements 31 December 2012
All amounts in EUR*1000
unless otherwise stated.
Notes to the Consolidated
Financial Statements
A N N UA L R E P O R T 2 0 1 2 105
12 Intangible Assets
Developm. Patents & Other Total other
Goodwill costs Trade name Intangibles IntangiblesAt 1 January 2011Cost ....................................................................................... 379,879 66,132 50,701 10,814 127,647 Accumulated amortisation ................................................. 0 (23,219) (8,296) (3,248) (34,763)Net book amount ................................................................. 379,879 42,913 42,405 7,566 92,884
Year ended 31 December 2011Opening net book amount ................................................ 379,879 42,913 42,405 7,566 92,884 Correction .............................................................................. (472) (4) 0 (2) (6)Exchange differences ......................................................... 671 345 633 (29) 949 Acquisitions - internally developed ................................... 341 16,565 0 3,809 20,374 Disposals .............................................................................. 0 (107) 0 (79) (186)Amortisation charge ........................................................... 0 (8,845) (3,437) (1,660) (13,942)Closing net book amount ................................................... 380,419 50,867 39,601 9,605 100,073
At 1 January 2012Cost ....................................................................................... 380,419 80,305 51,661 14,480 146,446 Accumulated depreciation ................................................. 0 (29,438) (12,060) (4,875) (46,373)Net book amount ................................................................. 380,419 50,867 39,601 9,605 100,073
Year ended 31 December 2012Opening net book amount ................................................ 380,419 50,867 39,601 9,605 100,073 Exchange differences ......................................................... (435) 168 (439) (239) (510)Acquisitions - internally developed ................................... 0 22,459 0 5,694 28,153 Reclasification ...................................................................... 0 1,275 (625) (650) 0 Amortisation charge ........................................................... 0 (9,337) (3,603) (1,997) (14,937)Closing net book amount ................................................... 379,984 65,432 34,934 12,413 112,779
At 31 December 2012Cost ....................................................................................... 379,984 103,575 50,985 19,187 173,747 Accumulated amortisation ................................................. 0 (38,143) (16,051) (6,774) (60,968)Net book amount ................................................................. 379,984 65,432 34,934 12,413 112,779

Marel hf., Consolidated Financial
Statements 31 December 2012
All amounts in EUR*1000
unless otherwise stated.
Notes to the Consolidated
Financial Statements
106
Amortisation of intangible assets analyses as follows in the Consolidated Statement of Comprehensive Income:
2012 201178 71
353 54 10,586 10,432
3,920 3,385 14,937 13,942
Cost of sales .......................................................................................................................................................Selling and marketing expenses ....................................................................................................................Research and development expenses ..........................................................................................................Administrative expenses ...................................................................................................................................
Impairment of Goodwill
Annually goodwill is tested for impairment at the level of the Group's Cash Generating Units (CGUs). In 2011 the CGUs were defined as the business units, as was done in 2010. As per 2012 the business unit structure was no longer used as the lowest level within the Group at which goodwill is monitored for internal management purposes. Following the introduction of the new market oriented business model with managerial responsibilities defined for the Group’s four core industries Poultry, Fish, Meat and Further Processing, financial reporting was aligned with this structure as per 2012. As a consequence Marel changed the CGUs based on the new market oriented business model as the operating segments determined in accordance with IFRS 8 Operating Segments (Poultry, Fish, Further Processing and Meat). Only at the level of the operating segments the connection can be made between the business for which the goodwill was originally paid and the results of the synergies after the acquisition of Stork Food Systems by Marel. The annual impairment test includes all fixed assets and net working capital allocated to CGUs. The basis used for reporting in 2012 was not available in 2011. Therefore the reported information of 2011 relating to goodwill is not comparable. Management believes that the information for 2011 is still appropriate based on the information available at that time.
The purpose of impairment testing is to determine whether the recoverable amount exceeds the carrying amount. The recoverable amount of an operating segment is determined as the present value of the future cash flows expected to be derived from a CGU, based on amongst others:
the estimated future cash flows that the Group expects the CGU to earn; possible variations in the amount or timing of those future cash flows; the time value of money, which is reflected by using a discount rate based on the current market risk-free
rate of interest; the price for the uncertainty inherent in the CGU.
Future cash flows are based on financial budgets approved by management with an average weighted growth rate of 5% to 11% for a five year period. Cash flows beyond the strategic plan period are extrapolated using estimated growth rates as shown in the table below, as well as a post-tax discount rate of 10.0%. The growth rate does not exceed the long-term average growth rate for the business in which the CGU operates.
The Goodwill impairment test performed in the fourth quarter confirmed the recoverability of existing goodwill. Since the outcome of the impairment testing exceeded the carrying amounts with more than 10%, sensitivity testing is not required. However, for the largest segment Poultry we have performed a sensitivity analysis for the following scenarios, which all would not result in an impairment:
Growth rate during strategic plan period: 400 to 800 basis points lower Gross profit percentage of revenues: eliminate predicted improvement Discount rate: increase with 100 basis points.

Marel hf., Consolidated Financial
Statements 31 December 2012
All amounts in EUR*1000
unless otherwise stated.
Notes to the Consolidated
Financial Statements
A N N UA L R E P O R T 2 0 1 2 107
Also for the ‘Other’ segment the relevant recoverable amount is sufficiently higher than the carrying amount of the respective net assets.
In addition to the updated discount rate, the assumptions used in the impairment test of the operating segments differ from the assumptions used in the impairment calculations based on the former BUs. The key assumptions used for the impairment tests are listed below. In 2011 the amounts of goodwill as per year-end showed minor differences with the amounts included in the Statement of Financial Position, caused mainly by currency translation with no effect on the outcome of the impairment test.
2012 Fish Poultry MeatFurther
ProcessingGoodwill 26,245 321,121 21,235 11,383
1) 3.0% 3.0% 3.0% 3.0%2) 10.0% 10.0% 10.0% 10.0%
Growth rate .....................................................................................................Discount rate .................................................................................................
1) Weighted average growth rate used to extrapolate cash flows beyond strategic plan period. 2) Discount rate applied to the cash flow projections. The key assumptions used for the impairment test in 2011 are based on the old CGU’s, as shown in the table below:
2011 Marel ehf.Marel
LimitedPoultry
ProcessingFurther
ProcessingGoodwill 86,027 8,164 272,635 11,213
1) 3.0% 3.0% 3.0% 3.0%2) 9.6% 9.6% 9.6% 9.6%Discount rate .................................................................................................
Growth rate .....................................................................................................
1) Weighted average growth rate used to extrapolate cash flows beyond strategic plan period. 2) Discount rate applied to the cash flow projections.
13 Investments in associates
2012 2011109 109
(109) 0 0 109
Beginning of the period ...................................................................................................................................Disposal .............................................................................................................................................................End of period .....................................................................................................................................................

Marel hf., Consolidated Financial
Statements 31 December 2012
All amounts in EUR*1000
unless otherwise stated.
Notes to the Consolidated
Financial Statements
108
14 Trade and Other Receivables
Current receivables and pre-payments: 2012 201175,737 84,059 (2,337) (3,447)73,400 80,612 (2,584) (3,115)
Current Portion 70,816 77,497
Other receivables and pre-payments5,220 6,445
22,437 21,606 27,657 28,051
Total Trade and Other receivables 101,057 108,663
Pre-payments ....................................................................................................................................................Other receivables ..............................................................................................................................................
Trade receivables .............................................................................................................................................Less: write-down to net-realisable value .....................................................................................................Trade receivables - net ....................................................................................................................................Less non-current portion .................................................................................................................................
All non-current receivables are due between one and five years. The carrying amounts of receivables and pre-payments approximate their fair value. Trade receivables that are less than 90 days past due are not considered impaired. As of 31 December 2012, trade receivables of EUR 16,765 (2011: EUR 18,697) were past due but not impaired. These relate to a number of independent customers for whom there is no recent history of default. As of 31 December 2012, trade receivables of EUR 9,431 (2011: EUR 13,413) were tested for impairment and written down when necessary. The amount of the write-down to net-realisable value was EUR 2,337 as of 31 December 2012 (2011: EUR 3,447). The individually impaired receivables mainly relate to customers, which are in unexpectedly difficult economic situations. It was assessed that a portion of the receivables over 90 days is expected to be recovered. The ageing of these receivables is as follows:
Gross amount
Provision for
ImpairmentGross
amount
Provision for
Impairment68,638 0 73,436 0
7,099 (2,337) 10,623 (3,447)75,737 (2,337) 84,059 (3,447)
2012 2011
Up to 90 days .................................................................................................Over 90 days ..................................................................................................
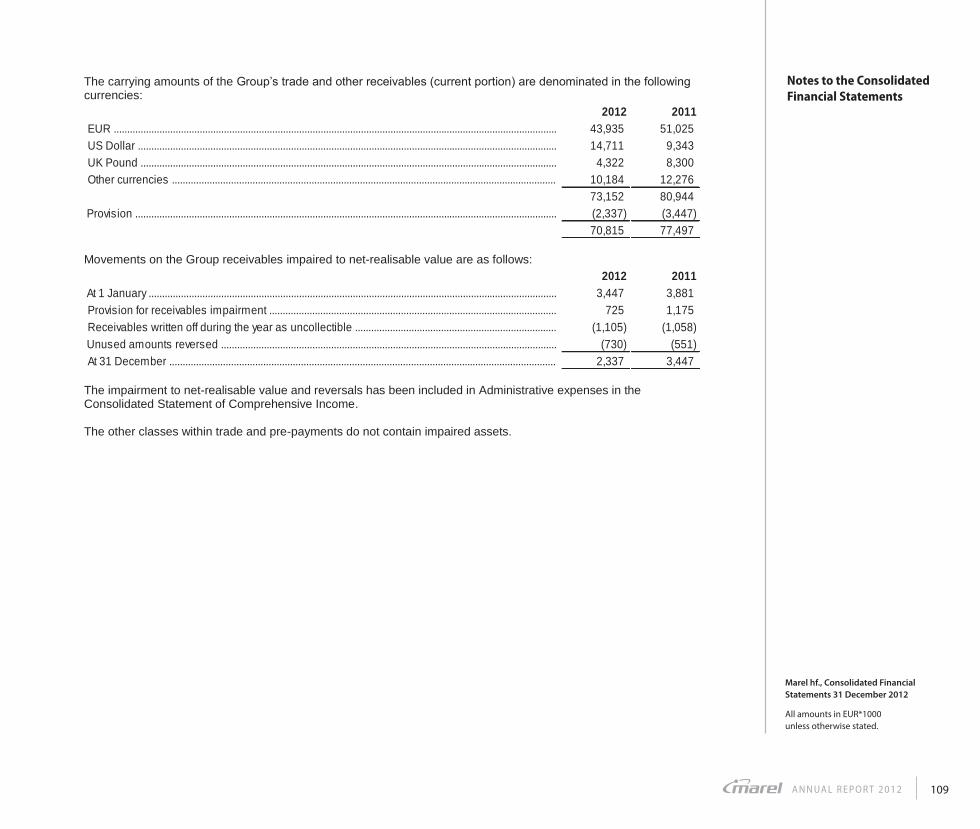
Marel hf., Consolidated Financial
Statements 31 December 2012
All amounts in EUR*1000
unless otherwise stated.
Notes to the Consolidated
Financial Statements
A N N UA L R E P O R T 2 0 1 2 109
The carrying amounts of the Group’s trade and other receivables (current portion) are denominated in the following currencies:
2012 201143,935 51,025 14,711 9,343
4,322 8,300 10,184 12,276 73,152 80,944 (2,337) (3,447)70,815 77,497
Provision .............................................................................................................................................................
EUR .....................................................................................................................................................................US Dollar ............................................................................................................................................................UK Pound ...........................................................................................................................................................Other currencies ...............................................................................................................................................
Movements on the Group receivables impaired to net-realisable value are as follows:
2012 20113,447 3,881
725 1,175 (1,105) (1,058)
(730) (551)2,337 3,447
At 1 January ........................................................................................................................................................
Unused amounts reversed .............................................................................................................................At 31 December ................................................................................................................................................
Provision for receivables impairment ...........................................................................................................Receivables written off during the year as uncollectible ...........................................................................
The impairment to net-realisable value and reversals has been included in Administrative expenses in the Consolidated Statement of Comprehensive Income. The other classes within trade and pre-payments do not contain impaired assets.

Marel hf., Consolidated Financial
Statements 31 December 2012
All amounts in EUR*1000
unless otherwise stated.
Notes to the Consolidated
Financial Statements
110
15 Deferred income tax Deferred income taxes are calculated in full on temporary differences under the liability method. The gross movement on the deferred income tax account is as follows: At 1 January 2011 7,694
156 (5,798)
153 657
At 31 December 2011 2,862
At 1 January 2012 2,862 (93)
(5,494) (92)
(389)At 31 December 2012 (3,206)
Exchange differences and changes within the Group .........................................................................................................Consolidated Statement of Comprehensive Income charge (excluding rate change) .................................................Effect of change in tax rates ......................................................................................................................................................Hedge reserve & translation reserve directly booked through equity ...............................................................................
Exchange differences and changes within the Group .........................................................................................................Consolidated Statement of Comprehensive Income charge (excluding rate change) .................................................Effect of change in tax rates ......................................................................................................................................................Hedge reserve & translation reserve directly booked through equity ...............................................................................
Deferred income tax assets and liabilities are offset when there is a legally enforceable right to set off current tax assets against current tax liabilities and when the deferred income taxes relate to the same fiscal authority. The following amounts, determined after appropriate offsetting, are shown in the Consolidated Statement of Financial Position. The deferred tax charged / (credited) to equity during the period is as follows: 2012 2011Fair value reserves in shareholders' equity
11 (15) (400) 672 (389) 657
7,988 11,567 (11,194) (8,705)
(3,206) 2,862
- Hedging Reserve ...........................................................................................................................................
Deferred income tax assets ...........................................................................................................................Deferred income tax liabilities ........................................................................................................................
- Translation Reserve mutation on permanent financing .........................................................................
Deferred income tax assets are recognised for tax loss carry-forwards to the extent that the realisation of the related tax benefit through the future taxable profits is probable. Based on future profits expected in the strategic plan the recoverability has been tested; an impairment of EUR 655 (2011: EUR 944) has been applied. Sensitivity analysis on impairment of tax losses used the assumption of decreasing the forecasted profit before tax by 5%. Based on the outcome of this calculation the impairment is not affected.
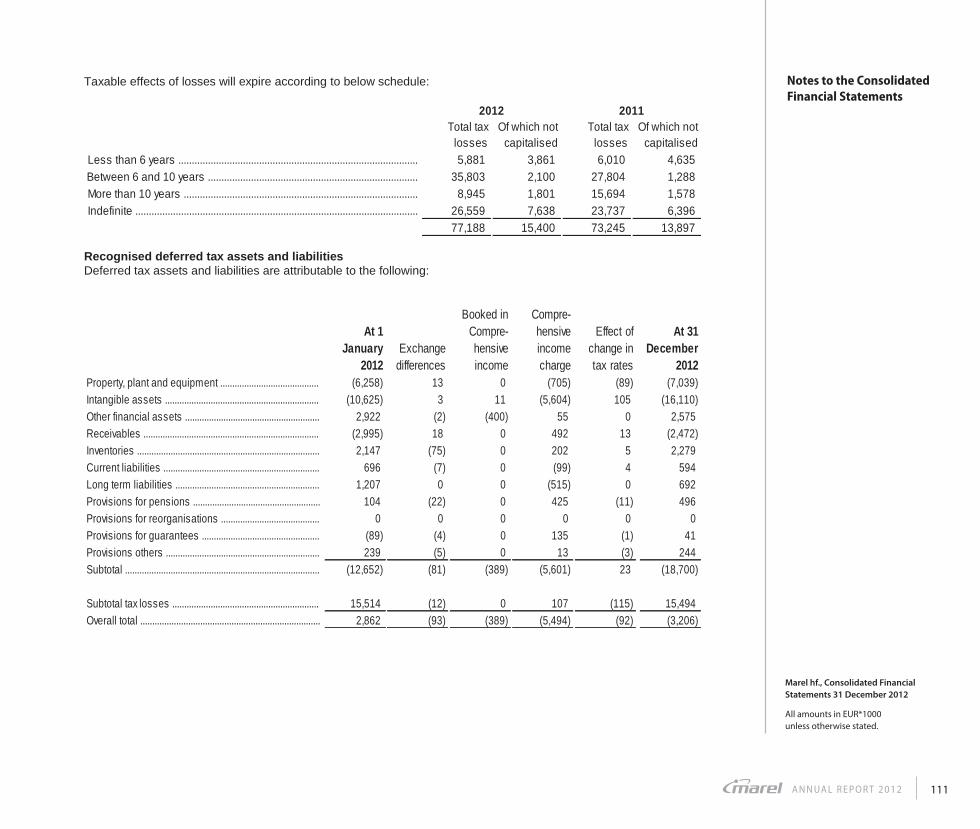
Marel hf., Consolidated Financial
Statements 31 December 2012
All amounts in EUR*1000
unless otherwise stated.
Notes to the Consolidated
Financial Statements
A N N UA L R E P O R T 2 0 1 2 111
Taxable effects of losses will expire according to below schedule:
Total tax losses
Of which not capitalised
Total tax losses
Of which not capitalised
5,881 3,861 6,010 4,635 35,803 2,100 27,804 1,288
8,945 1,801 15,694 1,578 26,559 7,638 23,737 6,396 77,188 15,400 73,245 13,897
Indefinite .........................................................................................................
Less than 6 years .........................................................................................Between 6 and 10 years ..............................................................................More than 10 years .......................................................................................
20112012
Recognised deferred tax assets and liabilities Deferred tax assets and liabilities are attributable to the following:
At 1 January
2012Exchange
differences
Booked in Compre- hensive income
Compre- hensive income charge
Effect of change in tax rates
At 31 December
2012Property, plant and equipment ......................................... (6,258) 13 0 (705) (89) (7,039)Intangible assets ................................................................ (10,625) 3 11 (5,604) 105 (16,110)Other financial assets ........................................................ 2,922 (2) (400) 55 0 2,575 Receivables ......................................................................... (2,995) 18 0 492 13 (2,472)Inventories ............................................................................ 2,147 (75) 0 202 5 2,279 Current liabilities ................................................................. 696 (7) 0 (99) 4 594 Long term liabilities ............................................................ 1,207 0 0 (515) 0 692 Provisions for pensions ..................................................... 104 (22) 0 425 (11) 496 Provisions for reorganisations ......................................... 0 0 0 0 0 0 Provisions for guarantees ................................................. (89) (4) 0 135 (1) 41 Provisions others ................................................................ 239 (5) 0 13 (3) 244 Subtotal ................................................................................. (12,652) (81) (389) (5,601) 23 (18,700)
Subtotal tax losses ............................................................. 15,514 (12) 0 107 (115) 15,494 Overall total ........................................................................... 2,862 (93) (389) (5,494) (92) (3,206)
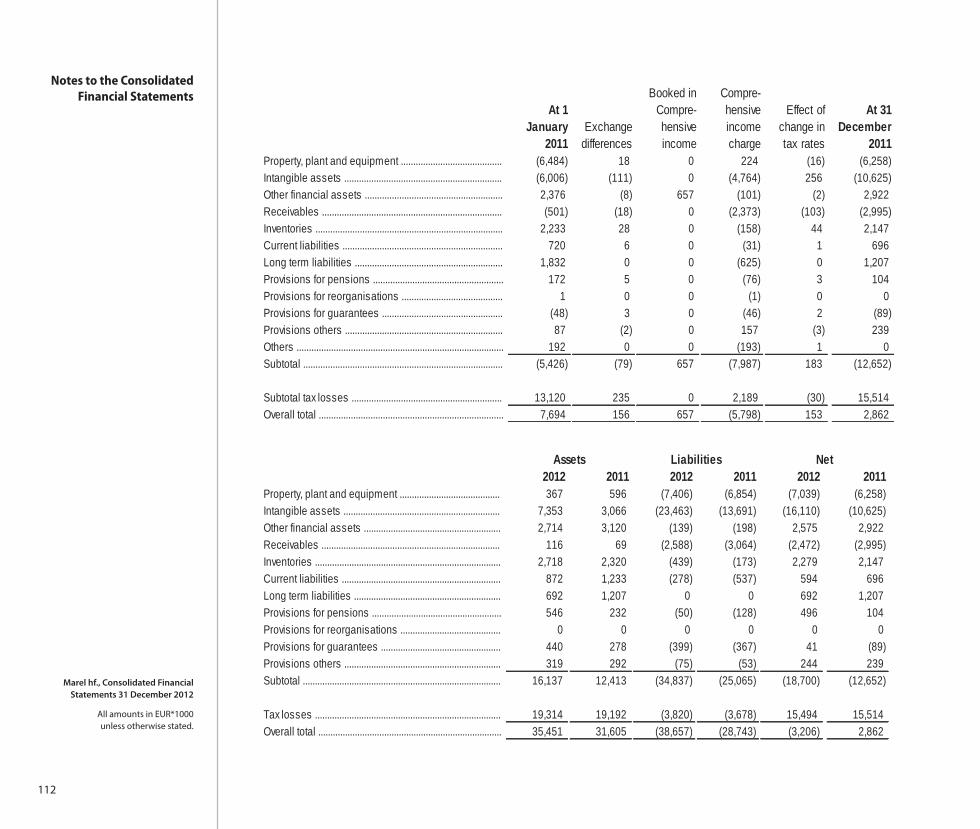
Marel hf., Consolidated Financial
Statements 31 December 2012
All amounts in EUR*1000
unless otherwise stated.
Notes to the Consolidated
Financial Statements
112
At 1 January
2011Exchange
differences
Booked in Compre- hensive income
Compre- hensive income charge
Effect of change in tax rates
At 31 December
2011Property, plant and equipment ......................................... (6,484) 18 0 224 (16) (6,258)Intangible assets ................................................................ (6,006) (111) 0 (4,764) 256 (10,625)Other financial assets ........................................................ 2,376 (8) 657 (101) (2) 2,922 Receivables ......................................................................... (501) (18) 0 (2,373) (103) (2,995)Inventories ............................................................................ 2,233 28 0 (158) 44 2,147 Current liabilities ................................................................. 720 6 0 (31) 1 696 Long term liabilities ............................................................ 1,832 0 0 (625) 0 1,207 Provisions for pensions ..................................................... 172 5 0 (76) 3 104 Provisions for reorganisations ......................................... 1 0 0 (1) 0 0 Provisions for guarantees ................................................. (48) 3 0 (46) 2 (89)Provisions others ................................................................ 87 (2) 0 157 (3) 239 Others .................................................................................... 192 0 0 (193) 1 0 Subtotal ................................................................................. (5,426) (79) 657 (7,987) 183 (12,652)
Subtotal tax losses ............................................................. 13,120 235 0 2,189 (30) 15,514 Overall total ........................................................................... 7,694 156 657 (5,798) 153 2,862
2012 2011 2012 2011 2012 2011Property, plant and equipment ......................................... 367 596 (7,406) (6,854) (7,039) (6,258)Intangible assets ................................................................ 7,353 3,066 (23,463) (13,691) (16,110) (10,625)Other financial assets ........................................................ 2,714 3,120 (139) (198) 2,575 2,922 Receivables ......................................................................... 116 69 (2,588) (3,064) (2,472) (2,995)Inventories ............................................................................ 2,718 2,320 (439) (173) 2,279 2,147 Current liabilities ................................................................. 872 1,233 (278) (537) 594 696 Long term liabilities ............................................................ 692 1,207 0 0 692 1,207 Provisions for pensions ..................................................... 546 232 (50) (128) 496 104 Provisions for reorganisations ......................................... 0 0 0 0 0 0 Provisions for guarantees ................................................. 440 278 (399) (367) 41 (89)Provisions others ................................................................ 319 292 (75) (53) 244 239 Subtotal ................................................................................. 16,137 12,413 (34,837) (25,065) (18,700) (12,652)
Tax losses ............................................................................ 19,314 19,192 (3,820) (3,678) 15,494 15,514 Overall total ........................................................................... 35,451 31,605 (38,657) (28,743) (3,206) 2,862
Assets Liabilities Net
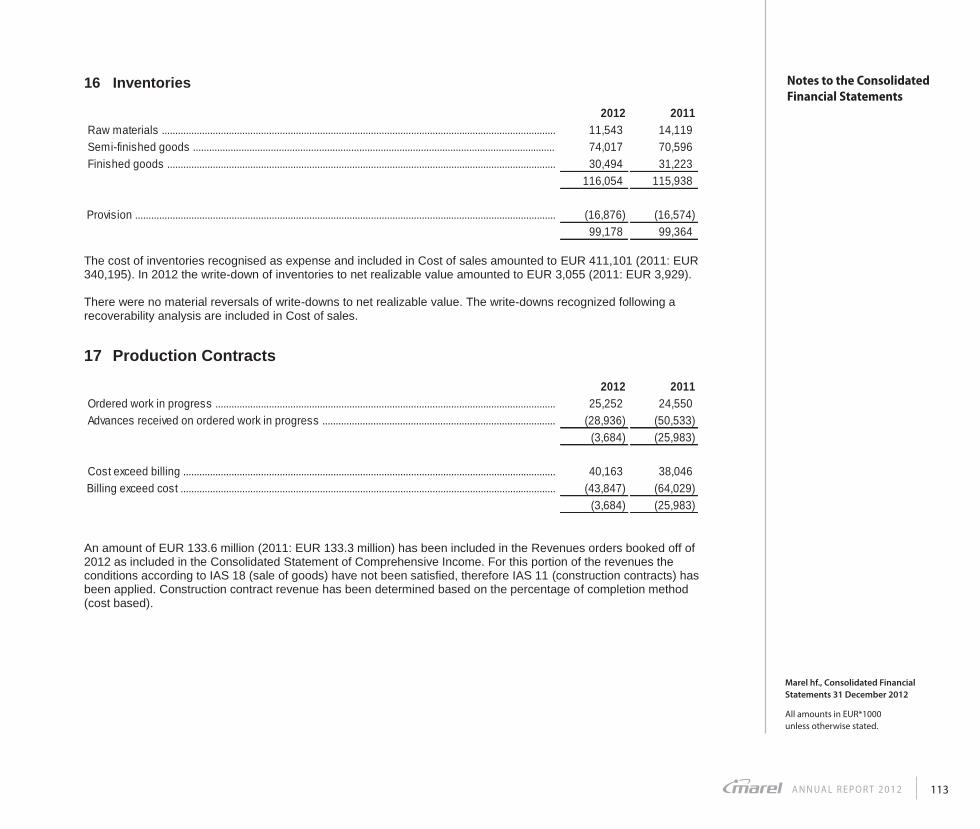
Marel hf., Consolidated Financial
Statements 31 December 2012
All amounts in EUR*1000
unless otherwise stated.
Notes to the Consolidated
Financial Statements
A N N UA L R E P O R T 2 0 1 2 113
16 Inventories
2012 201111,543 14,119 74,017 70,596 30,494 31,223
116,054 115,938
(16,876) (16,574)99,178 99,364
Raw materials ...................................................................................................................................................Semi-finished goods .......................................................................................................................................Finished goods .................................................................................................................................................
Provision .............................................................................................................................................................
The cost of inventories recognised as expense and included in Cost of sales amounted to EUR 411,101 (2011: EUR 340,195). In 2012 the write-down of inventories to net realizable value amounted to EUR 3,055 (2011: EUR 3,929). There were no material reversals of write-downs to net realizable value. The write-downs recognized following a recoverability analysis are included in Cost of sales.
17 Production Contracts
2012 201125,252 24,550
(28,936) (50,533) (3,684) (25,983)
40,163 38,046 (43,847) (64,029)
(3,684) (25,983)
Ordered work in progress ...............................................................................................................................Advances received on ordered work in progress .......................................................................................
Billing exceed cost ............................................................................................................................................Cost exceed billing ...........................................................................................................................................
An amount of EUR 133.6 million (2011: EUR 133.3 million) has been included in the Revenues orders booked off of 2012 as included in the Consolidated Statement of Comprehensive Income. For this portion of the revenues the conditions according to IAS 18 (sale of goods) have not been satisfied, therefore IAS 11 (construction contracts) has been applied. Construction contract revenue has been determined based on the percentage of completion method (cost based).

Marel hf., Consolidated Financial
Statements 31 December 2012
All amounts in EUR*1000
unless otherwise stated.
Notes to the Consolidated
Financial Statements
114
18 Equity
Share Capital
Ordinary shares
(thousands)
Treasury shares
(thousands)
Number of shares
(thousands)
730,291 (38) 730,253 5,278 0 5,278
0 (7,125) (7,125)0 438 438
735,569 (6,725) 728,844
0 (4,070) (4,070)0 6,666 6,666
735,569 (4,129) 731,440
Class of share capital:6,691
315,561 1,617
317,178
At 1 January 2011 ..................................................................................................................Issue of shares .......................................................................................................................
Treasury shares - sold ..........................................................................................................At 1 January 2012 ..................................................................................................................
Treasury shares - purchased ...............................................................................................
Treasury shares - purchased ...............................................................................................Treasury shares - sold ..........................................................................................................At 31 December 2012 ...........................................................................................................
Nominal value .............................................................................................................................................................................
Share premium ...........................................................................................................................................................................Reserve for share based payments .......................................................................................................................................Total share premium reserve ................................................................................................................................................... The total authorised number of ordinary shares is 735.6 million shares (2011: 735.6 million shares) with a par value of ISK 1 per share. All issued shares are fully paid. Share options are granted to directors and to selected employees. The exercise price of options granted in June 2008 is equal to the price in the share offering at date of the grant (June 2008). The exercise prices of options granted in May 2010 are higher than the market price of the shares on the date of grant. The exercise prices of options granted in June 2012 are higher than the market price of the shares on the date of grant. Options are conditional on the employee completing particular period's / year´s service (the vesting period). The Group has no legal or constructive obligation to repurchase or settle the options in cash.

Marel hf., Consolidated Financial
Statements 31 December 2012
All amounts in EUR*1000
unless otherwise stated.
Notes to the Consolidated
Financial Statements
A N N UA L R E P O R T 2 0 1 2 115
Movements in the number of share options outstanding and their related weighted average exercise prices are as follows:
Average exercise price per
shareOptions
(thousands)ISK 84 32,865 ISK 73 (5,715)ISK 77 (1,238)ISK 91 (244)ISK 89 25,668
EUR 1.083 10,578 ISK 89 (1,900)
EUR 0.537 (4,766)ISK 87 (375)
EUR 0.743 (345)ISK 125 28,860
9,747 Exercisable options at 31 December 2012 .................................................................................................
At 31 December 2012 .....................................................................................................................................
Forfeited in 2011 ...............................................................................................................................................At 31 December 2011 .....................................................................................................................................
Exercised ............................................................................................................................................................
Forfeited in 2012 ...............................................................................................................................................
At 1 January 2011 ............................................................................................................................................Exercised ............................................................................................................................................................Cash settled ......................................................................................................................................................
Cash settled ......................................................................................................................................................
Granted ...............................................................................................................................................................
Exercised ............................................................................................................................................................
Outstanding options granted 2008 (exercise price per share: ISK 87.41; price lowered from 2011 by the dividend payment in 2012 of ISK 1.59 per share) have expiry date 2012 plus one year in grace. Outstanding options granted 2010 (exercise prices per share: EUR 0.537 in 2012, EUR 0.559 in 2013 and EUR 0.582 in 2014; prices lowered from 2011 by the dividend payment in 2012 of EUR 0.0095 per share) have expiry date 2015. Outstanding options granted 2012 (exercise prices per share: EUR 1.066 in October 2015, EUR 1.095 in October 2016 and EUR 1.124 in October 2017) have expiry date in 2018. In 2012, 500 thousand shares were exercised at exercise price ISK 92.00 per share, 1,400 thousand shares were exercised at exercise price ISK 87.41 per share, 4,766 thousand shares were exercised at exercise price EUR 0.537 per share. Options equal to 375 thousand shares were cash settled as decided by the Group, due to rules on foreign exchange in Iceland, which make it complicated at the moment for employees of Marel subsidiaries abroad to exercise and settle their share options with share purchasing. The exercise price of the cash settled options was 87.41 ISK per share. The Group has no plans to cash settle share options in the future.

Marel hf., Consolidated Financial
Statements 31 December 2012
All amounts in EUR*1000
unless otherwise stated.
Notes to the Consolidated
Financial Statements
116
Variables used in the Black Scholes calculation:
Exercise price per share
(ISK) 1)Expected
term (years)
Annual dividend
yield
Expected risk-free
interest rateEstimated
volatility
Weigthed average
remaining contr. life in
months 2)
87.41 4 0.22% 4% 12.36% 7.4
Exercise price per share (EUR) 1)
Expected term (years)
Annual dividend
yield
Expected risk-free
interest rateEstimated
volatility
Weigthed average
remaining contr. life in
months 2)
0.537 5.0 0.00% 4% 21.29% 28.2 0.559 5.0 0.00% 4% 21.29% 28.2 0.582 5.0 0.00% 4% 21.29% 28.2
1.066 5.4 0.96% 3% 19.68% 70.0 1.095 5.4 0.96% 3% 19.68% 70.0 1.124 5.4 0.96% 3% 19.68% 70.0
Option plan June 2008 .................................................................................
Option plan June 2012, 50% exercisable ≥ 31 October 2015 .............Option plan June 2012, 25% exercisable ≥ 31 October 2016 .............Option plan June 2012, 25% exercisable ≥ 31 October 2017 .............
Option plan May 2010, 50% exercisable > 1 May 2012 ........................Option plan May 2010, 25% exercisable > 1 May 2013 ........................Option plan May 2010, 25% exercisable > 1 May 2014 ........................
1) Exercise price issued after dividend payment in 2012, EUR 0.95 cent (ISK 1.59) per share
2) Based on last possible exercise dates in each option plan. Reserves The hedge reserve contains revaluations on derivatives, on which hedge accounting is applied. The value of 31 December 2012 relates to derivatives for the Group, the interest rate swap contracts. The translation reserve contains the translation results of the consolidation of subsidiaries reporting in foreign currencies, as well as a currency revaluation related to a permanent financing contract with a subsidiary in the UK, for an amount of EUR 2,500 (2011: EUR 2,500).This contract was terminated in 2009 and the permanent financing has been transferred into equity in 2011.

Marel hf., Consolidated Financial
Statements 31 December 2012
All amounts in EUR*1000
unless otherwise stated.
Notes to the Consolidated
Financial Statements
A N N UA L R E P O R T 2 0 1 2 117
19 Borrowings
Non-current: 2012 2011
239,572 254,201 175 160
239,747 254,361 Current:
19,244 19,228 0 7,639
196 195 19,440 27,062
259,187 281,423
258,816 281,068 371 355
259,187 281,423
Finance lease liabilities ..................................................................................................................................
Total borrowings ...............................................................................................................................................
Bank borrowings ...............................................................................................................................................Finance lease liabilities ..................................................................................................................................
Bank borrowings excluding bank overdrafts ...............................................................................................Debentures ........................................................................................................................................................
Finance lease liabilities ..................................................................................................................................Secured bank loans .........................................................................................................................................
Total borrowings ...............................................................................................................................................
2012Annual maturates of non-current liabilities:
170 (1,390) 20,642 19,422 0 (1,390) 20,647 19,257 6 (1,392) 196,077 194,691 0 0 613 613 0 0 621 621 0 0 5,143 5,143
176 (4,172) 243,743 239,747
Total 2012
Finance lease
liabilities
Capitalised finance
chargesOther
borrowingsYear 2014 .......................................................................................................Year 2015 .......................................................................................................Year 2016 .......................................................................................................Year 2017 .......................................................................................................
Later ................................................................................................................Year 2018 .......................................................................................................
2011Annual maturates of non-current liabilities:Year 2013 .............................................................................. 102 (1,383) 20,484 19,203 Year 2014 .............................................................................. 54 (1,383) 20,503 19,174 Year 2015 .............................................................................. 4 (1,268) 209,733 208,469 Year 2016 .............................................................................. 0 0 542 542 Later ....................................................................................... 0 0 6,973 6,973
160 (4,034) 258,235 254,361
Finance lease
liabilities
Capitalised finance
chargesOther
borrowingsTotal 2011

Marel hf., Consolidated Financial
Statements 31 December 2012
All amounts in EUR*1000
unless otherwise stated.
Notes to the Consolidated
Financial Statements
118
As of 31 December 2012, interest bearing debt amounted to EUR 259,187, (2011: EUR 281,423) of which EUR 255,448 (2011: EUR 269,247) are secured against shares that Marel hf. holds in certain subsidiaries and EUR 8,929 (2011: EUR 9,597) against real estate with a book value of EUR 12,363 (2011: EUR 12,406). Lease liabilities are effectively secured as the rights to the leased asset revert to the lessor in the event of default. The Group has the following headroom in committed ancillary facilities: Floating rate: 2012 2011- Expiring within one year 0 0 - Expiring beyond one year 62,806 33,508
62,806 33,508 The fair value of borrowings equals their carrying amount, as the impact of discounting is not significant. The fair values are based on cash flows discounted using a rate based on the borrowings rate of 4.84% (2011: 5.11%). An amount of EUR 28 was recognised as an expense in the Consolidated Statement of Comprehensive Income in respect of finance leases (2011: EUR 21).
Future minimum
lease payments Interest
Present value of
min. lease payments
Future minimum
lease payments Interest
Present value of
min. lease payments
2012 2012 2012 2011 2011 2011211 15 196 211 16 195 202 26 175 187 26 161
Total 413 41 371 398 42 355
Less than 1 year ............................................................................................Between 1-5 years ........................................................................................
The fair value of the finance lease liabilities is approximately equal to their carrying amount.

Marel hf., Consolidated Financial
Statements 31 December 2012
All amounts in EUR*1000
unless otherwise stated.
Notes to the Consolidated
Financial Statements
A N N UA L R E P O R T 2 0 1 2 119
20 Provisions
Guarantee commitments
Pension commitments*)
Other provisions Total
At 1 January 2011 4,062 3,599 2,378 10,039 (551) (65) (519) (1,135)1,010 1,555 369 2,934
(57) (503) (1,371) (1,931)At 1 January 2012 4,464 4,586 857 9,908
(525) 0 (25) (549)799 1,607 101 2,508 (88) (3,529) (419) (4,036)
At 31 December 2012 4,650 2,665 514 7,830 Used ................................................................................................................
Release ..........................................................................................................Additions .........................................................................................................Used ................................................................................................................
Release ..........................................................................................................Additions .........................................................................................................
*) The amount for pension commitments includes the liabilities as disclosed in Note 21 Employee benefits. Analysis of total provisions 2012 2011
2,889 3,006 4,941 6,902 7,830 9,908
Current .......................................................................................................................................................................Non current ...............................................................................................................................................................
Specification of major items in provisions: Nature of obligation for 2012 Country Maturity Likelihood Amount
Netherlands Dynamic Dynamic 1,975 Denmark Dynamic Dynamic 804
US Dynamic Dynamic 840 Guarantee ......................................................................................................Guarantee ......................................................................................................Guarantee ......................................................................................................
In the other provisions an amount of EUR 155 is included for reorganisation costs. In 2012 an amount of EUR 285 was used. In 2012 a new provision for early retirement rights has been created for an amount of EUR 838.

Marel hf., Consolidated Financial
Statements 31 December 2012
All amounts in EUR*1000
unless otherwise stated.
Notes to the Consolidated
Financial Statements
120
21 Employee benefits The Group maintains various pension plans covering the majority of its employees. As of 1 January 2012, the Company’s employees in the Netherlands, 1038 in full-time employees (“FTEs”), participate in a multi-employer union plan (“Bedrijfstakpensioenfonds Metalektro”, PME) determined in accordance with the collective bargaining agreements effective for the industry in which Marel operates. This multi-employer plan covers approximately 1,260 companies and 142,000 contributing members. The plan monitors its risks on a global basis, not by company or employee, and is subject to regulation by Dutch governmental authorities. By law (the Dutch Pension Act), a multi-employer union plan must be monitored against specific criteria, including the coverage ratio of the plan’s assets to its obligations. This coverage ratio must exceed 104.3 percent for the total plan. Every company participating in a Dutch multi-employer union plan contributes a premium calculated as a percentage of its total pensionable salaries, with each company subject to the same percentage contribution rate. The pension rights of each employee are based upon the employee’s average salary during employment. Marel’s net periodic pension cost for this multi-employer plan for any period is the amount of the required contribution for that period. A contingent liability may arise from, for example, possible actuarial losses relating to other participating entities because each entity that participates in a multi-employer plan shares in the actuarial risks of every other participating entity or any responsibility under the terms of a plan to finance any shortfall in the plan if other entities cease to participate. The coverage ratio of the multi-employer plan increased to 93.9 percent as per end of December 2012 (December 31, 2011: 90.7 percent). Because of the low coverage ratio, PME prepared and executed a so-called “Recovery Plan” which was approved by De Nederlandsche Bank (the Dutch central bank, which is the supervisor of all pension companies in the Netherlands). For 2013, the pension premium percentage will not increase as the current premium level, which is 24.0 percent of the total pensionable salaries, is the maximum premium determined in the articles of association of the Pension Fund. The coverage ratio is calculated by dividing the fund’s capital by the total sum of pension liabilities and is based on actual market interest. The Company’s pension costs for all employees for 2012 were EUR 13,492. This includes the pension plan based on multi-employer union plan for EUR 6,704 (2011: see tables below), the Defined benefit plan of the US up to settlement of EUR 408 and other Defined Contribution plans for EUR 6,395 (2011: EUR 5,448). The comparable amounts for the Dutch employees are disclosed in the tables below, as part of the Defined Benefit plans of the Stork Pension Fund, which has transferred to PME as per 1 January 2012.
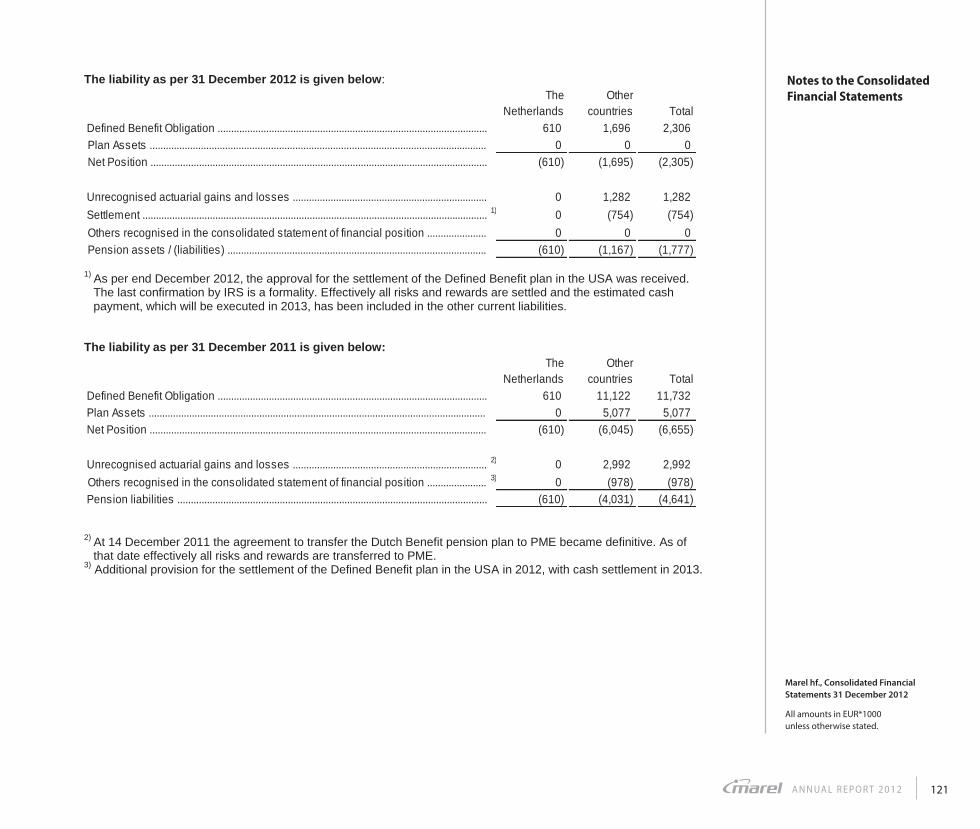
Marel hf., Consolidated Financial
Statements 31 December 2012
All amounts in EUR*1000
unless otherwise stated.
Notes to the Consolidated
Financial Statements
A N N UA L R E P O R T 2 0 1 2 121
The liability as per 31 December 2012 is given below:
Other countries Total
610 1,696 2,306 0 0 0
(610) (1,695) (2,305)
0 1,282 1,282 1) 0 (754) (754)
0 0 0 (610) (1,167) (1,777)
Plan Assets .............................................................................................................................Net Position .............................................................................................................................
Unrecognised actuarial gains and losses ........................................................................Settlement ................................................................................................................................Others recognised in the consolidated statement of financial position ......................Pension assets / (liabilities) ................................................................................................
The Netherlands
Defined Benefit Obligation ....................................................................................................
1) As per end December 2012, the approval for the settlement of the Defined Benefit plan in the USA was received.
The last confirmation by IRS is a formality. Effectively all risks and rewards are settled and the estimated cash payment, which will be executed in 2013, has been included in the other current liabilities.
The liability as per 31 December 2011 is given below:
Other countries Total
610 11,122 11,732 0 5,077 5,077
(610) (6,045) (6,655)
2) 0 2,992 2,992 3) 0 (978) (978)
(610) (4,031) (4,641)
The Netherlands
Defined Benefit Obligation ....................................................................................................Plan Assets .............................................................................................................................Net Position .............................................................................................................................
Unrecognised actuarial gains and losses ........................................................................Others recognised in the consolidated statement of financial position ......................Pension liabilities ................................................................................................................... 2) At 14 December 2011 the agreement to transfer the Dutch Benefit pension plan to PME became definitive. As of
that date effectively all risks and rewards are transferred to PME. 3) Additional provision for the settlement of the Defined Benefit plan in the USA in 2012, with cash settlement in 2013.

Marel hf., Consolidated Financial
Statements 31 December 2012
All amounts in EUR*1000
unless otherwise stated.
Notes to the Consolidated
Financial Statements
122
Defined Benefit Obligation Total
271,675 8,589 280,264 2,877 345 3,222
12,245 463 12,708 4,187 0 4,187
27,023 1,506 28,529 (14,601) (219) (14,820)
2) (302,796) 0 (302,796)0 438 438
610 11,122 11,732
0 449 449 0 520 520 0 0 0 0 710 710 0 (241) (241)
1) 0 (10,577) (10,577)0 (287) (287)
610 1,696 2,306
Benefits paid ...........................................................................................................................Settlement ................................................................................................................................Changes in exchange rates .................................................................................................At 31 December 2012 ...........................................................................................................
The Netherlands
Other countries
At 1 January 2011 .................................................................................................................
Changes in exchange rates .................................................................................................At 31 December 2011 ...........................................................................................................
Current service costs .............................................................................................................Interest costs ...........................................................................................................................Plan participants contributions ............................................................................................Actuarial gains and losses ...................................................................................................
Current service costs .............................................................................................................Interest costs ...........................................................................................................................Plan participants contributions ............................................................................................Actuarial gains and losses ...................................................................................................Benefits paid ...........................................................................................................................Settlement ................................................................................................................................
1) As per end December 2012, the approval for the settlement of the Defined Benefit plan in the USA was received. The last confirmation by IRS is a formality. Effectively all risks and rewards are settled and the estimated cash payment, which will be executed in 2013, has been included in the other current liabilities.
2) At 14 December 2011 the agreement to transfer the Dutch Benefit pension plan to PME became definitive. As of that date effectively all risks and rewards are transferred to PME.

Marel hf., Consolidated Financial
Statements 31 December 2012
All amounts in EUR*1000
unless otherwise stated.
Notes to the Consolidated
Financial Statements
A N N UA L R E P O R T 2 0 1 2 123
Plan AssetsOther
countries Total
275,943 4,609 280,552 16,212 346 16,558
5,824 606 6,430 4,187 0 4,187
39,561 (437) 39,124 (14,601) (219) (14,820)
2) (327,126) 0 (327,126)0 172 172 0 5,077 5,077
0 390 390 0 487 487 0 0 0 0 154 154 0 (241) (241)
1) 0 (5,732) (5,732)0 (135) (135)0 0 0
Benefits paid ...........................................................................................................................Settlement ................................................................................................................................Changes in exchange rates .................................................................................................At 31 December 2012 ...........................................................................................................
Changes in exchange rates .................................................................................................At 31 December 2011 ...........................................................................................................
Expected returns on plan assets ........................................................................................Employer's contribution .........................................................................................................Plan participants contributions ............................................................................................Actuarial gains and losses ...................................................................................................
Expected returns on plan assets ........................................................................................Employer's contribution .........................................................................................................Plan participants contributions ............................................................................................Actuarial gains and losses ...................................................................................................Benefits paid ...........................................................................................................................Settlement ................................................................................................................................
The Netherlands
At 1 January 2011 .................................................................................................................
1) As per end December 2012, the approval for the settlement of the Defined Benefit plan in the USA was received. The last confirmation by IRS is a formality. Effectively all risks and rewards are settled and the estimated cash payment, which will be executed in 2013, has been included in the other current liabilities.
2) At 14 December 2011 the agreement of 7 October 2011 to transfer the Dutch Benefit pension plan to PME became definitive. As of that date effectively all risks and rewards are transferred to PME.

Marel hf., Consolidated Financial
Statements 31 December 2012
All amounts in EUR*1000
unless otherwise stated.
Notes to the Consolidated
Financial Statements
124
The net period pension costs of the above pension plans:
2012The
NetherlandsOther
countries Total 0 449 449 0 520 520 0 (390) (390)0 149 149 0 0 0 0 0 0 0 728 728
20117,064 345 7,409
12,245 463 12,708 (16,212) (346) (16,558)
461 24 485 (4,187) 0 (4,187)
2) 4,820 0 4,820 428 0 428
0 885 885 4) 4,619 1,371 5,990 Pension expense 2011 ........................................................................................................
Expected returns on plan assets ........................................................................................Amortised actuarial gains and losses ...............................................................................
Settlement ................................................................................................................................
Addition for anticipated settlement in 2012 .......................................................................Administration costs ..............................................................................................................
Plan participants contributions ............................................................................................
Pension expense 2012 ........................................................................................................
Current service costs .............................................................................................................Interest costs ...........................................................................................................................
Interest costs ...........................................................................................................................Expected returns on plan assets ........................................................................................Amortised actuarial gains and losses ...............................................................................Plan participants contributions ............................................................................................Administration costs ..............................................................................................................
Current service costs .............................................................................................................
2) At 14 December 2011 the agreement to transfer the Dutch Benefit pension plan to PME became definitive. As of
that date effectively all risks and rewards are transferred to PME. The settlement result is explained by the write-off of plan assets, defined benefit obligation and actuarial gains / losses of EUR 19,510.
4) Excluding the outstanding part of the additional pension costs related to transfer of Stork Pension Fund to PME (EUR 8.6 million); including additional costs related to the anticipated settlement of the Defined Benefit plan in the USA in 2012 (EUR 0.9 million).
The industry-wide pension fund Stichting Pensioenfonds van de Metalektro (PME) has taken over the execution of the pension plan from Stork Pension Fund (SPF) as of 1 January 2012. The agreement has become definitive at 14 December 2011. Marel is party to the agreement due to its acquisition of Stork Food Systems. The costs for Marel of the pension related issues amounted to EUR 11.0 million, booked in 2011.

Marel hf., Consolidated Financial
Statements 31 December 2012
All amounts in EUR*1000
unless otherwise stated.
Notes to the Consolidated
Financial Statements
A N N UA L R E P O R T 2 0 1 2 125
The weighted average assumptions on which the calculations of the pension obligations are based are as follows:
Parameters used in actuarial calculation December 2012Other
countries Total - 4.0% 4.0%- 7.5% 7.5%- 2.5% 2.5%
year dependent 0.0%
year dependent
Parameters used in actuarial calculation December 20114.6% 4.8% 4.6%5.9% 7.5% 7.4%2.0% 2.5% 2.5%year
dependent 0.0%year
dependent
Future pension increases ....................................................................................................
Discount rate ...........................................................................................................................Expected return on plan assets ...........................................................................................Future salary increases ........................................................................................................
Future pension increases ....................................................................................................
The Netherlands
Discount rate ...........................................................................................................................Expected return on plan assets ...........................................................................................Future salary increases ........................................................................................................
The mortality table used for the Netherlands in 2011 was based on the Prognosis table 2010-2060 of the Actuarieel Genootschap. The assumptions for the expected return on plan assets have been reached on the basis of assessment of the historic returns of the various categories in which the investments were made. The historic returns on these asset categories were weighted on the basis of the expected long-term allocation of the plan assets. The expected return on plan assets for the Netherlands for 2011 was 5.9% positive and the actual return resulted at 8.1% positive plus a positive effect of increased consolidation rate of 12.1%. The actual return on plan assets in 2011 for the other countries was 15.1% (expected 7.8%).

Marel hf., Consolidated Financial
Statements 31 December 2012
All amounts in EUR*1000
unless otherwise stated.
Notes to the Consolidated
Financial Statements
126
The allocation of the investments per asset category for the pension plans is as follows:
The Netherlands
Other countries
- -- -- -- 100%
0% 100%
22% 77%47% 21%
7% 2%24% 0%
100% 100%
Percentage allocation of investments as per December 2011Shares and related instruments ......................................................................................................................Fixed-interest securities ....................................................................................................................................Property .................................................................................................................................................................Other ......................................................................................................................................................................Total .......................................................................................................................................................................
Percentage allocation of investments as per December 2012Shares and related instruments ......................................................................................................................Fixed-interest securities ....................................................................................................................................Property .................................................................................................................................................................Other ......................................................................................................................................................................Total .......................................................................................................................................................................
The plan assets consisted primarily of fixed-interest securities, listed shares and related instruments, as well as property. Historical summary 2012 2011 2010 2009 2008 May-08
2,306 11,732 280,264 281,347 276,197 275,013 0 5,077 280,552 290,316 257,474 298,998
(2,305) (6,655) 288 8,969 (18,723) 23,985
2012 2011 2010 2009 2008 May-08For the Netherlands
0 (27,023) (47,500) 6,313 5,000 n.a.0 12,140 (34,696) 25,417 0 n.a.0 (20,297) (11,694) (6,906) 11,000 n.a.0 (18,866) (1,110) (12,198) (6,000) n.a.
2012 2011 2010 2009 2008 May-08For the Netherlands
0 39,561 (24,275) (18,408) 47,000 n.a.0 0 0 0 0 n.a.0 33,338 (17,240) (10,811) 15,000 n.a.0 6,223 (7,035) (7,597) 32,000 n.a.
Actuarial gains / (losses) plan liabilities ................................Effect of the change in assumptions ......................................Effect of the change in consolidation rate ..............................Experience adjustments ...........................................................
Cash value of the obligations related to Def. Ben. plans ....Fair value of the plan assets ....................................................Net obligations ............................................................................
Experience adjustments incurred on plan liabilities (rounded)
Experience adjustments incurred on plan assets (rounded)
Actuarial gains / (losses) plan assets ....................................Effect of the change in assumptions ......................................Effect of the change in consolidation rate ..............................Experience adjustments ...........................................................

Marel hf., Consolidated Financial
Statements 31 December 2012
All amounts in EUR*1000
unless otherwise stated.
Notes to the Consolidated
Financial Statements
A N N UA L R E P O R T 2 0 1 2 127
22 Derivative financial instruments (a) Interest-rate swap To protect Marel from fluctuations in Euribor-EUR-Reuters/Libor-BBA and in accordance with Interest hedge policy Marel has entered into interest rate Swaps (the hedging instruments) to receive floating interest and to pay fixed interest. The notional principal amount of the outstanding interest rate swap contract at 31 December 2012 was EUR 135,490 (2011: EUR 145,550). The contractual maturities are as follows: 2012 Currency Principal Maturity Interest %
EUR 104,325 2013 4.3%USD 53,387 2013 4.1%EUR 80,000 2015 3.0%USD 50,000 2015 2.8%
2011 Currency Principal Maturity Interest %EUR 104,325 2013 4.3%USD 53,387 2013 4.1%EUR 80,000 2015 3.0%USD 50,000 2015 2.8%
Interest rate SWAP ........................................................................................Forward Starting Interest rate SWAP 2013 ..............................................Forward Starting Interest rate SWAP 2013 ..............................................
Interest rate SWAP ........................................................................................Interest rate SWAP ........................................................................................Forward Starting Interest rate SWAP 2013 ..............................................Forward Starting Interest rate SWAP 2013 ..............................................
Interest rate SWAP ........................................................................................
(b) Hedge of net investment in foreign entity There are no net investment hedges as per end of 2012 (2011: zero) The maximum exposure to credit risk at the reporting date is the fair value of the derivative assets in the Consolidated Statement of Financial Position, which is zero.
23 Trade and other payables
2012 201155,562 55,933
3,435 2,486 66,420 67,151
125,417 125,570
Accruals ..............................................................................................................................................................Trade payables .................................................................................................................................................
Other payables ..................................................................................................................................................

Marel hf., Consolidated Financial
Statements 31 December 2012
All amounts in EUR*1000
unless otherwise stated.
Notes to the Consolidated
Financial Statements
128
24 Contingencies At 31 December 2012 the Group had contingent liabilities in respect of bank and other guarantees and other matters arising in the ordinary course of business from which it is anticipated that no material liabilities will arise. In the ordinary course of business the Group has given guarantees amounting to EUR 15,882 (2011: EUR 41,690) to third parties. The Supreme Court of Iceland has given its judgment at 27 September 2012, in the case Glitnir bank hf. brought against Marel hf. The verdict is in favor of Marel. The District Court of Reykjanes ruled in favor of Marel 12 April 2011, and the Supreme Court of Iceland has given its verdict on the matter, reaffirming the ruling of the District Court. The contingency reported in the former publications is herewith concluded without impact on the results. From time to time claims are filed against the Group. Although the outcome of current claims cannot be predicted with any certainty, it is assumed – partly on the basis of legal advice – that these will not have any significant impact on the consolidated financial statements.
25 Commitments and insurance At the end of the reporting period, the future minimum lease payments under non-cancellable operating leases are payable as follows:
2012 20114,237 3,546 5,581 4,040 1,147 1,209
10,965 8,795
Less than 1 year ...............................................................................................................................................Between 1 and 5 years ....................................................................................................................................Later than 5 years .............................................................................................................................................Total operational lease liabilities ..................................................................................................................
During the year an amount of EUR 4,513 was recognised as an expense in profit or loss in respect of operating leases (2011: EUR 4,091). Insurance The Group has covered Business Interruption Risks with an insurance policy underwritten by an independent insurance company for a maximum period of 24 months. The insurance benefits for Business Interruption amount to EUR 494 million for 2012 for the whole Group. The Group Insurance value of buildings amounts to EUR 136 million, productions machinery and equipment including software and office equipment amount to EUR 117 million and inventories to EUR 102 million. Currently there are no major differences between appraisal value and insured value.

Marel hf., Consolidated Financial
Statements 31 December 2012
All amounts in EUR*1000
unless otherwise stated.
Notes to the Consolidated
Financial Statements
A N N UA L R E P O R T 2 0 1 2 129
26 Related party transactions At the end of December 2012 and 2011, there are no loans to directors.
Board feePension
contribution1)Stock
options2)
Bought shares acc.
to stock options2)
Shares at year-end 2)
87 7 0 0 243,499 3)
29 2 0 0 0 58 5 0 0 32 33 3 0 0 4,300 29 2 0 0 5,105 29 2 0 0 200
4 0 0 0 0 29 2 0 375 1,000 4)
Salary and benefits
Share based
benefitsIncentive
paymentsPension
contribution1)Stock
options 2)
Bought shares acc.
to stock options2)
Shares at year-end 2)
Theo Hoen, CEO.................................................................. 418 0 136 92 2,950 0 1,500 Erik Kaman, CFO................................................................. 376 0 109 32 2,300 0 1,675 Sigsteinn Gretarsson, COO............................................... 333 285 93 24 625 825 26 Five Managing Directors..................................................... 925 150 177 107 3,435 425 124 5)
Board fee for the year 2012 and shares at year-end
Margrét Jónsdóttir, Board Member......................................................................................
Theo Bruinsma, Board Member............................................................................................
Árni Oddur Þórðarson, Chairman.........................................................................................Arnar Þór Másson, Board Member.......................................................................................Ásthildur Margrét Otharsdóttir , Board Member..................................................................Friðrik Jóhannsson, Board Member....................................................................................Helgi Magnússon, Board Member.......................................................................................
Smári Rúnar Þorvaldsson, Board Member (until 29 February 2012)............................
1) Pension contributions for all board members are part of a defined contribution plan. 2) Number of shares * 1000 3) Shares owned by Eyrir Invest hf., where Árni Oddur Þórðarson is CEO, including those of financially related parties.
Margrét Jónsdóttir is the CFO of Eyrir Invest hf. 4) Theo Bruinsma was previously President of Townsend Inc. which was acquired by Stork in 2006. Thereafter, he
was part of Stork and Marel's management team until 2010. In accordance with his employment agreement, Mr. Bruinsma received payments in 2012 in addition to the board fee amounting to EUR 433 as well as share based benefits amounting to EUR 128. At the year-end 2012 he does not hold any stock options.
5) Marel has identified five managers other than the members of the Board of Management who have material significance for Marel’s operations. This group consists of the four Managing Directors of Marel’s Industry Centers and the Managing Director of Marel’s international sales and service network.

Marel hf., Consolidated Financial
Statements 31 December 2012
All amounts in EUR*1000
unless otherwise stated.
Notes to the Consolidated
Financial Statements
130
Stock optionsNumber of
shares 2)
Average exercise
price2,000 87.41 ISK per share
350 0.553 EUR per share600 1.083 EUR per share
1,500 87.41 ISK per share350 0.553 EUR per share450 1,083 EUR per share
175 0.570 EUR per share450 1,083 EUR per share
1,250 87.41 ISK per share2,185 0.86 EUR per share
Sigsteinn Gretarsson, COO.............................................................................................................................................................
Five Managing Directors...................................................................................................................................................................
Erik Kaman, CFO...............................................................................................................................................................................
Theo Hoen, CEO................................................................................................................................................................................
Board feePension
contribution1)Stock
options 2)
Bought shares acc.
to stock options2)
Shares at year-end 2)
60 5 0 0 262,099 3)
23 2 0 0 0 43 3 0 0 32 45 4 0 0 4,300 23 2 0 0 5,308
3 0 0 0 61,673 4)
23 2 0 0 200 23 2 0 0 0 23 2 375 375 1,000 5)
Friðrik Jóhannsson, Board Member....................................................................................Helgi Magnússon, Board Member.......................................................................................
Margrét Jónsdóttir, Board Member......................................................................................
Theo Bruinsma, Board Member............................................................................................
Lars Grundtvig, Board Member (until 2 March 2011)........................................................
Smári Rúnar Þorvaldsson, Board Member.........................................................................
Board fee for the year 2011 and shares at year-end
Árni Oddur Þórðarson, Chairman.........................................................................................Arnar Þór Másson, Board Member.......................................................................................Ásthildur Margrét Otharsdóttir , Board Member..................................................................
1) Contributions for Theo Hoen and Erik Kaman were part of a defined benefit plan; contributions for the other board members are part of a defined contribution plan. 2) Number of shares * 1000 3) Shares owned by Eyrir Invest hf., where Árni Oddur Þórðarson is CEO, including those of financially related parties.
Margrét Jónsdóttir is the CFO of Eyrir Invest hf. 4) Shares owned by Grundvigt Invest AsP. 5) Theo Bruinsma holds a managerial position along with being a member of the board of directors. Salary and
benefits for his management position are not included.

Marel hf., Consolidated Financial
Statements 31 December 2012
All amounts in EUR*1000
unless otherwise stated.
Notes to the Consolidated
Financial Statements
A N N UA L R E P O R T 2 0 1 2 131
Salary and benefits
Incentive payments
Pension contribution1)
Stock options 2)
Bought shares acc.
to stock options2)
Shares at year-end 2)
384 144 88 2,350 0 1,500 351 115 28 1,850 0 1,675 297 82 36 1,000 350 26
Theo Hoen, CEO............................................................................................Erik Kaman, CFO...........................................................................................Sigsteinn Gretarsson, COO.........................................................................
Stock options
Number of shares 2)
Average exercise
price2,000 89 ISK per share
350 0.563 EUR per share
1,500 89 ISK per share350 0.563 EUR per share
150 92 ISK per share500 89 ISK per share350 0.563 EUR per share
375 89 ISK per share
Erik Kaman, CFO...............................................................................................................................................................................
Sigsteinn Gretarsson, COO.............................................................................................................................................................
Theo Bruinsma, Board Member.....................................................................................................................................................
Theo Hoen, CEO................................................................................................................................................................................
1) Contributions for Theo Hoen and Erik Kaman were part of a defined benefit plan; contributions for the other board members are part of a defined contribution plan. 2) Number of shares * 1000
27 Fees to Auditors
2012 2011639 675
68 261 92 47
799 983
Audit of financial statements ..........................................................................................................................
Other services ...................................................................................................................................................Other services - audit related .........................................................................................................................

Marel hf., Consolidated Financial
Statements 31 December 2012
All amounts in EUR*1000
unless otherwise stated.
Notes to the Consolidated
Financial Statements
132
28 Events after the balance sheet date No significant events have taken place since the reporting date.
29 Subsidiaries The largest subsidiaries are listed below: Country of Ownership Incorporation Interest Marel Iceland ehf. ………………………………………………… Iceland 100% Marel A/S …………………………………………………………. Denmark 100% Marel Salmon A/S ……………………………………………….. Denmark 100% Marel Seattle Inc …………………………………………………. USA 100% Marel Singapore Pte. Ltd ……………………………………….. Singapore 100% Marel Ltd. ………………………………………………………..… UK 100% Marel Slovakia s.r.o. ……………………………………………… Slovakia 100% Marel Holding B.V. ……………………………………………..… Netherlands 100% Marel Stork Poultry Processing B.V. …………………………… Netherlands 100% Marel Stork Poultry Processing Inc. ………………………….… USA 100% Marel Townsend Further Processing B.V. …………………..… Netherlands 100% Marel Meat Processing B.V. ………………………………….…. Netherlands 100% Marel Meat Processing Inc ……………………………………… USA 100% Stork Inter Ibérica S.A. …………………………………………… Spain 100% Marel Inc. …………………………………………………………. USA 100% Marel Norge AS ………………………………………………...… Norway 100% Marel Food Systems GmbH & Co. KG ………………………… Germany 100% Marel GB Ltd. …………………………………………………….. UK 100% Marel Food Systems do Brasil Comercial Ltda. …………….… Brazil 100% Marel France SARL ……………………………………………… France 100% Marel Benelux B.V. ………………………………………….…… Netherlands 100% Marel Australia Pty Ltd. ………………………………………..… Australia 100% Marel Stork Food Systems Máquinas Alimenticias Ltda …….. Brazil 100%

Marel hf., Consolidated Financial
Statements 31 December 2012
All amounts in EUR*1000
unless otherwise stated.
Notes to the Consolidated
Financial Statements
A N N UA L R E P O R T 2 0 1 2 133
30 Quarterly results (unaudited)
Q4 2012 Q3 2012 Q2 2012 Q1 2012 Total
Revenue ................................................................................ 178,363 164,264 186,469 184,864 713,960 Cost of sales ........................................................................ (118,277) (105,393) (124,192) (116,872) (464,734) Gross profit 60,086 58,871 62,277 67,992 249,226
Selling and marketing expenses ...................................... (23,100) (21,440) (23,666) (21,913) (90,119) Research and development expenses ........................... (9,943) (10,638) (10,940) (10,045) (41,566) Administrative expenses .................................................... (14,061) (12,547) (15,681) (14,656) (56,945) Other operating income / (expenses) .............................. 650 (127) 220 (258) 485 Result from operations (EBIT) 13,632 14,119 12,210 21,120 61,081
Finance costs ....................................................................... (5,271) (4,303) (4,103) (4,689) (18,366) Finance income ................................................................... (6) (264) 24 582 336 Net finance costs ................................................................. (5,278) (4,567) (4,079) (4,107) (18,030)
Result before income tax 8,354 9,552 8,131 17,013 43,051
Income tax ............................................................................ (1,211) (1,144) (1,143) (3,944) (7,442) Profit for the period 7,143 8,408 6,988 13,069 35,609
Profit before deprec. & amortisation (EBITDA) ............... 19,527 20,465 18,570 27,401 85,963

Marel hf., Consolidated Financial
Statements 31 December 2012
All amounts in EUR*1000
unless otherwise stated.
Notes to the Consolidated
Financial Statements
134
Q4 2011 Q3 2011 Q2 2011 Q1 2011 Total
Revenue ................................................................................ 183,903 169,063 161,854 153,537 668,357 Cost of sales ........................................................................ (114,105) (108,371) (103,971) (94,619) (421,068) Gross profit 69,798 60,692 57,883 58,918 247,291
Selling and marketing expenses ...................................... (21,563) (18,499) (20,282) (19,471) (79,815) Research and development expenses ........................... (11,343) (9,501) (9,839) (9,640) (40,323) Administrative expenses .................................................... (15,089) (13,120) (12,794) (12,690) (53,693) Other operating income / (expenses) .............................. (62) (119) (11,116) 4 (11,293) Result from operations (EBIT) 21,741 19,453 3,852 17,121 62,167
Finance costs ....................................................................... (3,109) (5,729) (4,418) (6,596) (19,852) Finance income ................................................................... 852 (572) 1,229 235 1,744 Net finance costs ................................................................. (2,257) (6,301) (3,189) (6,361) (18,108)
Result before income tax 19,484 13,152 663 10,760 44,059
Income tax ............................................................................ (4,497) (2,680) (434) (1,984) (9,595) Profit for the period 14,987 10,472 229 8,776 34,464
Profit before deprec. & amortisation (EBITDA) ............... 28,029 25,819 9,835 23,323 87,006

Marel hf., Consolidated Financial
Statements 31 December 2012
All amounts in EUR*1000
unless otherwise stated.
Notes to the Consolidated
Financial Statements
A N N UA L R E P O R T 2 0 1 2 135

Marel hf., Consolidated Financial
Statements 31 December 2012
All amounts in EUR*1000
unless otherwise stated.
Notes to the Consolidated
Financial Statements
136
Design and layout: Hvíta húsið
Printing: Ísafoldarprentsmiðja
Publication schedule for 2013-2014
Annual General Meeting 2013 6 March 2013
1st quarter 2013 22 April 2013
2nd quarter 2013 24 July 2013
3rd quarter 2013 23 October 2013
4th quarter 2013 5 February 2014
Annual General Meeting 2014 5 March 2014

Marel
Austurhraun 9
IS-210 • Gardabaer • Iceland
marel.com


![Linear algebra, signal processing, and wavelets. A unified ...linear algebra. One example is [33], which goes further in using matrix notation than many signal processing textbooks.](https://static.fdocuments.net/doc/165x107/5f085f1d7e708231d421ae49/linear-algebra-signal-processing-and-wavelets-a-uniied-linear-algebra.jpg)