
FURTHER EVIDENCE ON INSIDER TRADING AND THE MERITS OF SECURITIES CLASS ACTIONS
13
The Journal of Financial Research • Vol. XXX, No. 4 • Pages 533–545 • Winter 2007 FURTHER EVIDENCE ON INSIDER TRADING AND THE MERITS OF SECURITIES CLASS ACTIONS Zahid Iqbal Texas Southern University Shekar Shetty Salisbury University Kun Wang Texas Southern University Abstract To provide further evidence on the merits of securities class actions, we examine insider transactions immediately before and during the class period, using a larger and newer data set. We show that insiders reduce their stock sales by an abnormal amount immediately before the class period. Alternative measures of insider transactions and analysis of data before the enactment of the Private Securities Litigation Reform Act of 1995 provide consistent results. These new findings indicate that class actions, on average, have merit. Our data also reestablish a previous empirical result that there is no abnormal selling during the class period. JEL Classification: G3, G14 I. Introduction There is an ongoing debate in the literature on the merits of securities class ac- tions (i.e., whether managers deliberately overstate firm earnings). 1 The merit of a securities class action can be assessed by examining managerial incentives for misstating firm earnings. Niehaus and Roth (1999) suggest that insider selling, new stock issues, and executive turnover around the class period are possible manage- rial incentives for class actions. 2 Although Niehaus and Roth find no evidence of abnormal insider sales and new stock issues during the class period, they observe 1 Throughout this article, we use the term “earnings overstatement” generically to connote over- statement of all performance indicators including earnings and omissions of negative facts about the firm. 2 The class period runs from the first day a firm’s stock price is claimed to be artificially inflated to the day it drops on a subsequent disclosure of true financial information. Only investors who purchased stock during this period are included in the class action suit. 533
-
Upload
zahid-iqbal -
Category
Documents
-
view
212 -
download
0
Transcript of FURTHER EVIDENCE ON INSIDER TRADING AND THE MERITS OF SECURITIES CLASS ACTIONS
The Journal of Financial Research • Vol. XXX, No. 4 • Pages 533–545 • Winter 2007
FURTHER EVIDENCE ON INSIDER TRADING AND THE MERITSOF SECURITIES CLASS ACTIONS
Zahid IqbalTexas Southern University
Shekar ShettySalisbury University
Kun WangTexas Southern University
Abstract
To provide further evidence on the merits of securities class actions, we examineinsider transactions immediately before and during the class period, using a largerand newer data set. We show that insiders reduce their stock sales by an abnormalamount immediately before the class period. Alternative measures of insidertransactions and analysis of data before the enactment of the Private SecuritiesLitigation Reform Act of 1995 provide consistent results. These new findingsindicate that class actions, on average, have merit. Our data also reestablish aprevious empirical result that there is no abnormal selling during the class period.
JEL Classification: G3, G14
I. Introduction
There is an ongoing debate in the literature on the merits of securities class ac-tions (i.e., whether managers deliberately overstate firm earnings).1 The merit ofa securities class action can be assessed by examining managerial incentives formisstating firm earnings. Niehaus and Roth (1999) suggest that insider selling, newstock issues, and executive turnover around the class period are possible manage-rial incentives for class actions.2 Although Niehaus and Roth find no evidence ofabnormal insider sales and new stock issues during the class period, they observe
1Throughout this article, we use the term “earnings overstatement” generically to connote over-statement of all performance indicators including earnings and omissions of negative facts about thefirm.
2The class period runs from the first day a firm’s stock price is claimed to be artificially inflated to theday it drops on a subsequent disclosure of true financial information. Only investors who purchased stockduring this period are included in the class action suit.
533
534 The Journal of Financial Research
that insider sales are associated with a higher probability of CEO turnover. Hence,insider selling during the class period indicates merit in a class action in that itpenalizes managers for misstating firm earnings.
In this article, we provide evidence on the merits of class actions by exam-ining insider trading around the class period. Specifically, our empirical analysis isconducted as follows. First, we directly assess the timing and magnitude of insidertransactions immediately before and during the class period. To our knowledge,there has been no examination of insider trading immediately preceding the classperiod. Such an examination is important in light of prior empirical findings thatabnormal insider transactions occur both before and after a corporate event (e.g.,Lee, Mikkelson, and Partch 1992; John and Lang 1991).
Second, we provide evidence using a larger sample of class actions roughlysix times the size of the sample in Niehaus and Roth (1999). Finally, our primaryanalysis includes class actions filed after passage of the Private Securities Litiga-tion Reform Act (PSLRA) of 1995. This newer post-PSLRA data set allows us tocompare insider transactions under two regulatory regimes.
Of the three dates associated with class periods—beginning date, endingdate, and filing date—we focus on the beginning date. If insiders deliberately over-state firm earnings and act on it, they will buy shares before the overstatement date,which is generally the beginning date of the class period, and they will sell sharesduring the class period.3 Like the ending date, the beginning date is not knownbefore the filing of the class action. Initially determined by plaintiffs’ counsel afterextensive research and investigation, the beginning and ending dates may changeduring the litigation based on new information.
Our results indicate that insiders (top executives) curtail their stock sales byan abnormal amount immediately before the class period. They increase net sharepurchases and reduce proportions of sales trades and sales volume just before theclass period. Our analysis of class actions before enactment of the PSLRA alsoconfirms a slowdown in insider sales just before the class period. The regressionresults show that net purchases by the top executives measured as open marketpurchases minus open market sales are positively related to abnormal stock returnson the day before the class period. This new evidence that insiders engage in highernet purchases shortly before the class period indicates that class actions, on average,have merit. Our results also reestablish the finding in Niehaus and Roth (1999) thatthere is no abnormal selling during the class period using a larger sample of classactions filed in recent years.
3Managers would also typically know the timing and content of the bad news released at the endingdate and be able to time their trades accordingly.
Merits of Securities Class Actions 535
II. Securities Class Action Litigation
A securities class action is a lawsuit filed on behalf of a group of investors whosuffer financial losses attributable to alleged manager violations of the securitieslaws. Often the lawsuits allege a series of false and misleading statements regardinga company’s earnings or other material facts that caused the company’s stock to tradeat higher prices than it otherwise would have. This results in the investors payinga price for the firm’s stock they never would have paid if they had known the truthabout the company’s business. Typically, it is more efficient for investors to pursuetheir claims as part of a class rather than pursuing an individual claim.
Most class action cases allege violations of Rule 10b-5, adopted by theSecurities and Exchange Commission (SEC) in 1942. Rule 10b-5 established thatit is unlawful to make a material misstatement or omit a statement of material fact.In lawsuits alleging violation of Rule 10b-5, the plaintiff must show that he or sherelied on the misstated earnings to trade the firm’s security.4 The lawsuit claims thatthe firm’s stock price is artificially inflated on the first day of the class period as aresult of the alleged fraud. Any investor who purchased the firm’s securities duringthe class period suffers financial loss on the last day of the period when stockprice drops as a result of the true disclosure. The investor is potentially eligibleto recover the difference between the price he or she paid for the security andits actual value as determined by a court subject to the limitations of the federalsecurities laws. The usual defendants in Rule 10b-5 cases are the officers anddirectors, underwriters, and accountants of the firm. The officers and directors canbe liable either primarily, if they directly participated in the alleged misstatement,or secondarily, as controlling persons of the firm.
III. Theory and Hypotheses
Prior research shows that insiders tend to purchase shares in a firm before corporateevents that produce positive stock returns and sell before events that produce nega-tive returns (e.g., see Lee, Mikkelson, and Partch 1992 on stock repurchases; Johnand Lang 1991 on dividends). These findings indicate that insiders have knowl-edge of the upcoming event and that they exploit privileged information for theirpersonal benefit.
Managerial self-serving behavior is also investigated in studies of securitiesfraud. Summers and Sweeney (1998) and Beneish (1999) provide evidence that
4A 10b-5 litigation based on the “fraud on the market” theory assumes that securities prices reflect allrelevant information and that the investors can rely on the price to make their investment decision. To meetthe reliance test, investors can claim that they relied on the price instead of a specific disclosure to trade thefirm’s security.
536 The Journal of Financial Research
insiders trade shares in their firms at the time they perpetrate fraud, likely profitingfrom the release of fraudulent financial information. In Summers and Sweeney,corporate insiders of 51 companies charged with fraud reduced their net position inthe firm’s stock through significant stock selling. In Beneish, insiders of 64 firmsthat had become the subjects of SEC enforcement actions also sold shares beforepublic discovery of earnings overstatement. These studies suggest that insidersprofit from fraud that they plan to commit or have already committed.
Niehaus and Roth (1999) expand the literature on insider trading by exam-ining unusual trading behavior in relation to class action litigation. They hypothesizethat rational managers will overstate earnings (i.e., conceal negative information)only if they have an economic incentive to do so. They will have an incentive tosell shares in their firm in unusual amounts during the class period if the stockprice is inflated. Abnormal selling during a class period will serve as evidence thatmanagers have overstated earnings and that the class actions have some merit.
The empirical results in Niehaus and Roth (1999), however, show no ab-normal sales by top executives during the class period. Their findings are at oddswith the contention that insiders profit from privileged information. As we knowmanagers generally have access to privileged information and can act on it, weshould further investigate insider trading around security class actions.
In this article we analyze insider transactions immediately before and duringthe class period; examination of pre-class period insider trading is new. Our primaryanalysis focuses on the timing and magnitude of insider transactions for class actionlawsuits filed after enactment of the PSLRA. We compare the results of these classactions with those filed in the pre-PSLRA period. It is possible that only the classactions following passage of the PSLRA have merit because the PSLRA discouragesfrivolous lawsuits.
The first hypothesis is:
H1: Insiders will increase purchases or reduce sales of their shares in thefirm in abnormal amounts immediately before the class period. Inother words, insiders’ net purchases will be higher just before theclass period than in what is defined as the normal period.
The second hypothesis is:
H2: Insiders will sell their shares in abnormal amounts during the classperiod.
IV. Data and Sample
We use the Securities Class Action Clearinghouse to identify 857 cases of share-holder lawsuits filed between January 1996 and June 2003. This database lists allfilings following passage of the PSLRA. Of the 857 firms, 750 are included in the
Merits of Securities Class Actions 537
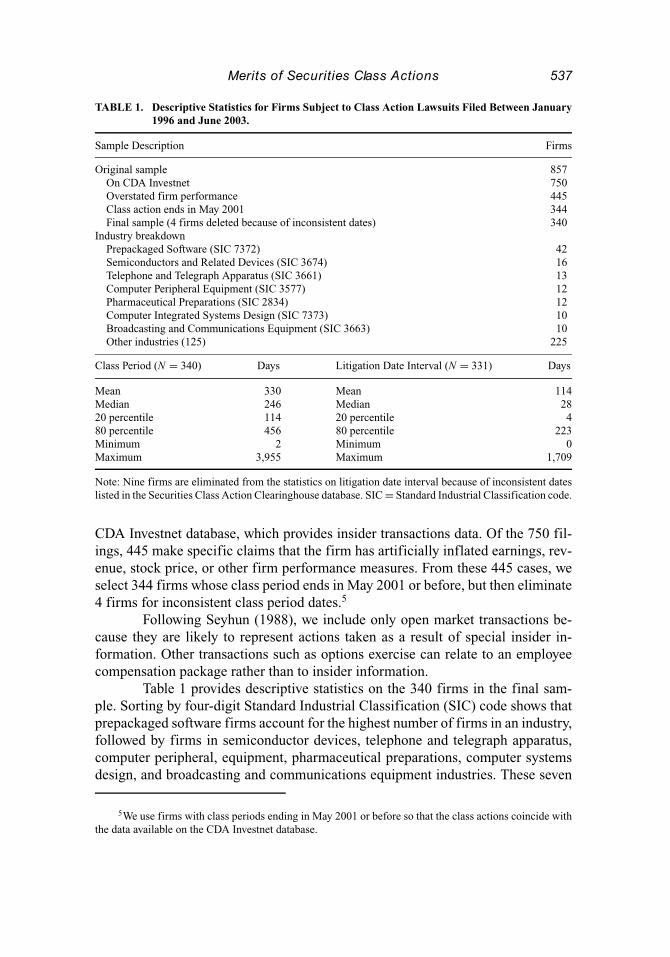
TABLE 1. Descriptive Statistics for Firms Subject to Class Action Lawsuits Filed Between January1996 and June 2003.
Sample Description Firms
Original sample 857On CDA Investnet 750Overstated firm performance 445Class action ends in May 2001 344Final sample (4 firms deleted because of inconsistent dates) 340
Industry breakdownPrepackaged Software (SIC 7372) 42Semiconductors and Related Devices (SIC 3674) 16Telephone and Telegraph Apparatus (SIC 3661) 13Computer Peripheral Equipment (SIC 3577) 12Pharmaceutical Preparations (SIC 2834) 12Computer Integrated Systems Design (SIC 7373) 10Broadcasting and Communications Equipment (SIC 3663) 10Other industries (125) 225
Class Period (N = 340) Days Litigation Date Interval (N = 331) Days
Mean 330 Mean 114Median 246 Median 2820 percentile 114 20 percentile 480 percentile 456 80 percentile 223Minimum 2 Minimum 0Maximum 3,955 Maximum 1,709
Note: Nine firms are eliminated from the statistics on litigation date interval because of inconsistent dateslisted in the Securities Class Action Clearinghouse database. SIC = Standard Industrial Classification code.
CDA Investnet database, which provides insider transactions data. Of the 750 fil-ings, 445 make specific claims that the firm has artificially inflated earnings, rev-enue, stock price, or other firm performance measures. From these 445 cases, weselect 344 firms whose class period ends in May 2001 or before, but then eliminate4 firms for inconsistent class period dates.5
Following Seyhun (1988), we include only open market transactions be-cause they are likely to represent actions taken as a result of special insider in-formation. Other transactions such as options exercise can relate to an employeecompensation package rather than to insider information.
Table 1 provides descriptive statistics on the 340 firms in the final sam-ple. Sorting by four-digit Standard Industrial Classification (SIC) code shows thatprepackaged software firms account for the highest number of firms in an industry,followed by firms in semiconductor devices, telephone and telegraph apparatus,computer peripheral, equipment, pharmaceutical preparations, computer systemsdesign, and broadcasting and communications equipment industries. These seven
5We use firms with class periods ending in May 2001 or before so that the class actions coincide withthe data available on the CDA Investnet database.
538 The Journal of Financial Research
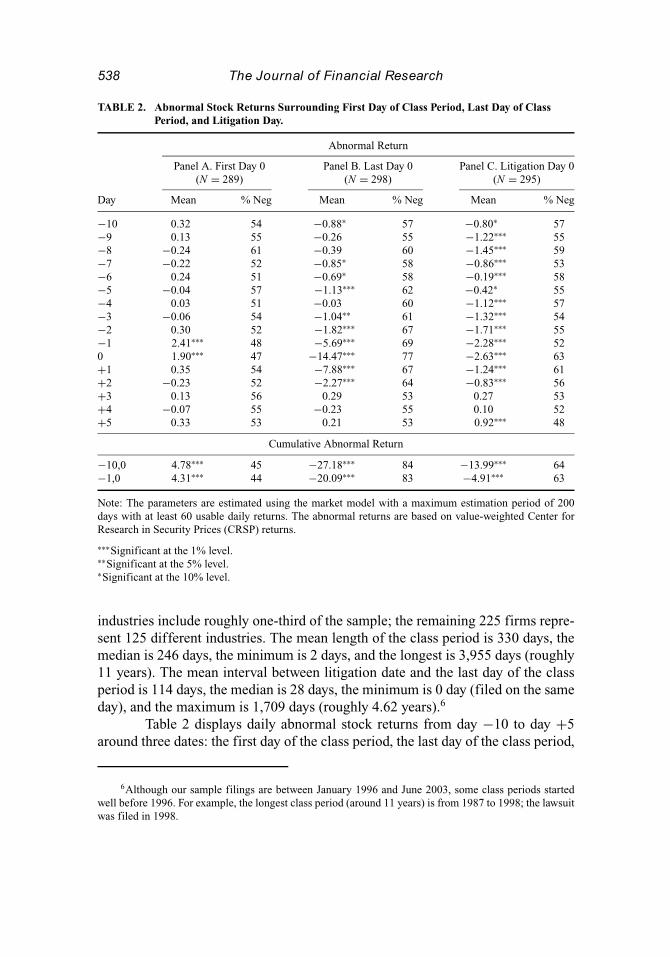
TABLE 2. Abnormal Stock Returns Surrounding First Day of Class Period, Last Day of ClassPeriod, and Litigation Day.
Abnormal Return
Panel A. First Day 0 Panel B. Last Day 0 Panel C. Litigation Day 0(N = 289) (N = 298) (N = 295)
Day Mean % Neg Mean % Neg Mean % Neg
−10 0.32 54 −0.88∗ 57 −0.80∗ 57−9 0.13 55 −0.26 55 −1.22∗∗∗ 55−8 −0.24 61 −0.39 60 −1.45∗∗∗ 59−7 −0.22 52 −0.85∗ 58 −0.86∗∗∗ 53−6 0.24 51 −0.69∗ 58 −0.19∗∗∗ 58−5 −0.04 57 −1.13∗∗∗ 62 −0.42∗ 55−4 0.03 51 −0.03 60 −1.12∗∗∗ 57−3 −0.06 54 −1.04∗∗ 61 −1.32∗∗∗ 54−2 0.30 52 −1.82∗∗∗ 67 −1.71∗∗∗ 55−1 2.41∗∗∗ 48 −5.69∗∗∗ 69 −2.28∗∗∗ 520 1.90∗∗∗ 47 −14.47∗∗∗ 77 −2.63∗∗∗ 63+1 0.35 54 −7.88∗∗∗ 67 −1.24∗∗∗ 61+2 −0.23 52 −2.27∗∗∗ 64 −0.83∗∗∗ 56+3 0.13 56 0.29 53 0.27 53+4 −0.07 55 −0.23 55 0.10 52+5 0.33 53 0.21 53 0.92∗∗∗ 48
Cumulative Abnormal Return
−10,0 4.78∗∗∗ 45 −27.18∗∗∗ 84 −13.99∗∗∗ 64−1,0 4.31∗∗∗ 44 −20.09∗∗∗ 83 −4.91∗∗∗ 63
Note: The parameters are estimated using the market model with a maximum estimation period of 200days with at least 60 usable daily returns. The abnormal returns are based on value-weighted Center forResearch in Security Prices (CRSP) returns.
∗∗∗Significant at the 1% level.∗∗Significant at the 5% level.∗Significant at the 10% level.
industries include roughly one-third of the sample; the remaining 225 firms repre-sent 125 different industries. The mean length of the class period is 330 days, themedian is 246 days, the minimum is 2 days, and the longest is 3,955 days (roughly11 years). The mean interval between litigation date and the last day of the classperiod is 114 days, the median is 28 days, the minimum is 0 day (filed on the sameday), and the maximum is 1,709 days (roughly 4.62 years).6
Table 2 displays daily abnormal stock returns from day −10 to day +5around three dates: the first day of the class period, the last day of the class period,
6Although our sample filings are between January 1996 and June 2003, some class periods startedwell before 1996. For example, the longest class period (around 11 years) is from 1987 to 1998; the lawsuitwas filed in 1998.
Merits of Securities Class Actions 539
and the litigation filing day. The stock returns are obtained from the Center forResearch in Security Prices (CRSP) database.7
Panel A presents abnormal stock returns surrounding the first day (day 0) ofthe class period. The data show positive and significant abnormal returns of 1.90%on day 0 and 2.41% on day −1. Fewer than half of the firms have negative abnormalreturns on these two days. The cumulative abnormal returns are also positive andsignificant. These results indicate that positive abnormal stock returns occur aroundfavorable earnings announcement at the beginning of the class period.
Panel B presents abnormal returns around the last day of the class period. Asignificant drop in stock returns around the last day triggers a class action lawsuit.The results in Panel B show that the abnormal stock returns are negative andsignificant in 10 of 16 days with a −14.47% abnormal return on the last day(day 0). Roughly 77% of the firms have negative abnormal returns on day 0. Thecumulative abnormal returns are also negative and significant in both intervals.
Panel C shows abnormal returns around the litigation filing day. We seesignificant negative abnormal returns when class actions are filed. These results areconsistent with the findings in Bhagat, Bizjak, and Coles (1998, Table 4) who finda −0.97% abnormal stock return surrounding the filing of corporate lawsuits. Forlitigation involving violations of disclosure laws, the abnormal return is −2.71%.
In sum, the results in Table 2 suggest that abnormal stock returns increasearound the beginning of the class period. This can give insiders an incentive toincrease net purchases before the class period and reduce net purchases during theclass period.
V. Empirical Findings
In this section we examine daily and monthly insider transactions in various intervalssurrounding the class period.
Daily Shares Transactions
We first use daily shares data to examine gainful insider transactions immediatelybefore and during the class period. Evidence of such transactions will indicatethat insiders overstate firm performance and act on it. We examine transactionsduring a one-year “normal” trading period from day −375 to day −11, a pre-classperiod from day −10 to day −1, and a class period from day 0 to the end of theclass period. We argue that the normal period is separated enough from the classperiod that trading in the normal period would not be related to the alleged earnings
7We estimate the market model parameters using a maximum estimation period of 200 days with atleast 60 usable daily returns. The abnormal returns are based on value-weighted CRSP returns.
540 The Journal of Financial Research
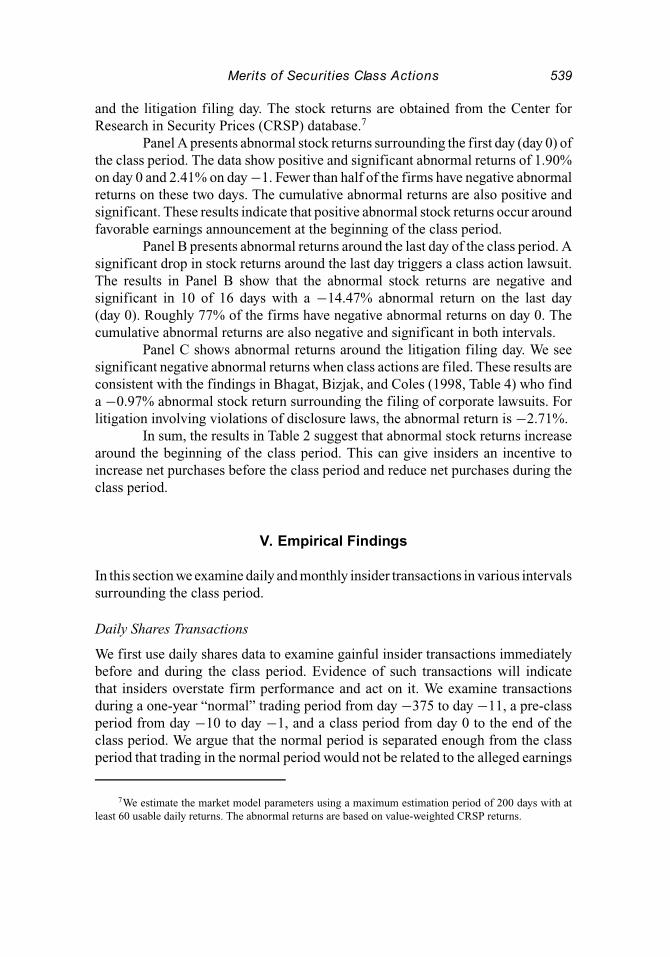
TABLE 3. Net Open Market Purchases (NET OPEN) in Selected Intervals.
Panel A. All Insiders Panel B. Top Executives
Trading Interval Mean Median Mean Median(Days) (N = 340) (N = 340) % Neg (N) (N = 340) (N = 340) % Neg (N)
−375 to −11 −1,641.14 −186.27 77.39 (283) −337.25 0.00 79.14 (163)−10 to −1 −42.08 0.00 53.57 (28) 1.76 0.00 50.00 (6)0 to end −5,963.76 −405.71 78.28 (290) −1,481.74 0.00 76.27 (177)
t-statistic Wilcoxon Z % Decline (N) t-statistic Wilcoxon Z % Decline (N)
−375 to −11vs. −10 to −1 −4.86∗∗∗ −10.56∗∗∗ 24.21 (285) −3.08∗∗∗ −8.20∗∗∗ 21.95 (164)vs. 0 to end 1.65∗ 1.62 57.14 (322) 1.19 0.43 53.28 (229)
Note: The intervals are: a normal trading period from day −375 to day −11, a pre-class period from day−10 to day −1, and the class period from day 0 to the last day of the class period. Day 0 is the first dayof the class period. In computing mean and median, a missing transaction is assigned a zero value. Incomputing % Neg, the number of firms with a negative NET OPEN transaction over an interval is dividedby the total number of firms with an open market transaction during that interval. In computing % Negand % Decline, N is the number of firms with an open market transaction during the interval. Findings arereported for all insiders (Panel A) and for top executives (Panel B).
∗∗∗Significant at the 1% level.∗Significant at the 10% level.
overstatement. When insiders purposely overstate a firm’s earnings to inflate thestock price, they are likely to purchase more shares (or sell fewer shares) duringthe pre-class period than in the normal period (hypothesis 1). To profit from theinflated stock price, the insiders are expected to sell shares during the class period(hypothesis 2).
We divide the sample by insider types, all insiders and top executives. Thetop executives are defined as the chairman of the board, chief executive officer,or president of the firm.8 A top executive with multiple titles such as director orcontrolling person is classified as a top executive. All insiders include top execu-tives, middle-level executives such as the chief financial officer, and all directors,beneficial owners, and other insiders listed in the CDA Investnet database.
Net open market purchases are shares purchased in the open market mi-nus shares sold in the open market during a given day or interval (NET OPEN).Our results on mean and median NET OPEN, percentage of firms with a negativeNET OPEN, and percentage of firms with a drop in NET OPEN from the normalperiod are in Table 3. Percentages are computed for firms with at least one openmarket trade during the interval.
8We could not include chief financial officers in the top executives group because the CDA Investnetdatabase does not identify them separately. Our definition of top executives is consistent with that in Warner,Watts, and Wruck (1988).
Merits of Securities Class Actions 541
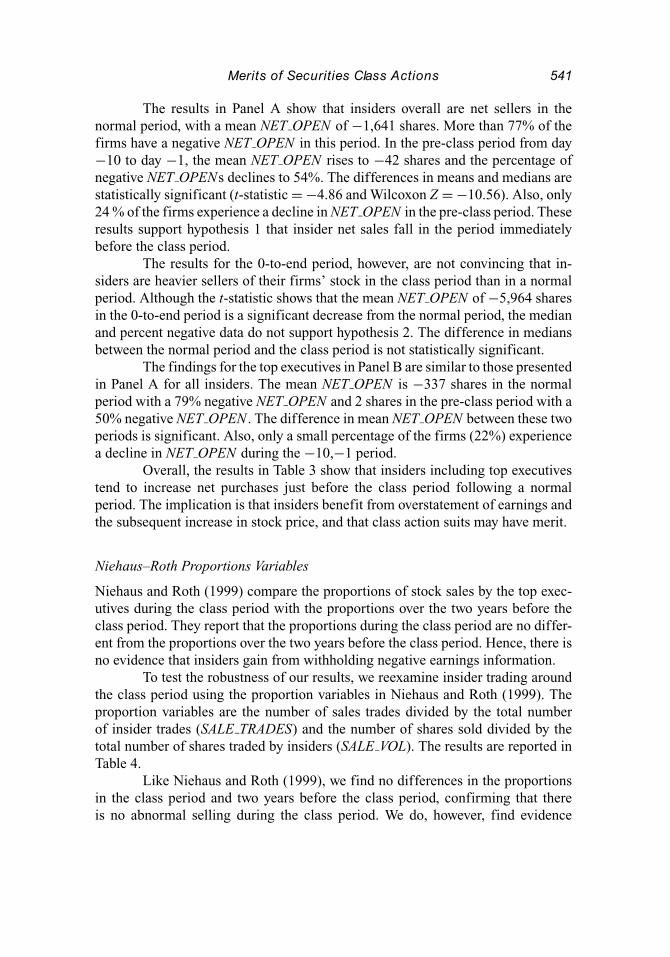
The results in Panel A show that insiders overall are net sellers in thenormal period, with a mean NET OPEN of −1,641 shares. More than 77% of thefirms have a negative NET OPEN in this period. In the pre-class period from day−10 to day −1, the mean NET OPEN rises to −42 shares and the percentage ofnegative NET OPENs declines to 54%. The differences in means and medians arestatistically significant (t-statistic = −4.86 and Wilcoxon Z = −10.56). Also, only24 % of the firms experience a decline in NET OPEN in the pre-class period. Theseresults support hypothesis 1 that insider net sales fall in the period immediatelybefore the class period.
The results for the 0-to-end period, however, are not convincing that in-siders are heavier sellers of their firms’ stock in the class period than in a normalperiod. Although the t-statistic shows that the mean NET OPEN of −5,964 sharesin the 0-to-end period is a significant decrease from the normal period, the medianand percent negative data do not support hypothesis 2. The difference in mediansbetween the normal period and the class period is not statistically significant.
The findings for the top executives in Panel B are similar to those presentedin Panel A for all insiders. The mean NET OPEN is −337 shares in the normalperiod with a 79% negative NET OPEN and 2 shares in the pre-class period with a50% negative NET OPEN . The difference in mean NET OPEN between these twoperiods is significant. Also, only a small percentage of the firms (22%) experiencea decline in NET OPEN during the −10,−1 period.
Overall, the results in Table 3 show that insiders including top executivestend to increase net purchases just before the class period following a normalperiod. The implication is that insiders benefit from overstatement of earnings andthe subsequent increase in stock price, and that class action suits may have merit.
Niehaus–Roth Proportions Variables
Niehaus and Roth (1999) compare the proportions of stock sales by the top exec-utives during the class period with the proportions over the two years before theclass period. They report that the proportions during the class period are no differ-ent from the proportions over the two years before the class period. Hence, there isno evidence that insiders gain from withholding negative earnings information.
To test the robustness of our results, we reexamine insider trading aroundthe class period using the proportion variables in Niehaus and Roth (1999). Theproportion variables are the number of sales trades divided by the total numberof insider trades (SALE TRADES) and the number of shares sold divided by thetotal number of shares traded by insiders (SALE VOL). The results are reported inTable 4.
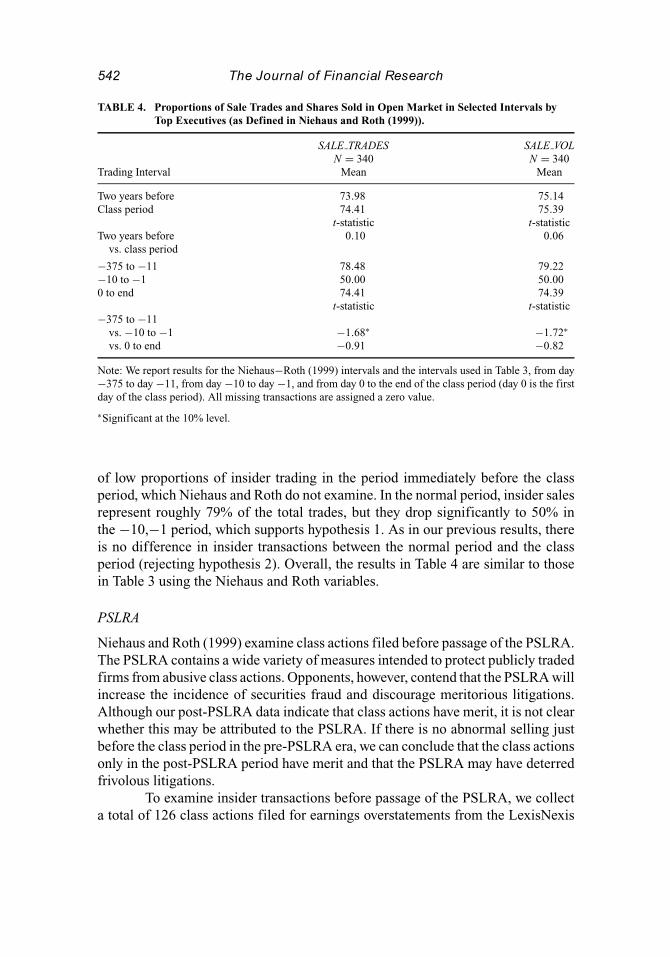
Like Niehaus and Roth (1999), we find no differences in the proportionsin the class period and two years before the class period, confirming that thereis no abnormal selling during the class period. We do, however, find evidence
542 The Journal of Financial Research
TABLE 4. Proportions of Sale Trades and Shares Sold in Open Market in Selected Intervals byTop Executives (as Defined in Niehaus and Roth (1999)).
SALE TRADES SALE VOLN = 340 N = 340
Trading Interval Mean Mean
Two years before 73.98 75.14Class period 74.41 75.39
t-statistic t-statisticTwo years before 0.10 0.06
vs. class period
−375 to −11 78.48 79.22−10 to −1 50.00 50.000 to end 74.41 74.39
t-statistic t-statistic−375 to −11
vs. −10 to −1 −1.68∗ −1.72∗
vs. 0 to end −0.91 −0.82
Note: We report results for the Niehaus−Roth (1999) intervals and the intervals used in Table 3, from day−375 to day −11, from day −10 to day −1, and from day 0 to the end of the class period (day 0 is the firstday of the class period). All missing transactions are assigned a zero value.
∗Significant at the 10% level.
of low proportions of insider trading in the period immediately before the classperiod, which Niehaus and Roth do not examine. In the normal period, insider salesrepresent roughly 79% of the total trades, but they drop significantly to 50% inthe −10,−1 period, which supports hypothesis 1. As in our previous results, thereis no difference in insider transactions between the normal period and the classperiod (rejecting hypothesis 2). Overall, the results in Table 4 are similar to thosein Table 3 using the Niehaus and Roth variables.
PSLRA
Niehaus and Roth (1999) examine class actions filed before passage of the PSLRA.The PSLRA contains a wide variety of measures intended to protect publicly tradedfirms from abusive class actions. Opponents, however, contend that the PSLRA willincrease the incidence of securities fraud and discourage meritorious litigations.Although our post-PSLRA data indicate that class actions have merit, it is not clearwhether this may be attributed to the PSLRA. If there is no abnormal selling justbefore the class period in the pre-PSLRA era, we can conclude that the class actionsonly in the post-PSLRA period have merit and that the PSLRA may have deterredfrivolous litigations.
To examine insider transactions before passage of the PSLRA, we collecta total of 126 class actions filed for earnings overstatements from the LexisNexis

Merits of Securities Class Actions 543
TABLE 5. Net Open Market Purchases (NET OPEN) for Selected Intervals Before Enactment ofthe PSLRA.
Panel A. All Insiders Panel B. Top Executives
Trading Interval Mean Median Mean Median(Days) (N = 25) (N = 25) % Neg (N) (N = 25) (N = 25) % Neg (N)
−375 to −11 −916.67 −68.84 90.00 (20) −113.31 0.00 72.73 (11)−10 to −1 −189.80 0.00 83.33 (6) −11.00 0.00 50.00 (2)0 to end 1,234.25 −208.77 86.97 (23) −295.27 0.00 84.62 (13)
t-statistic Wilcoxon Z % Decline (N) t-statistic Wilcoxon Z % Decline (N)
−375 to −11vs. −10 to −1 −2.00∗∗ −2.78∗∗ 25.00 (20) −1.92∗ −1.52 33.33 (12)vs. 0 to end −0.92 0.87 60.00 (25) 1.64 1.12 66.67 (18)
Note: The intervals are: a normal trading period from day −375 to day −11, a pre-class period from day−10 to day −1, and the class period from day 0 to the last day of the class period. Day 0 is the first day ofthe class action period. In computing mean and median, a missing transaction is assigned a zero value. Incomputing % Neg, the number of firms with a negative NET OPEN transaction over an interval is dividedby the total number of firms with an open market transaction during that interval. In computing % Negand % Decline, N is the number of firms with an open market transaction during the interval. The findingsare reported for all insiders (Panel A) and top executives (Panel B). PSLRA = Private Securities LitigationReform Act.
∗∗Significant at the 5% level.∗Significant at the 10% level.
database during 1990–1994. Information on 63 firms is not available on the CDAInvestnet database, and class period dates on 38 more are not reported on theLexisNexis database. The results for the final sample of 25 firms are presented inTable 5.
As in the post-PSLRA period, we observe a significant decline in insidersales immediately before the class period. For both the sample of all insiders andthe sample of top executives, NET OPEN increases during the −10,−1 period overthe normal period. These findings suggest that the pre-PSLRA class actions had asmuch merit as suits following passage of the PSLRA.
Regressions of Net Purchases on Stock Returns
The results so far indicate that insiders increase their net purchases (i.e., decreasetheir stock sales) just before positive stock returns around the beginning of the classperiod. If net purchases are increased in anticipation of higher stock returns, onewould expect a positive relation between NET OPEN in the −10,−1 period andabnormal stock returns around the beginning of the class period. To see if theseinsider transactions are indeed related to the stock returns, we perform a regressionof abnormal net purchases during the −10,−1 period on the abnormal stock returnson day −1 and day 0. For each firm, abnormal net purchases during the −10,−1
544 The Journal of Financial Research
TABLE 6. Regressions of Abnormal Net Purchases on Abnormal Stock Returns.
Dependent VariableNET OPEN−375,−11 − NET OPEN−10,−1
All Insiders Top Executives
Independent Variable Parameter t-statistic Parameter t-statistic
Abnormal return on day −1 α 1.742 3.90∗∗∗ 0.403 2.13∗∗
β 0.212 1.42 2.622 4.39∗∗∗
N 257 183R2 0.008 0.096
Abnormal return on day 0 α 1.772 4.38∗∗∗ −0.168 −3.61∗∗∗
β −0.002 −0.02 −0.020 −1.13N 291 210R2 0.000 0.006
Note: The dependent variable is abnormal net purchases (in thousands of shares) computed as meanNET OPEN during the −10,−1 period minus mean NET OPEN during the −375,−11 period. Day 0 isthe first day of class period. The dependent variable is regressed on abnormal stock returns on day −1 andday 0. The findings are reported for all insiders and top executives. The sample sizes are smaller becauseof missing data.
∗∗∗Significant at the 1% level.∗∗Significant at the 5% level.
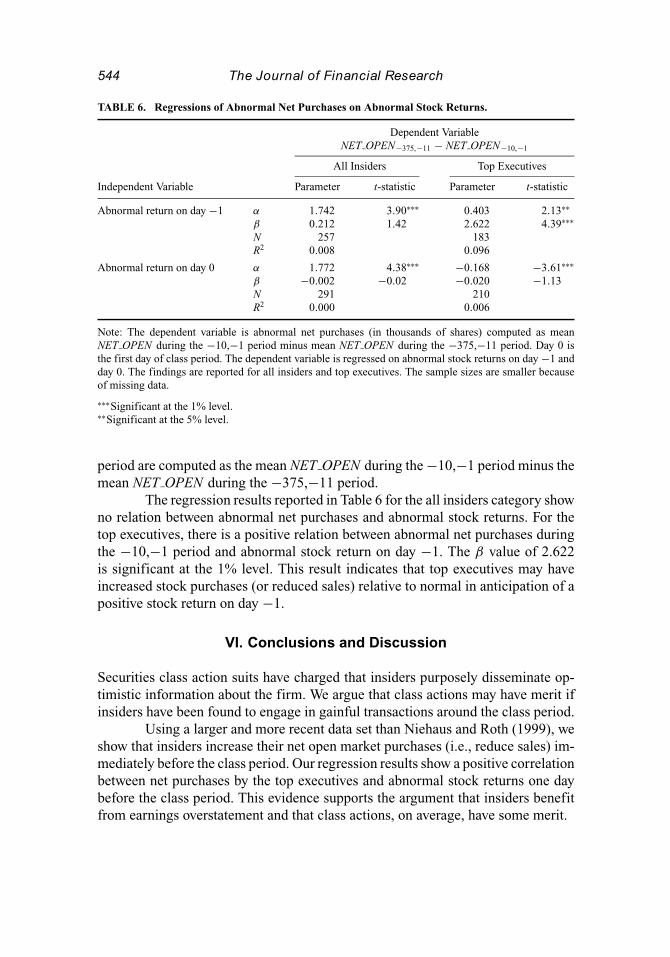
period are computed as the mean NET OPEN during the −10,−1 period minus themean NET OPEN during the −375,−11 period.
The regression results reported in Table 6 for the all insiders category showno relation between abnormal net purchases and abnormal stock returns. For thetop executives, there is a positive relation between abnormal net purchases duringthe −10,−1 period and abnormal stock return on day −1. The β value of 2.622is significant at the 1% level. This result indicates that top executives may haveincreased stock purchases (or reduced sales) relative to normal in anticipation of apositive stock return on day −1.
VI. Conclusions and Discussion
Securities class action suits have charged that insiders purposely disseminate op-timistic information about the firm. We argue that class actions may have merit ifinsiders have been found to engage in gainful transactions around the class period.
Using a larger and more recent data set than Niehaus and Roth (1999), weshow that insiders increase their net open market purchases (i.e., reduce sales) im-mediately before the class period. Our regression results show a positive correlationbetween net purchases by the top executives and abnormal stock returns one daybefore the class period. This evidence supports the argument that insiders benefitfrom earnings overstatement and that class actions, on average, have some merit.
Merits of Securities Class Actions 545
Our data during the class period, however, show that insider sales are notsignificantly different from normal sales. This result is consistent with the findingsin Niehaus and Roth (1999) that insiders do not sell their shares in abnormal amountsduring the class period.
An implication of our findings relates to the ethical reasoning and behaviorthat can lead to gainful insider trading during financial fraud. Sorenson, Grove,and Selto (1983) note that insiders who commit a fraud would profit from stocktransactions because of the fraud. Ponemon (1993) observes that an individualwho is willing to engage in fraud would not be particularly ethical and wouldbe unlikely to refrain from illegal insider transactions. An experimental study byAbdolmohammadi and Sultan (2002) indicates that managers with solid ethicalreasoning are less likely to act on insider information in stock trading. Insiders whouse private information for personal gains have weak ethical values and are likelyto exhibit poor ethics in other areas of decision making.
Like Beneish (1999), we suggest that the trading behavior of corporateexecutives may influence the likelihood of shareholder litigation. Misstatement offinancial data together with unusual levels of insider transactions could trigger classactions. The judicial system can use insider trading as an indicator to assess themerits of class action litigations, shedding some light on the traditional debate:plaintiffs’ attorneys’ claim that only lawsuits with merit are filed versus critics’claim that lawsuits are filed simply because earnings dropped.
References
Abdolmohammadi, M. and J. Sultan, 2002, Ethical reasoning and the use of insider information in stocktrading, Journal of Business Ethics 37, 165–73.
Beneish, M. D., 1999, Incentives and penalties related to earnings overstatements that violate GAAP, TheAccounting Review 74, 425–57.
Bhagat, S., J. Bizjak, and J. L. Coles, 1998, The shareholder wealth implications of corporate lawsuits,Financial Management 27, 5–27.
John, K. and L. H. P. Lang, 1991, Strategic insider trading around dividend announcements: Theory andevidence, Journal of Finance 46, 1361–89.
Lee, D. S., W. H. Mikkelson, and M. M. Partch, 1992, Managers’ trading around stock repurchases, Journalof Finance 47, 1947–61.
Niehaus, G. and G. Roth, 1999, Insider trading, equity issues, and CEO turnover in firms subject to securitiesclass action, Financial Management 28, 52–72.
Ponemon, L. A., 1993, The influence of ethical reasoning on auditors’ perceptions of management’s integrityand competence, Advances in Accounting 11, 1–29.
Seyhun, H. N., 1988, The information content of aggregate insider trading, Journal of Business 61, 1–24.Sorenson, J. E., H. D. Grove, and F. H. Selto, 1983, Detecting management fraud: An empirical approach,
Symposium on Auditing Research 5, 73–116.Summers, S. L. and J. T. Sweeney, 1998, Fraudulently misstated financial statements and insider trading:
An empirical analysis, The Accounting Review 73, 131–46.Warner, J. B., R. L. Watts, and K. H. Wruck, 1988, Stock prices and top management changes, Journal of
Financial Economics 20, 461–92.


![SECURITIES AND EXCHANGE BOARD OF INDIA · SECURITIES AND EXCHANGE BOARD OF INDIA (1 [PROHIBITION OF] INSIDER TRADING) REGULATIONS, 1992 In exercise of the powers conferred by section](https://static.fdocuments.net/doc/165x107/5e6e609a09022f3aea355609/securities-and-exchange-board-of-securities-and-exchange-board-of-india-1-prohibition.jpg)


