FungiQuant: A broad-coverage fungal quantitative real-time PCR
11
METHODOLOGY ARTICLE Open Access FungiQuant: A broad-coverage fungal quantitative real-time PCR assay Cindy M Liu 1,2,6* , Sergey Kachur 1,2,6,7 , Michael G Dwan 1,2 , Alison G Abraham 3 , Maliha Aziz 1 , Po-Ren Hsueh 4 , Yu-Tsung Huang 5 , Joseph D Busch 2 , Louis J Lamit 6 , Catherine A Gehring 6 , Paul Keim 1,2,6 and Lance B Price 1 Abstract Background: Fungal load quantification is a critical component of fungal community analyses. Limitation of current approaches for quantifying the fungal component in the human microbiome suggests the need for new broad-coverage techniques. Methods: We analyzed 2,085 18S rRNA gene sequences from the SILVA database for assay design. We generated and quantified plasmid standards using a qPCR-based approach. We evaluated assay coverage against 4,968 sequences and performed assay validation following the Minimum Information for Publication of Quantitative Real-Time PCR Experiments (MIQE) guidelines. Results: We designed FungiQuant, a TaqMan W qPCR assay targeting a 351 bp region in the fungal 18S rRNA gene. Our in silico analysis showed that FungiQuant is a perfect sequence match to 90.0% of the 2,617 fungal species analyzed. We showed that FungiQuant’s is 100% sensitive and its amplification efficiencies ranged from 76.3% to 114.5%, with r 2 -values of >0.99 against the 69 fungal species tested. Additionally, FungiQuant inter- and intra-run coefficients of variance ranged from <10% and <20%, respectively. We further showed that FungiQuant has a limit of quantification 25 copies and a limit of detection at 5 copies. Lastly, by comparing results from human-only background DNA with low-level fungal DNA, we showed that amplification in two or three of a FungiQuant performed in triplicate is statistically significant for true positive fungal detection. Conclusions: FungiQuant has comprehensive coverage against diverse fungi and is a robust quantification and detection tool for delineating between true fungal detection and non-target human DNA. Background Fungi are among the most diverse eukaryotic organisms on Earth, with nearly 10,000 named fungal species and an estimated 1.5 to 5 million species that are yet to be defined [1,2]. Fungi are also recognized as an important element in human microbiome research, clinical medicine, and as emerging pathogens [3-8]. However, methodological chal- lenges have limited scientists’ and clinicians’ ability to detect and measure fungal abundance. Currently, fungal detection is performed through cultur- ing [9], serological detection of antigens, such galactoman- nan in invasive aspergillosis [10,11], and molecular test panels [12]. Yet, these methods lack broad-coverage and are not quantitative [4,13]. Next-generation sequencing is an effective approach for detecting and characterizing fungi, but it is expensive, requires complex analyses, and is not quantitative [14,15]. Measurements of fungal abundance are now typically performed using biochemical methods targeting ergosterol, chitin, and fatty acid profiles [16-18], which often require extraction methods that exclude further molecular analyses and can lack coverage against major fungal lineages [19]. Alternative approaches such as microscopy [20] and quanti- tative culture [21,22] are also time-consuming, operator- dependent, and lack broad-coverage. To address these limitations, a quantitative molecular tool that is broad-coverage, sensitive, and specific is needed [23,24]. Together with qualitative characterization of fungi, such a tool will provide a comprehensive view of the fungal microbiota. Additionally, this broad-coverage * Correspondence: [email protected] 1 Division of Pathogen Genomics, Translational Genomics Research Institute, Flagstaff, AZ 86011, USA 2 Center for Microbial Genetics and Genomics, Northern Arizona University, Flagstaff, AZ 86011, USA Full list of author information is available at the end of the article © 2012 Liu et al.; licensee BioMed Central Ltd. This is an Open Access article distributed under the terms of the Creative Commons Attribution License (http://creativecommons.org/licenses/by/2.0), which permits unrestricted use, distribution, and reproduction in any medium, provided the original work is properly cited. Liu et al. BMC Microbiology 2012, 12:255 http://www.biomedcentral.com/1471-2180/12/255
Transcript of FungiQuant: A broad-coverage fungal quantitative real-time PCR
Liu et al. BMC Microbiology 2012, 12:255http://www.biomedcentral.com/1471-2180/12/255
METHODOLOGY ARTICLE Open Access
FungiQuant: A broad-coverage fungalquantitative real-time PCR assayCindy M Liu1,2,6*, Sergey Kachur1,2,6,7, Michael G Dwan1,2, Alison G Abraham3, Maliha Aziz1, Po-Ren Hsueh4,Yu-Tsung Huang5, Joseph D Busch2, Louis J Lamit6, Catherine A Gehring6, Paul Keim1,2,6 and Lance B Price1
Abstract
Background: Fungal load quantification is a critical component of fungal community analyses. Limitation of currentapproaches for quantifying the fungal component in the human microbiome suggests the need for newbroad-coverage techniques.
Methods: We analyzed 2,085 18S rRNA gene sequences from the SILVA database for assay design. We generatedand quantified plasmid standards using a qPCR-based approach. We evaluated assay coverage against 4,968sequences and performed assay validation following the Minimum Information for Publication of QuantitativeReal-Time PCR Experiments (MIQE) guidelines.
Results: We designed FungiQuant, a TaqManW qPCR assay targeting a 351 bp region in the fungal 18S rRNA gene.Our in silico analysis showed that FungiQuant is a perfect sequence match to 90.0% of the 2,617 fungal speciesanalyzed. We showed that FungiQuant’s is 100% sensitive and its amplification efficiencies ranged from 76.3% to114.5%, with r2-values of >0.99 against the 69 fungal species tested. Additionally, FungiQuant inter- and intra-runcoefficients of variance ranged from <10% and <20%, respectively. We further showed that FungiQuant has a limitof quantification 25 copies and a limit of detection at 5 copies. Lastly, by comparing results from human-onlybackground DNA with low-level fungal DNA, we showed that amplification in two or three of a FungiQuantperformed in triplicate is statistically significant for true positive fungal detection.
Conclusions: FungiQuant has comprehensive coverage against diverse fungi and is a robust quantification anddetection tool for delineating between true fungal detection and non-target human DNA.
BackgroundFungi are among the most diverse eukaryotic organismson Earth, with nearly 10,000 named fungal species and anestimated 1.5 to 5 million species that are yet to be defined[1,2]. Fungi are also recognized as an important elementin human microbiome research, clinical medicine, and asemerging pathogens [3-8]. However, methodological chal-lenges have limited scientists’ and clinicians’ ability todetect and measure fungal abundance.Currently, fungal detection is performed through cultur-
ing [9], serological detection of antigens, such galactoman-nan in invasive aspergillosis [10,11], and molecular test
* Correspondence: [email protected] of Pathogen Genomics, Translational Genomics Research Institute,Flagstaff, AZ 86011, USA2Center for Microbial Genetics and Genomics, Northern Arizona University,Flagstaff, AZ 86011, USAFull list of author information is available at the end of the article
© 2012 Liu et al.; licensee BioMed Central Ltd.Commons Attribution License (http://creativecreproduction in any medium, provided the or
panels [12]. Yet, these methods lack broad-coverage andare not quantitative [4,13]. Next-generation sequencing isan effective approach for detecting and characterizingfungi, but it is expensive, requires complex analyses, and isnot quantitative [14,15].Measurements of fungal abundance are now typically
performed using biochemical methods targeting ergosterol,chitin, and fatty acid profiles [16-18], which often requireextraction methods that exclude further molecular analysesand can lack coverage against major fungal lineages [19].Alternative approaches such as microscopy [20] and quanti-tative culture [21,22] are also time-consuming, operator-dependent, and lack broad-coverage.To address these limitations, a quantitative molecular
tool that is broad-coverage, sensitive, and specific isneeded [23,24]. Together with qualitative characterizationof fungi, such a tool will provide a comprehensive view ofthe fungal microbiota. Additionally, this broad-coverage
This is an Open Access article distributed under the terms of the Creativeommons.org/licenses/by/2.0), which permits unrestricted use, distribution, andiginal work is properly cited.
Liu et al. BMC Microbiology 2012, 12:255 Page 2 of 11http://www.biomedcentral.com/1471-2180/12/255
fungal quantification tool can be used independently tomeasure fungal abundance changes over time, in responseto treatment, or among multiple study groups.Quantitative real-time PCR (qPCR) has been shown to
be more sensitive than culture-based approaches againsta wide range of fungal species [25]. Much progress hasbeen made in developing qPCR assays that can detectdiverse fungal species [26-30], but we sought to developa qPCR assay that would approach universal fungalcoverage. In the current manuscript, we present ourdesign of a broad-coverage qPCR assay—FungiQuant—for fungal detection and quantification targeting the fun-gal 18S rRNA gene. We performed both in silico analysisbased on primer and probe sequence matches to refer-ence fungal 18S rRNA gene sequences and laboratoryvalidation following the Minimum Information for Pub-lication of Quantitative Real-Time PCR Experiments(MIQE) guidelines [31]. Lastly, we established guidelinesfor quantification and detection analysis based resultsfrom triplicate reactions using FungiQuant.
MethodsDesign of fungal 18S rRNA gene quantitative real-timePCR (qPCR) assayWe downloaded fungal 18S rRNA gene sequences alignmentscores and sequence quality scores of >90 and have a lengthof 1400 bp or longer from SILVA Release 93 (n = 2,085)[32]. We summarized the aligned sequences the occurrenceof each allele at each nucleotide position. Alignment posi-tions with a gap content of >97% were excluded.We identified a highly conserved 500 bp region for
qPCR assay design. In our assay design, we stipulatedthat: 1) primers can only have three or fewer degeneratebases and 2) the probe contains no degenerate bases.Using the allele occurrence analysis file, we incorporatedkey degenerate bases into each primer and designed anon-degenerate probe. The primer Tm was calculatedusing OligoCalc [33] and the probe Tm was calculatedusing the Primer Probe Test Tool from the PrimerExpressW Software for Real-Time PCR version 3.0 (AppliedBiosystems by Life Technologies, Carlsbad, CA, USA)(Table 1).
Computational analysis of assay specificity and coverage
A Specificity analysis. We assessed assay specificityusing megablast against human and bacterial
Table 1 FungiQuant primer and probe sequences
FungiQuant (351 bp)
FungiQuant-F 50-GGRAAACTCACCAGGTCCAG-30
FungiQuant-R 50-GSWCTATCCCCAKCACGA-30
FungiQuant-Prb (6FAM) 50-TGGTGCATGGCCGTT-30 (MGBN
sequences from the Genbank nucleotide collection(nr/nt) [34].
B Collection of 18S rRNA gene sequence for in silicocoverage analysis. From SILVA Release 108, wedownloaded the sequences, sequence ID, andGenbank accession numbers of all fungal 18S rRNAgene sequences with sequence quality score of >90and are 1,400 bp or longer [32]. We extracted the fullGenbank taxonomy for each sequence, which weconcatenated (e.g., at order-level, a taxonomicidentification consists of phylum-subphylum-class-order). We replaced empty data fields in theconcatenated taxonomy with “unknown”, whenapplicable.
COverview of in silico assay coverage analysis. Weperformed the in silico coverage analysis using astringent and a relaxed criterion, where the stringentcriterion requires full perfect match of both primersand the relaxed criterion requires perfect match ofthe last eight nucleotides at the 3’ end of the primers.Both conditions require full perfect match of theprobe sequence. For each condition, we determinedthe assay’s numerical and taxonomic coverage at thephylum, sub-phylum, class, order, family, genus, andspecies levels. Details for the in silico coverageanalysis can be found in the Additional file 1:Methodological Details.
Quantification and normalization of FungiQuant plasmidstandardsWe utilized a qPCR-based approach to quantify andnormalize the FungiQuant plasmid standards, a C. albicans18S rRNA gene clone, to a Cp-value equivalent to109 copies/μl. Details for FungiQuant plasmid normalizationcan be found in the Additional file 1: MethodologicalDetails.
FungiQuant optimization and specificity checkAfter testing multiple primer and probe concentrations,the optimized conditions included 10 μl and 5 μl of reac-tion volumes using 1 μl of template, with the final reac-tion containing 1.8 μM of each forward and reverseprimer, 225 nM the TaqManW probe, 1% formamide, 1XPlatinumW Quantitative PCR SuperMix-UDG w⁄ROX(Invitrogen Corp.) and molecular-grade water. We included
Tm (°C) S. cerevisiae region
60.5-62.5 1199-1218
56.3-58.4 1269-1283
FQ) 68.0 1532-1549
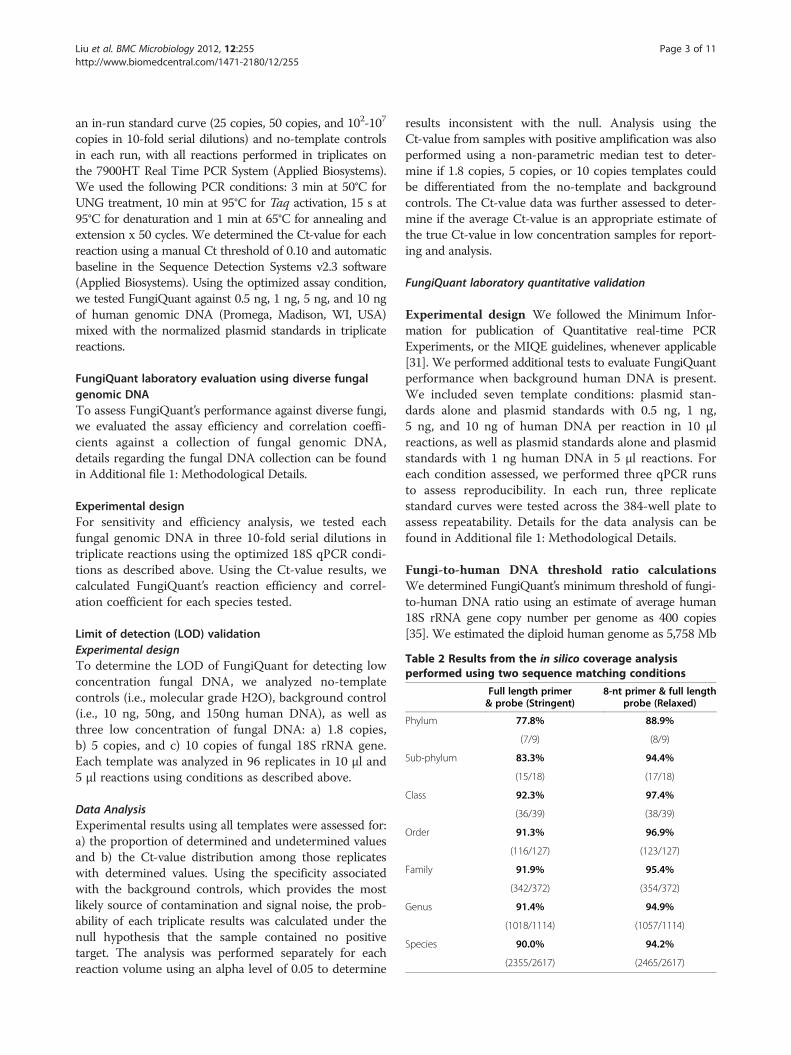
Table 2 Results from the in silico coverage analysisperformed using two sequence matching conditions
Full length primer& probe (Stringent)
8-nt primer & full lengthprobe (Relaxed)
Phylum 77.8% 88.9%
(7/9) (8/9)
Sub-phylum 83.3% 94.4%
(15/18) (17/18)
Class 92.3% 97.4%
(36/39) (38/39)
Order 91.3% 96.9%
(116/127) (123/127)
Family 91.9% 95.4%
(342/372) (354/372)
Genus 91.4% 94.9%
(1018/1114) (1057/1114)
Species 90.0% 94.2%
(2355/2617) (2465/2617)
Liu et al. BMC Microbiology 2012, 12:255 Page 3 of 11http://www.biomedcentral.com/1471-2180/12/255
an in-run standard curve (25 copies, 50 copies, and 102-107
copies in 10-fold serial dilutions) and no-template controlsin each run, with all reactions performed in triplicates onthe 7900HT Real Time PCR System (Applied Biosystems).We used the following PCR conditions: 3 min at 50°C forUNG treatment, 10 min at 95°C for Taq activation, 15 s at95°C for denaturation and 1 min at 65°C for annealing andextension x 50 cycles. We determined the Ct-value for eachreaction using a manual Ct threshold of 0.10 and automaticbaseline in the Sequence Detection Systems v2.3 software(Applied Biosystems). Using the optimized assay condition,we tested FungiQuant against 0.5 ng, 1 ng, 5 ng, and 10 ngof human genomic DNA (Promega, Madison, WI, USA)mixed with the normalized plasmid standards in triplicatereactions.
FungiQuant laboratory evaluation using diverse fungalgenomic DNATo assess FungiQuant’s performance against diverse fungi,we evaluated the assay efficiency and correlation coeffi-cients against a collection of fungal genomic DNA,details regarding the fungal DNA collection can be foundin Additional file 1: Methodological Details.
Experimental designFor sensitivity and efficiency analysis, we tested eachfungal genomic DNA in three 10-fold serial dilutions intriplicate reactions using the optimized 18S qPCR condi-tions as described above. Using the Ct-value results, wecalculated FungiQuant’s reaction efficiency and correl-ation coefficient for each species tested.
Limit of detection (LOD) validationExperimental designTo determine the LOD of FungiQuant for detecting lowconcentration fungal DNA, we analyzed no-templatecontrols (i.e., molecular grade H2O), background control(i.e., 10 ng, 50ng, and 150ng human DNA), as well asthree low concentration of fungal DNA: a) 1.8 copies,b) 5 copies, and c) 10 copies of fungal 18S rRNA gene.Each template was analyzed in 96 replicates in 10 μl and5 μl reactions using conditions as described above.
Data AnalysisExperimental results using all templates were assessed for:a) the proportion of determined and undetermined valuesand b) the Ct-value distribution among those replicateswith determined values. Using the specificity associatedwith the background controls, which provides the mostlikely source of contamination and signal noise, the prob-ability of each triplicate results was calculated under thenull hypothesis that the sample contained no positivetarget. The analysis was performed separately for eachreaction volume using an alpha level of 0.05 to determine
results inconsistent with the null. Analysis using theCt-value from samples with positive amplification was alsoperformed using a non-parametric median test to deter-mine if 1.8 copies, 5 copies, or 10 copies templates couldbe differentiated from the no-template and backgroundcontrols. The Ct-value data was further assessed to deter-mine if the average Ct-value is an appropriate estimate ofthe true Ct-value in low concentration samples for report-ing and analysis.
FungiQuant laboratory quantitative validation
Experimental design We followed the Minimum Infor-mation for publication of Quantitative real-time PCRExperiments, or the MIQE guidelines, whenever applicable[31]. We performed additional tests to evaluate FungiQuantperformance when background human DNA is present.We included seven template conditions: plasmid stan-dards alone and plasmid standards with 0.5 ng, 1 ng,5 ng, and 10 ng of human DNA per reaction in 10 μlreactions, as well as plasmid standards alone and plasmidstandards with 1 ng human DNA in 5 μl reactions. Foreach condition assessed, we performed three qPCR runsto assess reproducibility. In each run, three replicatestandard curves were tested across the 384-well plate toassess repeatability. Details for the data analysis can befound in Additional file 1: Methodological Details.
Fungi-to-human DNA threshold ratio calculationsWe determined FungiQuant’s minimum threshold of fungi-to-human DNA ratio using an estimate of average human18S rRNA gene copy number per genome as 400 copies[35]. We estimated the diploid human genome as 5,758 Mb
Liu et al. BMC Microbiology 2012, 12:255 Page 4 of 11http://www.biomedcentral.com/1471-2180/12/255
[36] or the mass equivalent of 5,758Mb/(0.978x103 Mb/pg)= 5.887 pg per diploid human genome [37].
ResultsFungiQuant assay designWe identified three highly conserved regions based onanalysis results of a high-quality 18S rRNA gene multiplesequence alignments. Within these conserved regions, wedesigned two degenerate primers and a non-degenerateTaqManW minor-groove binding probe (Table 1). We
Ph
ylu
m C
hyt
rid
iom
yco
ta84
.62%
(11
/13)
Phyl
um N
eoca
llim
astig
omyc
ota
N/A
Phylum Blastocladiomycota
100% (2/2)
insertae sedis: Sub-phylum Kickxellomycotina
87.50% (7/8)
insertae sedis: Sub-phylum Zoopagomycotina
N/A
insertae sedis: Sub-phylum Entom
ophthoromycotina
100% (2/2)
insertae sedis: Sub-phylum
Mucorom
ycotina
67.64% (23/34) lu
m M
icrosp
orid
ia0%
(0/1)
B1B9
Figure 1 FungiQuant in silico coverage analysis using the relaxed critcoverage. On the 18S rRNA gene-based phylogeny, each analyzed fungalon the relaxed criterion. This is presented as a numerator (i.e., the numbergenera eligible for sequence matching for the phylum), and the percentag
positioned the probe on the reverse strand, proximal tothe forward primer to create favorable thermodynamicprofile and maximize assay specificity (Additional file 1:Table S1).
in silico analysis of FungiQuant assay coverage using 18SrRNA gene sequences from 18 fungal subphylaWe performed in silico coverage analysis using a strin-gent and a relaxed criterion against 4,968 18S rRNAgene sequences, encompassing 18 fungal subphyla.
Basidiomycota: Sub-phylum Ustilaginomycotina
100% (13/13)
Basidiomycota: Sub-phylum Pucciniomycotina98.28% (57/58)
Ascomycota: Sub-phylum Taphrinomycotina
100% (3/3)
Asc
omyc
ota:
Sub
-phy
lum
Pez
izom
ycot
ina
94.8
5% (4
97/5
24)
Ascomycota: Sub-phylum Saccharomycotin
a
96.67% (29/30)
Ph
ylum
Glo
mero
myco
ta
100% (15/15)
Ph
y
0.05
Basidiomycota: Sub-phylum
Agaricom
ycotina
96.63% (315/326)
asiodiomycota: Class Dacrymycetes 00% (5/5)asidiomycota: Class Tremellomycetes 3.94% (31/33)
erion against 993 genera and 9 phyla, demonstrating broad-phylum is annotated with its genus-level FungiQuant coverage basedof covered genus for the phylum), a denominator (i.e., the number ofe of coverage.
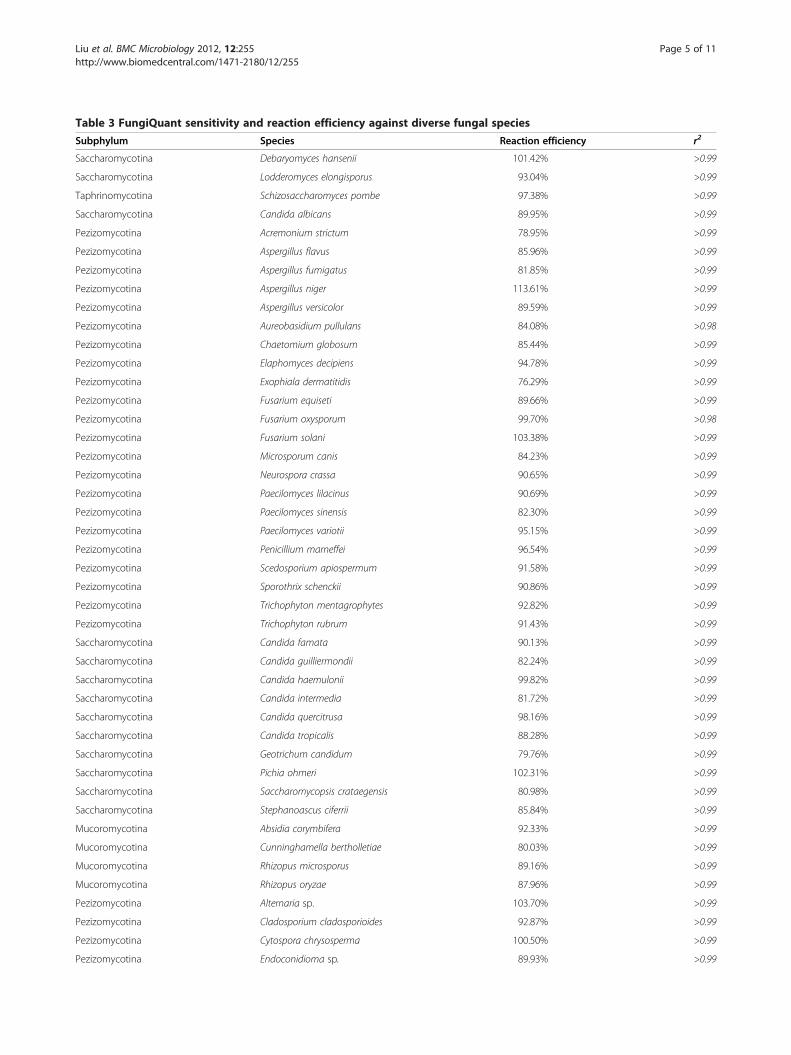
Table 3 FungiQuant sensitivity and reaction efficiency against diverse fungal species
Subphylum Species Reaction efficiency r2
Saccharomycotina Debaryomyces hansenii 101.42% >0.99
Saccharomycotina Lodderomyces elongisporus 93.04% >0.99
Taphrinomycotina Schizosaccharomyces pombe 97.38% >0.99
Saccharomycotina Candida albicans 89.95% >0.99
Pezizomycotina Acremonium strictum 78.95% >0.99
Pezizomycotina Aspergillus flavus 85.96% >0.99
Pezizomycotina Aspergillus fumigatus 81.85% >0.99
Pezizomycotina Aspergillus niger 113.61% >0.99
Pezizomycotina Aspergillus versicolor 89.59% >0.99
Pezizomycotina Aureobasidium pullulans 84.08% >0.98
Pezizomycotina Chaetomium globosum 85.44% >0.99
Pezizomycotina Elaphomyces decipiens 94.78% >0.99
Pezizomycotina Exophiala dermatitidis 76.29% >0.99
Pezizomycotina Fusarium equiseti 89.66% >0.99
Pezizomycotina Fusarium oxysporum 99.70% >0.98
Pezizomycotina Fusarium solani 103.38% >0.99
Pezizomycotina Microsporum canis 84.23% >0.99
Pezizomycotina Neurospora crassa 90.65% >0.99
Pezizomycotina Paecilomyces lilacinus 90.69% >0.99
Pezizomycotina Paecilomyces sinensis 82.30% >0.99
Pezizomycotina Paecilomyces variotii 95.15% >0.99
Pezizomycotina Penicillium marneffei 96.54% >0.99
Pezizomycotina Scedosporium apiospermum 91.58% >0.99
Pezizomycotina Sporothrix schenckii 90.86% >0.99
Pezizomycotina Trichophyton mentagrophytes 92.82% >0.99
Pezizomycotina Trichophyton rubrum 91.43% >0.99
Saccharomycotina Candida famata 90.13% >0.99
Saccharomycotina Candida guilliermondii 82.24% >0.99
Saccharomycotina Candida haemulonii 99.82% >0.99
Saccharomycotina Candida intermedia 81.72% >0.99
Saccharomycotina Candida quercitrusa 98.16% >0.99
Saccharomycotina Candida tropicalis 88.28% >0.99
Saccharomycotina Geotrichum candidum 79.76% >0.99
Saccharomycotina Pichia ohmeri 102.31% >0.99
Saccharomycotina Saccharomycopsis crataegensis 80.98% >0.99
Saccharomycotina Stephanoascus ciferrii 85.84% >0.99
Mucoromycotina Absidia corymbifera 92.33% >0.99
Mucoromycotina Cunninghamella bertholletiae 80.03% >0.99
Mucoromycotina Rhizopus microsporus 89.16% >0.99
Mucoromycotina Rhizopus oryzae 87.96% >0.99
Pezizomycotina Alternaria sp. 103.70% >0.99
Pezizomycotina Cladosporium cladosporioides 92.87% >0.99
Pezizomycotina Cytospora chrysosperma 100.50% >0.99
Pezizomycotina Endoconidioma sp. 89.93% >0.99
Liu et al. BMC Microbiology 2012, 12:255 Page 5 of 11http://www.biomedcentral.com/1471-2180/12/255
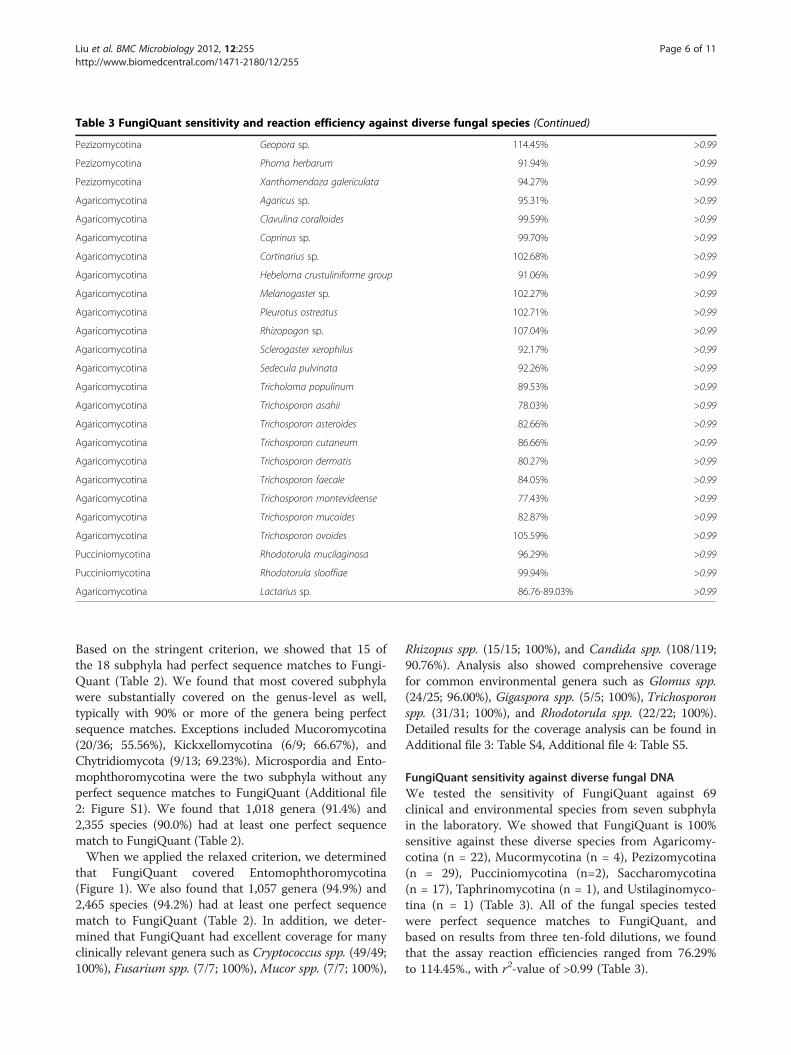
Table 3 FungiQuant sensitivity and reaction efficiency against diverse fungal species (Continued)
Pezizomycotina Geopora sp. 114.45% >0.99
Pezizomycotina Phoma herbarum 91.94% >0.99
Pezizomycotina Xanthomendoza galericulata 94.27% >0.99
Agaricomycotina Agaricus sp. 95.31% >0.99
Agaricomycotina Clavulina coralloides 99.59% >0.99
Agaricomycotina Coprinus sp. 99.70% >0.99
Agaricomycotina Cortinarius sp. 102.68% >0.99
Agaricomycotina Hebeloma crustuliniforme group 91.06% >0.99
Agaricomycotina Melanogaster sp. 102.27% >0.99
Agaricomycotina Pleurotus ostreatus 102.71% >0.99
Agaricomycotina Rhizopogon sp. 107.04% >0.99
Agaricomycotina Sclerogaster xerophilus 92.17% >0.99
Agaricomycotina Sedecula pulvinata 92.26% >0.99
Agaricomycotina Tricholoma populinum 89.53% >0.99
Agaricomycotina Trichosporon asahii 78.03% >0.99
Agaricomycotina Trichosporon asteroides 82.66% >0.99
Agaricomycotina Trichosporon cutaneum 86.66% >0.99
Agaricomycotina Trichosporon dermatis 80.27% >0.99
Agaricomycotina Trichosporon faecale 84.05% >0.99
Agaricomycotina Trichosporon montevideense 77.43% >0.99
Agaricomycotina Trichosporon mucoides 82.87% >0.99
Agaricomycotina Trichosporon ovoides 105.59% >0.99
Pucciniomycotina Rhodotorula mucilaginosa 96.29% >0.99
Pucciniomycotina Rhodotorula slooffiae 99.94% >0.99
Agaricomycotina Lactarius sp. 86.76-89.03% >0.99
Liu et al. BMC Microbiology 2012, 12:255 Page 6 of 11http://www.biomedcentral.com/1471-2180/12/255
Based on the stringent criterion, we showed that 15 ofthe 18 subphyla had perfect sequence matches to Fungi-Quant (Table 2). We found that most covered subphylawere substantially covered on the genus-level as well,typically with 90% or more of the genera being perfectsequence matches. Exceptions included Mucoromycotina(20/36; 55.56%), Kickxellomycotina (6/9; 66.67%), andChytridiomycota (9/13; 69.23%). Microspordia and Ento-mophthoromycotina were the two subphyla without anyperfect sequence matches to FungiQuant (Additional file2: Figure S1). We found that 1,018 genera (91.4%) and2,355 species (90.0%) had at least one perfect sequencematch to FungiQuant (Table 2).When we applied the relaxed criterion, we determined
that FungiQuant covered Entomophthoromycotina(Figure 1). We also found that 1,057 genera (94.9%) and2,465 species (94.2%) had at least one perfect sequencematch to FungiQuant (Table 2). In addition, we deter-mined that FungiQuant had excellent coverage for manyclinically relevant genera such as Cryptococcus spp. (49/49;100%), Fusarium spp. (7/7; 100%), Mucor spp. (7/7; 100%),
Rhizopus spp. (15/15; 100%), and Candida spp. (108/119;90.76%). Analysis also showed comprehensive coveragefor common environmental genera such as Glomus spp.(24/25; 96.00%), Gigaspora spp. (5/5; 100%), Trichosporonspp. (31/31; 100%), and Rhodotorula spp. (22/22; 100%).Detailed results for the coverage analysis can be found inAdditional file 3: Table S4, Additional file 4: Table S5.
FungiQuant sensitivity against diverse fungal DNAWe tested the sensitivity of FungiQuant against 69clinical and environmental species from seven subphylain the laboratory. We showed that FungiQuant is 100%sensitive against these diverse species from Agaricomy-cotina (n = 22), Mucormycotina (n = 4), Pezizomycotina(n = 29), Pucciniomycotina (n=2), Saccharomycotina(n = 17), Taphrinomycotina (n = 1), and Ustilaginomyco-tina (n = 1) (Table 3). All of the fungal species testedwere perfect sequence matches to FungiQuant, andbased on results from three ten-fold dilutions, we foundthat the assay reaction efficiencies ranged from 76.29%to 114.45%., with r2-value of >0.99 (Table 3).
50
0 5 10 15 20 25 30 35 40 45 50
25107 106 105 104 103 102
10 ng 1 ng 100 pg 10 pg 1 pg 100 fg 10 fg
0 5 10 15 20 25 30 35 40 45 50
A
B
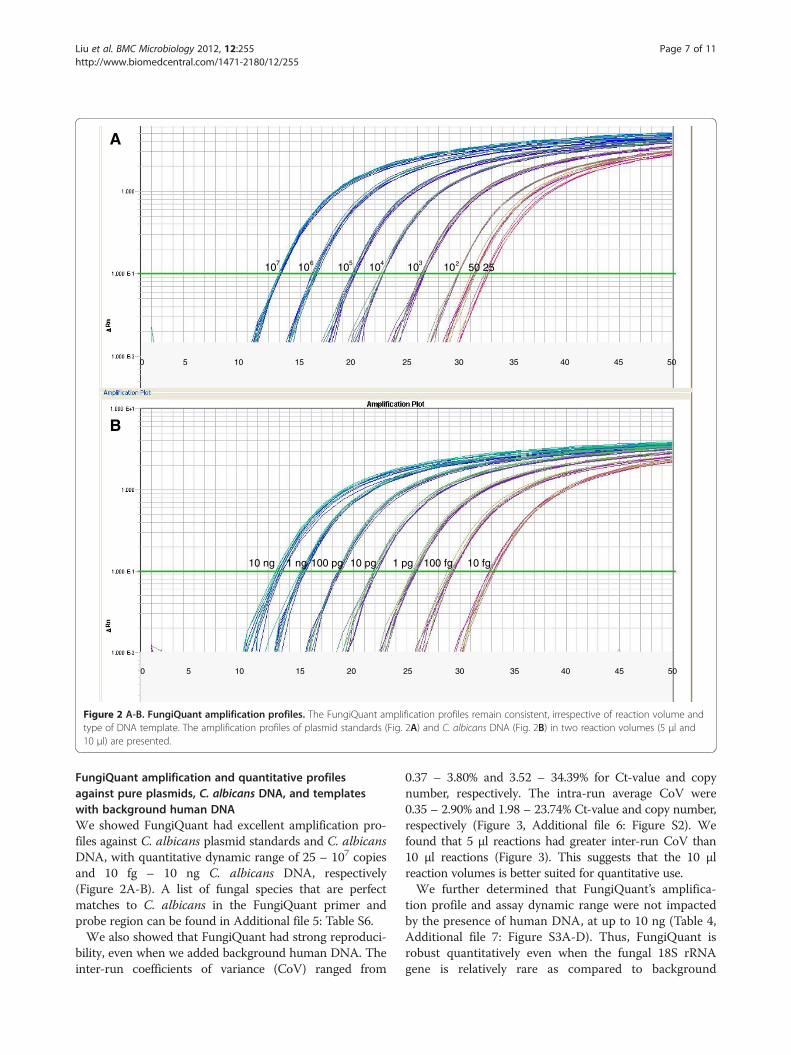
Figure 2 A-B. FungiQuant amplification profiles. The FungiQuant amplification profiles remain consistent, irrespective of reaction volume andtype of DNA template. The amplification profiles of plasmid standards (Fig. 2A) and C. albicans DNA (Fig. 2B) in two reaction volumes (5 μl and10 μl) are presented.
Liu et al. BMC Microbiology 2012, 12:255 Page 7 of 11http://www.biomedcentral.com/1471-2180/12/255
FungiQuant amplification and quantitative profilesagainst pure plasmids, C. albicans DNA, and templateswith background human DNAWe showed FungiQuant had excellent amplification pro-files against C. albicans plasmid standards and C. albicansDNA, with quantitative dynamic range of 25 – 107 copiesand 10 fg – 10 ng C. albicans DNA, respectively(Figure 2A-B). A list of fungal species that are perfectmatches to C. albicans in the FungiQuant primer andprobe region can be found in Additional file 5: Table S6.We also showed that FungiQuant had strong reproduci-
bility, even when we added background human DNA. Theinter-run coefficients of variance (CoV) ranged from
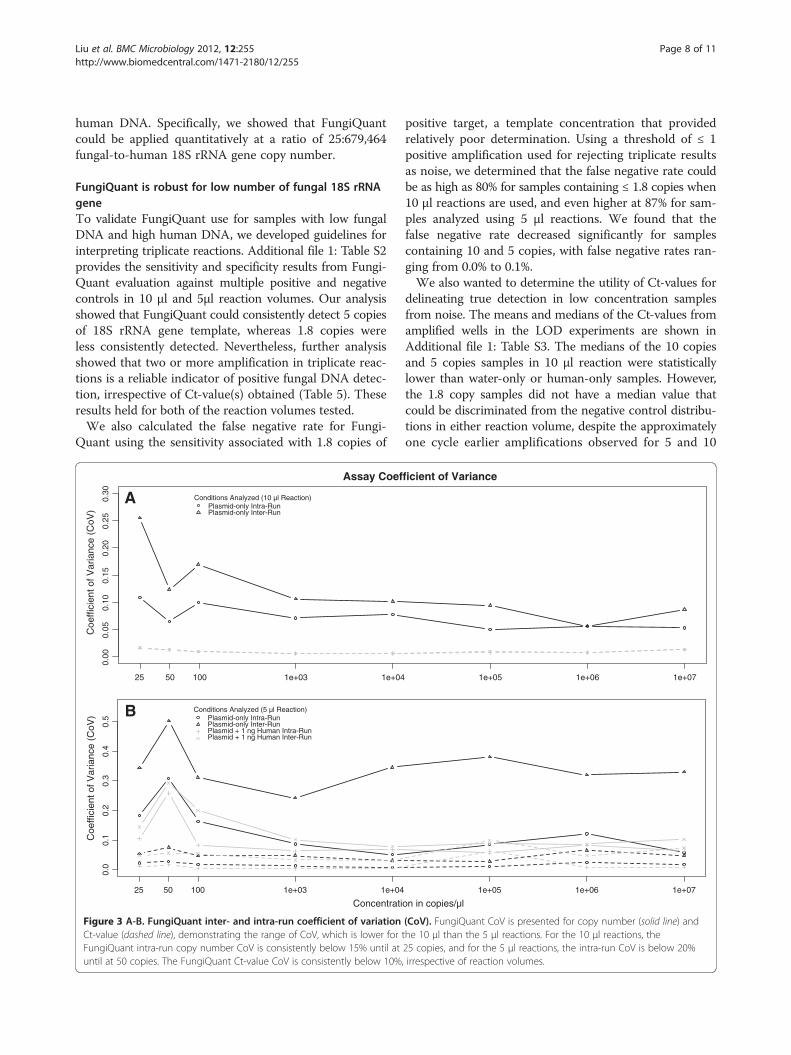
0.37 – 3.80% and 3.52 – 34.39% for Ct-value and copynumber, respectively. The intra-run average CoV were0.35 – 2.90% and 1.98 – 23.74% Ct-value and copy number,respectively (Figure 3, Additional file 6: Figure S2). Wefound that 5 μl reactions had greater inter-run CoV than10 μl reactions (Figure 3). This suggests that the 10 μlreaction volumes is better suited for quantitative use.We further determined that FungiQuant’s amplifica-
tion profile and assay dynamic range were not impactedby the presence of human DNA, at up to 10 ng (Table 4,Additional file 7: Figure S3A-D). Thus, FungiQuant isrobust quantitatively even when the fungal 18S rRNAgene is relatively rare as compared to background
Liu et al. BMC Microbiology 2012, 12:255 Page 8 of 11http://www.biomedcentral.com/1471-2180/12/255
human DNA. Specifically, we showed that FungiQuantcould be applied quantitatively at a ratio of 25:679,464fungal-to-human 18S rRNA gene copy number.
FungiQuant is robust for low number of fungal 18S rRNAgeneTo validate FungiQuant use for samples with low fungalDNA and high human DNA, we developed guidelines forinterpreting triplicate reactions. Additional file 1: Table S2provides the sensitivity and specificity results from Fungi-Quant evaluation against multiple positive and negativecontrols in 10 μl and 5μl reaction volumes. Our analysisshowed that FungiQuant could consistently detect 5 copiesof 18S rRNA gene template, whereas 1.8 copies wereless consistently detected. Nevertheless, further analysisshowed that two or more amplification in triplicate reac-tions is a reliable indicator of positive fungal DNA detec-tion, irrespective of Ct-value(s) obtained (Table 5). Theseresults held for both of the reaction volumes tested.We also calculated the false negative rate for Fungi-
Quant using the sensitivity associated with 1.8 copies of
100 1e+03 1e+04
0.0
0.1
0.2
0.3
0.4
0.5
Concentrati
Coe
ffici
ent o
f Var
ianc
e (C
oV)
5025
Conditions Analyzed (5 µl Reaction)Plasmid-only Intra-RunPlasmid-only Inter-RunPlasmid + 1 ng Human Intra-RunPlasmid + 1 ng Human Inter-Run
1e+03 1e+04
0.00
0.05
0.10
0.15
0.20
0.25
0.30
Assay Coef
Coe
ffici
ent o
f Var
ianc
e (C
oV)
1005025
Conditions Analyzed (10 µl Reaction)Plasmid-only Intra-RunPlasmid-only Inter-Run
A
B
Figure 3 A-B. FungiQuant inter- and intra-run coefficient of variationCt-value (dashed line), demonstrating the range of CoV, which is lower forFungiQuant intra-run copy number CoV is consistently below 15% until atuntil at 50 copies. The FungiQuant Ct-value CoV is consistently below 10%
positive target, a template concentration that providedrelatively poor determination. Using a threshold of ≤ 1positive amplification used for rejecting triplicate resultsas noise, we determined that the false negative rate couldbe as high as 80% for samples containing ≤ 1.8 copies when10 μl reactions are used, and even higher at 87% for sam-ples analyzed using 5 μl reactions. We found that thefalse negative rate decreased significantly for samplescontaining 10 and 5 copies, with false negative rates ran-ging from 0.0% to 0.1%.We also wanted to determine the utility of Ct-values for
delineating true detection in low concentration samplesfrom noise. The means and medians of the Ct-values fromamplified wells in the LOD experiments are shown inAdditional file 1: Table S3. The medians of the 10 copiesand 5 copies samples in 10 μl reaction were statisticallylower than water-only or human-only samples. However,the 1.8 copy samples did not have a median value thatcould be discriminated from the negative control distribu-tions in either reaction volume, despite the approximatelyone cycle earlier amplifications observed for 5 and 10
1e+05 1e+06 1e+07
on in copies/µl
1e+05 1e+06 1e+07
ficient of Variance
(CoV). FungiQuant CoV is presented for copy number (solid line) andthe 10 μl than the 5 μl reactions. For the 10 μl reactions, the25 copies, and for the 5 μl reactions, the intra-run CoV is below 20%, irrespective of reaction volumes.
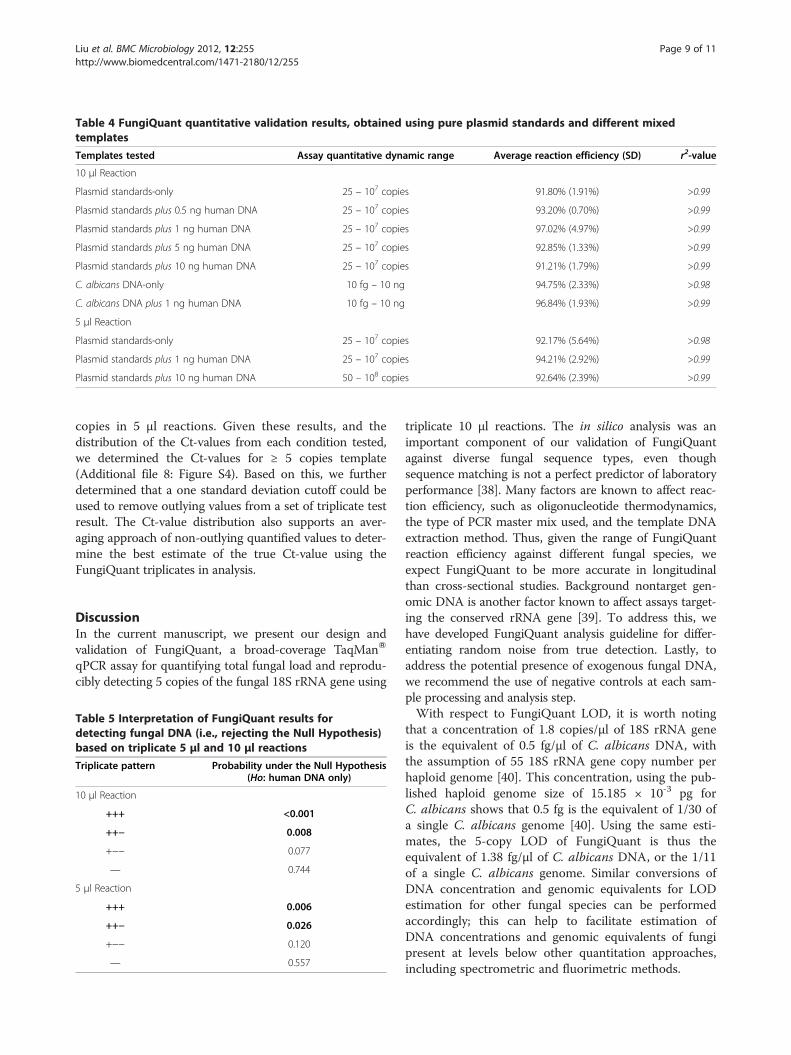
Table 4 FungiQuant quantitative validation results, obtained using pure plasmid standards and different mixedtemplates
Templates tested Assay quantitative dynamic range Average reaction efficiency (SD) r2-value
10 μl Reaction
Plasmid standards-only 25 – 107 copies 91.80% (1.91%) >0.99
Plasmid standards plus 0.5 ng human DNA 25 – 107 copies 93.20% (0.70%) >0.99
Plasmid standards plus 1 ng human DNA 25 – 107 copies 97.02% (4.97%) >0.99
Plasmid standards plus 5 ng human DNA 25 – 107 copies 92.85% (1.33%) >0.99
Plasmid standards plus 10 ng human DNA 25 – 107 copies 91.21% (1.79%) >0.99
C. albicans DNA-only 10 fg – 10 ng 94.75% (2.33%) >0.98
C. albicans DNA plus 1 ng human DNA 10 fg – 10 ng 96.84% (1.93%) >0.99
5 μl Reaction
Plasmid standards-only 25 – 107 copies 92.17% (5.64%) >0.98
Plasmid standards plus 1 ng human DNA 25 – 107 copies 94.21% (2.92%) >0.99
Plasmid standards plus 10 ng human DNA 50 – 108 copies 92.64% (2.39%) >0.99
Liu et al. BMC Microbiology 2012, 12:255 Page 9 of 11http://www.biomedcentral.com/1471-2180/12/255
copies in 5 μl reactions. Given these results, and thedistribution of the Ct-values from each condition tested,we determined the Ct-values for ≥ 5 copies template(Additional file 8: Figure S4). Based on this, we furtherdetermined that a one standard deviation cutoff could beused to remove outlying values from a set of triplicate testresult. The Ct-value distribution also supports an aver-aging approach of non-outlying quantified values to deter-mine the best estimate of the true Ct-value using theFungiQuant triplicates in analysis.
DiscussionIn the current manuscript, we present our design andvalidation of FungiQuant, a broad-coverage TaqManW
qPCR assay for quantifying total fungal load and reprodu-cibly detecting 5 copies of the fungal 18S rRNA gene using
Table 5 Interpretation of FungiQuant results fordetecting fungal DNA (i.e., rejecting the Null Hypothesis)based on triplicate 5 μl and 10 μl reactionsTriplicate pattern Probability under the Null Hypothesis
(Ho: human DNA only)
10 μl Reaction
+++ <0.001
++− 0.008
+−− 0.077
— 0.744
5 μl Reaction
+++ 0.006
++− 0.026
+−− 0.120
— 0.557
triplicate 10 μl reactions. The in silico analysis was animportant component of our validation of FungiQuantagainst diverse fungal sequence types, even thoughsequence matching is not a perfect predictor of laboratoryperformance [38]. Many factors are known to affect reac-tion efficiency, such as oligonucleotide thermodynamics,the type of PCR master mix used, and the template DNAextraction method. Thus, given the range of FungiQuantreaction efficiency against different fungal species, weexpect FungiQuant to be more accurate in longitudinalthan cross-sectional studies. Background nontarget gen-omic DNA is another factor known to affect assays target-ing the conserved rRNA gene [39]. To address this, wehave developed FungiQuant analysis guideline for differ-entiating random noise from true detection. Lastly, toaddress the potential presence of exogenous fungal DNA,we recommend the use of negative controls at each sam-ple processing and analysis step.With respect to FungiQuant LOD, it is worth noting
that a concentration of 1.8 copies/μl of 18S rRNA geneis the equivalent of 0.5 fg/μl of C. albicans DNA, withthe assumption of 55 18S rRNA gene copy number perhaploid genome [40]. This concentration, using the pub-lished haploid genome size of 15.185 × 10⁻³ pg forC. albicans shows that 0.5 fg is the equivalent of 1/30 ofa single C. albicans genome [40]. Using the same esti-mates, the 5-copy LOD of FungiQuant is thus theequivalent of 1.38 fg/μl of C. albicans DNA, or the 1/11of a single C. albicans genome. Similar conversions ofDNA concentration and genomic equivalents for LODestimation for other fungal species can be performedaccordingly; this can help to facilitate estimation ofDNA concentrations and genomic equivalents of fungipresent at levels below other quantitation approaches,including spectrometric and fluorimetric methods.

Liu et al. BMC Microbiology 2012, 12:255 Page 10 of 11http://www.biomedcentral.com/1471-2180/12/255
Use of a probe-based reporting mechanism is animportant feature in FungiQuant in two respects. First,it enhances the quantitative capability of FungiQuant,and secondly, improves assay specificity. An exampleillustrating the advantage of probe-based reporting isthe comparison of FungiQuant with an intercalatingdye-based qPCR assay, which had amplification efficien-cies ranging from 67-103% and a LOD of 500pg of fun-gal DNA [30]. Additionally, the intercalating dye cangenerate amplification signal irrespective of ampliconsize or composition.In summary, we have developed and evaluated a new
broad-coverage qPCR assay—FungiQuant—for diversefungal detection and quantification that showed broadassay coverage and favorable quantitative parameters.A limitation of the current manuscript is the conversionfrom 18S rRNA gene copy number to the number ofcells or biomass. In order to generate an estimated gen-omic equivalent, improved knowledge of 18S rRNA genecopy number of diverse fungi is required. And given that18S rRNA gene copy number varies among fungal spe-cies and even among strains or over the lifetime of thefungi [41-43], this challenge will likely to persist. Inaddition to the design and validation of a broad-coverage fungal qPCR assay, our manuscript also soughtto address basic limitations of evaluating combined pri-mer and probe coverage, as well as generating referencestandards for absolute quantification. Our approach ofevaluating assay coverage by considering the primer andprobe sequences as a single unit is appropriate andnecessary. Additionally, our approach of quantifyingplasmid standards using the intrinsic property of real-time PCR is another important step for any absolutequantification experiments using qPCR.
Additional files
Additional file 1: Supplemental Methodological Details, FigureLegends, and Tables. This supplemental file contains supplementarybioinformatics and laboratory details, figure legends for Figure S1, S2A-D,S3, and S4, and Tables S1-3.
Additional file 2: Figure S1. Results of the in silico FungiQuantcoverage analysis using the stringent criteria.
Additional file 3: Table S4. Detailed results for FungiQuant using thestringent criteria.
Additional file 4: Table S5. Detailed results for FungiQuant using therelaxed criteria.
Additional file 5: Table S6. Detailed results for fungal species withperfect matches to C. albicans in the FungiQuant primer and proberegion.
Additional File 6: Figure S2A-C. Coefficient of variance (CoV)distribution across FungiQuant assay dynamic range for mixed templates.
Additional File 7: Figure S3A-D. FungiQuant Standard curveamplification plots using additional types of templates.
Additional File 8: Figure S4. The Ct-value distribution from96-replicates for each low-copy target and negative control conditiontested.
Competing interestsThe authors have declared that no competing interests exist.
Authors’ contributionsCML contributed to the overall study design, the acquisition, analysis, andinterpretation of data, and drafting the manuscript, SK participated in thebioinformatics analysis and assay design, AGA contributed to the analysisand interpretation of data; MGD and MA both contributed to thebioinformatics portion of the analysis, PRH, YTH, JDB, LJL, and CAGcontributed to the acquisition and interpretation of laboratory data, PKconceived of the study and contributed to the overall study design, LBPcontributed to the overall study design. All authors read and approved thefinal manuscript.
AcknowledgementsThis work was supported by the National Institutes of Health (R01AI087409-01A1, R15DE021194-01), the Department of Defense (W81XWH1010870), theTGen Foundation, the Northern Arizona University Technology and ResearchInitiative Fund (TRIF) fund, and the Cowden Endowment in Microbiology atNorthern Arizona University. We thank Tania Contente-Cuomo, Jordan L.Buchhagen, and Bridget McDermott at the Translational Genomics ResearchInstitute for assistance with the real-time PCR portion of the work presentedin this manuscript.
Author details1Division of Pathogen Genomics, Translational Genomics Research Institute,Flagstaff, AZ 86011, USA. 2Center for Microbial Genetics and Genomics,Northern Arizona University, Flagstaff, AZ 86011, USA. 3Department ofEpidemiology, The Johns Hopkins Bloomberg School of Public Health,Baltimore, MD 21201, USA. 4Departments of Laboratory Medicine andInternal Medicine, National Taiwan University Hospital, National TaiwanUniversity College of Medicine, Taipei, Taiwan. 5Department of InternalMedicine, Far Eastern Memorial Hospital, New Taipei City, Taiwan.6Department of Biological Sciences, Northern Arizona University, Flagstaff, AZ86011, USA. 7Current address: Ross University School of Medicine, Roseau,Dominica.
Received: 10 May 2012 Accepted: 24 October 2012Published: 8 November 2012
References1. Blackwell M: The fungi: 1, 2, 3 . . . 5.1 million species? Am J Bot 2011,
98(3):426–438.2. Hawksworth DL: The magnitude of fungal diversity: the 1.5 million
species estimate revisited. Mycol Res 2001, 105(12):1422–1432.3. Ghannoum MA, Jurevic RJ, Mukherjee PK, Cui F, Sikaroodi M, Naqvi A,
Gillevet PM: Characterization of the oral fungal microbiome (mycobiome)in healthy individuals. PLoS Pathog 2010, 6(1):e1000713.
4. Mancini N, Carletti S, Ghidoli N, Cichero P, Burioni R, Clementi M: The era ofmolecular and other non-culture-based methods in diagnosis of sepsis.Clin Microbiol Rev 2010, 23(1):235–251.
5. Park HK, Ha MH, Park SG, Kim MN, Kim BJ, Kim W: Characterization of thefungal microbiota (mycobiome) in healthy and dandruff-afflicted humanscalps. PLoS One 2012, 7(2):e32847.
6. Fisher MC, Henk DA, Briggs CJ, Brownstein JS, Madoff LC, McCraw SL,Gurr SJ: Emerging fungal threats to animal, plant and ecosystem health.Nature 2012, 484(7393):186–194.
7. Kontoyiannis DP: Invasive mycoses: strategies for effective management.Am J Med 2012, 125(1 Suppl):S25–38.
8. Ostrosky-Zeichner L: Invasive mycoses: diagnostic challenges. Am J Med2012, 125(1 Suppl):S14–24.
9. Geha DJ, Roberts GD: Laboratory detection of fungemia. Clin Lab Med1994, 14(1):83–97.
10. Verdaguer V, Walsh TJ, Hope W, Cortez KJ: Galactomannan antigendetection in the diagnosis of invasive aspergillosis. Expert Rev Mol Diagn2007, 7(1):21–32.
11. Mennink-Kersten MA, Donnelly JP, Verweij PE: Detection of circulatinggalactomannan for the diagnosis and management of invasiveaspergillosis. Lancet Infect Dis 2004, 4(6):349–357.
Liu et al. BMC Microbiology 2012, 12:255 Page 11 of 11http://www.biomedcentral.com/1471-2180/12/255
12. Balada-Llasat JM, LaRue H, Kamboj K, Rigali L, Smith D, Thomas K, Pancholi P:Detection of yeasts in blood cultures by the Luminex xTAG fungal assay.J Clin Microbiol 2012, 50(2):492–494.
13. Oz Y, Kiraz N: Diagnostic methods for fungal infections in pediatricpatients: microbiological, serological and molecular methods. Expert RevAnti Infect Ther 2011, 9(3):289–298.
14. Amend AS, Seifert KA, Samson R, Bruns TD: Indoor fungal composition isgeographically patterned and more diverse in temperate zones than inthe tropics. Proc Natl Acad Sci USA 2010, 107(31):13748–13753.
15. Jumpponen A, Jones KL: Massively parallel 454 sequencing indicateshyperdiverse fungal communities in temperateQuercusmacrocarpaphyllosphere. New Phytol 2009, 184(2):438–448.
16. Bowker MA, Johnson NC, Belnap J, Koch GW: Short-term monitoring ofaridland lichen cover and biomass using photography and fatty acids.J Arid Environ 2008, 72(6):869–878.
17. Davey ML, Nybakken L, Kauserud H, Ohlson M: Fungal biomass associatedwith the phyllosphere of bryophytes and vascular plants. Mycol Res 2009,113(Pt 11):1254–1260.
18. Eikenes M, Hietala AM, Alfredsen G, Gunnar Fossdal C, Solheim H:Comparison of quantitative real-time PCR, chitin and ergosterol assaysfor monitoring colonization ofTrametes versicolorin birch wood.Holzforschung 2005, 59(5):568–573.
19. Olsson PA, Larsson L, Bago B, Wallander H, van Aarle IM: Ergosterol andfatty acids for biomass estimation of mycorrhizal fungi. New Phytol 2003,159(1):7–10.
20. McGonigle TP, Miller MH, Evans DG, Fairchild GL, Swan JA: A new methodwhich gives an objective measure of colonization of roots by vesicular-arbuscular mycorrhizal fungi. New Phytol 1990, 115(3):495–501.
21. Carroll GC, Carroll FE: Studies on the incidence of coniferous needleendophytes in the Pacific Northwest. Can J Bot 1978, 56(24):3034–3043.
22. Elamo P, Helander ML, Saloniemi I, Neuvonen S: Birch family andenvironmental conditions affect endophytic fungi in leaves. Oecologia1999, 118(2):151–156.
23. Amend AS, Seifert KA, Bruns TD: Quantifying microbial communities with454 pyrosequencing: does read abundance count? Mol Ecol 2010,19(24):5555–5565.
24. Dickie IA, FitzJohn RG: Using terminal restriction fragment lengthpolymorphism (T-RFLP) to identify mycorrhizal fungi: a methods review.Mycorrhiza 2007, 17(4):259–270.
25. Meklin T, Haugland RA, Reponen T, Varma M, Lummus Z, Bernstein D,Wymer LJ, Vesper SJ: Quantitative PCR analysis of house dust can revealabnormal mold conditions. J Environ Monit 2004, 6(7):615–620.
26. Einsele H, Hebart H, Roller G, Loffler J, Rothenhofer I, Muller CA, Bowden RA,van Burik J, Engelhard D, Kanz L, et al: Detection and identification offungal pathogens in blood by using molecular probes. J Clin Microbiol1997, 35(6):1353–1360.
27. Haugland RA, Varma M, Wymer LJ, Vesper SJ: Quantitative PCR analysis ofselected Aspergillus, Penicillium and Paecilomyces species. Syst ApplMicrobiol 2004, 27(2):198–210.
28. Mussap M, Molinari MP, Senno E, Gritti P, Soro B, Mannelli S, Fabris C:New diagnostic tools for neonatal sepsis: the role of a real-timepolymerase chain reaction for the early detection and identification ofbacterial and fungal species in blood samples. J Chemother 2007,19(Suppl 2):31–34.
29. Landlinger C, Preuner S, Baskova L, van Grotel M, Hartwig NG, Dworzak M,Mann G, Attarbaschi A, Kager L, Peters C, et al: Diagnosis of invasive fungalinfections by a real-time panfungal PCR assay in immunocompromisedpediatric patients. Leukemia 2010, 24(12):2032–2038.
30. Chemidlin Prevost-Boure N, Christen R, Dequiedt S, Mougel C, Lelievre M,Jolivet C, Shahbazkia HR, Guillou L, Arrouays D, Ranjard L: Validation andapplication of a PCR primer set to quantify fungal communities in the soilenvironment by real-time quantitative PCR. PLoS One 2011, 6(9):e24166.
31. Bustin SA, Benes V, Garson JA, Hellemans J, Huggett J, Kubista M, Mueller R,Nolan T, Pfaffl MW, Shipley GL, et al: The MIQE guidelines: minimuminformation for publication of quantitative real-time PCR experiments.Clin Chem 2009, 55(4):611–622.
32. Pruesse E, Quast C, Knittel K, Fuchs BM, Ludwig W, Peplies J, Glockner FO:SILVA: a comprehensive online resource for quality checked and alignedribosomal RNA sequence data compatible with ARB. Nucleic Acids Res2007, 35(21):7188–7196.
33. Kibbe WA: OligoCalc: an online oligonucleotide properties calculator.Nucleic Acids Res 2007, 35(Web Server issue):W43–46.
34. Morgulis A, Coulouris G, Raytselis Y, Madden TL, Agarwala R, Schaffer AA:Database indexing for production MegaBLAST searches. Bioinformatics2008, 24(16):1757–1764.
35. International Human Genome Sequencing Consortium: Finishing theeuchromatic sequence of the human genome. Nature 2004,431(7011):931–945.
36. Lander ES, Linton LM, Birren B, Nusbaum C, Zody MC, Baldwin J, Devon K,Dewar K, Doyle M, FitzHugh W, et al: Initial sequencing and analysis of thehuman genome. Nature 2001, 409(6822):860–921.
37. Dolezel J, Bartos J, Voglmayr H, Greilhuber J: Nuclear DNA content andgenome size of trout and human. Cytometry A 2003, 51(2):127–128. authorreply 129.
38. Morales SE, Holben WE: Empirical testing of 16S rRNA gene PCR primerpairs reveals variance in target specificity and efficacy not suggested byin silico analysis. Appl Environ Microbiol 2009, 75(9):2677–2683.
39. Ludwig W, Schleifer KH: How quantitative is quantitative PCR with respectto cell counts? Syst Appl Microbiol 2000, 23(4):556–562.
40. Jones T, Federspiel NA, Chibana H, Dungan J, Kalman S, Magee BB,Newport G, Thorstenson YR, Agabian N, Magee PT, et al: The diploidgenome sequence of Candida albicans. Proc Natl Acad Sci USA 2004,101(19):7329–7334.
41. Herrera ML, Vallor AC, Gelfond JA, Patterson TF, Wickes BL: Strain-dependent variation in 18S ribosomal DNA Copy numbers in Aspergillusfumigatus. J Clin Microbiol 2009, 47(5):1325–1332.
42. Kobayashi T: Regulation of ribosomal RNA gene copy number and itsrole in modulating genome integrity and evolutionary adaptability inyeast. Cell Mol Life Sci 2011, 68(8):1395–1403.
43. Ide S, Miyazaki T, Maki H, Kobayashi T: Abundance of ribosomal RNA genecopies maintains genome integrity. Science 2010, 327(5966):693–696.
doi:10.1186/1471-2180-12-255Cite this article as: Liu et al.: FungiQuant: A broad-coverage fungalquantitative real-time PCR assay. BMC Microbiology 2012 12:255.
Submit your next manuscript to BioMed Centraland take full advantage of:
• Convenient online submission
• Thorough peer review
• No space constraints or color figure charges
• Immediate publication on acceptance
• Inclusion in PubMed, CAS, Scopus and Google Scholar
• Research which is freely available for redistribution
Submit your manuscript at www.biomedcentral.com/submit


![Its2vec: Fungal Species Identification Using …downloads.hindawi.com/journals/bmri/2020/2468789.pdf1,794 species of 510 genera [10].A largerdataset thatcoversa broad range of fungal](https://static.fdocuments.net/doc/165x107/5f83fd030c3c7962852bddc2/its2vec-fungal-species-identification-using-1794-species-of-510-genera-10a.jpg)