Fundamentals of wind EIBG 052609 - Pembina
12
5/27/2009 1 E. Ian Baring-Gould, Fundamentals of Wind Energy Fundamentals of Wind Energy (Wind (Wind-Diesel 101) Diesel 101) NREL is a national laboratory of the U.S. Department of Energy Office of Energy Efficiency and Renewable Energy operated by the Alliance for Sustainable Energy, LLC National Wind Technology Center & Deployment & Industrial Partnerships Centers May 31 st 2009 TOPICS Introduction Energy and Power Wind Characteristics Wind Power Potential Basic Wind Turbine Theory Types of Wind Turbines Review of Small and Large Turbines Review of the Current Wind Market Further Information What is Wind Power 800-900 years ago, in Europe 140 years ago, water-pumping wind mills 70 years ago, electric power 1400-1800 years go, in the Middle East The ability to harness the power available in the wind and put it to useful work. ENERGY AND POWER ENERGY: The Ability to do work Electrical energy is reported in kWh and may be used to describe a potential, such as in stored energy or the amount of energy used over a time period, like 1000 kWh per day POWER: Force at any instant The amount of energy needed at any instant in time. Represents current generation and constraints such as Generator Size or an instantaneous load which is measured in kW P = 0.5 ρ v 3 P: power, Watt ρ: density of air kg/m 3 Power in the Wind ρ: density of air , kg/m 3 V: wind speed, m/s We call this the Wind Power Density (W/m 2 ) which is a measure of the power available in the wind at a specific point or as an average over a longer period of time Power from the Wind Cp = Coefficient of Performance (an P = 0.5 ρ v 3 Cp A S Performance (an efficiency term) A S = The swept area of the wind turbine blades Multiplied by time give you Energy…
Transcript of Fundamentals of wind EIBG 052609 - Pembina

5/27/2009
1
E. Ian Baring-Gould,
Fundamentals of Wind EnergyFundamentals of Wind Energy(Wind(Wind--Diesel 101)Diesel 101)
NREL is a national laboratory of the U.S. Department of Energy Office of Energy Efficiency and Renewable Energy operated by the Alliance for Sustainable Energy, LLC
National Wind Technology Center & Deployment & Industrial Partnerships Centers
May 31st 2009
TOPICS
IntroductionEnergy and PowerWind CharacteristicsWind Power PotentialBasic Wind Turbine Theory Types of Wind TurbinesReview of Small and Large TurbinesReview of the Current Wind MarketFurther Information
What is Wind Power800-900 years ago, in Europe
140 years ago,water-pumpingwind mills
70 years ago, electric power
1400-1800 years go,in the Middle East
The ability to harness the power available in the wind and put it to useful work.
ENERGY AND POWER
ENERGY: The Ability to do workElectrical energy is reported in kWh and may be used to describe a potential, such as in stored energy or the amount of energy used over a time period, like 1000 kWh per day
POWER: Force at any instantThe amount of energy needed at any instant in time. Represents current generation and constraints such as Generator Size or an instantaneous load which is measured in kW
P = 0.5 ρ v3
P: power, Watt
ρ: density of air kg/m3
Power in the Wind
ρ: density of air, kg/m3
V: wind speed, m/sWe call this the Wind Power Density (W/m2) which is a measure of the power available in the wind at a specific point or as an average over a longer period of time
Power from the Wind
Cp = Coefficient of Performance (an
P = 0.5 ρ v3 Cp AS
Performance (an efficiency term)
AS = The swept area of the wind turbine blades
Multiplied by time give you
Energy…
5/27/2009
2
Critical Aspects of Wind Energy
V3: Doubling of the wind speed results in an 8 fold increase in power
ρ: High density air results in more power
P = 0.5 ρ Cp v3 AS
ρ: High density air results in more power (altitude and temperature)
As: A slight increase in blade length, increases the area greatly
Cp: Different types of wind turbines have different maximum theoretical efficiencies (Betz limit ≈0.593) but usually between .4 and .5
Velocity – The Impact on Increasing Wind Speed
A small increase in wind speed
i0.3
0.4
0.5
rgy,
MW
h
30%
40%
50%
Annual Energy Output
Capacity Factor (%)
can increase the power greatly
0.0
0.1
0.2
3 4 5 6 7 8 9Average Wind Speed, m/s
Ann
ual E
ne
0%
10%
20%
Air Density -Changes with
Elevation0
1,0002,000
3,000
4,000
5,000
6,0007,000
8,000
9,000
10,000
70 75 80 85 90 95 100
Density Change Compared to Sea Level, %
Elev
atio
n, ft
-40-30-20-10
0102030405060708090
100110
90 95 100 105 110 115 120 125
Density Change Compared to 59 F, %
Tem
pera
ture
, F
Changes with Temperature
500 kW1257 m 2
300 kW
1000 kW
2400 m2
Swept Area
10 kW 38 m 2
1 kW 6 m 2
300 kW
415 m 2
25 kW 78 m 2
A = (π D2 )4
Wind Characteristics and Resources
Understanding the wind resource at your location is critical to understanding the potential for using wind energy
• Wind Speed• Wind Speed– Wind Profile– Wind classes – Collection and reporting
• Wind Direction• Wind speed change with height
Wind Speed• Measured in m/s or mph• Varies by the second,
hourly, daily, seasonally and year to year
• Usually has patternsDi l it l bl i– Diurnal - it always blows in the morning
– Seasonal – The winter winds are stronger
– Characteristics – Winds from the sea are always stronger and are storm driven.

5/27/2009
3
So, which is better… 1. A location where the wind that blows only
50% of the time at 10 m/s but is calm the rest of the time
2. A location where the wind that blows all of the time at 5 m/s
Both have exactly the same annual average wind speed…
P = 0.5 ρ Cp v3 AS
Wind Maps and Class
Careful:Wind class is defined
at a specific height
Wind Speed Data Collection and Reporting
Collection• Measured every 1
or 2 seconds • Averaged every 10
or 15 minutes• Reported as hour1000
1200
1400
1600
s) Reported as hour averages
Turbulence Intensity Wind Speed
Frequency of Occurrence Histogram based on hour average data for a year
0
200
400
600
800
0 1 2 3 4 5 6 7 8 9 10 11 12 13 14 15 16 17 18 19 20 21 22 23 24 25
Wind Speed (m/s)
Tim
e (H
our
Wind DirectionWind Rose
Wind Speed Rose
CONTINENTAL TRADE WINDS
Can also have a wind direction change intensity – similar to turbulence
Impacts on Wind Speed Many things impact the
speed and direction of the wind at any specific
location, making local measurements important
Wind Speed Increases with Height
• Because of friction with the earth, air closer to the surface moves more slowly
140
120
100
m
12:10 12:20 12:30 12:40 12:50Pow er Lawmoves more slowly
• The farther we get away from the earth (increase in altitude) the higher the wind speed gets until it is no longer effected by the earths surface
80
60
40
20
0
Hei
ght,
m
1086420Wind Speed, m/s
Pow er Law Log Law
5/27/2009
4
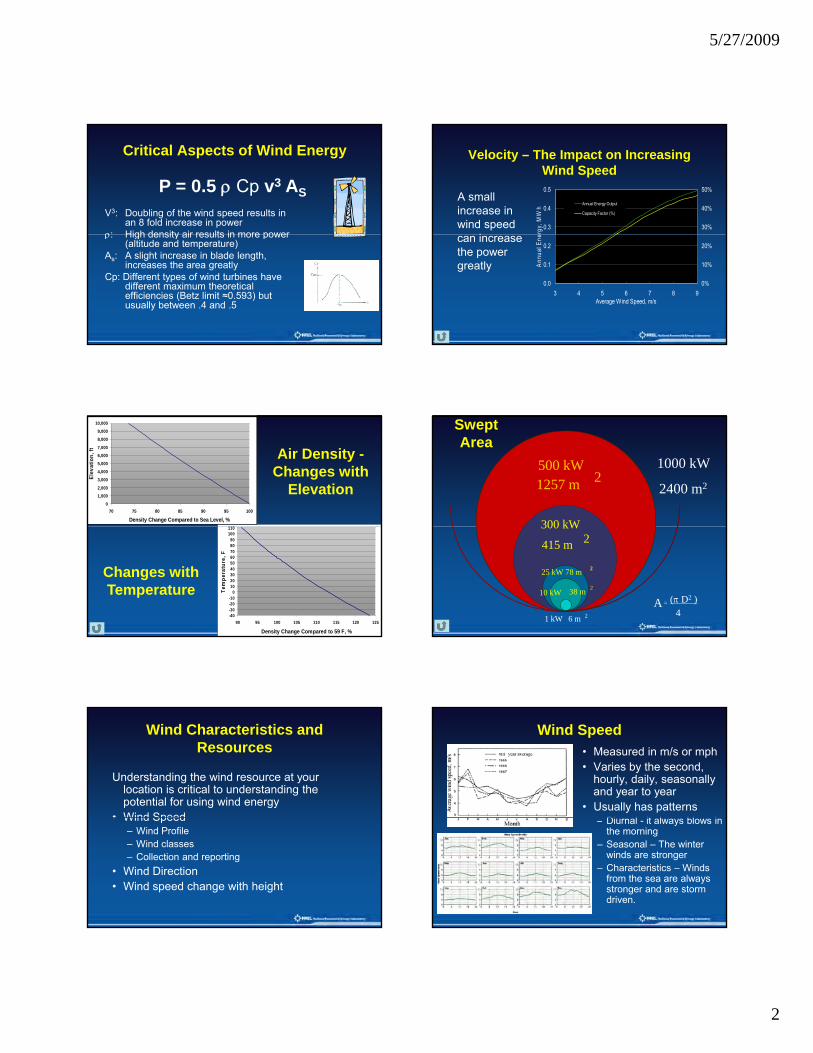
Wind Shear
• The type of surface (grass, trees) impacts the
Wind Speed, m/sHeightm50
40
30
12.6
12.2
11.7 impacts the wind shear
• Real vs. apparent height
30
201050
SURFACE
11
108.8
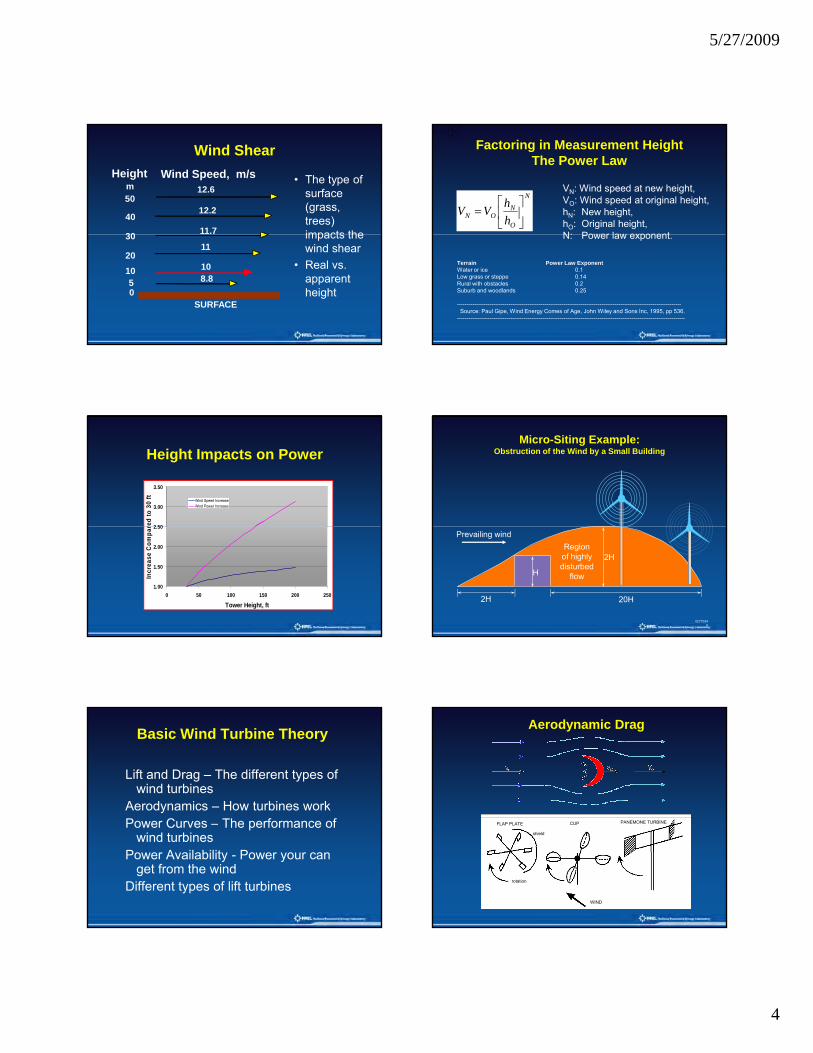
Factoring in Measurement HeightThe Power Law
N
O
NON h
hVV ⎥⎦
⎤⎢⎣
⎡=
N
O
NON h
hVV ⎥⎦
⎤⎢⎣
⎡=
VN: Wind speed at new height,VO: Wind speed at original height,hN: New height,hO: Original height,N: Power law exponent
Terrain Power Law ExponentWater or ice 0.1Low grass or steppe 0.14Rural with obstacles 0.2Suburb and woodlands 0.25
----------------------------------------------------------------------------------------------------------------------Source: Paul Gipe, Wind Energy Comes of Age, John Wiley and Sons Inc, 1995, pp 536.
------------------------------------------------------------------------------------------------------------------------
N: Power law exponent.
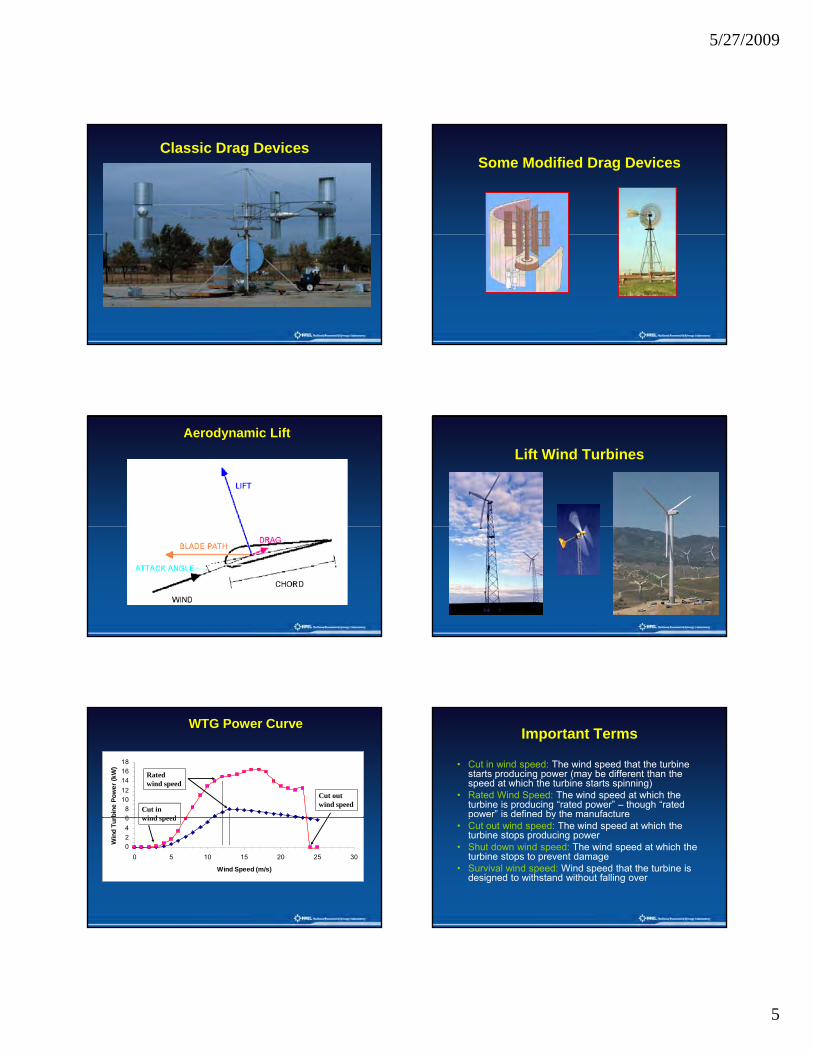
Height Impacts on Power
2 50
3.00
3.50
red
to 3
0 ft Wind Speed Increase
Wind Power Increase
1.00
1.50
2.00
2.50
0 50 100 150 200 250
Tower Height, ft
Incr
ease
Com
par
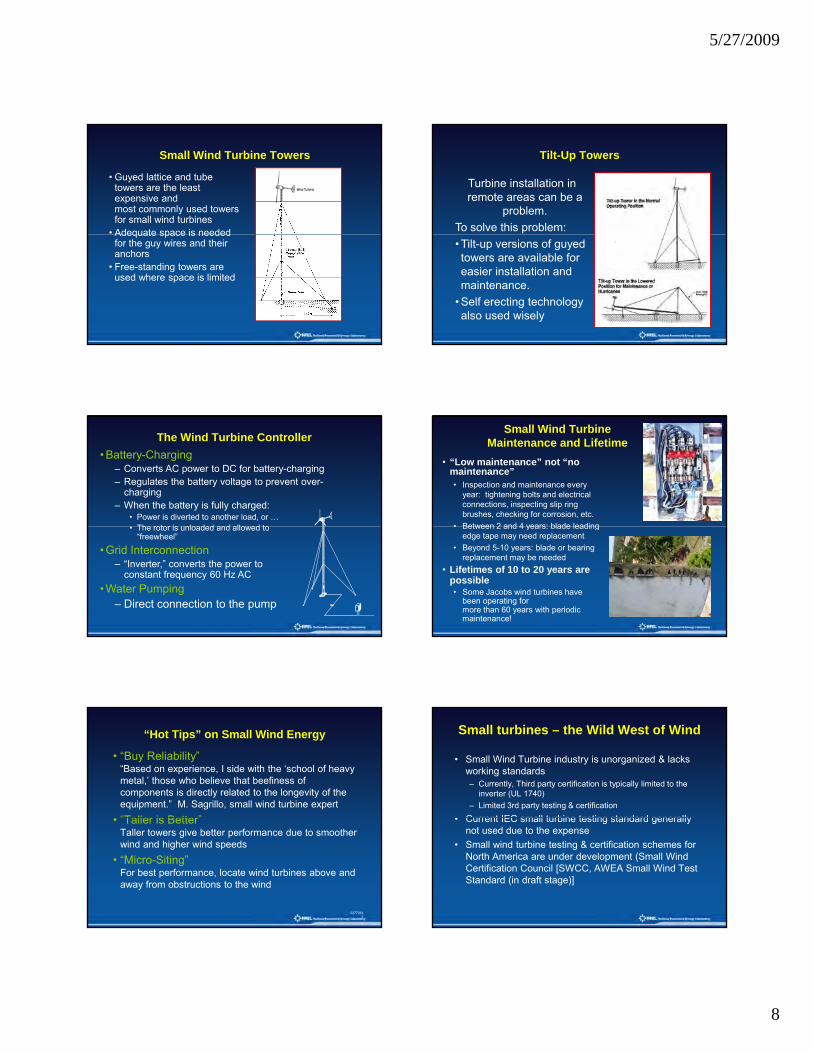
Micro-Siting Example:Obstruction of the Wind by a Small Building
Prevailing wind
H
2H 20H
2HRegionof highlydisturbed
flow
02770346
Basic Wind Turbine Theory
Lift and Drag – The different types of wind turbines
Aerodynamics – How turbines workPower Curves – The performance of
wind turbinesPower Availability - Power your can
get from the windDifferent types of lift turbines
Aerodynamic Drag
WIND
PANEMONE TURBINECUPFLAP PLATE
shield
rotation
5/27/2009
5
Classic Drag DevicesSome Modified Drag Devices
Aerodynamic LiftLift Wind Turbines
WTG Power Curve
68
1012141618
rbin
e Po
wer
(kW
)
Cut in wind speed
Rated wind speed
Cut out wind speed
0246
0 5 10 15 20 25 30
Wind Speed (m/s)
Win
d Tu
r wind speed
Important Terms
• Cut in wind speed: The wind speed that the turbine starts producing power (may be different than the speed at which the turbine starts spinning)
• Rated Wind Speed: The wind speed at which the turbine is producing “rated power” – though “rated power” is defined by the manufacturep y
• Cut out wind speed: The wind speed at which the turbine stops producing power
• Shut down wind speed: The wind speed at which the turbine stops to prevent damage
• Survival wind speed: Wind speed that the turbine is designed to withstand without falling over

5/27/2009
6
Wind Turbine Power CurveBergey 1500 (manufacturer’s data)
1.2
1.4
1.6
1.8
W)
0
0.2
0.4
0.6
0.8
1
0 1 2 3 4 5 6 7 8 9 10 11 12 13 14 15 16 17 18 19 20 21 23 23 24 25
Wind Speed (m/s)
Pow
er (k
W
Wind Speed Frequency of OccurrenceAverage Wind Speed: 5 m/s (11 mph)
1000
1200
1400
1600
urs)
0
200
400
600
800
0 1 2 3 4 5 6 7 8 9 10 11 12 13 14 15 16 17 18 19 20 21 22 23 24 25Wind Speed (m/s)
Tim
e (H
ou
Annual Energy Production: 2643 kWh/yearBergey 1500 @ 5 m/s (11 mph) average wind speed
250
300
350
400
450
y (k
Wh)
0
50
100
150
200
1 2 3 4 5 6 7 8 9 10 11 12 13 14 15 16 17 18 19 20 21 22 23 24 25
Wind Speed (m/s)
Ener
gy
All available energy may not be captured
Types of Lift TurbinesHAWT VAWT
Basic Properties of HAWT
• Basics of a horizontal axis wind turbine• Types of turbines• Small distributed turbines• Small distributed turbines• Large grid connected turbines

5/27/2009
7
Parts of a Wind Turbine
Rotor
Basic Motion of a Wind Turbine
Pitch
Yaw
Rotation
• Utility-Scale Wind Power600 - 5,000 kW wind turbines
– Installed on wind farms, 10 – 300 MW– Professional maintenance crews– Classes 5 and 6 (> 6 m/s average)
Different Types of Wind Turbines
1,500 kW
• Distributed Wind Power300 W - 600 kW wind turbines
– Installed at individual homes, farms, businesses, schools, etc.
– On the “customer side” of the meter– High reliability, low maintenance– Classes 2 and 3 (5 m/s average)
10 kW
Sizes and Applications
Small (≤10 kW)HomesFarmsRemote Applications
(e.g. water pumping, telecom sites icemaking)
Intermediate(10-250 kW)Village PowerHybrid
sites, icemaking) SystemsDistributed Power
Large (250 kW – 2+ MW)Central Station Wind FarmsDistributed Power
Small wind turbines
Tail Vane
Tail Boom
Nacelle
Tower Adapter(contains slip rings)
Alternator(Permanent Magnet)
Turbine Blade
Nose Cone
Tower
• Typically use a permanent magnet alternator
• Generates wild AC (variable voltage and f ) th tTower frequency) power that must be treated.
• Can provide AC or DC power
• Passively controlled
Overspeed Protection of Small WTGDuring High Winds
Furling: The rotor turns out of the
wind during high winds to reduce
power
• Used to control rotor speed and power output
• Dynamic activity
• Can cause noise issues (flutter)
• Not all small wind turbines do this
5/27/2009
8
Small Wind Turbine Towers
• Guyed lattice and tube towers are the least expensive and most commonly used towers for small wind turbines
• Adequate space is neededAdequate space is needed for the guy wires and their anchors
• Free-standing towers are used where space is limited
Tilt-Up Towers
Turbine installation in remote areas can be a
problem.To solve this problem:• Tilt-up versions of guyed towers are available for easier installation and maintenance.
• Self erecting technology also used wisely
The Wind Turbine Controller• Battery-Charging
– Converts AC power to DC for battery-charging– Regulates the battery voltage to prevent over-
charging– When the battery is fully charged:
• Power is diverted to another load, or …The rotor is nloaded and allo ed to• The rotor is unloaded and allowed to “freewheel”
• Grid Interconnection– “Inverter,” converts the power to
constant frequency 60 Hz AC• Water Pumping
– Direct connection to the pump
Small Wind TurbineMaintenance and Lifetime
• “Low maintenance” not “no maintenance”• Inspection and maintenance every
year: tightening bolts and electrical connections, inspecting slip ring brushes, checking for corrosion, etc.
• Between 2 and 4 years: blade leading• Between 2 and 4 years: blade leading edge tape may need replacement
• Beyond 5-10 years: blade or bearing replacement may be needed
• Lifetimes of 10 to 20 years are possible• Some Jacobs wind turbines have
been operating for more than 60 years with periodic maintenance!
“Hot Tips” on Small Wind Energy
• “Buy Reliability”“Based on experience, I side with the ‘school of heavy metal,’ those who believe that beefiness of components is directly related to the longevity of the equipment.” M. Sagrillo, small wind turbine expert“Taller is Better”• “Taller is Better”Taller towers give better performance due to smoother wind and higher wind speeds
• “Micro-Siting”For best performance, locate wind turbines above and away from obstructions to the wind
02770345
Small turbines – the Wild West of Wind
• Small Wind Turbine industry is unorganized & lacks working standards– Currently, Third party certification is typically limited to the
inverter (UL 1740)– Limited 3rd party testing & certification
• Current IEC small turbine testing standard generally• Current IEC small turbine testing standard generally not used due to the expense
• Small wind turbine testing & certification schemes for North America are under development (Small Wind Certification Council [SWCC, AWEA Small Wind Test Standard (in draft stage)]

5/27/2009
9
Questions to Ask about SWT• What level of certification does
the turbine have?• Is a power curve available? If
so, how was it developed?• Has the turbine been previously
installed? (In the U.S., near the proposed site)
Vertikalrotor 500
Loopwing Tromc
Hush Turbine 3000
• How many units have been deployed?
• Is there any sort of dealer infrastructure?
• How long has the manufacturer been in business? (What is the experience of the company key personnel?)
• Is the inverter UL listed? (Grid tied systems)
Skystream 2400
Vertikalrotor 500
Windport 5000
Windkraft 500
http://www.allsmallwindturbines.com/
Large Wind Turbines• Typically
induction or variable speed permanent magnet generators
• Create AC power supplied to the grid
• Actively controlled
Nacelle
Boeing 747-200
Blades
Parts of a Wind Turbine Power Plant
Tower
Characteristics of Large WTGPower Types• Induction (Constant speed)• Permanent Magnet (Variable
speed) using power electronicsPower System Efficienciesy• Aerodynamic• Rotor• Drive train / gear box• Generator• Power Conversion (if applicable)
Control of Large WTGFixed Pitch (Stall regulated): The shape of the blade
varies over its length so that as wind speed increase parts of the blade stop producing lift and limit power.
Variable Pitch: The rotation (pitch) of each blade is individually controlled to control lift
Yaw: Motors control yaw behavior based on a windYaw: Motors control yaw behavior based on a wind direction vain, used to shut down wind turbine in high winds but can also be a source of problems.
Brake: All wind turbines are required to have two of them but there are several types:Aerodynamic: Flaps on the blades that cause drag.Mechanical: Disks or calipers, like your car.Electrical: using the generator to cause electrical resistance.
Other Large (and Small) Turbines Considerations
• Policy• Siting• Transmission• Transmission• External Conditions• Intermittency
5/27/2009
10
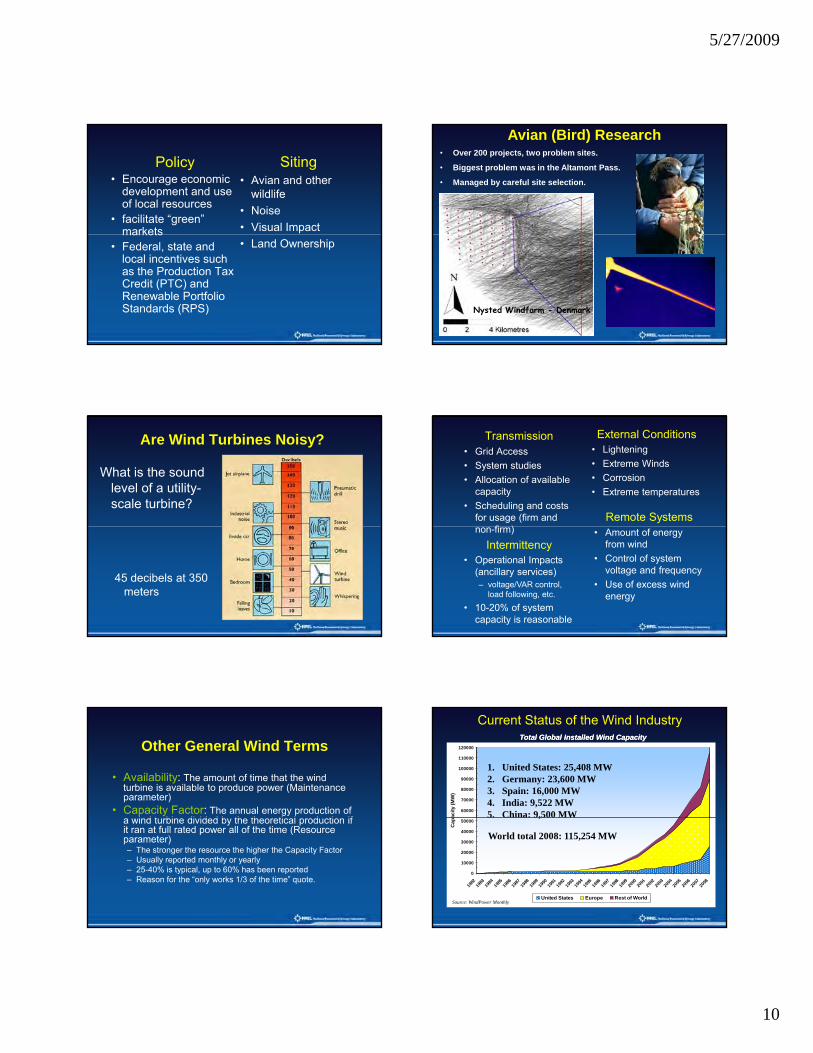
Policy• Encourage economic
development and use of local resources
• facilitate “green” markets
Siting• Avian and other
wildlife• Noise• Visual Impact markets
• Federal, state and local incentives such as the Production Tax Credit (PTC) and Renewable Portfolio Standards (RPS)
• Land Ownership
Avian (Bird) Research• Over 200 projects, two problem sites.
• Biggest problem was in the Altamont Pass.
• Managed by careful site selection.
Nysted Windfarm - Denmark
Are Wind Turbines Noisy?
What is the sound level of a utility-scale turbine?
45 decibels at 350 meters
Transmission• Grid Access• System studies• Allocation of available
capacity• Scheduling and costs
for usage (firm and fi )
External Conditions • Lightening • Extreme Winds• Corrosion• Extreme temperatures
Remote Systemsnon-firm) • Amount of energy
from wind• Control of system
voltage and frequency• Use of excess wind
energy
Intermittency• Operational Impacts
(ancillary services)– voltage/VAR control,
load following, etc.
• 10-20% of system capacity is reasonable
Other General Wind Terms
• Availability: The amount of time that the wind turbine is available to produce power (Maintenance parameter)
• Capacity Factor: The annual energy production of i d t bi di id d b th th ti l d ti ifa wind turbine divided by the theoretical production if
it ran at full rated power all of the time (Resource parameter)– The stronger the resource the higher the Capacity Factor– Usually reported monthly or yearly– 25-40% is typical, up to 60% has been reported– Reason for the “only works 1/3 of the time” quote.
Current Status of the Wind Industry
60000
70000
80000
90000
100000
110000
120000
acity
(MW
)
1. United States: 25,408 MW2. Germany: 23,600 MW3. Spain: 16,000 MW4. India: 9,522 MW5. China: 9,500 MW
Total Total Global Installed Global Installed Wind CapacityWind Capacity
0
10000
20000
30000
40000
50000
1982
1983
1984
1985
1986
1987
1988
1989
1990
1991
1992
1993
1994
1995
1996
1997
1998
1999
2000
2001
2002
2003
2004
2005
2006
2007
2008
Cap
United States Europe Rest of World
,
Source: WindPower Monthly
World total 2008: 115,254 MW

5/27/2009
11
Major Source of New Generation Capacity Additions
• 2008: 42%• 2007: 35%• 2006: 18%• 2005: 12%• 2000-04: <5%40%
50%60%
70%
80%
90%
100%
of A
nnua
l Cap
acity
Ad
ditio
ns
40
60
80
100
Annu
al C
apac
ity
dditi
ons
(GW
)
0%
10%
20%30%
2000 2001 2002 2003 2004 2005 2006 2007 2008
Perc
ent
0
20 Tota
l Ad
Wind Other RenewableGas (CCGT) Gas (non-CCGT)Coal Other non-RenewableTotal Capacity Additions (right axis)
Source: EIA, Ventyx, AWEA, IREC, Berkeley Lab
Wind Has Been Competitive with Wholesale Power Prices in Recent Years
20
30
40
50
60
70
80
90
2008
$/M
Wh
Wind project sample includes projects built from 1998-2008
Note: Wholesale price range reflects flat block of power across 23 pricing locations; wind costs represent capacity-weighted average price for wind power for entire sample of projects built from 1998-2008
0
10
20
2003 2004 2005 2006 2007 2008
53 projects 66 projects 87 projects 107 projects 127 projects 159 projects
2,467 MW 3,268 MW 4,397 MW 5,810 MW 8,341 MW 11,091 MW
Nationwide Wholesale Power Price Range (for a flat block of power)
Cumulative Capacity-Weighted Average Wind Power Price
Source: FERC 2006 and 2004 "State of the Market" reports, Berkeley Lab database, Ventyx, ICE
Wind Prices Have Been Rising Since 2002-03…
• Wind power prices bottomed out with projects built in 2002-03• Projects built in 2008 are ~$15-20/MWh higher on average
The Near-Term Wind has Become Somewhat Less Attractive
40
50
60
70
80
90
ower
Pric
e (2
008
$/M
Wh)
Note: Prices include the value of the PTC
• Wind prices are likely to increase further in 2009 as installed costs will remain high as developers work through turbines ordered at peak prices, and given higher equity yields.
• Wholesale price’s are also likely to increase as the economic depression reverses course
0
10
20
30
2000-01 2002-03 2004-05 2006 2007 2008902 MW 1,801 MW 1,717 MW 766 MW 3,425 MW 1,856 MW
Capacity-Weighted Average 2008 Wind Power Price (by project vintage) Individual Project 2008 Wind Power Price (by project vintage)
2008
Po
2008 2009 Wholesale Price
Range
Drivers for Wind Power
• Declining Wind Costs• Fuel Price Uncertainty• Federal and State Policies• Economic DevelopmentEconomic Development• Public Support• Green Power• Energy Security• Carbon Risk
Further Information / ReferencesWeb Based:• American Wind Energy Association http://www.awea.org/• Wind Powering America
http://www.eere.energy.gov/windpoweringamerica/• Danish Wind Industry Association guided tour and information.
http://www.windpower.org/en/tour/Publications:• Ackermann, T. (Ed’s), Wind Power in Power Systems, John Wiley and
Sons west Sussex England (2005)Sons, west Sussex, England, (2005).• Hunter, R., Elliot, G. (Ed’s), Wind-Diesel Systems. Cambridge, UK:
Cambridge University Press, 1994.• Wind Energy Explained, J. F. Manwell, J. G. McGowan, A. L. Rogers
John Wiley & Sons Ltd. 2002.• Paul Gipe, Wind Energy Basics: A Guide to Small and Micro Wind
Systems, Real Goods Solar Living Book.• AWS Scientific Inc. “Wind Resource Assessment Handbook” produced
by for the National Renewable Energy Laboratory, Subcontract number TAT-5-15283-01, 1997
Thanks to:• Ken Starcher, Alternative Energy Institute, West Texas A&M University

5/27/2009
12
Carpe Ventem
NREL is a national laboratory of the U.S. Department of Energy Office of Energy Efficiency and Renewable Energy operated by the Alliance for Sustainable Energy, LLC
E. Ian Baring-GouldNational Wind Technology Center & Deployment & Industrial Partnerships [email protected]