Fundamentals of Networking Lab Seattle Spectrum Measurements 900-948 MHz.
26
Fundamentals of Networking Lab Seattle Spectrum Seattle Spectrum Measurements Measurements 900-948 MHz 900-948 MHz
-
date post
19-Dec-2015 -
Category
Documents
-
view
216 -
download
0
Transcript of Fundamentals of Networking Lab Seattle Spectrum Measurements 900-948 MHz.

Fundamentals of Networking Lab
Seattle Spectrum MeasurementsSeattle Spectrum Measurements
900-948 MHz900-948 MHz

Fundamentals of Networking Lab
Purpose for the measurementsPurpose for the measurements
• Sweeping thru a wideband (bandwidth>900MHz), and use this wideband data to validate our wideband detection architectures and algorithms for cognitive radio
• Monitor a set of channels continuously to investigate the temporal correlation for channel modeling

Fundamentals of Networking Lab
Hardware settingsHardware settings

Fundamentals of Networking Lab
System block diagramSystem block diagram

Fundamentals of Networking Lab
USRP2 RF ChainUSRP2 RF Chain
(1) 50MHz-2GHz(2) down converted to a center frequency of 126MHz(3) 111-141MHz(4) baseband: 0-1MHz

Fundamentals of Networking Lab
Data Collection ParametersData Collection Parameters
Parameter Value
Frequency Range 900-950MHz
Channel Bandwidth 8 MHz
Number of Channels 6
Sample Rate 16.67 MS/s
Samples per Channel 2.048x10^9
Collection Times 20 Dec 11 15:00, 21 Dec 11 00:01, 21 Dec 11 07:00, 21 Dec 11 12:00
Total Data Recorded 3.93x10^11 Bytes
6

Fundamentals of Networking Lab
Example CollectionExample Collection
7

Fundamentals of Networking Lab
Example CollectionExample Collection
8

Fundamentals of Networking Lab
Processing StepsProcessing Steps
• Initial 832 point FFT and magnitude squared• Receiver Characteristic Compensation• Harmonic and DC Clipping• Result – 2000x416 matrix
– Rows are time– Columns are frequency
9

Fundamentals of Networking Lab
Processing DiagramProcessing Diagram
10

Fundamentals of Networking Lab
Receiver CompensationReceiver Compensation
11
0 50 100 150 200 250 300-54
-52
-50
-48
-46
-44
-42
-40
-38
0 50 100 150 200 250 300-52
-50
-48
-46
-44
-42
-40
-38
-36
Left half multiplied by:
Right Half multiplied by:

Fundamentals of Networking Lab
Harmonic ClippingHarmonic Clipping
12
0 50 100 150 200 250 300-50.5
-50
-49.5
-49
-48.5
-48
-47.5
-47
-46.5
-46
X: 146Y: -49.84
-Harmonics associates with the USRP are clipped to the noise floor

Fundamentals of Networking Lab
Channel Four After ProcessingChannel Four After Processing
13
Time (s)
Fre
quen
cy (
MH
z)
Channel Four 924-932MHz
0 20 40 60 80 100 120
924
925
926
927
928
929
930
931
932 -20
-15
-10
-5
0
5
10
Paging
Paging
Narrowband PCS
Specialized Mobile Radio Service
Amateur Radio Service / Location and Monitoring service

Fundamentals of Networking Lab
Channel Five After ProcessingChannel Five After Processing
14
Time (s)
Fre
quen
cy (
MH
z)
Channel Five 932-940MHz
0 20 40 60 80 100 120
932
933
934
935
936
937
938
939
940 -20
-15
-10
-5
0
Specialized Mobile Radio Service / Business-Industrial Land Service
Fixed Microwave / Multiple AddressService

Fundamentals of Networking Lab
Summary TableSummary Table
15
Property Value
B/W per channel 8.33333333MHz
Channels per recording time 6
Total recording times 4
Total files 24
Time between rows of the matrix 0.0599 seconds
Total time per channel 119.81 seconds
Total time sweeps 2000
FFT size 416
Noise Floor 1.047E-5
Frequency Per Bin 20KHz

Fundamentals of Networking Lab
Channel Occupancy ProbabilityChannel Occupancy Probability
• Estimate the noise floor• Calculate threshold for occupation • Compare 2000x416 with threshold value
– one for occupied and zero otherwise• Sum over 2000 rows and divide by 2000• Result – matrix representing P(i, j)• Repeat for different channel and subchannel
sizes
16

Fundamentals of Networking Lab
Noise FloorNoise Floor
• Channel three is unoccupied
• Sum all of the values in channel three
• Divide by number of values
• Result 1.047x10^-5
17

Fundamentals of Networking Lab
Threshold CalculationThreshold Calculation
18
[1]

Fundamentals of Networking Lab
Pij Across The SpectrumPij Across The Spectrum
• Probabilities of occupancy line up well with FCC spectrum allocation
• Busy channels occur at paging bands 929-932MHz
• Additional activity from 935-940 MHz (Business radios
19

Fundamentals of Networking Lab
ResultsResults
• Most activity recorded on Paging bands• These bands are 929-930 and 931-932 MHz
20

Fundamentals of Networking Lab
929.6125, 929.6625, 931.2125 929.6125, 929.6625, 931.2125
• Bands support paging at UW and Seattle area• 929.6125 Services the UW medical center• Use 4-FSK at 6400 bps• Flex Protocol – standard protocol for paging in
the U.S.• Transmission power is 2000 Watts
21
Fundamentals of Networking Lab
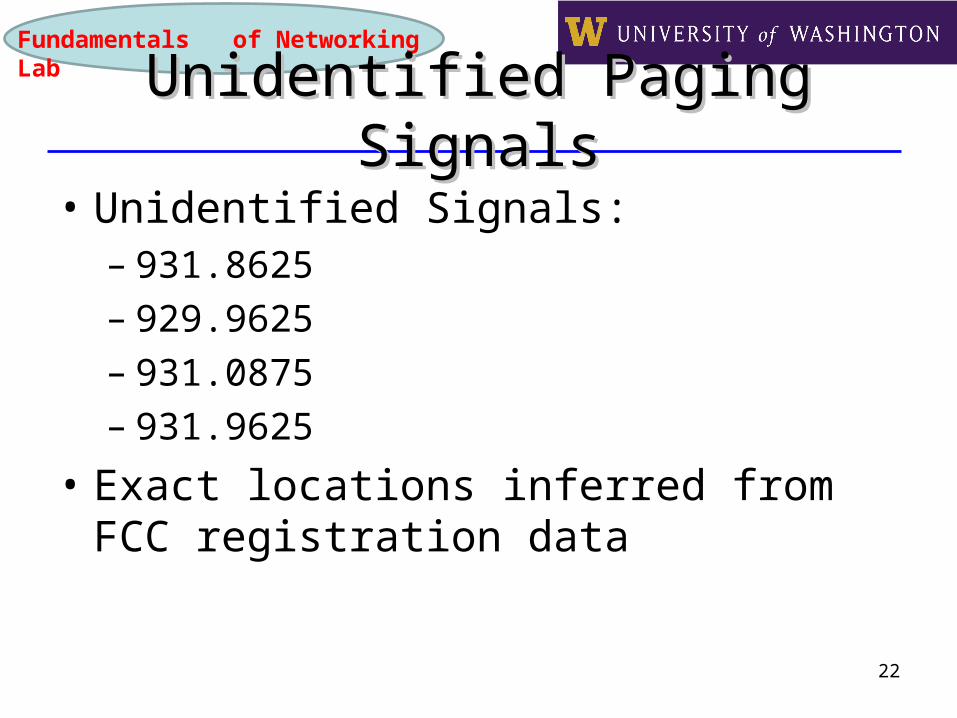
Unidentified Paging SignalsUnidentified Paging Signals
• Unidentified Signals:– 931.8625 – 929.9625 – 931.0875 – 931.9625
• Exact locations inferred from FCC registration data
22

Fundamentals of Networking Lab
CalibrationCalibration
23

Fundamentals of Networking Lab
USRP Noise Figure PlotUSRP Noise Figure Plot
24
[2]

Fundamentals of Networking Lab
Calibration ResultsCalibration Results
• New noise level about 2 dB off -174 dBm
25
X: 46.66 Y: 928.4Index: -172.2RGB: 0, 0, 0.625
Time (s)
Fre
quen
cy (
MH
z)
Channel Four 924-932MHz
0 20 40 60 80 100 120
924
925
926
927
928
929
930
931
932
-170
-165
-160
-155
-150
-145
-140

Fundamentals of Networking Lab
ReferencesReferences1. Danijela Cabric, Artem Tkachenko, and Robert W. Brodersen. 2006. Experimental study of
spectrum sensing based on energy detection and network cooperation. In Proceedings of the first international workshop on Technology and policy for accessing spectrum (TAPAS '06). ACM, New York, NY, USA, , Article 12 . DOI=10.1145/1234388.1234400 http://doi.acm.org/10.1145/1234388.1234400
2. http://code.ettus.com/redmine/ettus/documents/16
26