
Fundamental Difference between Urban People Movement and Urban Goods Movement People Movement...
40
Fundamental Difference between Urban People Movement and Urban Goods Movement • People Movement • Largely single origin-destination • Urban Goods Movement • Largely “tours” consisting of many linked and usually clustered customer trips covering a day’s work. • To/From Cluster & Between Customers. • Customer often specifies time window for service Warehouse Customers
-
date post
21-Dec-2015 -
Category
Documents
-
view
232 -
download
1
Transcript of Fundamental Difference between Urban People Movement and Urban Goods Movement People Movement...

Fundamental Difference between Urban People Movement and Urban Goods Movement
Fundamental Difference between Urban People Movement and Urban Goods Movement
• People Movement • Largely single origin-destination
• Urban Goods Movement• Largely “tours” consisting of many linked and usually clustered
customer trips covering a day’s work. • To/From Cluster & Between Customers.• Customer often specifies time window for service
• People Movement • Largely single origin-destination
• Urban Goods Movement• Largely “tours” consisting of many linked and usually clustered
customer trips covering a day’s work. • To/From Cluster & Between Customers.• Customer often specifies time window for service
Warehouse
Customers

Objective of Pilot Test
• Characterize Manhattan Goods Movement Congestion By Time-of-Day (ToD)– Key aspect is “expected travel time” by location by ToD– Use normalized concept of “Average Speed” by Activity:
• Access to/from Manhattan• Travel between customers in Manhattan
– Receivers tend to be “buyers” of the goods• They substantially influence when the goods are delivered
• Implication:– Value pricing should be focused on the Receiver!!
• Place incentives on Receivers for off-peak receipts of goods!• Place dis-incentives on Receivers for peak hour receipt of goods!

Quantifying ToD and Spatial Congestion
• Method:– Focused on using GPS to objectively measure the
performance of the of the urban freight system– Gather frequent (~ every 5 seconds) GPS
“Breadcrumb” data: ID, Position, Velocity, Date, Time– Analytically segregate customer stop activity from
movement activity• Must be done accurately:
– Congestion can look like a customer stop– A customer stop can look like congestion

GPS Data System
• Zinc II WinMobile SmartPhone w T*Mobile cellular data com running CoPilot Live satNav software – Live updates every 5 seconds on web
• Easy data availability to research team, shipper and receiver
– Backup data archived every second on SmartPhone– Ability to send stop list and messages to driver– Relatively inexpensive
• $300 hardware, $50 software, $40/month short term data plan
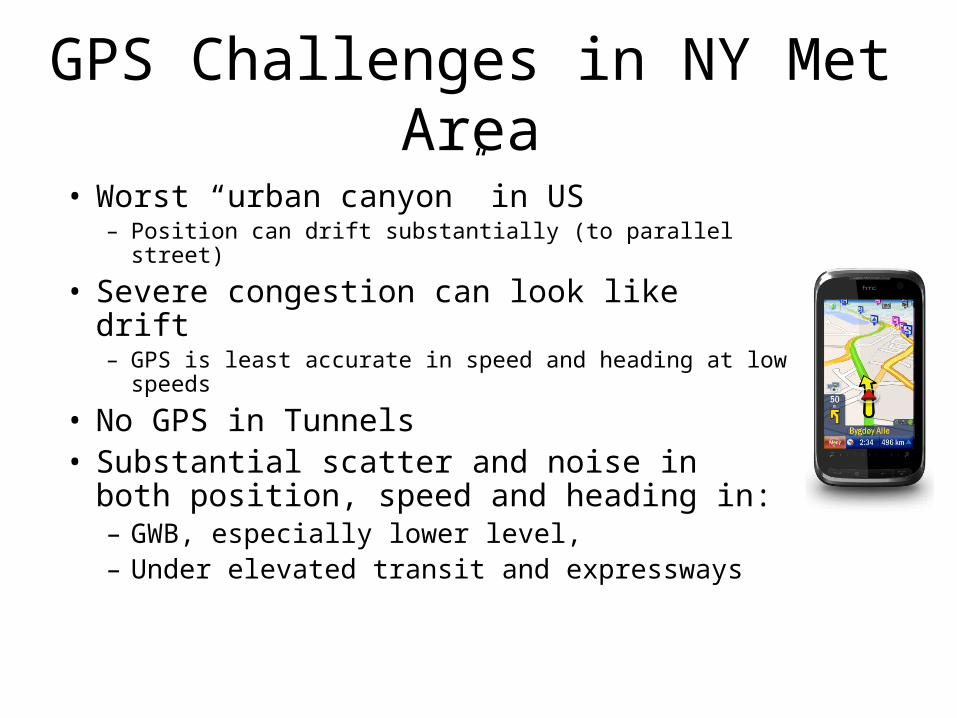
GPS Challenges in NY Met Area
• Worst “urban canyon” in US– Position can drift substantially (to parallel street)
• Severe congestion can look like drift– GPS is least accurate in speed and heading at low speeds
• No GPS in Tunnels• Substantial scatter and noise in both
position, speed and heading in:– GWB, especially lower level,– Under elevated transit and expressways

Preliminary Results from Two Carrier
• Baldor Specialty Foods
• New Deal Logistics (NDL)
Pilot Test:Remote Sensing of Off-Peak Deliveries:
Baldor Specialty Preliminary Results
5 Trucks from Nov 1 through Dec 2, 2009
Alain L. KornhauserDec 4, 2009

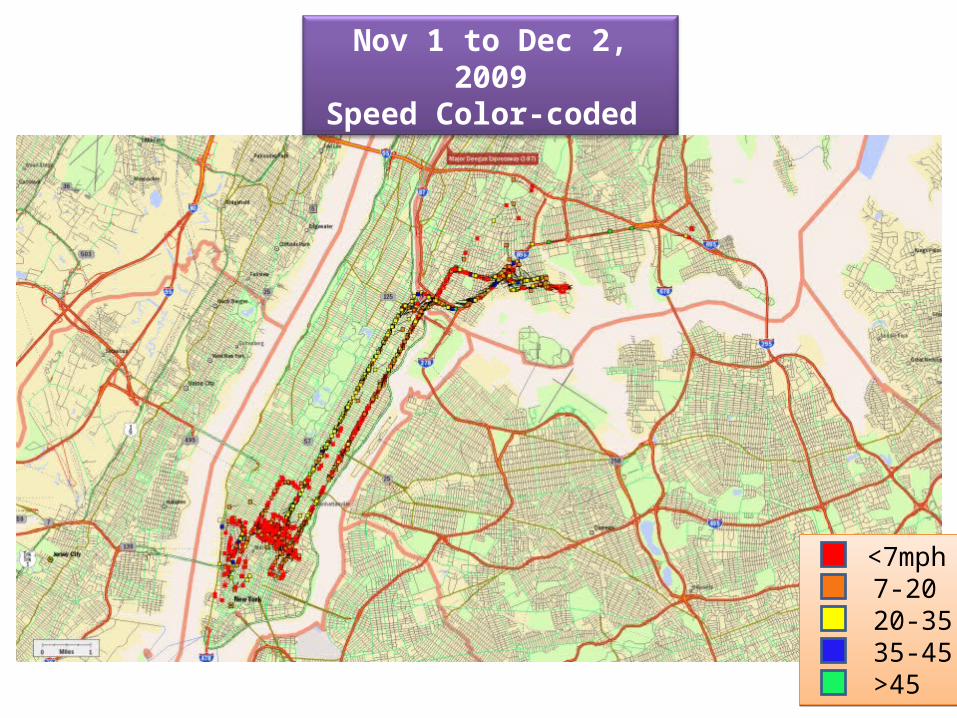
Baldor Total (5 trucks)Nov 1 to
Dec 2, 2009Speed
Color-coded
<7mph 7-20 20-35 35-45 >45
<7mph 7-20 20-35 35-45 >45
<7mph 7-20 20-35 35-45 >45
<7mph 7-20 20-35 35-45 >45
Baldor Truck #1120 Nov 1 to Dec 2, 2009Speed Color-coded
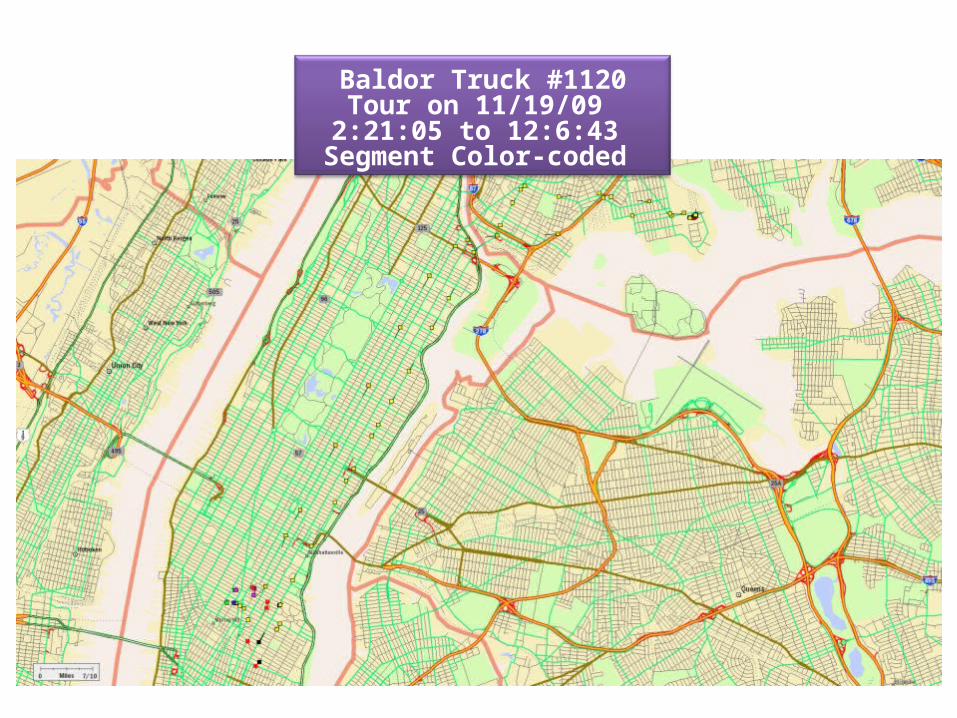
Baldor Truck #1120Tour on 11/19/09 2:21:05 to 12:6:43
Segment Color-coded

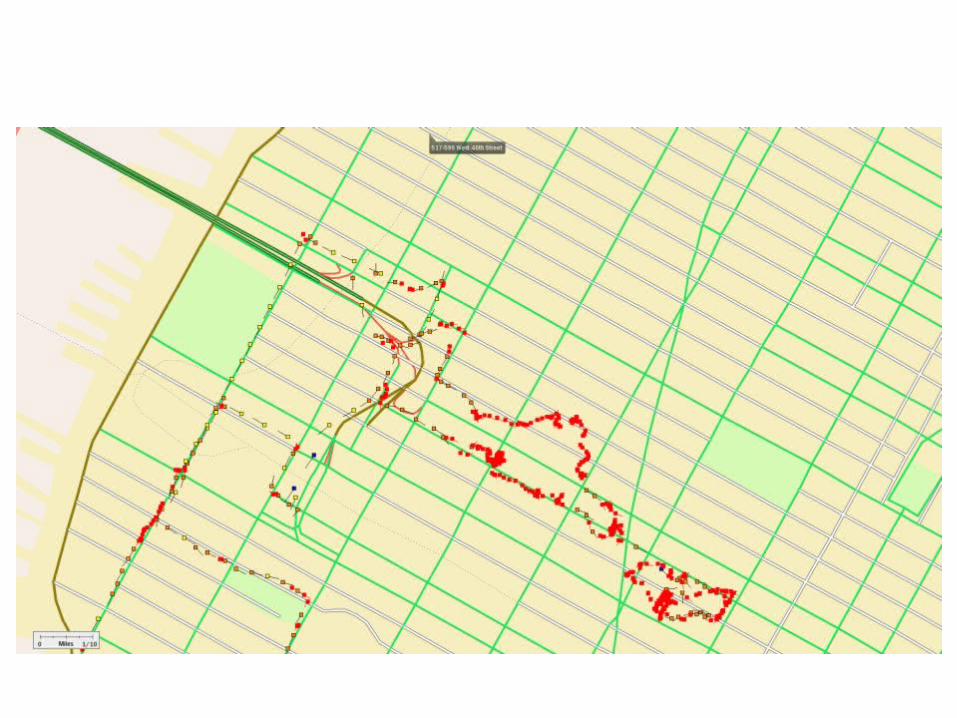
Baldor Truck #1120Tour on 11/19/09 2:21:05 to 12:6:43 Speed Color-coded
Average Speed 8.5 mph
<7mph 7-20 20-35 35-45 >45
<7mph 7-20 20-35 35-45 >45
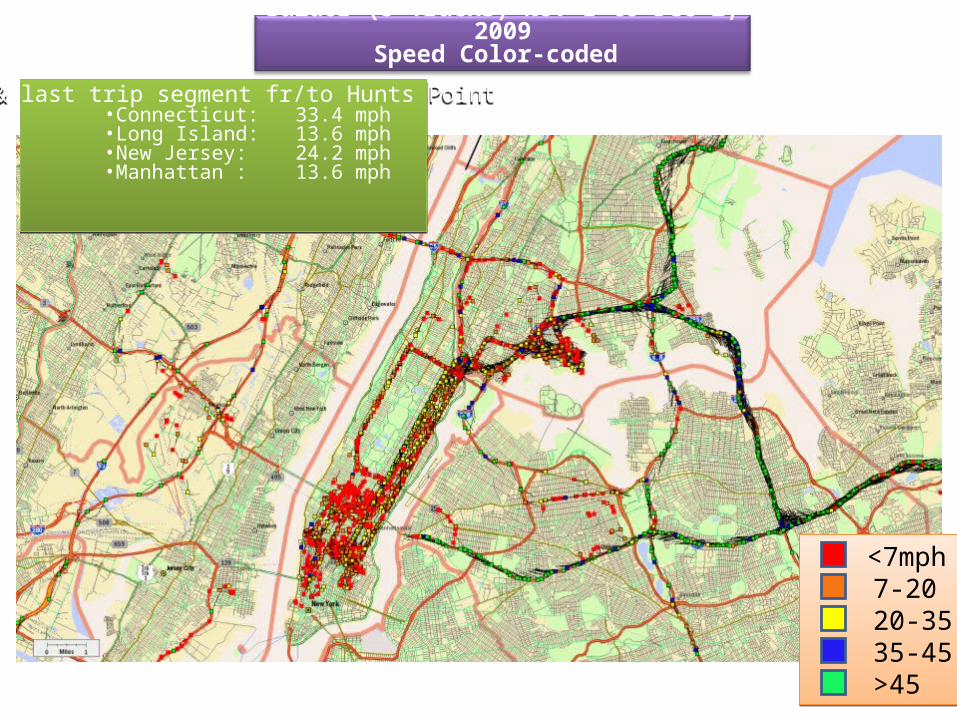
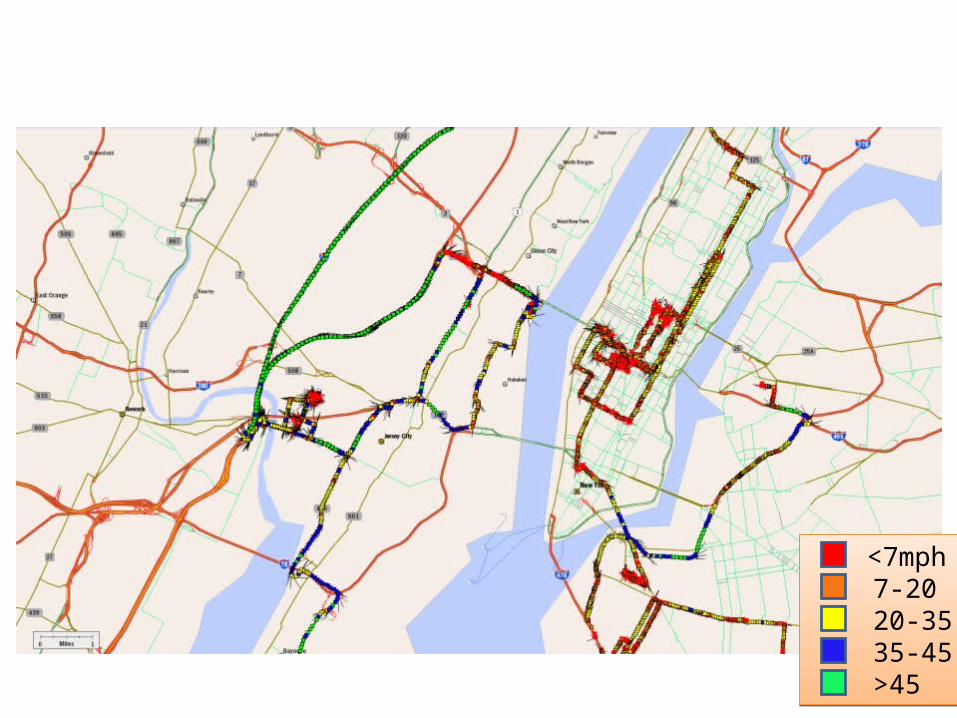
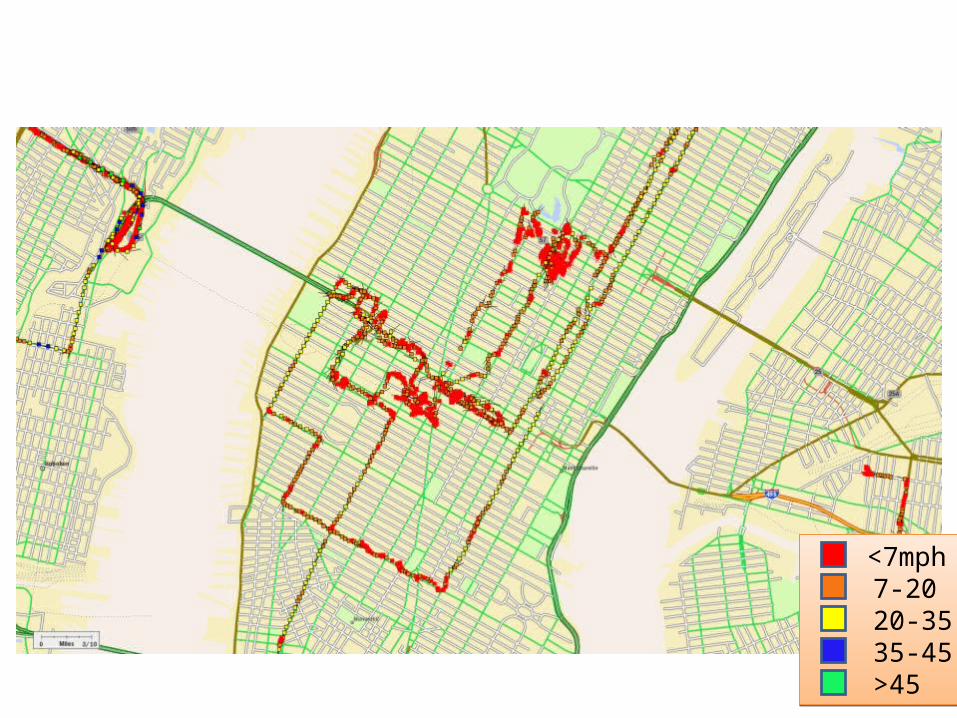
Baldor (5 Trucks) Nov 1 to Dec 2, 2009Speed Color-coded
<7mph 7-20 20-35 35-45 >45
<7mph 7-20 20-35 35-45 >45
1st & last trip segment fr/to Hunts Point•Connecticut: 33.4 mph•Long Island: 13.6 mph•New Jersey: 24.2 mph•Manhattan : 13.6 mph
1st & last trip segment fr/to Hunts Point•Connecticut: 33.4 mph•Long Island: 13.6 mph•New Jersey: 24.2 mph•Manhattan : 13.6 mph

Baldor Truck #931 Nov 1 to Dec 2, 2009Speed Color-coded
<7mph 7-20 20-35 35-45 >45
<7mph 7-20 20-35 35-45 >45

<7mph 7-20 20-35 35-45 >45
<7mph 7-20 20-35 35-45 >45
Baldor Truck #1040 Nov 1 to Dec 2, 2009Speed Color-coded

Pilot Test:Remote Sensing of Off-Peak Deliveries:
New Deal Logistics Preliminary Results
Initial use of 4 CoPilot | Live SmartPhones from Oct 2 through Oct 14, 2009
Alain L. KornhauserOct 19, 2009

NDL Total ; Speed Color-coded NDL Total ; Speed Color-coded
<7mph 7-20 20-35 35-45 >45
<7mph 7-20 20-35 35-45 >45
NDL2; Speed:
<7mph 7-20 20-35 35-45 >45
<7mph 7-20 20-35 35-45 >45
NDL2; Speed:
<7mph 7-20 20-35 35-45 >45
<7mph 7-20 20-35 35-45 >45

NDL2; Speed:
<7mph 7-20 20-35 35-45 >45
<7mph 7-20 20-35 35-45 >45
NDL1; Speed:

NDL1; Speed:
NDL1; Speed:
NDL2; P&D Stops:

NDL2; Speed:
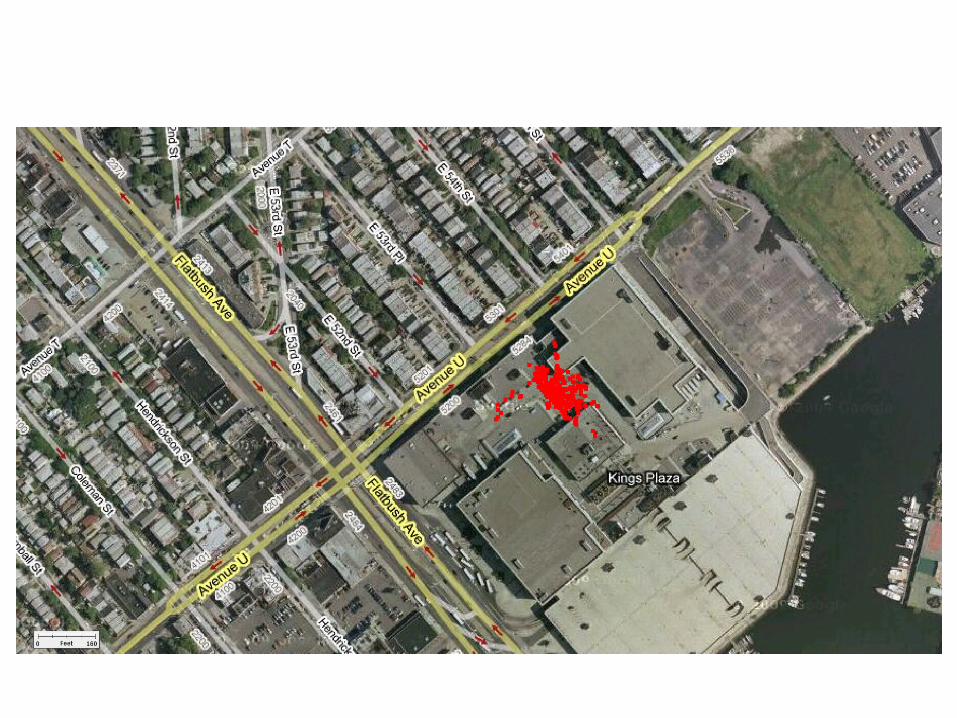
NDL2; P&D Stops: Kings Plaza

Tour Stop Segments Lincoln 8AM
Oct 5, 2009

Device ID Trip # GPS Points
#
Date(m/d/yr)
Start Time (h:m:s)
End Time (h:m:s)
Dist.(Miles)
Av. Speed(MPH)
Stop Duration
(Hrs)
NDL1 5 831 10/05/09 8:10:16 9:30:27 12.27 9.2 eod
<7mph 7-20 20-35 35-45 >45
<7mph 7-20 20-35 35-45 >45

Tour Stop Segments – Lincoln 8AMOct 2, 2009

Device ID Trip # GPS Points
#
Date(m/d/yr)
Start Time (h:m:s)
End Time (h:m:s)
Dist.(Miles)
Av. Speed(MPH)
Stop Duration
(Hrs)
NDL1 3 440 10/02/09 7:56:27 8:42:01 12.33 16.2 0.30
<7mph 7-20 20-35 35-45 >45
<7mph 7-20 20-35 35-45 >45

Device ID Trip # GPS Points
#
Date(m/d/yr)
Start Time (h:m:s)
End Time (h:m:s)
Dist.(Miles)
Av. Speed(MPH)
Stop Duration
(Hrs)
NDL1 4 38 10/02/09 9:00:16 9:03:39 0.28 5.0 eod
<7mph 7-20 20-35 35-45 >45
<7mph 7-20 20-35 35-45 >45

Tour Stop Segments – Lincoln 8AM - Wall St
Oct 7, 2009

Device ID Trip # GPS Points
#
Date(m/d/yr)
Start Time (h:m:s)
End Time (h:m:s)
Dist.(Miles)
Av. Speed(MPH)
Stop Duration
(Hrs)
NDL1 7 405 10/07/09 8:17:01 8:53:24 12.97 21.4 0.19
<7mph 7-20 20-35 35-45 >45
<7mph 7-20 20-35 35-45 >45

Device ID Trip # GPS Points
#
Date(m/d/yr)
Start Time (h:m:s)
End Time (h:m:s)
Dist.(Miles)
Av. Speed(MPH)
Stop Duration
(Hrs)
NDL1 8 405 10/07/09 9:04:55 9:36:04 4.96 9.6 eod
<7mph 7-20 20-35 35-45 >45
<7mph 7-20 20-35 35-45 >45
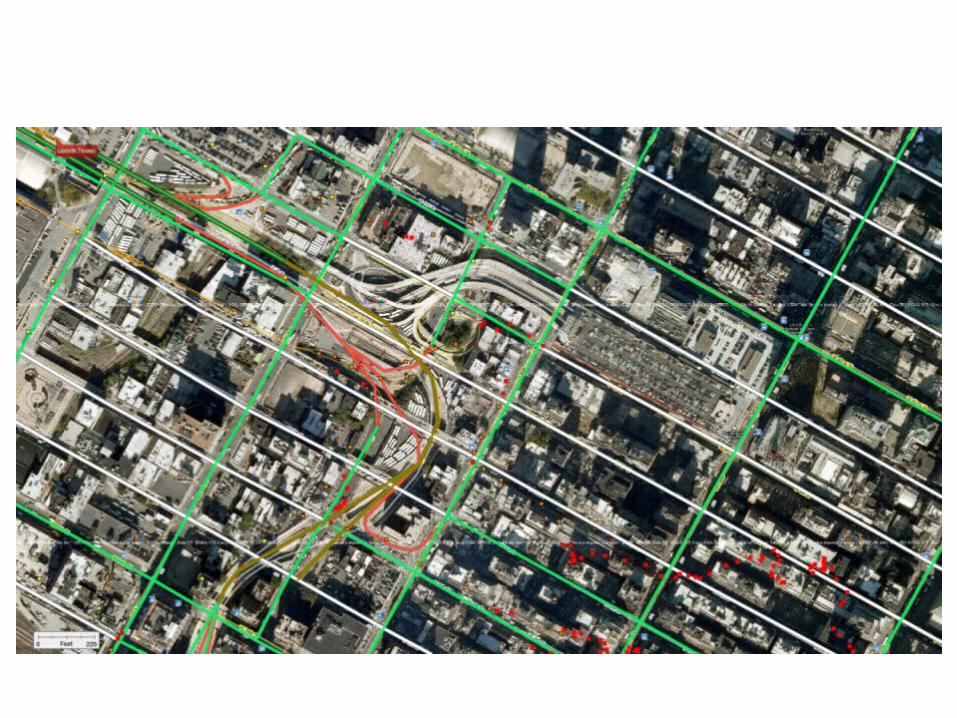
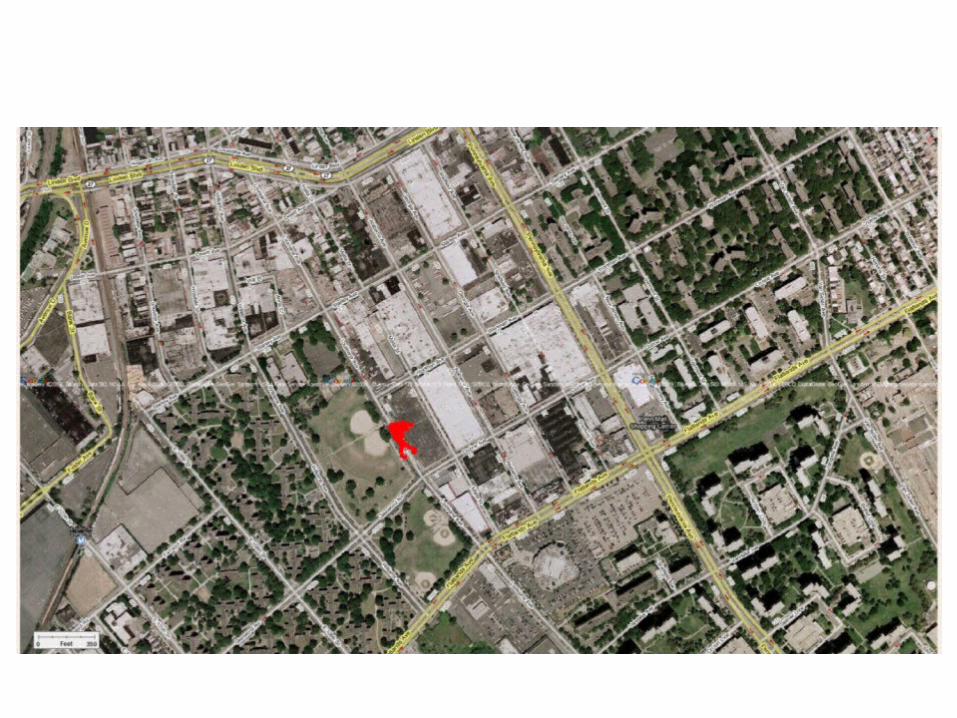
Tour Stop Segments – Lincoln 8PM Oct 7, 2009

Device ID Trip # GPS Points
#
Date(m/d/yr)
Start Time (h:m:s)
End Time (h:m:s)
Dist.(Miles)
Av. Speed(MPH)
Stop Duration
(Hrs)
NDL3 88 654 10/14/09 20:15:10 21:13:37 16.15 16.6 4.13

Tour Stop Segments – Lincoln 5pmOct 13, 2009
Device ID Trip # GPS Points
#
Date(m/d/yr)
Start Time (h:m:s)
End Time (h:m:s)
Dist.(Miles)
Av. Speed(MPH)
Stop Duration
(Hrs)
NDL1 15 986 10/13/09 17:53:45 19:25:59 16.8 10.9 eod
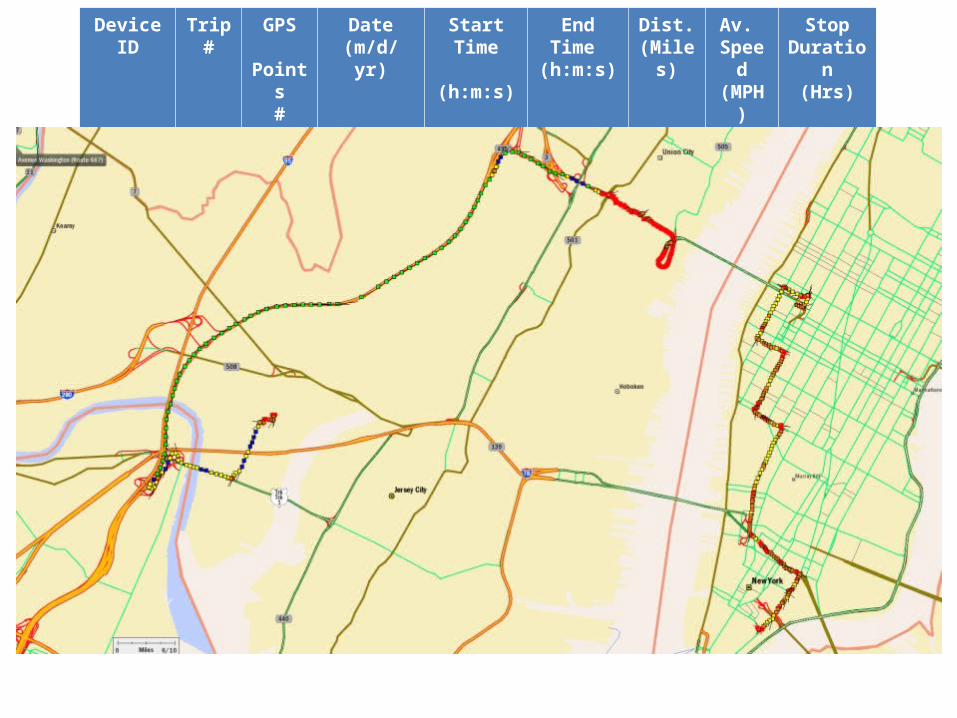
Tour Stop Segments – GWB – 7AMOct 2, 2009
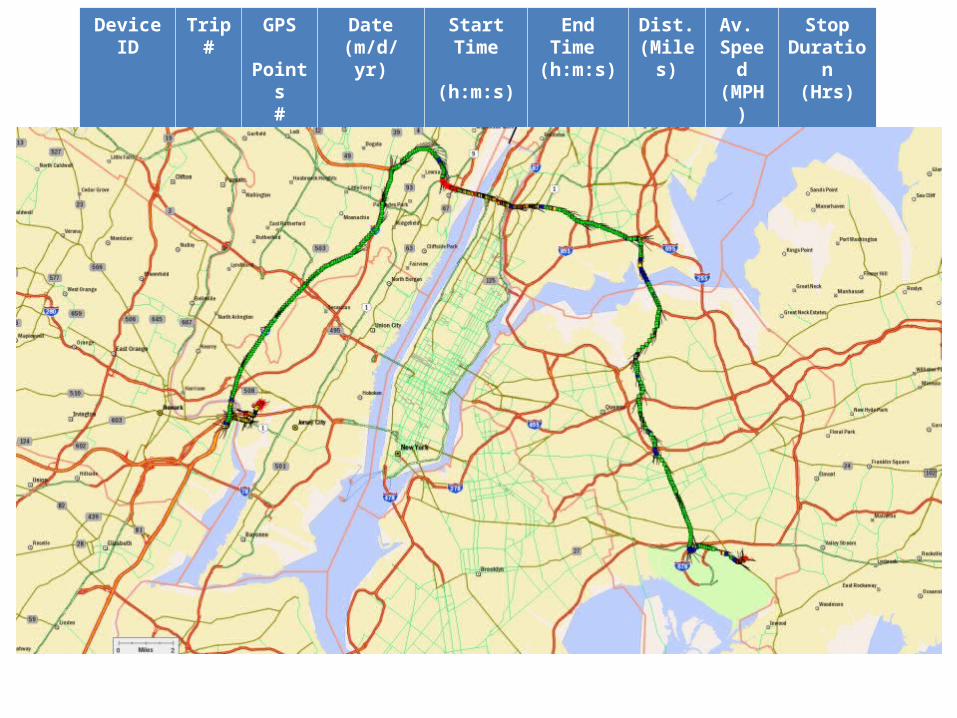
Device ID Trip # GPS Points
#
Date(m/d/yr)
Start Time (h:m:s)
End Time (h:m:s)
Dist.(Miles)
Av. Speed(MPH)
Stop Duration
(Hrs)
NDL2 19 774 10/02/09 6:53:22 8:05:44 39.5 32.8 2.06

Average Stop–Stop Speeds (MPH) by Time-of-Day for Major Tour Segments
Preliminary results from Pilot Test (Oct 2- Oct 14, 2009)
Tour Stop Segment Type
AM Peak (6am -9am)
MidDay (9am - 3pm)
PM Peak (3pm -7pm)
Overnight(7pm – 6am)
Jersey Depot – 1st Stop in Manhattan
11.8 NA 11.5 20.2
Intra- Manhattan stop
9.1 6.9 6.7 10.1
Stops Btwn Outer Boroughs
NA 10.3 15.2 NA
Jersey Depot – Outer Boroughs
30.4 26.2 20.8 NA
Intra NJ Stops 21.4 30.2 27.3 NA


