FUND MANAGER’S REPORT - ablamc.com1).pdf · FUND MANAGER'S REPORT, NOV 2017 BASIC FUND...
16
FUND MANAGER’S REPORT NOVEMBER 2017 FUND FOCUS A Wholly Owned Subsidiary of
-
Upload
truongkhanh -
Category
Documents
-
view
218 -
download
1
Transcript of FUND MANAGER’S REPORT - ablamc.com1).pdf · FUND MANAGER'S REPORT, NOV 2017 BASIC FUND...

FUNDMANAGER’S
REPORTNOVEMBER 2017
FUNDFOCUS
A Wholly Owned Subsidiary of

FUND MANAGER'SREPORT, NOV 2017
CPI for the month of November 2017 clocked in at 3.97%YoY (+0.37%MoM), versus 3.80%YoY recorded in October 2017. The monthly increase is due to surge in Motor Fuel (+2.22%MoM), Education Fee (+1.39%MoM) and Chicken (1.95%MoM). Overall, 5MFY18 average CPI now stands at 3.59%YoY compared to 3.92%YoY in the SPLY. Despite the increase in workers’ remittances to USD1.7 billion, external account position continued to remain under pressure amid increase in trade deficit to USD2.5 billion owing to increase in imports from USD3.9 billion in September 2017 to USD4.4 billion in October 2017. Current Account Deficit (CAD)for the year till date reached USD5.0 billion (up 122%YoY) as compared to USD2.3 billion during SPLY. FX reserves remained at USD19.7 billion during the period, keeping the exchange rate stable against the greenback. On the fiscal front, Federal Board of Revenue(FBR)
provisionally collected taxes worth PKR100 billion during November 2017, significantly lower than PKR271 billion in previous month. Cumulatively, tax collections stood at PKR1,124 billion in 5MFY18 (up 5%YoY). Moreover, Pakistan has issued a 10 year USD1.5 billion Eurobond at 6.875% and a 5 year USD1.0 billion Sukuk at 5.625%. The issuance would take State Bank of Pakistan(SBP) FX reserves to ~USD16 billion, taking import cover to 3.5 months versus less than 3 months at present. Going forward, market is expected to remain range-bound as concerns related to PKR/USD devaluation have largely succumbed due to successful issuance of Sukuk and Eurobond. We expect that this would provide comfort to the investors and would act as a catalyst, for now, to deal with the Balance of payment issue.
Issuance of Sukuk and EurobondECONOMY AND CAPITAL MARKETS UPDATE
During the month, money market traded close to the target rate amid regular liquidity injections (8x OMO injections) by SBP at close to policy rate. Open Market Operations(OMO) maturity witnessed a slight increase in maturity size to PKR1,588 billion at month end compared to PKR1,375 billion last month. Investors remained biased towards short term bills as evident by a massive cumulative participation of PKR1,885 billion in T-bills auctions versus a target of PKR1,200 billion, which was mainly concentrated in 3 months paper. The central bank accepted total bids worth PKR1,310 billion with cutoff rates unchanged from the previous month. Interest in
Pakistan Investment Bond(PIB) remained extremely lackluster as the SBP received bids of only PKR22 billion against a target of PKR50 billion. The central bank remained resilient over high cost borrowing and rejected all bids. On the monetary front, CPI reading for November remained in-line with expectation. Secondary market yields in the shorter tenors remained relatively flat but witnessed a slight correction in the longer tenor. Moving ahead, market is expected to remain range-bound in near term given a stable interest rates scenario.
Status-Quo
The KSE-100 Index closed on a positive note in November 2017, reaching a level of 40,010 and posting a 1%MoM return. Initially, the bourse witnessed an upward trend rising by 5.5%, before political uncertainty came into play dragging the index down. More specifically, the benchmark index is down by 16%CYTD and 24% from its peak level of 52,876 on May 24, 2017. The political unrest was derived by three week long sit-in which took place in Islamabad and erupted across Pakistan after government conducted a failed operation. At last, the government had to come to terms with the protesters and the law minister resigned. Other key happenings during the month included MSCI rebalancing where ENGRO was excluded from MSCI EM index. On a sectoral front, Exploration & Production(E&P) sector outperformed the index by posting return of 6.0% in the period taking benefit from resurgence of oil prices as political uncertainty gripped the Middle-East. On the other hand, major laggards of the index were Power and Oil Marketing Companies(OMC) sectors which dragged the index by a total of 216 points. These sectors remained under pressure as government
decided to shut down Furnace Oil(FO) based power plants. Scrip wise, major contributors to the index performance were OGDC, PPL, and MCB adding 157, 92, and 81 points, respectively. Contrarily, PSO, ENGRO, and HUBC dragged the index by 92, 52, and 49 points during November 2017. Foreigners remained net sellers of USD52 million worth of shares during November 2017 versus USD23 million in October 2017. Sector wise major foreign selling took place in Fertilizers (USD34.5 million), Commercial banks (USD21 million) and Cements (USD7 million). On the other hand, net foreign inflow was witnessed in sectors like OMC’s (USD9.1 million), E&P (USD7.1 million) and Textiles (USD1.9 million) which will be prime beneficiary of PKR/USD devaluation. Insurance sector and companies were major net buyers by investing USD20 million and USD18 million, respectively. On the volumetric front, average daily volumes declined by 22%MoM to 115 million shares in November 2017 while average daily value traded clocked in at USD59 million, down by 17%MoM. Pakistan is trading at a forward P/E of 8.6x with a dividend yield of 6.0%.
Continued Political Uncertainty
ECONOMIC SUMMARY
CPI Inflation
Trade Deficit (USD mn)
Remittances (USD mn)
Current A/C (USD mn)
FDI (USD mn)
Tax Collection ** (PKR bn)
M2 Growth*
FX Reserves* (USD bn)
November
October
October
October
October
November
November
November
3.97%
(2,462)
1,654
(1,315)
278
100
3.80%
(2,224)
1,294
(1,097)
205
271
3.95%
(9,739)
6,445
(5,013)
941
1,124
(0.46%)
19.7
LastReported
MonthCurrentMonth
PreviousMonth YTD
Source SBP, FBS
* Latest monthly figures
** Provisional figures
EQUITY MARKET PERFORMANCE
KSE - 100 Index
Avg. Daily Vol. (mn)
Avg. Daily Val. (USD mn)
2017E PE(X)
2017E DY
Source: KSE, Bloomberg
40,010
115
59
8.6
6.0%
39,617
148
71
1.0%
(22%)
(17%)
39,617
71
35
52,876
607
509
Nov-17 Oct-17 M/M 1 YrLow
1 YrHigh
IN FOCUS
GOVERNMENT SECURITIES
PKRV Yields (%)
November 30, 2017
October 31, 2017
Change (bps)
Source : FMA
6 M
6.01
6.01
0
1 Yr
6.03
6.03
0
3 Yr
6.94
6.95
(1)
5 Yr
7.55
7.61
(6)
10 Yr
8.29
8.30
(1)

IN FOCUS ABL INCOMEFUND
For the month of Nov’17, ABL Income Fund posted a return of 4.11% against the benchmark return of 6.18% therefore underperforming the benchmark by 207bps. On YTD basis, the fund’s return stood at 4.58% against the benchmark return of 6.16 %. Fund's size as at November 30th, 2017 stood at PKR 4,319 Million.At month end, the total exposure in Cash, TDRs and TFCs stood at 63.56%, 8.60% and 23.79% respectively as compared to 63.21%, 8.71% and 22.16% at the end of Oct'17. Total exposure in Government Guranteed TFCs stood at 1.85%.
The Fund's weighted average maturity at the end of Nov'17 stood at 543 days as compared to 522 days at the end of Oct'17The Scheme has maintained the provision against Sindh Workers’ Welfare Fund’s Liability to the tune of Rs 4.182 million, had the same not been made, the NAV per unit of the scheme would have been higher by Rs. 0.0099 per unit. The Scheme has also maintained Total expense ratio (TER) 0.85% (0.14% representing Government Levies and SECP Fee etc).
To earn superior risk adjusted rate of return by investing in a blend of short, medium and long term instruments, both within and outside Pakistan.INVESTMENT OBJECTIVE
FUND MANAGER'S COMMENTS
Alee Khalid Ghaznavi - CEO Saqib Matin, ACA - CFO & CSKashif Rafi - CIOFahad Aziz, Fund ManagerM. Abdul Hayee, CFA - Fund ManagerAniel Victor - Head of Risk Management
Investment Committee Members:
FUND MANAGER'SREPORT, NOV 2017
BASIC FUND INFORMATIONFund TypeCategoryLaunch DateNet AssetsNet Assets (Excluding FoF Investments)
NAVBenchmarkDealing DaysCut-off timePricing MechanismManagement FeesFront -end LoadTrusteeAuditorAsset Manager RatingRisk Profile of the FundFund Stability RatingFund ManagerListing
Open-endIncome SchemeSeptember 20th, 2008PKR 4319.00 mn as at November 30,2017PKR 3487.07mn as at November 30,2017PKR 10.2282 as at November 30,20176 Months KIBORAs Per Banking Days4:00 PMForward1.50 % p.a1.50%Central Depository Company of Pakistan Ltd (CDC)A.F. Ferguson - Chartered AccountantsAM2 + (Stable Outlook) (JCR-VIS)LowA(f) (JCR-VIS)Fahad AzizPakistan Stock Exchange
"Disclaimer: This publication is for informational purposes only and nothing here in should be construed as a solicitation, recommendation or an offer to buy or sell any fund. All Investments in mutual funds are subject to market risks. The NAV based prices of units and any dividends /returns there on are dependent on forces and factors affecting the capital markets. These may go up or down based on market conditions . Past performance is not necessarily indicative of future results. Please read the offering document to understand the investment policies and the risk involved including risk disclosures for special features.
ABL-IF
Benchmark
*Funds returns computed on NAV to NAV with the dividend reinvestment (excluding sales load)
4.11%
6.18%
4.58%
6.16%
0.99%
0%
(0.17%)
406.57
(0.55%)
N/A
Nov - 30,2017 YTD* St. Dev** Sharpe
Ratio** Alpha***
PERFORMANCE
3 month
ABL-IFBenchmark
4.86%6.16%
4.99%6.16%
5.79%6.14%
8.51%6.71%
9.86%7.86%
15.39%10.2%
6 month 1 Year 3 Year 5 Year Since Inception
*Funds returns computed on Simple annualized basis / Performance data does not include cost incurred by investor in the form of sales load
TECHNICAL INFORMATION
Leverage Weighted average time to maturity of net assets
NIL 543
*DETAILS OF NON-COMPLIANT INVESTMENT WITH THE INVESTMENT CRITERIA OF ASSIGNED CATEGORY
Name of Entity Exposure Type % of Net Assets Limit Excess - - 0% 0% 0%
TOP TFCs / SUKUK HOLDING (% OF TOTAL ASSETS) November 30, 2017
JS BANK LTD - TFCMCB Bank TFC II (Formerly NIB BANK LTD TFC II)THE BANK OF PUNJAB -TFCJSCL TFCDHCL SUKUKWAPDA TFCBANK ALFALAH LTD -TFC VASKARI BANK LTD-TFC VASKARI BANK LTD-TFC IV Total
5.72%5.21%4.24%3.53%1.93%1.85%1.54%1.51%0.12%
25.64%
CashPlacements with Banks(TDRs)TFCsGoP Guaranteed Corp. Instruments Commercial PaperT-BillsGoP Ijara Sukuk Others including ReceivablesTotal
63.21%8.71%
22.16%1.88%2.32%0.02%0.00%1.70%
100.00%
63.56%8.60%
23.79%1.85%0.00%0.02%0.28%1.90%
100.00%
October 31,2017
November 30,2017ASSET ALLOCATION
PORTFOLIO QUALITY (% OF TOTAL ASSETS)
Credit Quality of Portfolio (% of Assets)
Amount Invested by Fund of Funds is Rs. 831.92 million
-6%-4%-2%0%2%4%6%8%
10%12%14%
30-N
ov-1
6
14-D
ec-1
6
28-D
ec-1
6
11-Ja
n-17
25-Ja
n-17
8-Fe
b-17
22-F
eb-1
7
8-M
ar-1
7
22-M
ar-1
7
5-Ap
r-17
19-A
pr-1
7
3-M
ay-1
7
17-M
ay-1
7
31-M
ay-1
7
14-Ju
n-17
28-Ju
n-17
12-Ju
l-17
26-Ju
l-17
9-Au
g-17
23-A
ug-1
7
6-Se
p-17
20-S
ep-1
7
4-O
ct-1
7
18-O
ct-1
7
1-N
ov-1
7
15-N
ov-1
7
29-N
ov-1
7
ABL IF 6 Months KIBOR
Gov't Securities, 0.29%
AAA,15.82%
AA+,3.86% AA,3.65%
AA-,68.75%
A+,5.72% Unrated / Others,1.91%

IN FOCUS ABL STOCKFUND
ABL-SF slightly decreased by 0.02% in November 2017 against 0.99% increase of the benchmark, reflecting an underperformance of 101 basis points. During the period under review, allocation to Oil & Gas Marketing Companies decreased from 11.49% to 6.33%. As at November 30, 2017, ABL-SF was 83.62% invested in equities and remaining in bank deposits.The KSE-100 Index improved by 0.99% in November 2017 mainly owning to Oil & Gas sector which performed well during past one month on account of surge in international oil prices. However, an announcement by government to shut down FO based power plants put downward pressure on Power sector. Besides, a sit-in staged by religious political parties in reaction of parliament’s decision regarding removal of
oath on Khatam-e-Nabuwat clause from constitution dampened the market sentiment. In the long-run, positive stance is intact based on strong corporate earnings, abundant domestic liquidity and attractive valuation. The Scheme has maintained the provision against Sindh Workers’ Welfare Fund’s Liability to the tune of Rs. 56.6million, had the same not been made, the NAV per unit of the scheme would have been higher by Rs. 0.123 per unit.The Scheme has total expense ratio (TER) of 1.37% (0.19% representing Government Levies and SECP Fee etc.). TER also includes the provision of sales & marketing expenses with 0.4% p.a. of Net Assets amounting to PKR 11.76 million.
To provide higher risk adjusted returns over the long term by investing in a diversified portfolio of equity instruments offering capital gain and dividends. INVESTMENT OBJECTIVE
FUND MANAGER'S COMMENTS
FUND MANAGER'SREPORT, NOV 2017
BASIC FUND INFORMATIONOpen-end Equity Scheme June 27th, 2009 Rs 6345.64mn as at November 30, 2017 Rs 5659.81mn as at November 30, 2017 Rs 13.785 as at November 30, 2017 KSE-100 Index As Per Local Stock Exchanges 4:00 PM Forward 2% p.a 2% Central Depositary Company of Pakistan Limited M/S. A.F. Ferguson & Co, Chartered Accountants AM2+ (Stable outlook) (JCR-VIS) High MFR 4-Star (JCR VIS) (Based on one Year weighted average ranking),MFR 3-Star (JCR VIS) (Based on Three Year Weighted average ranking)MFR 4-Star (JCR VIS) (Based on Five Year Weighted average ranking)for the period ended December 31,2015. Muhammad Abdul Hayee, CFA Pakistan Stock Exchange
ABL-SF
Benchmark
*Funds returns computed on NAV to NAV with the dividend reinvestment (excluding sales load) ** 12M Trailing Data
-0.02%
0.99%
(18.40%)
(14.08%)
19.09%
17.72%
1.04
1.00
(0.64%)
N/A
Stock/EquitiesBank BalancesT-BillsOthersLeverageTotal
87.93%10.82%
0.00%1.25%
NIL100.00%
83.62%14.73%
0.00%1.65%
NIL100.00%
October 31,2017
November 30,2017ASSET ALLOCATION
SECTOR ALLOCATION (% OF TOTAL ASSETS)
"Disclaimer: This publication is for informational purposes only and nothing here in should be construed as a solicitation, recommendation or an offer to buy or sell any fund. All Investments in mutual funds are subject to market risks. The NAV based prices of units and any dividends /returns there on are dependent on forces and factors affecting the capital markets. These may go up or down based on market conditions . Past performance is not necessarily indicative of future results. Please read the offering document to understand the investment policies and the risk involved including risk disclosure for special feature.
3 month
ABL-SFBenchmark
(6.80%)(2.90%)
(25.36%)(20.91%)
(5.92%)(6.13%)
42.20%28.25%
170.55%141.41%
579.87%458.57%
6 month 1 Year 3 Year 5 Year Since Inception
*Funds returns computed on Absolute basis. Performance data does not include cost incurred by investor in the form of sales load.
Fund Type Category Launch Date Net Assets Net Assets (Net of FoF Investments)
NAV Benchmark Dealing Days Cut-off time Pricing Mechanism Management Fee Front -end Load Trustee Auditor Asset Manager Rating Risk Profile of the Fund Performance Ranking
Fund Manager Listing
TOP TEN HOLDINGS (% OF TOTAL ASSETS) October 31, 2017 November 30, 2017
Mari Petroleum Company LimitedI.C.I. Pakistan LimitedUnited Bank LimitedPakistan State Oil Company LimitedOil and Gas Development Co. Ltd.Engro Fertilizers LimitedPackages LimitedD.G. Khan Cement Company LimitedMCB Bank LimitedInternational Steels Limited
5.89%4.72%4.60%4.54%4.41%3.74%3.53%3.46%3.38%3.14%
5.92%4.67%3.85%4.30%4.70%3.15%4.33%3.49%3.78%3.41%
Amount invested by Fund of Fund is Rs. 685.84mn
Nov - 30,2017* YTD* St. Dev** Beta** Alpha
PERFORMANCE
-10%
0%
10%
20%
30%
40%
1-Dec-16
15-Dec-16
29-Dec-16
12-Jan-17
26-Jan-17
9-Feb-17
23-Feb-17
9-Mar-17
23-Mar-17
6-Apr-17
20-Apr-17
4-May-17
18-May-17
1-Jun-17
15-Jun-17
29-Jun-17
13-Jul-17
27-Jul-17
10-Aug-17
24-Aug-17
7-Sep-17
21-Sep-17
5-Oct-17
19-Oct-17
2-Nov-17
16-Nov-17
30-Nov-17
KSE-100 ABL SF
Bank Balance & OthersOil & Gas Exploration Companies
Commercial BanksCement
FertilizerOil & Gas Marketing Companies
Automobile AssemblerEngineering
ChemicalPaper & Board
Power Generation & DistributionAutomobile Parts & Accessories
InsuranceTextile Composite
PharmaceuticalsRefinery
Leather & TanneriesSugar & Allied Industries
0% 5% 10% 15% 20%
0.13%0.29%
0.98%1.57%
1.85%2.54%
2.87%3.37%3.53%
4.72%5.58%
6.08%6.33%
6.54%8.08%
13.35%15.80%
16.38%
Alee Khalid Ghaznavi - CEO Saqib Matin, ACA - CFO & CSKashif Rafi - CIOFahad Aziz, Fund ManagerM. Abdul Hayee, CFA - Fund ManagerAniel Victor - Head of Risk Management
Investment Committee Members:

IN FOCUS ABL CASHFUND
For the month of Nov’17, ABL Cash Fund posted a return of 5.14% against the benchmark return of 5.19%. On year-to-date basis, the fund posted a return of 5.31% against the benchmark return of 5.18% thereby outperforming the benchmark by 13 basis points. Fund's size as at November 30, 2017 stood at PKR 14,696.55 Million.On the Asset Allocation side, exposure in cash during the month of November 2017 reduced to 45.96% from 46.76% at the end of Oct’2017. At month end exposure in TDRs reduced to 15.68% from 16.84% at the end of Oct'2017 respectively. Going forward the fund will continue to maintain a higher level of exposure in Cash & TDRs owing to better returns at year end. The exposure in T-bills shall be maintained
at lower end of the fund, simultaneously the fund will continue to look for opportunities in the LOP market. At month end, fund’s weighted average maturity stood at 33.62 days.The Scheme has maintained the provision against Sindh Workers’ Welfare Fund’s Liability to the tune of Rs. 3.526 million, had the same not been made, the NAV per unit of the scheme would have been higher by Rs. 0.0025 per unit. The Scheme has also maintained Total expense ratio (TER) 0.48% (0.09% representing Government Levies, SECP Fee etc).
To earn superior risk adjusted rate of return by investing in a blend of short, medium and long term instruments, both within and outside Pakistan.INVESTMENT OBJECTIVE
FUND MANAGER'S COMMENTS
FUND MANAGER'SREPORT, NOV 2017
BASIC FUND INFORMATIONFund TypeCategoryLaunch DateNet AssetsNet Assets (Excluding FoF investments)
NAVBenchmark Dealing DaysCut-off timePricing MechanismManagement Fees Front -end LoadTrusteeAuditorAsset Manager RatingRisk Profile of the FundFund Stability RatingFund ManagerListing
Open-endMoney Market SchemeJuly 31st, 2010PKR 14696.55 mn as at November 30, 2017PKR 14696.55 mn as at November 30, 2017PKR 10.2762 as at November 30, 201770%-Avg of 3M PKRV rates + 30% 3M Avg DepositRate of 3 AA rated banksAs Per Banking Days4:00 PMBackward10% of gross earnings subject to a minimum fee of 0.75% anda maximum fee of 1.00% of average daily net assetsNilCentral Depository Company of Pakistan Ltd (CDC)A.F. Ferguson - Chartered AccountantsAM2 + (Stable Outlook) (JCR-VIS)LowAA(f) (JCR-VIS)Fahad AzizPakistan Stock Exchange
ABL-CF
Benchmark
*Funds returns computed on NAV to NAV with the dividend reinvestment (excluding sales load) ** 12M Trailing Data ***3MPKRV used as RFR
5.14%
5.19%
5.31%
5.18%
2.4%
0%
1.10
(222.91)
3.23%
N/A
CashPlacements with Banks(TDRs)T-BillsCommercial PaperOthers including ReceivablesTotal
46.76%16.84%34.93%
0.68%0.79%100%
45.96%15.68%37.61%
0%0.75%100%
October 31,2017
November 30,2017ASSET ALLOCATION
PORTFOLIO QUALITY (% OF TOTAL ASSETS)
"Disclaimer: This publication is for informational purposes only and nothing here in should be construed as a solicitation, recommendation or an offer to buy or sell any fund. All Investments in mutual funds are subject to market risks. The NAV based prices of units and any dividends /returns there on are dependent on forces and factors affecting the capital markets. These may go up or down based on market conditions . Past performance is not necessarily indicative of future results. Please read the offering document to understand the investment policies and the risk involved including risk disclosures for special features.
3 month
ABL-CF Benchmark
5.27%5.17%
7.44%5.18%
8.6%5.23%
7.99%4.72%
9.1%5.47%
11.88%6.08%
6 month 1 Year 3 Year 5 Year Since Inception
*Funds returns computed on Simple annualized basis / Performance data does not include cost incurred by investor in the form of sales load
TECHNICAL INFORMATION
*DETAILS OF NON-COMPLIANT INVESTMENT WITH THE INVESTMENT CRITERIA OF ASSIGNED CATEGORY
Leverage Weighted average time to maturity of net assets
Name of Entity Exposure Type % of Net Assets Limit Excess - - - - -
- - - - -
NIL 40.97
Note : Amount Invested by Fund of Funds is Rs. NIL
Credit Quality of Portfolio (% of Assets)
AA,0.01% AAA,45.55%
AA+, 16.08%
GovtSecurities,
37.61%
Others /Unrated, 0.75%
Nov - 30,2017 YTD* St. Dev** Sharpe
Ratio** Alpha***
PERFORMANCE
0%
5%
10%
15%
20%
25%
30%
30-N
ov-1
6
14-D
ec-1
6
28-D
ec-1
6
11-Ja
n-17
25-Ja
n-17
8-Fe
b-17
22-F
eb-1
7
8-M
ar-1
7
22-M
ar-1
7
5-Ap
r-17
19-A
pr-1
7
3-M
ay-1
7
17-M
ay-…
31-M
ay-…
14-Ju
n-17
28-Ju
n-17
12-Ju
l-17
26-Ju
l-17
9-Au
g-17
23-A
ug-1
7
6-Se
p-17
20-S
ep-1
7
4-O
ct-1
7
18-O
ct-1
7
1-N
ov-1
7
15-N
ov-1
7
29-N
ov-1
7
ABL CF 70%-Avg of 3M PKRV rates + 30% 3M Avg Deposit Rate of 3 AA rated banks
Alee Khalid Ghaznavi - CEO Saqib Matin, ACA - CFO & CSKashif Rafi - CIOFahad Aziz, Fund ManagerM. Abdul Hayee, CFA - Fund ManagerAniel Victor - Head of Risk Management
Investment Committee Members:
IN FOCUS ABL GOVERNMENTSECURITIES FUND
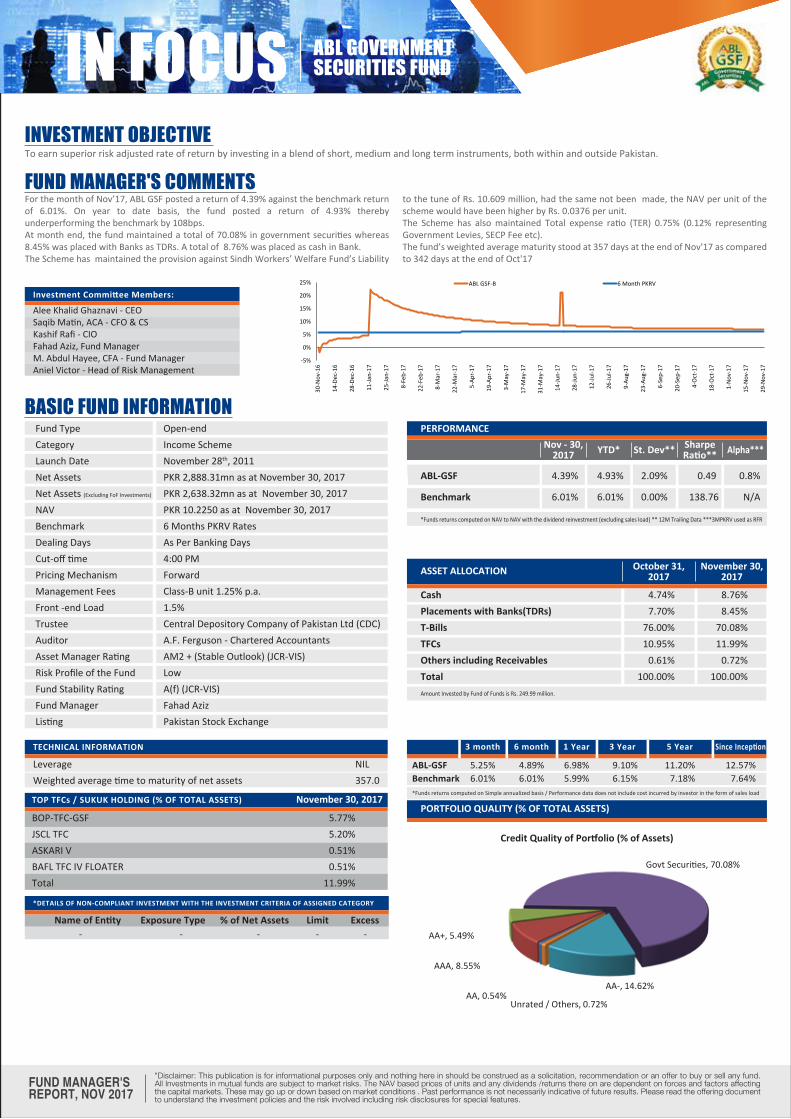
For the month of Nov’17, ABL GSF posted a return of 4.39% against the benchmark return of 6.01%. On year to date basis, the fund posted a return of 4.93% thereby underperforming the benchmark by 108bps.At month end, the fund maintained a total of 70.08% in government securities whereas 8.45% was placed with Banks as TDRs. A total of 8.76% was placed as cash in Bank.The Scheme has maintained the provision against Sindh Workers’ Welfare Fund’s Liability
to the tune of Rs. 10.609 million, had the same not been made, the NAV per unit of the scheme would have been higher by Rs. 0.0376 per unit. The Scheme has also maintained Total expense ratio (TER) 0.75% (0.12% representing Government Levies, SECP Fee etc).The fund’s weighted average maturity stood at 357 days at the end of Nov'17 as compared to 342 days at the end of Oct'17
To earn superior risk adjusted rate of return by investing in a blend of short, medium and long term instruments, both within and outside Pakistan.INVESTMENT OBJECTIVE
FUND MANAGER'S COMMENTS
FUND MANAGER'SREPORT, NOV 2017
BASIC FUND INFORMATIONFund TypeCategoryLaunch DateNet AssetsNet Assets (Excluding FoF Investments)
NAVBenchmarkDealing DaysCut-off timePricing MechanismManagement FeesFront -end LoadTrusteeAuditorAsset Manager RatingRisk Profile of the FundFund Stability RatingFund ManagerListing
Open-endIncome SchemeNovember 28th, 2011PKR 2,888.31mn as at November 30, 2017PKR 2,638.32mn as at November 30, 2017PKR 10.2250 as at November 30, 20176 Months PKRV RatesAs Per Banking Days4:00 PMForwardClass-B unit 1.25% p.a.1.5%Central Depository Company of Pakistan Ltd (CDC)A.F. Ferguson - Chartered Accountants AM2 + (Stable Outlook) (JCR-VIS)LowA(f) (JCR-VIS)Fahad AzizPakistan Stock Exchange
CashPlacements with Banks(TDRs)T-BillsTFCsOthers including ReceivablesTotal
4.74%7.70%
76.00%10.95%
0.61%100.00%
8.76%8.45%
70.08%11.99%
0.72%100.00%
October 31,2017
November 30,2017ASSET ALLOCATION
Amount Invested by Fund of Funds is Rs. 249.99 million.
PORTFOLIO QUALITY (% OF TOTAL ASSETS)
"Disclaimer: This publication is for informational purposes only and nothing here in should be construed as a solicitation, recommendation or an offer to buy or sell any fund. All Investments in mutual funds are subject to market risks. The NAV based prices of units and any dividends /returns there on are dependent on forces and factors affecting the capital markets. These may go up or down based on market conditions . Past performance is not necessarily indicative of future results. Please read the offering document to understand the investment policies and the risk involved including risk disclosures for special features.
TOP TFCs / SUKUK HOLDING (% OF TOTAL ASSETS)
BOP-TFC-GSFJSCL TFCASKARI VBAFL TFC IV FLOATERTotal
TECHNICAL INFORMATION
Leverage Weighted average time to maturity of net assets
5.77%5.20%0.51%0.51%
11.99%
NIL 357.0
November 30, 2017
*DETAILS OF NON-COMPLIANT INVESTMENT WITH THE INVESTMENT CRITERIA OF ASSIGNED CATEGORY
Name of Entity Exposure Type % of Net Assets Limit Excess - - - - -
3 month
ABL-GSFBenchmark
5.25%6.01%
4.89%6.01%
6.98%5.99%
9.10%6.15%
11.20%7.18%
12.57%7.64%
6 month 1 Year 3 Year 5 Year Since Inception
*Funds returns computed on Simple annualized basis / Performance data does not include cost incurred by investor in the form of sales load
ABL-GSF
Benchmark
*Funds returns computed on NAV to NAV with the dividend reinvestment (excluding sales load) ** 12M Trailing Data ***3MPKRV used as RFR
4.39%
6.01%
4.93%
6.01%
2.09%
0.00%
0.49
138.76
0.8%
N/A
Credit Quality of Portfolio (% of Assets)
AA, 0.54%
AAA, 8.55%
AA+, 5.49%
Govt Securities, 70.08%
AA-, 14.62%
Unrated / Others, 0.72%
Nov - 30,2017 YTD* St. Dev** Sharpe
Ratio** Alpha***
PERFORMANCE
-5%
0%
5%
10%
15%
20%
25%
30-N
ov-1
6
14-D
ec-1
6
28-D
ec-1
6
11-Ja
n-17
25-Ja
n-17
8-Fe
b-17
22-F
eb-1
7
8-M
ar-1
7
22-M
ar-1
7
5-Ap
r-17
19-A
pr-1
7
3-M
ay-1
7
17-M
ay-1
7
31-M
ay-1
7
14-Ju
n-17
28-Ju
n-17
12-Ju
l-17
26-Ju
l-17
9-Au
g-17
23-A
ug-1
7
6-Se
p-17
20-S
ep-1
7
4-O
ct-1
7
18-O
ct-1
7
1-N
ov-1
7
15-N
ov-1
7
29-N
ov-1
7
ABL GSF-B 6 Month PKRV
Alee Khalid Ghaznavi - CEO Saqib Matin, ACA - CFO & CSKashif Rafi - CIOFahad Aziz, Fund ManagerM. Abdul Hayee, CFA - Fund ManagerAniel Victor - Head of Risk Management
Investment Committee Members:

FUND MANAGER'SREPORT, NOV 2017
IN FOCUS ABL ISLAMICINCOME FUND
For the month of Nov’17, ABL Islamic Income Fund posted a return of 4.62% against the benchmark return of 2.57%, thereby outperforming the benchmark by 205 bps. The return can be attributed towards placement of funds with top Islamic banks at competitive rates and premium accruals from the corporate debt portfolio . On YTD basis, the fund continued to outperform the market by posting a return of 4.15%.During the month, the fund decreased its exposure in cash and TDRs from 72.70% & 9.09% in Oct'17 to 72.09% & 7.14% in Nov'17 while simultaneouly increasing exposure in Corporate Sukuk . The exposure in Corporate Sukuks increased slightly to 20.23% during the month. The fund’s WAM increased to 517 days in Nov’17 from 510 days in Oct'17.
Going forward, the fund will maintain its strategy of placement with top quality banks. We will also continue to look for opportunities to investment in quality corporate Sukuks and book gains by trading GoP Ijara Sukuk.The Scheme has maintained the provision against Sindh Workers’ Welfare Fund’s Liability to the tune of Rs. 4.954 million, had the same not been made, the NAV per unit of the scheme would have been higher by Rs. 0.0072 per unit. The Scheme has also maintained Total expense ratio (TER) 0.61% (0.010% representing Government Levies, SWWF etc).
To earn superior risk adjusted rate of return by investing in a blend of short, medium and long term instruments, both within and outside Pakistan.INVESTMENT OBJECTIVE
FUND MANAGER'S COMMENTS
BASIC FUND INFORMATIONFund TypeCategoryLaunch DateNet AssetsNet Assets (Excluding FoF Investment)
NAVBenchmarkDealing DaysCut-off timePricing MechanismManagement FeesFront -end LoadTrusteeAuditorAsset Manager RatingRisk Profile of the FundFund Stability RatingFund ManagerListing
Open-endIslamic Income SchemeJuly 31st, 2010PKR 7110.42mn as at November 30,2017PKR 4069.16 mn as at November 30,2017PKR 10.3429 as at November 30,2017Average of 6 Month Deposit Rate of 3 A rated Islamic BanksAs Per Banking Days4:00 PMForward1 % p.a1.5%Central Depository Company of Pakistan Ltd (CDC)Deloitte - Yousuf Adil. Chartered AccountantsAM2 + (Stable Outlook) (JCR-VIS)LowA(f) (JCR-VIS)Kashif RafiPakistan Stock Exchange
"Disclaimer: This publication is for informational purposes only and nothing here in should be construed as a solicitation, recommendation or an offer to buy or sell any fund. All Investments in mutual funds are subject to market risks. The NAV based prices of units and any dividends /returns there on are dependent on forces and factors affecting the capital markets. These may go up or down based on market conditions . Past performance is not necessarily indicative of future results. Please read the offering document to understand the investment policies and the risk involved including risk disclosures for special features.
TECHNICAL INFORMATION
Leverage Weighted average time to maturity of net assets
NIL 517
TOP TFCs / SUKUK HOLDING (% OF TOTAL ASSETS) November 30, 2017
DHCL SUKUK MEEZAN BANK SUKUK II IIF DIB SUKUK (14-07-2017) FFCL SUKUK IIF K-ELECTRIC IIF NEW Total
6.98%5.49%4.27%2.01%1.48%
20.23%
*DETAILS OF NON-COMPLIANT INVESTMENT WITH THE INVESTMENT CRITERIA OF ASSIGNED CATEGORY
Name of Entity Exposure Type % of Net Assets Limit Excess - - 0% 0% 0%
CashPlacements with Banks(TDRs)Corporate SukukOthers including ReceivablesTotal
72.7%9.09%
17.51%0.7%
100%
72.09%7.14%
20.23%0.54%100%
October 31,2017
November 30,2017ASSET ALLOCATION
Amount Invested by Fund of Funds is Rs. 3,041.26 million
3 month
ABL-IIFBenchmark
4.59%2.55%
4.39%2.46%
4.76%2.59%
6.43%4.35%
8.07%5.28%
10.69%6.16%
6 month 1 Year 3 Year 5 Year Since Inception
*Funds returns computed on Simple annualized basis / Performance data does not include cost incurred by investor in the form of sales load
ABL-IIF
Benchmark
*Funds returns computed on NAV to NAV with the dividend reinvestment (excluding sales load) ** 12M Trailing Data
4.62%
2.57%
4.15%
2.47%
0.83%
0.01%
(1.45)
(335.89)
2.13%
N/A
PORTFOLIO QUALITY (% OF TOTAL ASSETS)
Credit Quality of Portfolio (% of Assets)
Nov - 30,2017 YTD* St. Dev** Sharpe
Ratio** Alpha***
PERFORMANCE
-10%
-5%
0%
5%
10%
15%
30-N
ov-1
6
14-D
ec-1
6
28-D
ec-1
6
11-Ja
n-17
25-Ja
n-17
8-Fe
b-17
22-F
eb-1
7
8-M
ar-1
7
22-M
ar-1
7
5-Ap
r-17
19-A
pr-1
7
3-M
ay-1
7
17-M
ay-1
7
31-M
ay-1
7
14-Ju
n-17
28-Ju
n-17
12-Ju
l-17
26-Ju
l-17
9-Au
g-17
23-A
ug-1
7
6-Se
p-17
20-S
ep-1
7
4-O
ct-1
7
18-O
ct-1
7
1-N
ov-1
7
15-N
ov-1
7
29-N
ov-1
7
ABL IIF Average of 6 Month Deposit Rate of 3 A Rated Islamic Banks
AAA, 0.06%
AA+, 22.17%
AA-, 28.66%
A, 19.10% A+, 22.48%
Others /Unrated,
0.55%
AA, 6.98%
Alee Khalid Ghaznavi - CEO Saqib Matin, ACA - CFO & CSKashif Rafi - CIOFahad Aziz, Fund ManagerM. Abdul Hayee, CFA - Fund ManagerAniel Victor - Head of Risk Management
Investment Committee Members:

IN FOCUS ABL ISLAMICSTOCK FUND
ABL-ISF increased by 0.48% in November 2017 against 1.19% increase of the benchmark, reflecting an underperformance of 71 basis points. During the period under review, allocation to Oil & Gas Marketing Companies decreased from 12.63% to 7.80%. As at November 30, 2017, ABL-ISF was 77.86% invested in equities and remaining in bank deposits. The KMI-30 Index improved by 1.19% in November 2017 mainly owning to Oil & Gas sector which performed well during past one month on account of surge in international oil prices. However, an announcement by government to shut down FO based power plants put downward pressure on Power sector. Besides, a sit-in staged by religious political parties in reaction of parliament’s decision regarding removal of
oath on Khatam-e-Nabuwat clause from constitution dampened the market sentiment. In the long-run, positive stance is intact based on strong corporate earnings, abundant domestic liquidity and attractive valuation. The Scheme has maintained the provision against Sindh Workers’ Welfare Fund’s Liability to the tune of Rs. 24.605million, had the same not been made, the NAV per unit of the scheme would have been higher by Rs. 0.1416 per unit.The Scheme has total expense ratio (TER) of 1.4% (0.19% representing Government Levies and SECP Fee etc.). TER also includes the provision of sales & marketing expenses with 0.4% p.a. of Net Assets amounting to PKR 4.398 million.
To provide higher risk adjusted returns over the long term by investing in a diversified Islamic portfolio of equity instruments offering capital gain and dividends.INVESTMENT OBJECTIVE
FUND MANAGER'S COMMENTS
FUND MANAGER'SREPORT, NOV 2017
TOP TEN HOLDINGS (% OF TOTAL ASSETS) October 31, 2017 November 30, 2017
Oil and Gas Development Co. Ltd.Mari Petroleum Company LimitedPakistan Oilfields LimitedPakistan State Oil Company LimitedEngro Fertilizers LimitedInternational Steels LimitedD.G. Khan Cement Company LimitedI.C.I. Pakistan LimitedPackages LimitedPakistan Petroleum Limited
6.97%6.11%5.99%5.38%4.77%4.11%4.10%3.77%3.76%3.26%
6.61%6.18%5.84%5.20%4.19%4.03%4.13%3.66%4.78%2.55%
Stock/EquitiesBank BalancesOthersLeverageTotal
81.23%15.39%
3.38%NIL
100.00%
77.86%19.07%
3.07%NIL
100.00%
October 31,2017
November 30,2017ASSET ALLOCATION
Note: Amount invested by Fund of Fund is Rs. 531.13mn
ABL-ISF
Benchmark
*Funds returns computed on NAV to NAV with the dividend reinvestment (excluding sales load) ** 12M Trailing Data
0.48%
1.19%
(17.30%)
(13.36%)
20.19%
20.64%
0.91
1.00
0.26%
N/A
Nov - 30,2017* YTD* St. Dev** Beta Alpha
PERFORMANCE
"Disclaimer: This publication is for informational purposes only and nothing here in should be construed as a solicitation, recommendation or an offer to buy or sell any fund. All Investments in mutual funds are subject to market risks. The NAV based prices of units and any dividends /returns there on are dependent on forces and factors affecting the capital markets. These may go up or down based on market conditions . Past performance is not necessarily indicative of future results. Please read the offering document to understand the investment policies and the risk involved including risk disclosure for special feature.
SECTOR ALLOCATION (% OF TOTAL ASSETS)
3 month
ABL-ISFBenchmark
(6.15%)(2.31%)
(25.26%)(22.13%)
(4.41%)(4.67%)
38.62%36.78%
N/AN/A
78.28%81.21%
6 month 1 Year 3 Year 5 Year Since Inception
*Funds returns computed on Absolute basis. Performance data does not include cost incurred by investor in the form of sales load.
BASIC FUND INFORMATIONOpen-endIslamic Equity SchemeJune 12th, 2013Rs 2488.76mn as at November 30, 2017Rs 1957.62mn as at November 30, 2017Rs 14.3196 as at November 30, 2017KMI-30 IndexAs Per Local Stock Exchanges4:00 PMForward2% p.a2%MCB Financial Services LimitedM/S. A.F. Ferguson & Co, Chartered AccountantsAM2+ (Stable outlook) (JCR-VIS)HighMFR 4-Star (JCR VIS) (Based on one Year weightedaverage) For the period ended December 31,2015.M. Abdul Hayee, CFAPakistan Stock Exchange
Fund TypeCategoryLaunch DateNet AssetsNet Assets (Excluding FoF Investments)
NAVBenchmarkDealing DaysCut-off timePricing MechanismManagement FeesFront -end LoadTrusteeAuditorAsset Manager RatingRisk Profile of the FundPerformance Ranking Fund ManagerListing
-10.0%-5.0%0.0%5.0%
10.0%15.0%20.0%25.0%30.0%35.0%
1-De
c-16
12-D
ec-1
6
23-D
ec-1
6
3-Ja
n-17
14-Ja
n-17
25-Ja
n-17
5-Fe
b-17
16-F
eb-1
7
27-F
eb-1
7
10-M
ar-1
7
21-M
ar-1
7
1-Ap
r-17
12-A
pr-1
7
23-A
pr-1
7
4-M
ay-1
7
15-M
ay-1
7
26-M
ay-1
7
6-Ju
n-17
17-Ju
n-17
28-Ju
n-17
9-Ju
l-17
20-Ju
l-17
31-Ju
l-17
11-A
ug-1
7
22-A
ug-1
7
2-Se
p-17
13-S
ep-1
7
24-S
ep-1
7
5-O
ct-1
7
16-O
ct-1
7
27-O
ct-1
7
7-N
ov-1
7
18-N
ov-1
7
29-N
ov-1
7
KMI-30 ABL ISF
Oil & Gas Exploration CompaniesBank Balance & Others
FertilizerCement
Oil & Gas Marketing CompaniesEngineering
ChemicalPaper & Board
Automobile AssemblerTextile CompositeCommercial Banks
Automobile Parts & AccessoriesPower Generation & Distribution
PharmaceuticalsRefinery
Sugar & Allied Industries
0% 2% 4% 6% 8% 10% 12% 14% 16% 18% 20% 22% 24%
0.09%0.93%
1.72%2.64%2.68%3.04%3.21%
3.73%3.76%3.77%
5.88%7.80%8.06%8.22%
22.14%22.33%
Alee Khalid Ghaznavi - CEO Saqib Matin, ACA - CFO & CSKashif Rafi - CIOFahad Aziz, Fund ManagerM. Abdul Hayee, CFA - Fund ManagerAniel Victor - Head of Risk Management
Investment Committee Members:

IN FOCUS ABL ISLAMICDEDICATED STOCK FUND
ABL-IDSF increased by 0.50% in November 2017 against 1.19% increase of the benchmark, reflecting an underperformance of 69 basis points. During the period under review, allocation to Oil & Gas Marketing Companies decreased from 14.61% to 8.77%. As at November 30, 2017, ABL-IDSF was 80.88% invested in equities and remaining in bank deposits.The KMI-30 Index improved by 1.19% in November 2017 mainly owning to Oil & Gas sector which performed well during past one month on account of surge in international oil prices. However, an announcement by government to shut down FO based power plants put downward pressure on Power sector. Besides, a sit-in staged by religious political parties in reaction of parliament’s decision regarding removal of
oath on Khatam-e-Nabuwat clause from constitution dampened the market sentiment. In the long-run, positive stance is intact based on strong corporate earnings, abundant domestic liquidity and attractive valuation. The Scheme has maintained the provision against Sindh Workers’ Welfare Fund’s Liability to the tune of Rs. 1.553million, had the same not been made, the NAV per unit of the scheme would have been higher by Rs. 0.0067 per unit. The Scheme has total expense ratio (TER) of 1.39% (0.18% representing Government Levies and SECP Fee etc.). TER also includes the provision of sales & marketing expenses with 0.4% p.a. of Net Assets amounting to PKR 3.535 million.
To provide capital appreciation to investors of ‘Fund of Funds’ schemes by investing in Shariah compliant equity securities.INVESTMENT OBJECTIVE
FUND MANAGER'S COMMENTS
FUND MANAGER'SREPORT, NOV 2017
"Disclaimer: This publication is for informational purposes only and nothing here in should be construed as a solicitation, recommendation or an offer to buy or sell any fund. All Investments in mutual funds are subject to market risks. The NAV based prices of units and any dividends /returns there on are dependent on forces and factors affecting the capital markets. These may go up or down based on market conditions . Past performance is not necessarily indicative of future results. Please read the offering document to understand the investment policies and the risk involved including risk disclosure for special feature.
BASIC FUND INFORMATIONFund TypeCategoryLaunch DateNet AssetsNet Assets (Net of FoF Investments)
NAVBenchmarkDealing DaysCut-off timePricing MechanismManagement FeesFront -end LoadTrusteeAuditorAsset Manager RatingRisk Profile of the FundPerformance RankingFund ManagerListing
Open-endIslamic Equity SchemeDecember 20th, 2016Rs 1939.26mn as at November 30, 2017Rs -0.01mn as at November 30, 2017Rs 8.3853 as at November 30, 2017KMI-30 IndexAs Per Local Stock Exchanges4:00 PMForward2% p.aNILMCB Financial Services LimitedM/S. A.F. Ferguson & Co, Chartered AccountantsAM2+ (Stable outlook) (JCR-VIS)HighN/AM. Abdul Hayee, CFAPakistan Stock Exchange
Stock/EquitiesBank BalancesOthersLeverageTotal
86.08%11.28%
2.64%NIL
100.00%
80.88%16.27%
2.85%NIL
100.00%
October 31,2017
November 30,2017ASSET ALLOCATION
Note: Amount invested by Fund of Fund is Rs. 1,939.27mn
3 month
ABL-IDSFBenchmark
(5.78%)(2.31%)
(25.37%)(22.13%)
N/AN/A
N/AN/A
N/AN/A
(14.47%)(15.64%)
6 month 1 Year 3 Year 5 Year Since Inception
ABL-IDSF
Benchmark
*Funds returns computed on NAV to NAV with the dividend reinvestment (excluding sales load) ** 12M Trailing Data
0.50%
1.19%
(16.85%)
(13.36%)
N/A
N/A
N/A
N/A
N/A
N/A
Nov - 30,2017* YTD* St. Dev** Beta Alpha
PERFORMANCE
TOP TEN HOLDINGS (% OF TOTAL ASSETS) October 31, 2017 November 30, 2017
Mari Petroleum Company LimitedOil and Gas Development Co. Ltd.Pakistan State Oil Company LimitedI.C.I. Pakistan LimitedPakistan Oilfields LimitedD.G. Khan Cement Company LimitedPakistan Petroleum LimitedPackages LimitedEngro Fertilizers LimitedMeezan Bank Limited
7.73%6.44%6.34%4.64%4.62%4.36%4.02%4.02%3.36%3.35%
7.68%6.50%7.23%4.44%4.91%4.33%3.06%5.10%2.77%3.23%
SECTOR ALLOCATION (% OF TOTAL ASSETS)
*Funds returns computed on Absolute basis. Performance data does not include cost incurred by investor in the form of sales load.
Oil & Gas Exploration CompaniesBank Balance & Others
Oil & Gas Marketing CompaniesCement
FertilizerEngineering
Automobile AssemblerChemical
Paper & BoardCommercial BanksTextile Composite
Power Generation & DistributionAutomobile Parts & Accessories
PharmaceuticalsRefinery
Sugar & Allied IndustriesLeather & Tanneries
0.00% 4.00% 8.00% 12.00% 16.00% 20.00%
0.03%0.09%
0.93%2.30%
2.77%2.82%
3.27%3.35%
4.02%4.64%4.73%
5.74%6.54%
8.06%8.77%
19.12%22.81%
-15.00%
-10.00%
-5.00%
0.00%
5.00%
10.00%
15.00%
20.00%
20-Dec-16
3-Jan-17
17-Jan-17
31-Jan-17
14-Feb-17
28-Feb-17
14-Mar-17
28-Mar-17
11-Apr-17
25-Apr-17
9-May-17
23-May-17
6-Jun-17
20-Jun-17
4-Jul-17
18-Jul-17
1-Aug-17
15-Aug-17
29-Aug-17
12-Sep-17
26-Sep-17
10-Oct-17
24-Oct-17
7-Nov-17
21-Nov-17
KMI-30 ABL IDSF
Alee Khalid Ghaznavi - CEO Saqib Matin, ACA - CFO & CSKashif Rafi - CIOFahad Aziz, Fund ManagerM. Abdul Hayee, CFA - Fund ManagerAniel Victor - Head of Risk Management
Investment Committee Members:

TECHNICAL INFORMATION APF-DSF APF-ESF
Fund Size (PKR Millions)NAV
92.646154.9725
78.443140.2168
APF-MMSF
45.334115.7296
IN FOCUS ABL PENSIONFUND
ABL Pension Fund - Debt Sub Fund posted an annualized yield 3.60% during the month of November’17. During the month, exposure in T-bills and Corporate Sukuks remained almost unchanged. At month end, portfolio comprised of 72.72%, T-bills, while cash at bank and investment in Corporate sukuks stood at 9.29% & 17.47% respectively. Going forward, we intend to maintain a low duration portfolio in order to avoid volatility. The Scheme has maintained the provision against Sindh Workers’ Welfare Fund’s Liability to the tune of Rs. 169,489, had the same not been made, the NAV per unit of the scheme would have been higher by Rs. 0.3030 per unit. ABL Pension Fund - Money Market Sub Fund generated an annualized return of 3.78% in November’17. Since Inception basis, ABLPF - MMSF yielded an annualized return of 4.79% respectively. At the end of the month, cash in bank decreased from 56.25% to 56.05%, while exposure in T-bills increased from 43.38% to 43.48%. Going forward, we intend to maintain a low duration portfolio in order to avoid volatility in returns.The Scheme has maintained the provision against Sindh Workers’ Welfare Fund’s Liability to
the tune of Rs. 88,030, had the same not been made, the NAV per unit of the scheme would have been higher by Rs. 0.2247 per unit. ABL Pension Fund - Equity Sub Fund increased by 1.24% in the month of November’17. The KSE-100 Index improved by 0.99% in November 2017 mainly owning to Oil & Gas sector which performed well during past one month on account of surge in international oil prices. However, an announcement by government to shut down FO based power plants put downward pressure on Power sector. Besides, a sit-in staged by religious political parties in reaction of parliament’s decision regarding removal of oath on Khatam-e-Nabuwat clause from constitution dampened the market sentiment. In the long-run, positive stance is intact based on strong corporate earnings, abundant domestic liquidity and attractive valuation. The Scheme has maintained the provision against Sindh Workers’ Welfare Fund’s Liability to the tune of Rs. 629,693, had the same not been made, the NAV per unit of the scheme would have been higher by Rs. 1.0533 per unit.
To provide a secure source of savings and regular income after retirement to the Participants.INVESTMENT OBJECTIVEFUND MANAGER'S COMMENTS
FUND MANAGER'SREPORT, NOV 2017
BASIC FUND INFORMATIONOpen-endVoluntary Pension SchemeAugust 20th,2014As Per Banking Days4.00 pmForward1.5 % p.a. on average Net Assets of each Sub-FundMaximum of 3 % on all Contributions, unlessexempt under the Offering DocumentCentral Depository Company of Pakistan Ltd (CDC)Deloitte – Yousuf Adil – Chartered AccountantsAM2+ (Stable Outlook) (JCR-VIS)NAInvestor dependentM. Abdul Hayee, CFA
Cash Placements with Banks (TDRs) Corporate Sukuk T-Bills PIBs Others Including ReceivablesTotal
11.29%0.00%
15.70%72.56%
0.00%0.45%
100.00%
9.29%0.00%
17.47%72.72%
0.00%0.52%
100.00%
October 31, 2017APF DEBT SUB FUND November 30, 2017
CashCorporate SukukPIBsT-BillsOthers Including ReceivablesTotal
56.25%0.00%0.00%
43.38%0.37%
100.00%
56.05%0.00%0.00%
43.48%0.46%
100.00%
October 31, 2017APF MONEY MARKET SUB FUND November 30, 2017
Stock/EquitiesBank BalancesT-BillsOthersLeverageTotal
91.23%7.22%0.00%1.55%
NIL100.00%
90.66%8.55%0.00%0.79%
NIL100.00%
October 31, 2017APF EQUITY SUB FUND November 30, 2017
EQUITY SUB-FUND (% OF TOTAL ASSETS) October 31, 2017 November 30, 2017
Thal LimitedMari Petroleum Company LimitedNishat Mills LimitedLucky Cement LimitedI.C.I. Pakistan LimitedHabib Bank LimitedHonda Atlas Cars (Pakistan) LimitedPakistan State Oil Company LimitedEngro Corporation LimitedEngro Fertilizers Limited
7.51%6.04%5.65%5.54%5.02%4.90%4.76%4.75%4.20%3.95%
7.38%5.97%5.28%5.54%4.99%4.90%4.54%5.30%4.52%3.98%
DISCLOSURE IN COMPLIANCE WITH SECP'S DISCRETION NO # 23 OF 2016
SECTOR ALLOCATION (% OF EQUITY SUB-FUND)
"Disclaimer: This publication is for informational purposes only and nothing here in should be construed as a solicitation, recommendation or an offer to buy or sell any fund. All Investments in mutual funds are subject to market risks. The NAV based prices of units and any dividends /returns there on are dependent on forces and factors affecting the capital markets. These may go up or down based on market conditions . Past performance is not necessarily indicative of future results. Please read the offering document to understand the investment policies and the risk involved including risk disclosures for special features.
3 month
APF-DSF*APF- MMSF*APF- ESF**
3.63%3.51%
(3.75%)
3.51%3.76%
(24.13%)
4.38%3.91%
(5.77%)
10.30%4.53%
44.46%
- - -
12.25%4.79%
54.97%
6 month 1 Year 3 Year 5 Year Since Inception
Fund TypeCategoryLaunch DateDealing DaysCut-off timePricing MechanismManagement FeesFront -end Load Trustee AuditorAsset Manager RatingFund Stability RatingRisk Profile of the FundFund Manager
*Fund returns are computed on simple annualized basis.**Fund returns are computed on simple annualized basis. Performance data does not include cost incurred by investor in the form of sales load.
APF DEBT SUB FUNDThe Scheme has also mantained Total expense ratio (TER) 0.91% (0.12% representing Government Levies and SECP Fee etc.).APF MONEY MARKET SUB FUNDScheme has also mantained Total expense ratio (TER) 0.97% (0.12% representing Government Levies and SECP Fee etc).APF EQUITY SUB FUNDThe Scheme has also mantained Total expense ratio (TER) 0.91% (0.12% representing Government Levies and SECP Fee etc.).
*DETAILS OF NON-COMPLIANT INVESTMENT WITH THE INVESTMENT CRITERIA OF ASSIGNED CATEGORY
Nameof Fund -
Exposure Type
-
% of Net Assets
-
Limit
-
Excess /Short
-
November-17YTD *Funds returns computed on NAV to NAV with the dividend reinvestment (excluding sales load)
3.60%3.46%
3.78%3.78%
1.24%(17.12%)
APF-DSF APF-MMSF APF-ESF
PERFORMANCE
0.87%1.94%2.15%2.42%
3.31%4.76%5.02%
5.65%7.98%
8.74%9.30%9.34%
11.64%11.87%
15.00%
0.00% 3.00% 6.00% 9.00% 12.00% 15.00% 18.00%
Oil & Gas Exploration CompaniesCommercial Banks
CementBank Balance & Others
FertilizerAutomobile Parts & AccessoriesOil & Gas Marketing Companies
Textile CompositeChemical
Automobile AssemblerPaper & Board
EngineeringPharmaceuticals
InsuranceSugar & Allied Industries
Alee Khalid Ghaznavi - CEO Saqib Matin, ACA - CFO & CSKashif Rafi - CIOFahad Aziz, Fund ManagerM. Abdul Hayee, CFA - Fund ManagerAniel Victor - Head of Risk Management
Investment Committee Members:

IN FOCUS ABL ISLAMICPENSION FUND
ABL Islamic Pension fund - Debt Sub Fund posted a return of 2.98% in November’17. Other than GoP Ijarah Sukuk, portfolio comprised of 12.35% allocated in Corporate Sukuk and 4.80% placed as cash at banks. Going forward, we intend to maintain the current portfolio allocations as we expect price appreciation in Corporate Sukuks in the near term owing to the lack of shariah complaint instruments in the market. The Scheme has maintained the provision against Sindh Workers’ Welfare Fund’s Liability to the tune of Rs. 73,755, had the same not been made, the NAV per unit of the scheme would have been higher by Rs. 0.1799 per unit. ABL Islamic Pension Fund - Money Market SubFund generated an annualized return of 1.62% in November’17. Fund size remained largely stable and closed at PKR 36.8704 million. During the month significant allocation was maintained as bank deposits (i.e. 70.42%) owing to better deposit rates offered by banks while remaining 28.44% of the portfolio was placed in GoP Ijarah Sukuks.The Scheme has maintained the provision against Sindh Workers’ Welfare Fund’s Liability to
the tune of Rs. 39,909, had the same not been made, the NAV per unit of the scheme would have been higher by Rs. 0.1212 per unit. ABL Islamic Pension Fund - Equity Sub Fund increased by 1.07% in the month of Novem-ber’17. The KMI-30 Index improved by 1.19% in November 2017 mainly owning to Oil & Gas sector which performed well during past one month on account of surge in international oil prices. However, an announcement by government to shut down FO based power plants put downward pressure on Power sector. Besides, a sit-in staged by religious political parties in reaction of parliament’s decision regarding removal of oath on Khatam-e-Nabuwat clause from constitution dampened the market sentiment. In the long-run, positive stance is intact based on strong corporate earnings, abundant domestic liquidity and attractive valuation.The Scheme has maintained the provision against Sindh Workers’ Welfare Fund’s Liability to the tune of Rs. 633,377, had the same not been made, the NAV per unit of the scheme would have been higher by Rs. 1.4656 per unit.
To provide a secure source of savings and regular income after retirement to the Participants.INVESTMENT OBJECTIVE
FUND MANAGER'S COMMENTS
FUND MANAGER'SREPORT, NOV 2017
BASIC FUND INFORMATIONOpen-endVoluntary Pension SchemeAugust 20th,2014As Per Banking Days4.00 pmForward1.5 % p.a. on average Net Assets of each Sub-FundMaximum of 3 % on all Contributions, unlessexempt under the Offering DocumentCentral Depository Company of Pakistan Ltd (CDC)Deloitte – Yousuf Adil – Chartered AccountantsAM2+ (Stable Outlook) (JCR-VIS)NAInvestor dependentM. Abdul Hayee, CFA
Cash GoP Ijarah Sukuk Corporate Sukuk Others Including ReceivablesTotal
7.00%80.49%10.33%
2.18%100.00%
4.80%80.28%12.35%
2.57%100.00%
October 31, 2017APF ISLAMIC DEBT SUB FUND November 30, 2017
CashGoP Ijarah SukukCorporate SukukOthers Including ReceivablesTotal
70.46%28.47%
0.00%1.07%
100.00%
70.42%28.44%
0.00%1.14%
100.00%
October 31, 2017APF ISLAMIC MONEY MARKET SUB FUND November 30, 2017
Shariah Compliant EquitiesBank BalancesOthersLeverageTotal
86.60%3.02%
10.38%NIL
100.00%
94.64%4.26%1.10%
NIL100.00%
October 31, 2017APF ISLAMIC EQUITY SUB FUND November 30, 2017
TECHNICAL INFORMATION APF-IDSF APF-IESF
Fund Size (PKR Millions)NAV
69.1058159.9115
46.9703114.5792
APF-IMMSF
36.8704111.9289
EQUITY SUB-FUND (% OF TOTAL ASSETS) October 31, 2017 November 30, 2017
Mari Petroleum Company LimitedThal LimitedLucky Cement LimitedNishat Mills LimitedI.C.I. Pakistan LimitedOil and Gas Development Co. Ltd.Engro Fertilizers LimitedPakistan State Oil Company LimitedD.G. Khan Cement Company LimitedPackages Limited
8.70%8.31%6.91%6.80%6.59%6.31%6.30%5.29%4.96%4.84%
7.81%7.41%6.27%5.77%5.95%5.38%5.76%5.36%4.64%4.72%
DISCLOSURE IN COMPLIANCE WITH SECP'S DISCRETION NO # 23 OF 2016
SECTOR ALLOCATION (% OF EQUITY SUB-FUND)
"Disclaimer: This publication is for informational purposes only and nothing here in should be construed as a solicitation, recommendation or an offer to buy or sell any fund. All Investments in mutual funds are subject to market risks. The NAV based prices of units and any dividends /returns there on are dependent on forces and factors affecting the capital markets. These may go up or down based on market conditions . Past performance is not necessarily indicative of future results. Please read the offering document to understand the investment policies and the risk involved including risk disclosures for special features.
3 month
APF-IDSF*APF- IMMSF*APF- IESF**
2.36%1.86%
(3.55%)
2.18%2.10%
(22.98%)
1.54%1.93%
(3.87%)
4.33%3.45%
46.32%
- - -
4.44%3.63%
59.91%
6 month 1 Year 3 Year 5 Year Since Inception
Fund TypeCategoryLaunch DateDealing DaysCut-off timePricing MechanismManagement FeesFront -end Load TrusteeAuditorAsset Manager RatingFund Stability RatingRisk Profile of the FundFund Manager
*Fund returns are computed on simple annualized basis. Performance data does not include cost incurred by investor in the form of sales load.**Fund returns are computed on Absolute Basis
APF ISLAMIC DEBT SUB FUNDThe Scheme has also mantained Total expense ratio (TER) 0.98% (0.12% representing Government Levies and SECP Fee etc).APF ISLAMIC MONEY MARKET SUB FUNDThe Scheme has also mantained Total expense ratio (TER) 1.02% (0.12% representing Government Levies and SECP Fee etc).APF ISLAMIC EQUITY SUB FUNDThe Scheme has also mantained Total expense ratio (TER) 0.97% (0.12% representing Government Levies and SECP Fee etc).
*DETAILS OF NON-COMPLIANT INVESTMENT WITH THE INVESTMENT CRITERIA OF ASSIGNED CATEGORY
Nameof Fund -
Exposure Type
-
% of Net Assets
-
Limit
-
Excess /Short
-
November-17YTD*Funds returns computed on NAV to NAV with the dividend reinvestment (excluding sales load)
2.98%0.56%
1.62%1.44%
1.07%(14.47%)
APF-IDSF APF-IMMSF APF-IESF
PERFORMANCE
1.16%3.03%3.55%
4.84%5.36%
6.59%6.80%
9.81%9.97%10.34%
14.96%
23.58%
0.00% 4.00% 8.00% 12.00% 16.00% 20.00% 24.00%
Oil & Gas Exploration CompaniesCement
Automobile Parts & AccessoriesOil & Gas Marketing Companies
FertilizerTextile Composite
ChemicalBank Balance & Others
Paper & BoardEngineering
PharmaceuticalsSugar & Allied Industries
Alee Khalid Ghaznavi - CEO Saqib Matin, ACA - CFO & CSKashif Rafi - CIOFahad Aziz, Fund ManagerM. Abdul Hayee, CFA - Fund ManagerAniel Victor - Head of Risk Management
Investment Committee Members:

IN FOCUS ABL FINANCIALPLANNING FUND
To generate returns on investment as per the respective allocation plan by investing in mutual funds in line with the risk tolerance of the investor.INVESTMENT OBJECTIVE
FUND MANAGER'SREPORT, NOV 2017
BASIC FUND INFORMATION ASSET ALLOCATIONOpen-endFund of funds schemeDecember 31st,2015Weighted average return of KSE-30 Index andaverage 6 month deposit rate of three BanksMonday to FridayForward4.00 pmNIL (upto 1.50% p.a. on the value of underlyingFunds not managed by ABLAMC)Up to 2%MCB Financial Services Limited (MCBFSL)Deloitte - Yousuf Adil . Chartered AccountantsAM2+ (Stable Outlook) (JCR-VIS)Low to HighKashif RafiPakistan Stock ExchangeConv: 0.23% (0.05% including Gop Levy and SECP FEE etc)Active: 0.16% (0.05% including Gop Levy and SECP FEE etc)Strategic: 0.15% (0.04% including Gop Levy and SECP FEE etc)
Leverage is NIL for all Plans
*Funds returns computed on NAV to NAV with the dividend reinvestment (excluding sales load)*Funds returns computed on Absolute basis. Performance data does not include cost incurred by investor in the form of sales load
Equity FundsIncome FundsMoney Market FundsCashOthersTotal
18.40%74.55%
5.89%0.59%0.57%
100.00%
18.21%67.57%
0.00%1.51%
12.72%100.00%
October 31, 2017 November 30, 2017CONSERVATIVE PLAN 31-Dec-15
Equity FundsIncome FundsMoney Market FundsCashOthersTotal
73.52%25.32%
0.00%0.48%0.68%
100.00%
73.69%25.48%
0.00%0.44%0.39%
100.00%
October 31, 2017 November 30, 2017ACTIVE ALLOCATION PLAN 31-Dec15
Equity FundsIncome FundsMoney Market FundsCashOthersTotal
18.71%74.92%
5.93%0.45%
(0.02%)100.00%
18.63%74.85%
0.00%0.54%5.98%
100.00%
October 31, 2017 November 30, 2017STRATEGIC ALLOCATION PLAN 30-Dec-16
Conservative PlanActive Allocation PlanStrategic Allocation Plan
283,522,197639,685,669852,146,119
107.021493.957096.6682
Net Assets (PKR) NAV (PKR)TECHNICAL INFORMATION
"Disclaimer: This publication is for informational purposes only and nothing here in should be construed as a solicitation, recommendation or an offer to buy or sell any fund. All Investments in mutual funds are subject to market risks. The NAV based prices of units and any dividends /returns there on are dependent on forces and factors affecting the capital markets. These may go up or down based on market conditions . Past performance is not necessarily indicative of future results. Please read the offering document to understand the investment policies and the risk involved including risk disclosures for special features.
Fund TypeCategoryLaunch Date*Benchmark
Dealing DaysPricing MechanismCut-off timeManagement Fees Structuring Fee TrusteeAuditorAsset Manager RatingRisk Profile of the FundFund ManagerListingTER
Conv: The Scheme has maintained the provision against Sindh Workers’ Welfare Fund’s Liability to the tune of Rs. 1.001 million, had the same not been made, the NAV per unit of the scheme would have been higher by Rs. 0.3779 per unit.
Active: The Scheme has maintained the provision against Sindh Workers’ Welfare Fund’s Liability to the tune of Rs. 3.53 million, had the same not been made, the NAV per unit of the scheme would have been higher by Rs. 0.5185 per unit.
Strategic: The Scheme has maintained the provision against Sindh Workers’ Welfare Fund’s Liability to the tune of Rs. 0.104 million, had the same not been made, the NAV per unit of the scheme would have been higher by Rs. 0.0118 per unit.
Nov-17YTD3 Months6 MonthsSince Inception
0.25%(2.25%)(0.37%)(3.49%)12.63%
0.55%(0.62%)(0.74%)(1.79%)13.30%
0.04%(13.60%)
(4.63%)(20.29%)
8.51%
0.90%(9.86%)(1.61%)
(16.59%)8.46%
0.25%(3.88%)(0.28%)(6.76%)(3.33%)
0.57%(1.76%)
0.63%(4.84%)(2.01%)
Returns* Benchmark Returns* Benchmark Returns* BenchmarkConservative Allocation Active Allocation Strategic Allocation
PERFORMANCE
*Plan Launch Date
Alee Khalid Ghaznavi - CEO Saqib Matin, ACA - CFO & CSKashif Rafi - CIOFahad Aziz, Fund ManagerM. Abdul Hayee, CFA - Fund ManagerAniel Victor - Head of Risk Management
Investment Committee Members:

IN FOCUS ABL ISLAMICFINANCIAL PLANNINGFUND
To generate returns on investment as per the respective allocation plan by investing in Shariah compliant mutual funds in line with the risk tolerance of the investor.INVESTMENT OBJECTIVE
FUND MANAGER'SREPORT, NOV 2017
BASIC FUND INFORMATION ASSET ALLOCATIONOpen-endShariah compliant fund of funds schemeDecember 23rd,2015Weighted average return of KMI-30 Index andaverage 6 month deposit rate of three Islamic BanksMonday to FridayForward4.00 pmNIL (upto 1.50% p.a. on the value of underlyingFunds not managed by ABLAMC)Up to 2%MCB Financial Services Limited (MCBFSL)Deloitte - Yousuf Adil . Chartered AccountantsAM2+ (Stable Outlook) (JCR-VIS)Low to HighKashif RafiConv: 0.28% (0.05% including Gop Levy and SECP FEE etc)Aggressive: 0.15% (0.05% including Gop Levy and SECP FEE etc)Active: 0.16% (0.05% including Gop Levy and SECP FEE etc)Strategic: 0.16% (0.05% including Gop Levy and SECP FEE etc)Strategic II: 0.17% (0.05% including Gop Levy and SECP FEE etc)Strategic III: 0.16% (0.05% including Gop Levy and SECP FEE etc)Strategic IV: 0.02% (0.08% including Gop Levy and SECP FEE etc)
Leverage is NIL for all Plans
*Funds returns computed on NAV to NAV with the dividend reinvestment (excluding sales load)*Funds returns computed on Absolute basis. Performance data does not include cost incurred by investor in the form of sales load
Equity FundsIncome FundsCashOthersTotal
71.37%20.59%
7.98%0.06%
100.00%
69.11%29.92%
0.93%0.03%
100.00%
October 31,2017
November 30,2017AGGRESSIVE PLAN 23-Dec-15
Equity FundsIncome FundsCashOthersTotal
73.74%18.72%
7.45%0.09%
100.00%
72.92%25.94%
1.08%0.06%
100.00%
October 31,2017
November 30,2017ACTIVE ALLOCATION PLAN 23-Dec-15
Equity FundsIncome FundsCashOthersTotal
54.49%37.81%
5.34%2.36%
100.00%
55.93%43.40%
0.63%0.03%
100.00%
October 31,2017
November 30,2017STRATEGIC ALLOCATION PLAN 31-Mar-16
Equity FundsIncome FundsCashOthersTotal
41.74%49.81%
8.40%0.04%
100.00%
41.97%57.44%
0.55%0.04%
100.00%
October 31,2017
November 30,2017STRATEGIC ALLOCATION PLAN-II 9-Sep-16
Equity FundsIncome FundsCashOthersTotal
19.19%74.17%
6.59%0.05%
100.00%
19.29%80.33%
0.34%0.04%
100.00%
October 31,2017
November 30,2017STRATEGIC ALLOCATION PLAN-III 3-Mar-17
Equity FundsIncome FundsCashOthersTotal
19.22%74.24%
6.52%0.02%
100.00%
19.26%80.43%
0.25%0.07%
100.00%
October 31,2017
November 30,2017STRATEGIC ALLOCATION PLAN-IV 18-Sep-17
Conservative Allocation PlanAggressive Allocation PlanActive Allocation PlanStrategic Allocation PlanStrategic Allocation Plan IIStrategic Allocation Plan IIIStrategic Allocation Plan IV
217,013,891 313,569,903
1,328,912,544 889,643,005 878,882,525
1,138,875,849 768,144,079
109.2920103.7999101.3430102.0815
92.599296.8706
100.0835
Net Assets (PKR) (NAV PKR)TECHNICAL INFORMATION
"Disclaimer: This publication is for informational purposes only and nothing here in should be construed as a solicitation, recommendation or an offer to buy or sell any fund. All Investments in mutual funds are subject to market risks. The NAV based prices of units and any dividends /returns there on are dependent on forces and factors affecting the capital markets. These may go up or down based on market conditions . Past performance is not necessarily indicative of future results. Please read the offering document to understand the investment policies and the risk involved including risk disclosures for special features.
Fund TypeCategoryLaunch Date*Benchmark
Dealing DaysPricing MechanismCut-off timeManagement Fees Structuring Fee TrusteeAuditorAsset Manager RatingRisk Profile of the FundFund ManagerTER
Conv: The Scheme has maintained the provision against Sindh Workers’ Welfare Fund’s Liability to the tune of Rs. 0.93 million, had the same not been made, the NAV per unit of the scheme would have been higher by Rs. 0.4685 per unit.Aggressive: The Scheme has maintained the provision against Sindh Workers’ Welfare Fund’s Liability to the tune of Rs. 1.789 million, had the same not been made, the NAV per unit of the scheme would have been higher by Rs. 0.5921 per unit.Active: The Scheme has maintained the provision against Sindh Workers’ Welfare Fund’s Liability to the tune of Rs. 6.116 million, had the same not been made, the NAV per unit of the scheme would have been higher by Rs. 0.4664 per unit.Strategic: The Scheme has maintained the provision against Sindh Workers’ Welfare Fund’s Liability to the tune of Rs. 2.752 million, had the same not been made, the NAV per unit of the scheme would have been higher by Rs. 0.3157 per unit.Strategic II: The Scheme has maintained the provision against Sindh Workers’ Welfare Fund’s Liability to the tune of Rs. 0.252 million, had the same not been made, the NAV per unit of the scheme would have been higher by Rs. 0.0265 per unit.Strategic III: The Scheme has maintained the provision against Sindh Workers’ Welfare Fund’s Liability to the tune of Rs. 0.084 million, had the same not been made, the NAV per unit of the scheme would have been higher by Rs. 0.0071 per unit.Strategic IV: The Scheme has maintained the provision against Sindh Workers’ Welfare Fund’s Liability to the tune of Rs. 0 million, had the same not been made, the NAV per unit of the scheme would have been higher by Rs. 0 per unit.
Period*
Period* Strategic IV
ReturnsNov-17YTD3 Months6 MonthsSince Inception
Nov-17YTD3 Months6 MonthsSince Inception
0.32%(2.42%)(0.32%)(3.90%)11.21%
0.41%0.08%
N/AN/A
0.08%
0.54%(0.25%)
N/AN/A
(0.25%)
0.52%(1.73%)
0.28%(3.76%)10.82%
0.52%(11.50%)
(3.72%)(17.56%)
14.80%
1.54%(8.84%)(0.87%)
(15.70%)19.15%
0.47%(11.99%)
(3.75%)(20.04%)
7.77%
1.44%(9.60%)(1.04%)
(18.74%)8.28%
0.41%(9.49%)(2.93%)
(15.76%)3.26%
1.03%(6.99%)(0.76%)
(14.41%)1.64%
0.40%(8.51%)(1.83%)
(13.56%)(7.40%)
0.92%(6.42%)(0.20%)
(12.40%)(9.08%)
0.37%(3.16%)(0.19%)(4.34%)(2.83%)
0.53%(2.27%)
0.18%(4.27%)(3.28%)
Benchmark
Returns Benchmark
Returns Benchmark Returns Benchmark Returns Benchmark Returns Benchmark Returns BenchmarkConservative Aggressive Active Allocation Strategic Strategic II Strategic III
PERFORMANCE
InvestmentCommittee Members:
Alee Khalid Ghaznavi - CEOSaqib Matin, ACA - CFO & CSKashif Rafi - CIO
Fahad Aziz, Fund ManagerM. Abdul Hayee, CFA - Fund ManagerAniel Victor - Head of Risk Management
Equity FundsIncome FundsCashOthersTotal
18.50%74.00%
6.40%1.10%
100.00%
18.22%78.40%
2.26%1.12%
100.00%
October 31,2017
November 30,2017CONSERVATIVE PLAN 23-Dec-15
*Plan Launch Date

FUND MANAGER'SREPORT, NOV 2017
"Disclaimer: This publication is for informational purposes only and nothing here in should be construed as a solicitation, recommendation or an offer to buy or sell any fund. All Investments in mutual funds are subject to market risks. The NAV based prices of units and any dividends /returns there on are dependent on forces and factors affecting the capital markets. These may go up or down based on market conditions . Past performance is not necessarily indicative of future results. Please read the offering document to understand the investment policies and the risk involved including risk disclosures for special features.
ABL IFBenchmark
FY’139.88%9.96%
8.19%9.81%
14.20%9.01%
7.19%6.54%
5.85%6.10%
FY’14 FY’15 FY’16 FY’17
ABL CF
Benchmark
9.13%
6.62%
8.18%
6.57%
9.37%
6.06%
5.78%
3.81%
5.41%
4.96%
ABL SFBenchmark
55.87%35.95%
32.90%25.96%
27.11%5.67%
9.91%0.37%
33.21%22.44%
ABL IIFBenchmark
9.22%6.63%
8.88%6.78%
8.69%6.61%
5.82%5.10%
5.68%3.05%
ABL GSFBenchmark
11.79%8.84%
9.17%8.82%
15.14%8.00%
8.03%5.67%
5.10%5.85%
ABL ISFBenchmark
(3.24%)(2.30%)
24.66%29.89%
29.03%20.10%
5.58%15.53%
31.18%18.80%
ABL IDSFBenchmark
--
--
--
--
2.86%(2.62%)
ABL PFDSFMMSFESF
---
---
20.92%6.14%
28.79%
12.14%4.15%
10.56%
4.42%3.89%
31.31%
ABL IPFDSFMMSFESF
---
---
6.56%6.31%
30.84%
3.52%2.24%
11.31%
4.52%3.22%
28.01%
4.41%4.17%5.29%6.99%
10.35%9.44%
19.28%13.56%0.57%
(0.25%)
ABL FPFConservative PlanBenchmarkActive PlanBenchmarkSAPBenchmark
ABL IFPFSAPBenchmarkConservative PlanBenchmarkAggressive FundBenchmarkActive PlanBenchmarkSAP IIBenchmarkSAP IIIBencmark
------
--------
-
-
--------
-
-
--------
-
-
------
------
1.69%4.00%3.52%5.92%6.46%
14.58%3.53%
10.27%
12.18%5.73%
10.08%6.51%
21.85%14.12%18.26%10.06%1.22%
(2.84%)0.34%
(0.95%)
FY’09 FY’10 FY’1112.26%13.05%
11.29%12.90%
14.34%13.48%
13.16%12.87%
13.50%12.26%
13.50%11.84%
15.24%11.42%
15.16%10.79%
15.60%10.48%
FY’12 FY’13 FY’14 FY’15 FY’16 FY’17
71.06%52.39%
32.43%25.69%
(0.17%)(0.42%)
116.12%56.81%
236.86%113.18%
347.69%168.52%
469.07%183.75%
525.44%184.79%
733.15%248.70%
10.16%9.30%
--
--
11.12%8.34%
11.15%7.75%
11.30%7.51%
11.56%7.32%
11.15%6.94%
10.90%6.38%
--
--
--
10.68%10.52%
11.85%9.46%
11.48%9.21%
13.75%8.87%
13.37%8.17%
12.88%7.76%
--
--
--
--
(3.24%)(2.30%)
20.63%26.90%
55.64%52.40%
64.32%76.07%
115.56%109.16%
--
--
--
--
--
--
--
--
2.86%(2.62%)
---
---
---
---
---
---
20.92%6.14%
28.79%
17.37%5.18%
42.39%
13.35%4.86%
86.97%
---
---
---
---
---
---
6.56%6.31%
30.84%
5.03%4.18%
45.65%
5.00%3.93%
86.96%
------
------
------
------
------
------
-4.41%4.17%5.29%6.99%
15.22%14.01%25.59%20.32%0.57%
(0.25%)
1.69%4.00%3.52%5.92%6.46%
14.58%3.53%
10.27%
14.08%9.37%
13.96%12.82%29.72%30.77%22.44%19.88%1.22%
(2.84%)0.34%
(0.95%)
11.88%
7.49%
-
-
-
-
12.18%
7.49%
11.87%
7.19%
11.65%
7.03%
12.06%
6.83%
11.58%
6.32%
12.01%
6.13%
--------
-
-
--------
-
-
--------
-
-
--------
-
-
--------
-
-
--------
-
-
--------
-
-
Last 5 Years Performance Since Inception Performance
IN FOCUS DISCLOSURE ASPER SECP’S SCDCIRCULAR. 16, 2014

Plot # 24-B Mezznine Floor,Main Market Gulberg 111, LahoreTel: 0423-5750953Mobile: 0345-4268272,0335-4184426
LAHORE2nd Floor, Main Khayaban-e-Ittehad DHA, KarachiTel: 0213-5311001Mobile: 0300-2441896,0332-3081021
KARACHIPlot # 171 A-1 Phase 1DHA, RawalpindiTel: 051-5788728Fax: 051-5789382Mobile: 0333-8505435
RAWALPINDI15 Club Road, Main FaisalLane, Off Club Road, CilvilLines, FaislabadTel: 041-2409413, 041-2409420Mobile: 0301-845066
FAISALABAD
Plot No. 14. Sector MB, DHA, Phase 6, LahoreREGISTERED ADDRESS

Rating as per JCR-VIS
SMSCallEmailWebsite
::::
‘INVEST’ to 82620800 ABL-AM (0800 225 26)[email protected]
ABLAssetManagement
ABLAssetManagement
ablamcl