FUND MANAGER - Novare...OVERVIEW NOVARE INVESTMENTS . AFRICA MANAGER SURVEY 2013.2 INTRODUCTION,...
23
FUND MANAGER
Transcript of FUND MANAGER - Novare...OVERVIEW NOVARE INVESTMENTS . AFRICA MANAGER SURVEY 2013.2 INTRODUCTION,...

F U N D M A N A G E R

OVERVIEW 2 Introduction, Scope and Participation 2 Highlights 2 The Investment Case for Africa 3 African Equity Markets 5ASSET LEVELS 5 Fund Launches and Closures 6PERFORMANCE 6 TRACK RECORD 7STRUCTURE 8 Fund Currency Denomination 8 Fund Domicile 9 Location of Fund Management Team or Advisor 10INVESTORS AND FEES 11 Investor Profile 11 Investor Location 11 Investor Reporting and Dealing Frequency 12 Fees 15OPERATIONS 17 Fund Administration 17 Fund Custody 17TRADING ACTIVITY 18EXPOSURES 19 Instrument Exposures 19 Geographic Exposure 19CLOSING REMARKS 21CONTACT US 22 Disclaimer 22
N O V A R E I N V E S T M E N T S . I N V E S T I N G I N A F R I C A S U R V E Y 2 0 1 3 . 1
OVERVIEW
N O V A R E I N V E S T M E N T S . A F R I C A M A N A G E R S U R V E Y 2 0 1 3 . 2
INTRODUCTION, SCOPE AND PARTICIPATION
This is Novare Investments' second survey summarising the Africa-focused fund manager landscape. The main purpose of the survey is to provide an overview of this rapidly growing and specialised area of investment, with particular emphasis on fund managers that invest in the listed African space outside of South Africa.
This survey focuses on Africa (including North Africa) and the funds that give investors access to listed instruments on the continent. Although the focal point of the survey is to review at what is available excluding South Africa, the latter remains the continent’s most developed and regulated financial market, providing unbridled access for investors as a gateway into the rest of Africa.
A total of 39 funds participated in this survey. They typically classified themselves as either Africa, Frontier Africa, pan-African or sub-Saharan Africa funds, with the majority of these being long-only equity funds that invest in African stock markets with limited or no exposure to South Africa. Funds whose mandates allow investments in the listed equities of companies that derive a portion of their income from the continent, even though the holdings may not be listed on an African exchange (listed or dual-listed in other jurisdictions), have not been excluded for the purposes of this survey.
The majority of funds that were invited to participate indeed did so and we extend our sincere thanks to them. The funds that declined were typically closed for new investments. This survey was conducted by means of a voluntary questionnaire completed by managers that invest in African financial markets with the resultant snapshot of their portfolios taken as at 30 June 2013.
HIGHLIGHTS
• Participating funds’ assets under management were US$3.180 billion as at 30 June 2013.
• Close to 50.0% of assets were managed within funds with a track record exceeding five
years.
• The majority of funds are denominated in US Dollars.
• The most popular fund domicile was the Cayman Islands.
• 30.8% of participating funds were UCITS compliant.
• Of participating funds, 66.7% were listed on a regulated exchange.
• The bulk of capital participating funds received from South African investors.
• There has been a shift towards lowering fees with almost all new funds launched charging
a management fee of less than 2.0% per annum.
• The most popular location for fund managers to be based is South Africa.
• Monthly subscription to funds remain the norm, as reported by 69.2% of participants.

N O V A R E I N V E S T M E N T S . I N V E S T I N G I N A F R I C A S U R V E Y 2 0 1 3 . 3
THE INVESTMENT CASE FOR AFRICA
Africa’s appeal as an investment destination has continued to grow, as evidenced by increased investor enquiries and capital flows. This is arguably due to a combination of transient macro factors (for example, a search for yield) as well as longer term or more permanent structural reform within markets on the continent (for example, an improvement in the geo-political outlook, stronger financial market regulation and increased transparency).
0%
1%
2%
3%
4%
5%
6%
7%
Advanced Economies Central and Eastern Europe Developing Asia Latin America and the Caribbean
Sub-Saharan Africa
2012 2013 2014
Projected GDP Growth of Selected Regions
Source: IMF World Economic Outlook October 2013
In addition, developmental foundations have been cited by respondents and other surveys as one of the fundamental underpinnings of longer-term growth prospects in the region. Despite the region as a whole delivering above average returns, a closer look reveals that no less than eight sub-Saharan African (SSA) countries are projected to achieve GDP growth rates in excess of 6.0% for 2013. According to the IMF, a further 13 are projected to deliver in excess of this in 2014, with most other SSA countries estimated to achieve a growth rate above 5% per year. Africa is home to six out of 10 of the world’s fastest growing economies.
Projected GDP Growth Sub-Saharan Africa
Between 4% and 6%
Less than 0%
Between1% and 2%
Between 2% and 4%
More than 6%
North Africa

Given the outlook for growth rates in the rest of the world, these growth rates arguably appeal to investors. However, it is equally important to understand the drivers of these figures.
According to the World Population Review, Africa is the second most populous continent with an estimated population of more than one billion. This equates to approximately 15.0% of the global population. In addition it has one of the youngest and fastest growing middle class workforces of any major geographic region globally.
In sub-Saharan African the rise of the middle class has given added drive to the positive growth path experienced. Over the last 30 years, the middle class has tripled in size with one in three people now above the poverty line.
According to a recent study conducted on the African middle class by 2060 the African middle class will constitute more than 1.1 billion people. The continent now has the fastest growing middle class in the world.
Growing middle class consumption is fueling the retail sector, in 2007 Ghana saw the opening of its first formal retail shopping centre in Accra. Lagos, with a population of over 15 million, currently has three shopping malls. Retail developments is addressing low levels of market penetration, which represent opportunities across the continent.
Selected African Countries Population
Less than 10 million
More than 115 million
45 – 80 million
10 – 45 million
N O V A R E I N V E S T M E N T S . A F R I C A M A N A G E R S U R V E Y 2 0 1 3 . 4

AFRICAN EQUITY MARKETS
The fact that Africa is under-researched results in difficulties for developed market investors searching for information to assess new opportunities. These challenges often result in investment opportunities being overlooked.
These opportunities may often be in well established companies, with strong verifiable cash flows, in markets that are not yet covered in terms of company research extent, and in adequate depth.
Part of what this survey attempts to highlight is that, with the assistance of professional fund managers in these markets, exposure to quality companies can be obtained. With a more detailed understanding of the true risk dynamics and return drivers at work, superior returns can be achieved.
MSCI African Stock Market Returns Rebased to 100 on 30 June 2012
SSA countries have considerable room for growth, but to attract long-term capital sensible fiscal and monetary policies, in combination with strict inflation control, will be crucial.
African stock markets have grown from strength to strength over recent years. However, most of these are still classified as frontier markets as they have not yet achieved the liquidity, market depth and trading costs associated with their emerging market peers on other continents.
Investors in African financial stock markets have witnessed a wide dispersion in the returns produced by individual markets. In dollar terms one of the best returns over the 12 months to 30 June 2013 (as measured by the MSCI Indices) was the Ghanaian market with 108.4%, while one of the worst performers was the Egyptian market which ended the period 13.6% lower.
70
90
110
130
150
170
190
210
230
Jun'12 Jul'12 Aug'12 Sep'12 Oct'12 Nov'12 Dec'12 Jan'13 Feb'13 Mar'13 Apr'13 May'13
Ghana Kenya Mauritius Nigeria South Africa Zimbabwe Egypt
ASSET LEVELS
Asset levels reached US$ 3.180 billion, but remained below the previous high of US$ 3.371 billion recorded in June 2008. While there have been marginal inflows into funds, changes in total assets under management can mainly be attributed to the performance of funds.
Source: Inet Bridge, MSCI Indices USD
N O V A R E I N V E S T M E N T S . A F R I C A M A N A G E R S U R V E Y 2 0 1 3 . 5

FUND LAUNCHES AND CLOSURES
Participants AUM and Estimated Yearly Cash Flow
In 2010 a total of 36 funds participated in our inaugural report, of which six returned investor capital between June 2010 and June 2013.
In 2013 a total of 39 funds participated, 11 of which were new funds launched during the three years to end June 2013. The new participating funds housed a total of US$ 383.3 million as at June 2013.
It is also worth noting that as at June 2008 the average fund size was close to US$200 million, but this dropped to US$80 million in the following year and remained at that level until June 2011. As at June 2012 the average fund size reduced to a low of US$61.2 million but subsequently increased to US$81.6 million in 2013. These changes can mostly be attributed to the relative performance of the markets that the funds invest in. However, several new Africa fund strategies have also emerged since the economic meltdown, leading to growth in average fund size.
The average size of new funds launched over the past year was US$34.8 million.
3,371.12
2,115.70
2,966.76
2,305.89
2,019.96
3,180.29
-500.00
-
500.00
1,000.00
1,500.00
2,000.00
2,500.00
3,000.00
3,500.00
4,000.00
Jun'08 Jun'09 Jun'10 Jun'11 Jun'12 Jun'13
US$
milli
on
Assets under management 12 month net cash flows
PERFORMANCEPerformance held up well during recent volatile market conditions with investors compensated handsomely for having a portion of their assets in African focused funds. The average compound return of participating funds measured 30.2% (after the deduction of fees) over the 12-month period to end June 2013, compared to the MSCI Emerging Market Index which delivered 0.4%, and the MSCI Africa ex SA index which delivered 29.8% over the same time frame.
Despite challenging market conditions, on average, participating funds provided effective capital preservation and outperformed equity markets in the region over the 12-month period.
N O V A R E I N V E S T M E N T S . A F R I C A M A N A G E R S U R V E Y 2 0 1 3 . 6

Average Monthly Return
-45%
-35%
-25%
-15%
-5%
5%
15%
25%
35%
45%
Jun'08 Dec'08 Jul'09 Jan'10 Aug'10 Feb'11 Sep'11 Apr'12 Oct'12 May'13
Average Return Monthly Return
Portfolios with AUM of less than US$10 million delivered an average compound return of 14.5% over the 12 months ending June 2013. Funds managing between US$10 and 50 million returned 28.9% over the same time frame, while funds managing between US$50 million but less than US$100 million delivered 38.1%. Funds with assets exceeding US$100 million delivered 36.2% on average for the year.
Average Cumulative Return
90
100
110
120
130
140
150
Jun'12 Jul'12 Aug'12 Sep'12 Oct'12 Nov'12 Dec'12 Jan'13 Feb'13 Mar'13 Apr'13 May'13 Jun'13 Jul'13
AUM < US$10 million AUM US$10 to 50 million AUM US$50 to 100 million AUM > US$100 million
TRACK RECORDFunds with a track record of less than one year accounted for 17.9% of participants and housed 6.0% of assets. A further 10.3% participants had a track record exceeding one year but less than two years (with 7.0% of assets).10.3% of participants had a track record exceeding two years (but less than three years) and managed 3.9% of assets. Funds with a track record of between three and four years represented 17.9% of participants with 9.8% of assets.
Funds with a track record of between four and five years amounted to 17.9% of participants (26.4% of assets), with 25.6% of participating funds boasting a track record exceeding five years accounting for 47.0% of assets.
N O V A R E I N V E S T M E N T S . A F R I C A M A N A G E R S U R V E Y 2 0 1 3 . 7

Length of Track Record
The most popular currency denomination remained US$ with 89.7% of participating funds (86.1% in 2010). A further 7.69% were denominated in ZAR with all of these funds structured as South African unit trusts. The remaining funds were available in multiple currency classes, for example, US$, EUR and GBP.
Fund Currency Denomination as % of Participants
STRUCTURE
0.0%
5.0%
10.0%
15.0%
20.0%
25.0%
30.0%
35.0%
40.0%
45.0%
50.0%
<= 1 year (1 and 2 years] (2 and 3 years] (3 and 4 years] (4 and 5 years] > 5 years
% of managers % of AUM
FUND CURRENCY DENOMINATION
86.1%
89.7%
8.3%
7.7%
2.8%2.8%
2.6%
0% 10% 20% 30% 40% 50% 60% 70% 80% 90% 100%
% of participants 2010
% of participants 2013
USD ZAR USD and EUR USD, EUR and GBP
N O V A R E I N V E S T M E N T S . A F R I C A M A N A G E R S U R V E Y 2 0 1 3 . 8

Fund domicile as % of participants
Represented as a percentage of participants the most popular destination to have the fund domiciled remained the Cayman Islands and Ireland with 22.2% each (27.8% and 25.0% respectively in 2010). There was a notable increase in the amount of funds domiciled in Mauritius, increasing from 2.8% of participants in 2010 to 16.7%. Other popular destinations include the British Virgin Islands with 11.1% (from 16.7% in 2010), South Africa with 8.3% (11.1% in 2010), and Luxembourg attracting 13.9% (same as 2010) of participants. Funds were also domiciled in Jersey, Malta and Guernsey.
Fund domicile in % of assets
FUND DOMICILE
When considering the fund’s domicile as a percentage of assets under management the most popular destination was the Cayman Islands (39.2% of assets), followed by Ireland (25.7%), with all the other regions amounting to less than 10% each.
In addition, a total of 30.8% of participating funds (representing 40.1% of assets) were UCITS compliant. Of participating funds 66.7% (representing 36.3% of assets) were listed on a regulated exchange, the most popular being the Irish Stock Exchange.
N O V A R E I N V E S T M E N T S . A F R I C A M A N A G E R S U R V E Y 2 0 1 3 . 9
27.8%
22.2%
25.0%
22.2%
16.7%
11.1%
11.1%
8.3%
2.8%
16.7%
2.8%
8.3%
13.9%
13.9%
0% 10% 20% 30% 40% 50% 60% 70% 80% 90% 100%
% of participants 2010
% of participants 2013
Ireland Cayman Islands British Virgin Islands South Africa Mauritius Luxembourg All other
10.8%
25.7%
38.1%
39.2%
5.8%
6.0%
28.2%
2.7%
0.2%
1.9% 4.7%
17.0%
15.4%
0% 10% 20% 30% 40% 50% 60% 70% 80% 90% 100%
% of AUM 2010
% of AUM 2013
Ireland Cayman Islands British Virgin Islands South Africa Mauritius Luxembourg All other

Location of investment manager/advisor as % of assets
Based on assets under management, the location of investment managers was relatively unchanged from 2010 to 2013, with the most popular country remaining South Africa. Approximately half of all assets included in the survey are advised on or managed from South Africa.
The next most popular domicile for managers was the United States with approximately 25.0% of assets (in line with 2010), followed by the United Kingdom with approximately 9.0%. A further 6.4% of assets were managed from Mauritius.
Location of investment manager/advisor as % of participants
LOCATION OF FUND MANAGEMENT TEAM OR ADVISOR
It is interesting to note that there has been a strong tendency for newly established investment management companies to be situated in Mauritius. No less than 23.1% of participants in 2013 (up from 5.9% in 2010) were located in Mauritius.
N O V A R E I N V E S T M E N T S . A F R I C A M A N A G E R S U R V E Y 2 0 1 3 . 1 0
50.9%
50.6%
26.4%
27.5%
7.9%
8.6%
2.8%
6.4%
4.8%
0.9%
4.2%
1.3%
3.1%
4.7%
0% 10% 20% 30% 40% 50% 60% 70% 80% 90% 100%
% of AUM 2010
% of AUM 2013
South Africa United States United Kingdom Mauritius British Virgin Islands Cayman Islands Other
41.2%
46.2%
5.9%
2.6%
20.6%
12.8%
5.9%
23.1%
8.8%
5.1%
5.9%
2.6%
11.8%
7.7%
0% 10% 20% 30% 40% 50% 60% 70% 80% 90% 100%
% of participants 2010
% of participants 2013
South Africa United States United Kingdom Mauritius British Virgin Islands Cayman Islands Other

N O V A R E I N V E S T M E N T S . A F R I C A M A N A G E R S U R V E Y 2 0 1 3 . 1 1
INVESTOR PROFILE
Investor type as % of assets
Nearly a third of investors were located in South Africa, accounting for 31.0% of assets (38.0% in 2010). North American investors held 30.6% of assets (up from 3.6% in 2010) while investors from the United Kingdom accounted for 16.0% of assets (19.1% in 2010). Other African-based investors (excluding South Africa) were the fourth largest allocator with 12.2% (9.0% in 2010) while the percentage held by European investors remained relatively unchanged. There were notably fewer investors from South America (down from 10.4% to 0.0%), the Middle East (from 1.2% to 0.4%) and Australia (down from 7.7% to 0.1%).
INVESTORS AND FEES
INVESTOR LOCATION
There has been a clear shift in the type of investors investing in Africa focused funds. In 2010 the largest allocations were from long-term insurers and funds of funds, but currently the bulk of assets (21.8%) are invested by pension funds. Other investors include family offices, short-term insurers, endowments and sovereign wealth funds.
Investor location as % of assets
26.6%
9.6%
25.8%
15.7%
12.6%
9.8%
7.8%
21.8%
6.6%
1.3%
5.4%
5.5%
15.3%
36.3%
0% 10% 20% 30% 40% 50% 60% 70% 80% 90% 100%
% of AUM 2010
% of AUM 2013
Long term insurer Fund of funds High net worth individuals Pension funds Holding company Retail investors Other investors
38.0%
31.0%
3.6%
30.6%
19.1%
16.0%
10.4% 9.0%
12.2%
10.9%
9.6%
1.2%
0.4%
7.7%
0% 10% 20% 30% 40% 50% 60% 70% 80% 90% 100%
% of AUM 2010
% of AUM 2013
South Africa North America United Kingdom South America Africa excluding South Africa Europe excluding UK Asia Middle East Australia

N O V A R E I N V E S T M E N T S . A F R I C A M A N A G E R S U R V E Y 2 0 1 3 . 1 2
Frequency of NAV reporting
Of the participants 12.8% reported their net asset values (NAVs) to investors daily (representing 6.3% of assets). Most of these were structured as South African unit trusts. A further 10.3% reported weekly (21.7% of assets) while 2.6% reported bi-weekly (representing 0.8% of assets).
The bulk as represented by 71.8% participants (69.9% assets) reported their NAV on a monthly basis. A mere 2.6% of participants (representing 1.3% of assets) reported NAVs to their investors on a quarterly basis.
Fund dealing: subscription
INVESTOR REPORTING AND DEALING FREQUENCY
Investor subscription terms were as follows; there was a slight decrease in the number of funds that allow daily subscription - from 11.1% to 7.7% of participants. 15.4% of participants (representing 35.5% of assets) allowed weekly subscription. Funds that allowed bi-weekly subscription increased from 2.8% to 7.7%. Funds with a monthly subscription reduced from 72.2% (2010) to the reported 69.2% of participants in 2013.
0%
10%
20%
30%
40%
50%
60%
70%
80%
90%
100%
% of participants % of AUM
Daily Bi-weekly Weekly Monthly Quarterly
11.1% 7.7% 7.6%2.7%
13.9%15.4%
30.4% 35.5%2.8% 7.7%
0.2% 4.6%
72.2% 69.2%61.8% 57.2%
0%
10%
20%
30%
40%
50%
60%
70%
80%
90%
100%
2010 2013 2010 2013
% of participants % of assets
Daily Weekly Bi-weekly Monthly

Fund dealing: redemptions
When considering the redemption notice period, notice periods of one week or less remained relatively unchanged compared to 2010 as indicated by 20.5% of participants. Funds requiring a one-month notice period for redemptions remained unchanged but the assets within funds with this requirement decreased from 71.6% to 53.7%. The number of funds requiring two months’ notice period doubled from 5.6% to 10.3%. The number of funds that required three months’ notice increased slightly from 25.0% to 28.2%.
Fund dealing: subscription
Investor redemption terms were as follows:
• Funds allowing daily redemptions remained relatively unchanged with 7.7% of participants
(7.6% of assets).
• 10.3% of participating funds had bi-weekly dealing dates for redemptions.
• Weekly redemptions were allowed by 15.4% of participants.
• A further 53.9% of participants allowed monthly redemptions.
• Interestingly, funds with quarterly redemption periods almost doubled from 5.6% of
participants in 2010 to 12.8%.
N O V A R E I N V E S T M E N T S . A F R I C A M A N A G E R S U R V E Y 2 0 1 3 . 1 3
22.2% 20.5%13.5% 12.6%
41.7% 41.0%
71.6%
53.7%
5.6% 10.3%
0.4%
19.7%25.0%
28.2%
13.9% 14.0%5.6%
0.0% 0.5% 0.0%
0%
10%
20%
30%
40%
50%
60%
70%
80%
90%
100%
2010 2013 2010 2013
% of participants % of assets
One week or less One month Two months Three months Not specified
11.1% 7.7% 7.6% 7.6%
11.1% 15.4%
29.3%
9.3%
5.6%10.3%
1.2%35.5%
66.7% 53.8%
61.0% 45.0%
5.6%12.8%
0.8%9.3%
0%
10%
20%
30%
40%
50%
60%
70%
80%
90%
100%
2010 2013 2010 2013
% of participants % of assets
Daily Weekly Bi-weekly Monthly Quarterly

Despite their prospectus allowing for an initial fee that may be levied at the discretion of the fund’s manager, 59.5% of participants indicated that no initial subscription fee was being charged to new investors. The remainder of funds charge an initial fee of between 1.0% and 5.0% of the investment amount.
Only 35.9% of participating funds indicated that ring-fencing of assets was allowed according to their investor prospectus. A further 66.7% indicated that gating structures were included in the prospectus with 66.6% allowing in specie redemption. Only 20.5% of managers indicated that side pocketing was allowed, and 43.6% of participating funds did impose a redemption penalty or exit fee. An additional 10.3% of participants indicated that they imposed an initial lock-up period, which typically ranged from three months to one year.
Investment terms imposed by participants
36.0% of participants indicated that they required a minimum investment amount of US$1 000. This was also the case for all new funds. The majority of funds indicated, however, that they had different minimum amounts depending on the type of investor.
Minimum initial investment
0%
10%
20%
30%
40%
50%
60%
< US$ 1000 (US$1000; 5000] (US$5000; 10000] (US$10000,100000] > US$100000
% of participants % of AUM
Investment Terms
0% 10% 20% 30% 40% 50% 60% 70% 80%
Ringfencing
Gating
In specie redemption
Suspension
Side pocketing
Redemption penalty
N O V A R E I N V E S T M E N T S . A F R I C A M A N A G E R S U R V E Y 2 0 1 3 . 1 4

FEES
Management fees charged as % of participants
Funds charging a management fee of less than 1.0% a year accounted for 3.0% of assets while funds charging a management fee of 1.0% represent 15.0% of assets (5.6% in 2010). There was a notable reduction in the number of managers that charged an annual fee of 1.5%, down from 68.7% of assets at June 2010 to 48.6% of assets.
The number of funds charging a management fee of 1.75% a year increased from 0.2% to 5.3%, and the number of funds that charged an annual management fee of 2.0% increased slightly to 28.1% of assets compared to 25.6% in 2010.
Most funds offer different fee classes depending on the type of investor.
There is a tendency for newer funds to charge lower management fees: almost all new funds launched during the last couple of years charge a management fee of less than 2.0% a year and some even charge less than 1.0%.
Management fees charged as % of assets
N O V A R E I N V E S T M E N T S . A F R I C A M A N A G E R S U R V E Y 2 0 1 3 . 1 5
12.8%
8.3%
20.5%
36.1%
28.2%
2.8%
10.3%
52.8%
28.2%
0% 10% 20% 30% 40% 50% 60% 70% 80% 90% 100%
% of participants 2010
% of participants 2013
< 1.00% 1% p.a. 1.5% p.a. 1.75% p.a. 2% p.a.
3.0%
5.6%
15.0%
68.7%
48.6%
0.2%
5.3%
25.6%
28.1%
0% 10% 20% 30% 40% 50% 60% 70% 80% 90% 100%
% of AUM 2010
% of AUM 2013
< 1.00% 1% p.a. 1.5% p.a. 1.75% p.a. 2% p.a.

Performance fees charged as % of participants
In line with the above observation, assets managed by funds that charged a performance fee of 20.0% dropped from 61.9% to 38.5%.
This year, participating funds representing 23.1% of assets indicated that they charge no performance fee (compared to 16.7% in 2010). A further 7.7% of participants have a performance fee of 10.0% (up from 5.6% in 2010), while a fifth of participants indicating 15.0% (8.3% in 2010).
As reported by participants, notably fewer funds charge a 20.0% performance fee – down from 69.4% to 48.7%.
Performance fees charged as % of assets
The majority of participants used a hurdle rate for performance fee calculations. This rate, normally represented by cash (the norm being Libor plus a fixed rate) or an index, needs to be exceeded by the fund before any performance fee can be levied.
The number of funds that had no hurdle (performance fee is charged on all positive performance) decreased significantly from 19.4% to 0.0% of participants, while the number of funds that used a cash related hurdle decreased slightly from 38.9% to 36.8%.
N O V A R E I N V E S T M E N T S . A F R I C A M A N A G E R S U R V E Y 2 0 1 3 . 1 6
16.7%
23.1%
5.6%
7.7%
8.3%
20.5%
69.4%
48.7%
0% 10% 20% 30% 40% 50% 60% 70% 80% 90% 100%
% of participants 2010
% of participants 2013
0% (no performance fee) 10.0% 15.0% 20.0%
29.8%
37.0%
1.0%
0.1%
7.3%
24.3%
61.9%
38.5%
0% 10% 20% 30% 40% 50% 60% 70% 80% 90% 100%
% of AUM 2010
% of AUM 2013
0% (no performance fee) 10.0% 15.0% 20.0%

N O V A R E I N V E S T M E N T S . A F R I C A M A N A G E R S U R V E Y 2 0 1 3 . 1 7
Hurdle rate used
For funds that charged a performance fee, the high water mark principle was applied as indicated by 71.8% of participants (representing 52.0% of assets). Only 7.7% (managing 14.1% of assets) indicated that they did not apply the high water mark principle.
Performance fee charging funds also often have a cap on the amount of performance fees payable by the investor, as indicated by 30.8% of participants (representing 25.8% of assets). However, 43.6% of participants indicated that there was no limit on the amount of performance fee charged (these funds represented 29.8% of assets as at 30 June 2013).
OPERATIONS
FUND ADMINISTRATION
Of participating funds 92.3% (representing 97.6% of assets) indicated that they used the services of an independent administrator. Funds not using an administrator were all South African unit trusts where the management company (Manco) is responsible for administration.
Of funds that use an administrator, the most popular independent third parties used by participants were State Street followed by JP Morgan.
FUND CUSTODY
All participating funds used the services of a custodian; the preferred service providers being Standard Chartered, Standard Bank and JP Morgan.
Noteworthy, the number of funds that used an index-related hurdle increased from 8.3% to 26.3%. The most popular index used (as indicated by 18.0% of participants) was the MSCI Emerging Markets Africa ex South Africa Index. The number of funds with an absolute hurdle increased somewhat from 11.1% in 2010 to 13.7% in 2013.
16.7%
23.1%
19.4%
0.0%
38.9%
36.8%
8.3%
26.3%
11.1%
13.7%
5.6%
0.0%
0% 10% 20% 30% 40% 50% 60% 70% 80% 90% 100%
% of participants 2010
% of participants 2013
No performance fee No hurdle Cash related hurdle Index related hurdle Absolute hurdle Not specified

Trading activity as % of assets
When considering trading activity according to fund size there was a clear tendency for smaller
funds to have a higher turnover within their portfolios.
• Funds with assets of between US$10 million and US$50 million indicated that approximately
11.4% of their assets traded 0.25X NAV a year.
• Funds with assets of between US$50 million and US$100 million traded their portfolios 0.15X
NAV per year (18.4% of assets).
• Half of the funds with assets in excess of US$100 million traded their portfolios on average
0.15X times NAV per year.
TRADING ACTIVITYMost participants indicated that their portfolios were traded 0.15X NAV per year.
Trading activity according to fund size
0%
10%
20%
30%
40%
50%
60%
70%
80%
0 - 0.1 X fund NAV 0.1 - 0.2 X fund NAV 0.2 - 0.5 X fund NAV 0.5 - 1 X fund NAV 1 - 2X fund NAV > 2X fund NAV Not specified
0%
10%
20%
30%
40%
50%
60%
70%
80%
0 - 0.1 X fund NAV 0.1 - 0.2 X fund NAV 0.2 - 0.5 X fund NAV 0.5 - 1 X fund NAV 1 - 2X fund NAV > 2X fund NAV Not specified
Less than US$10 million Between US$10 and 50million Between US$50 and 100 million More than US$100 million
N O V A R E I N V E S T M E N T S . A F R I C A M A N A G E R S U R V E Y 2 0 1 3 . 1 8

INSTRUMENT EXPOSURES
Some changes of allocations to different African financial markets were as follows:
• Measured by total assets under management by all participants, exposure to Botswana
almost halved from 3.5% to 1.6%.
• Exposure to the Bourse Régionale des Valeurs Mobilières (BRVM) remained relatively stable
at 3.5% (3.8% in 2010) of total participants’ assets.
• Exposure to the Egyptian market showed a large drop from 19.4% to the 14.1%.
• Exposure to Ghana almost doubled from 1.6% to 3.5%.
• Zimbabwe showed the largest increase from 3.7% to 11.9%.
• Other offshore markets remained relatively stable at 3.0%. The types of companies within
this group normally list on offshore exchanges but derive the bulk of their earnings from the
African market. This is especially prevalent for commodity extracting companies.
EXPOSURES
GEOGRAPHIC EXPOSURE
The bulk of capital invested was in listed African equities, as indicated by participants representing 91.7% of assets (compared to 86.8% three years ago). Fixed income allocations increased from 0.1% to 0.5%, while investment in currencies accounted for 0.8% of allocations compared to 1.1% in 2010. Holdings in cash accounted for 5.6% of assets compared to 11.9% and investment in unlisted equities increased from 0.04% to 0.7% of total assets. Other allocations increased from 0.02% to 0.7%, including allocations to property, physical commodities, futures, options and unlisted money market instruments.
Geographic exposure as % of assets
Botswana BRVM Egypt Ghana Kenya Mauritius Morocco Namibia Nigeria Offshore ex Africa
South Africa Zambia Zimbabwe
2010 3.5% 3.5% 19.4% 1.6% 4.8% 4.7% 1.9% 1.0% 29.5% 3.1% 4.5% 4.9% 3.7%2013 1.6% 3.7% 14.1% 3.5% 10.0% 3.3% 2.4% 1.2% 30.8% 3.3% 4.0% 3.2% 11.9%
0%
5%
10%
15%
20%
25%
30%
35%
2010 2013
N O V A R E I N V E S T M E N T S . A F R I C A M A N A G E R S U R V E Y 2 0 1 3 . 1 9
N O V A R E I N V E S T M E N T S . A F R I C A M A N A G E R S U R V E Y 2 0 1 3 . 2 0
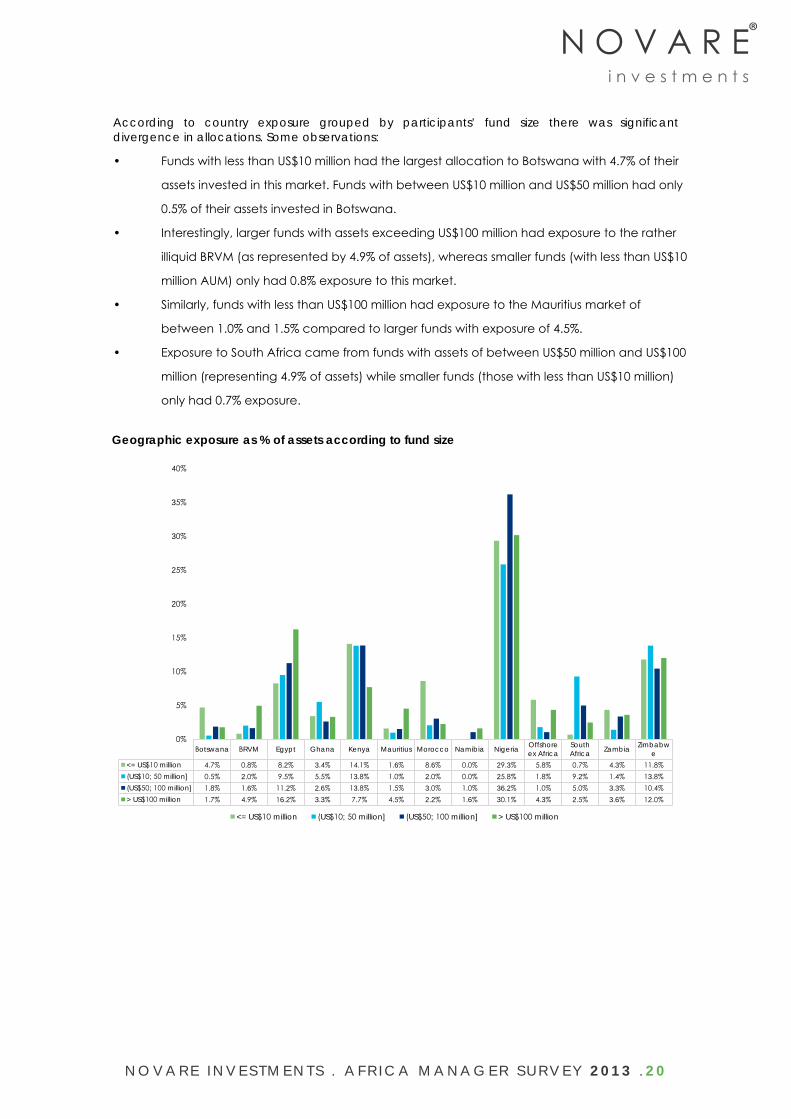
According to country exposure grouped by participants’ fund size there was significant divergence in allocations. Some observations:
• Funds with less than US$10 million had the largest allocation to Botswana with 4.7% of their
assets invested in this market. Funds with between US$10 million and US$50 million had only
0.5% of their assets invested in Botswana.
• Interestingly, larger funds with assets exceeding US$100 million had exposure to the rather
illiquid BRVM (as represented by 4.9% of assets), whereas smaller funds (with less than US$10
million AUM) only had 0.8% exposure to this market.
• Similarly, funds with less than US$100 million had exposure to the Mauritius market of
between 1.0% and 1.5% compared to larger funds with exposure of 4.5%.
• Exposure to South Africa came from funds with assets of between US$50 million and US$100
million (representing 4.9% of assets) while smaller funds (those with less than US$10 million)
only had 0.7% exposure.
Geographic exposure as % of assets according to fund size
Botswana BRVM Egypt Ghana Kenya Mauritius Morocco Namibia Nigeria Offshore ex Africa
South Africa Zambia Zimbabw
e<= US$10 million 4.7% 0.8% 8.2% 3.4% 14.1% 1.6% 8.6% 0.0% 29.3% 5.8% 0.7% 4.3% 11.8%(US$10; 50 million] 0.5% 2.0% 9.5% 5.5% 13.8% 1.0% 2.0% 0.0% 25.8% 1.8% 9.2% 1.4% 13.8%(US$50; 100 million] 1.8% 1.6% 11.2% 2.6% 13.8% 1.5% 3.0% 1.0% 36.2% 1.0% 5.0% 3.3% 10.4%> US$100 million 1.7% 4.9% 16.2% 3.3% 7.7% 4.5% 2.2% 1.6% 30.1% 4.3% 2.5% 3.6% 12.0%
0%
5%
10%
15%
20%
25%
30%
35%
40%
<= US$10 million (US$10; 50 million] (US$50; 100 million] > US$100 million
N O V A R E I N V E S T M E N T S . A F R I C A M A N A G E R S U R V E Y 2 0 1 3 . 2 1
CLOSING REMARKS
There is little doubt that Africa will remain an interesting growth story in coming decades. Since African economies have yet to experience proper assimilation and integration into the global economy, the continent is still sufficiently unique to provide substantive portfolio diversification opportunities for investors at very attractive yields. With the assistance of experienced fund managers and with proper oversight accompanying an understanding of the dynamics and challenges, exposure to quality companies can be obtained in a sensible manner.
As highlighted, the skills and infrastructure already exist in well-established funds and asset managers, which provides a solid platform for potential investors to access these markets and reduce overall operational, country or market specific risks.
The emergence of specialised African funds over the past decade illustrates increasing investor confidence in these markets. Managers of these funds are well positioned with the experience and knowledge necessary to reap returns as well as minimise risk in these non-homogeneous markets.
Challenges to investing in Africa remain, but investors who can overcome these hurdles, either via conducting their own in-depth due diligence or by utilising the skills of a third-party who is well versed and established in these markets, will be best placed to access this unique product set and thus be able to benefit from this growth story.

1
Novare Investments (Pty) LtdThird Floor, The Cliffs Office Block 1Niagara Way | Tyger FallsCarl Cronje Drive | Bellville | 7530South Africa
P O Box 4742Tyger Valley | 7536South Africa
Tel: +27 (0) 21 914 7730Fax: + 27 (0) 21 914 [email protected]
www.novare.com
Authorised Financial Services Provider: 815, 757, 41836
DISCLAIMER
This survey report is for the use of Novare Investments (Pty) Ltd and its clients and is subject to copyright.
Copyright in this document created by Novare Investments will remain vested in us. It may not be
reproduced in total or in part nor published externally without prior written consent of Novare Investments
([email protected]). The information in this survey report does not constitute the personal views of Novare
Investments and opinions expressed herein are subject to change without notice. The information produced
in this document is based on information received from third parties that have not necessarily been verified
by Novare Investments or by another independent party. Information is reported on an aggregate basis
without disclosing any particular asset manager information. While the information contained herein has
been obtained from sources believed to be reliable, Novare Investments (Pty) Ltd makes no representations
as to the accuracy or completeness of this information and accepts no liability in relation to this issue. Novare
Investments will not accept any liability for losses suffered as a result of inaccuracies or incomplete
information. Novare Investments, its directors, employees and agents shall not accept any liability or
responsibility of whatsoever nature and however arising in respect of any claim, damage, loss or expense
relating to or arising out of or in connection with the reliance by anyone on the contents of this document.
This document is for information purposes only and is not intended for the solicitation of new business nor is it
an offer made by Novare Investments. This document does not constitute an offer to buy or a solicitation of
an offer to buy or sell units in any jurisdiction in which an offer or solicitation is not authorised or to any person
to whom it is unlawful to make such an offer of solicitation. Novare Investments does not purport to act as an
advisor or in any fiduciary capacity, nor does it undertake to update, modify or amend the information on a
frequent basis. The information contained in this document does not constitute an investment
commendation or rendering of advice.
The funds covered in this survey are not necessarily regulated financial products and may not comply with
the provisions of the Collective Investment Schemes Control Act 45 of 2002.
Past performance is not indicative of future returns may go up or down. No guarantees are provided in
relation to investment performance.
Novare Investments (Pty) Ltd is an Authorised Financial Services Provider in terms of the Financial Advisory
and Intermediary Services Act No 37 of 2002. FSP No. 757