Functions and Their Graphs - University of Wisconsin ... determine whether an equation is a function...
123
Functions and Their Graphs Chapter 2
-
Upload
truongkhanh -
Category
Documents
-
view
217 -
download
2
Transcript of Functions and Their Graphs - University of Wisconsin ... determine whether an equation is a function...
Functions and Their Graphs
Chapter 2

Functions
Section 2.1

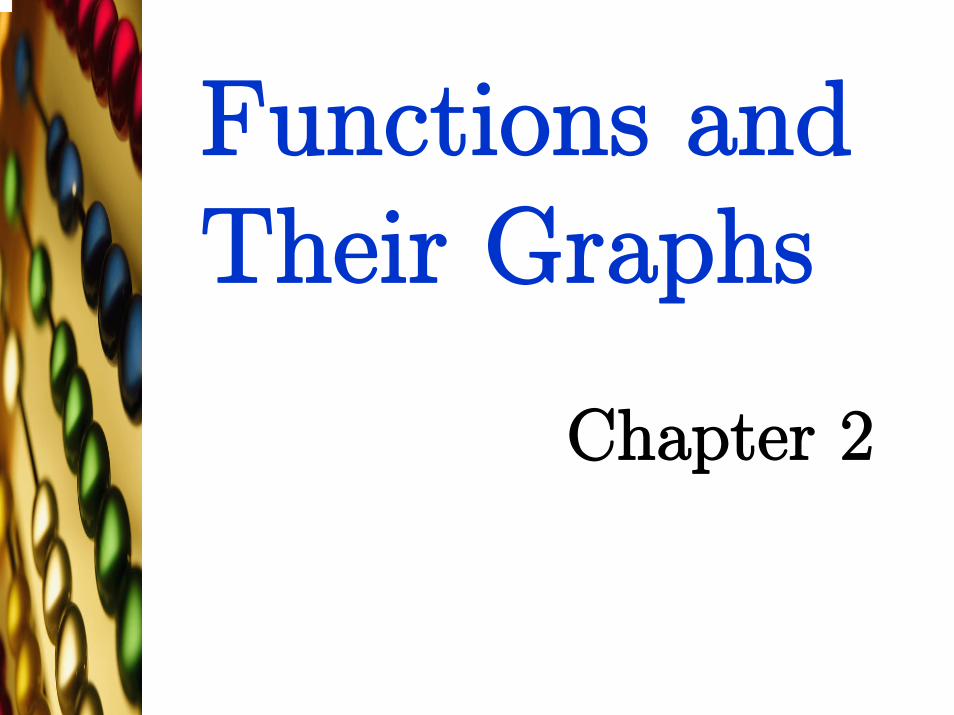
Relations
Relation: A correspondence between two sets.
x corresponds to y or y depends on x
if a relation exists between x and y
Denote by x → y in this case.
Relations
Example.
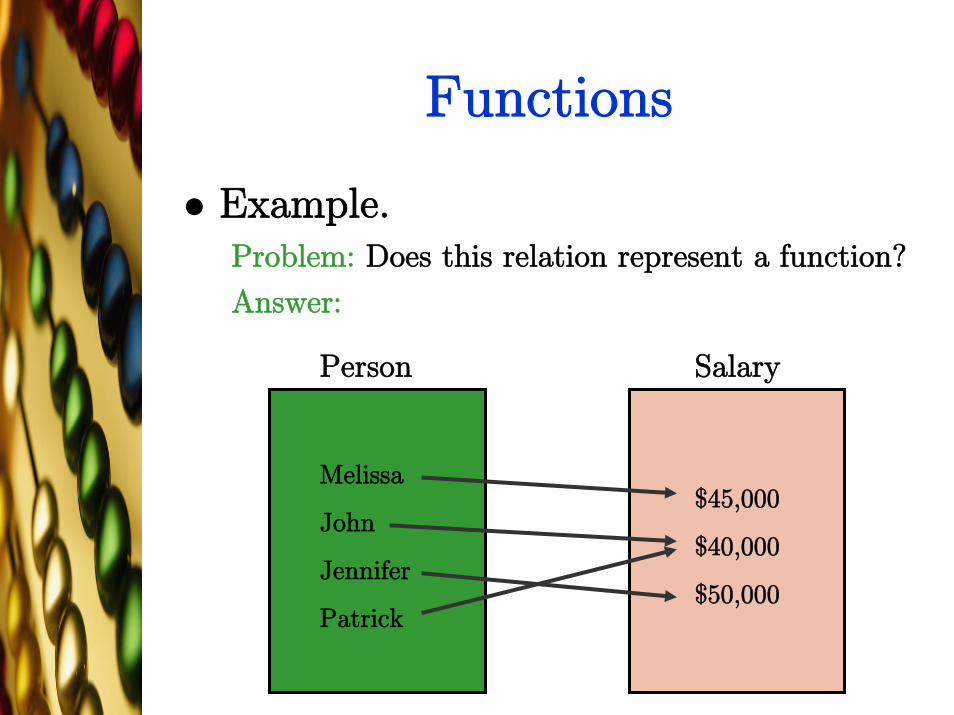
Melissa
John
Jennifer
Patrick
$45,000
$40,000
$50,000
Person Salary
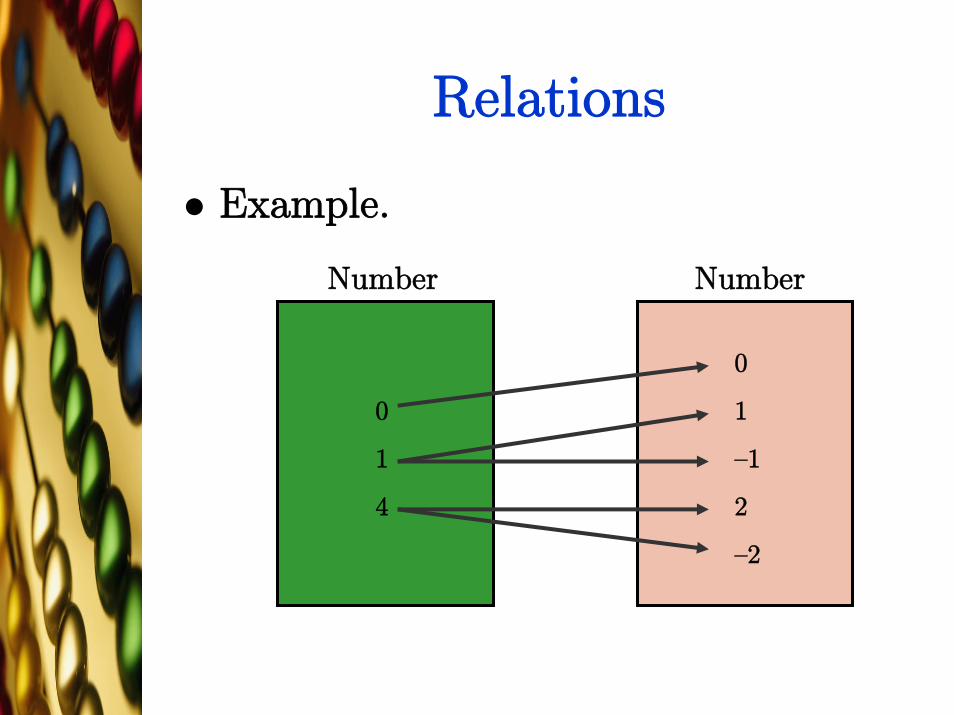
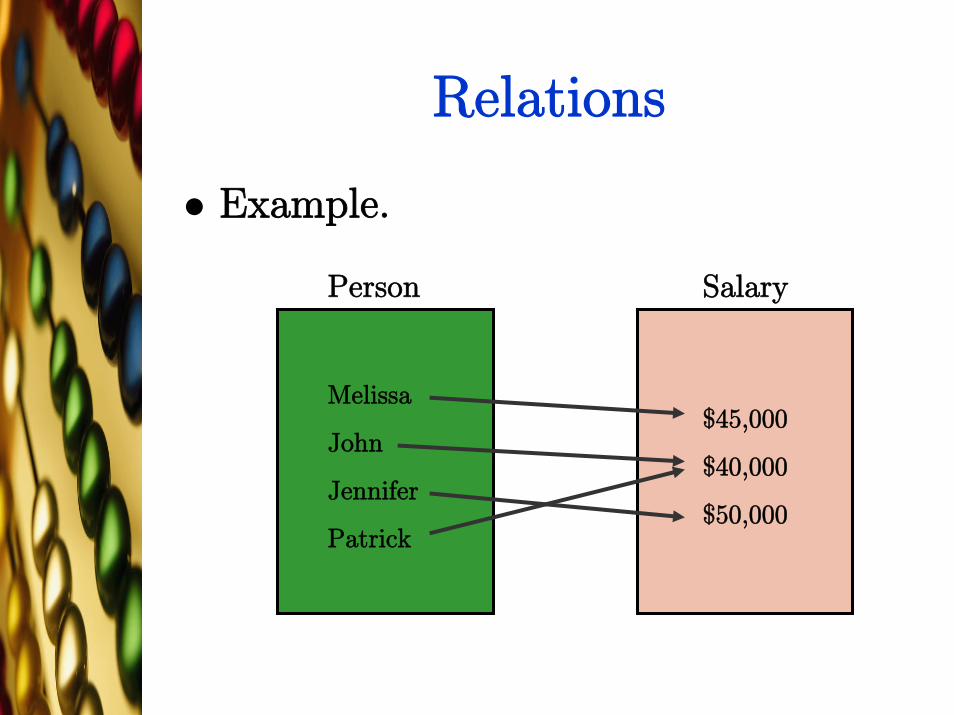
Relations
Example.
0
1
4
0
1
—1
2
—2
Number Number

Functions
Function: special kind of relation
Each input corresponds to precisely one output
If X and Y are nonempty sets, a function from X into Y is a relation that associates with each element of Xexactly one element of Y
Functions
Example.Problem: Does this relation represent a function?
Answer:
Melissa
John
Jennifer
Patrick
$45,000
$40,000
$50,000
Person Salary

Functions
Example.Problem: Does this relation represent a function?
Answer:
0
1
4
0
1
—1
2
—2
Number Number
Domain and Range
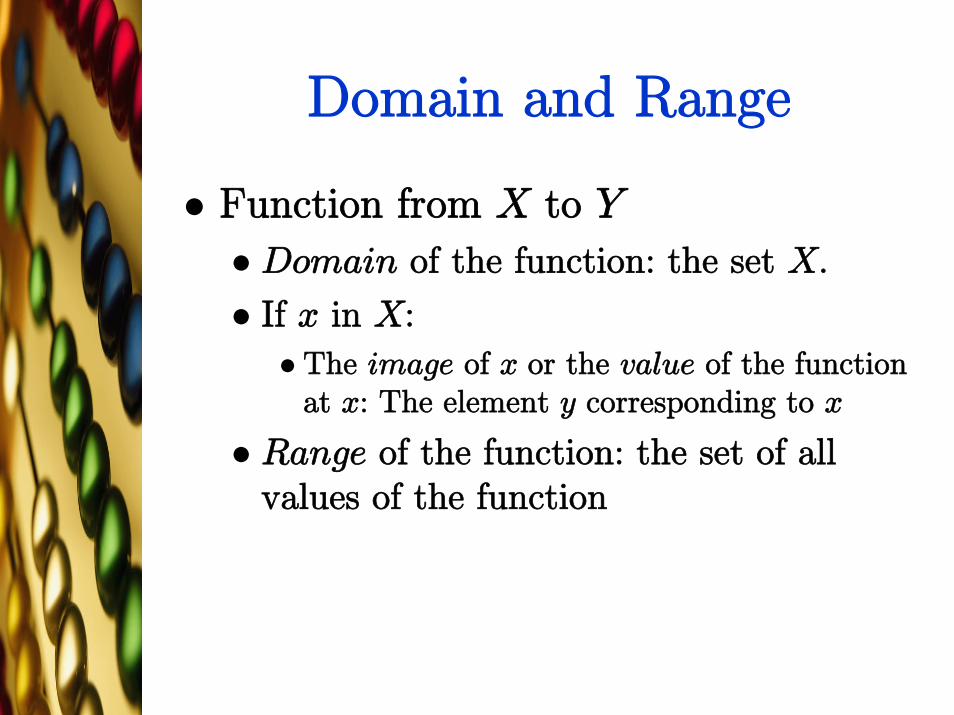
Function from X to Y
Domain of the function: the set X.
If x in X:
The image of x or the value of the function at x: The element y corresponding to x
Range of the function: the set of all values of the function
Domain and Range
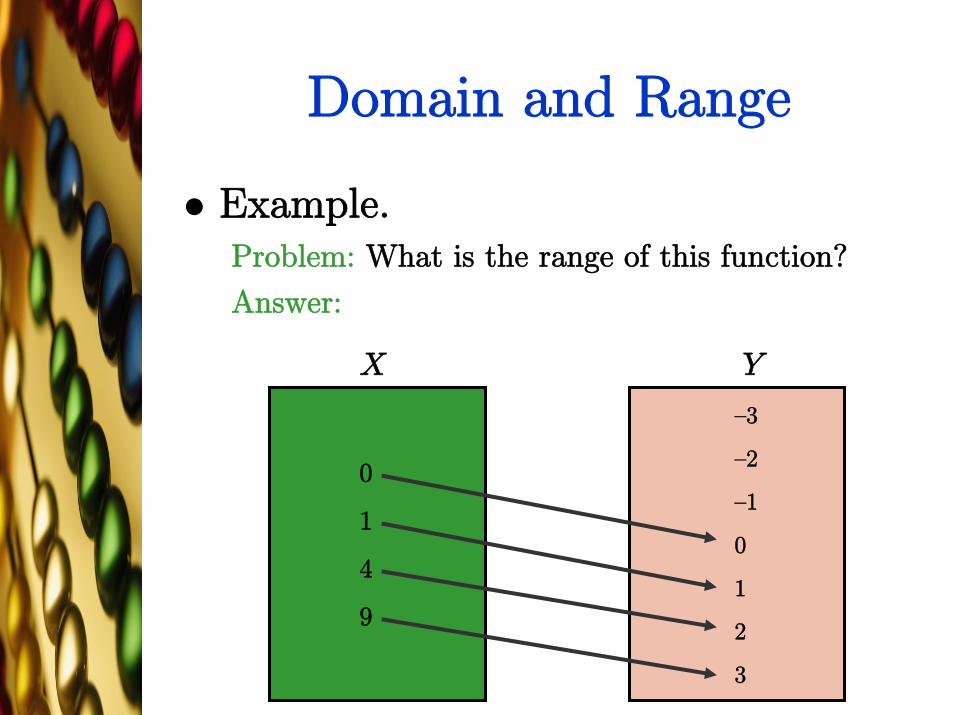
Example.Problem: What is the range of this function?
Answer:
0
1
4
9
—3
—2
—1
0
1
2
3
X Y

Domain and Range
Example. Determine whether the relation represents a function. If it is a function, state the domain and range.
Problem:
Relation: {(2,5), (6,3), (8,2), (4,3)}
Answer:
Domain and Range
Example. Determine whether the relation represents a function. If it is a function, state the domain and range.
Problem:
Relation: {(1,7), (0, —3), (2,4), (1,8)}
Answer:
Equations as Functions
To determine whether an equation is a function
Solve the equation for y.
If any value of x in the domain corresponds to more than one y, the equation doesn’t define a function
Otherwise, it does define a function.
Equations as Functions
Example.
Problem: Determine if the equation
x + y2 = 9
defines y as a function of x.
Answer:
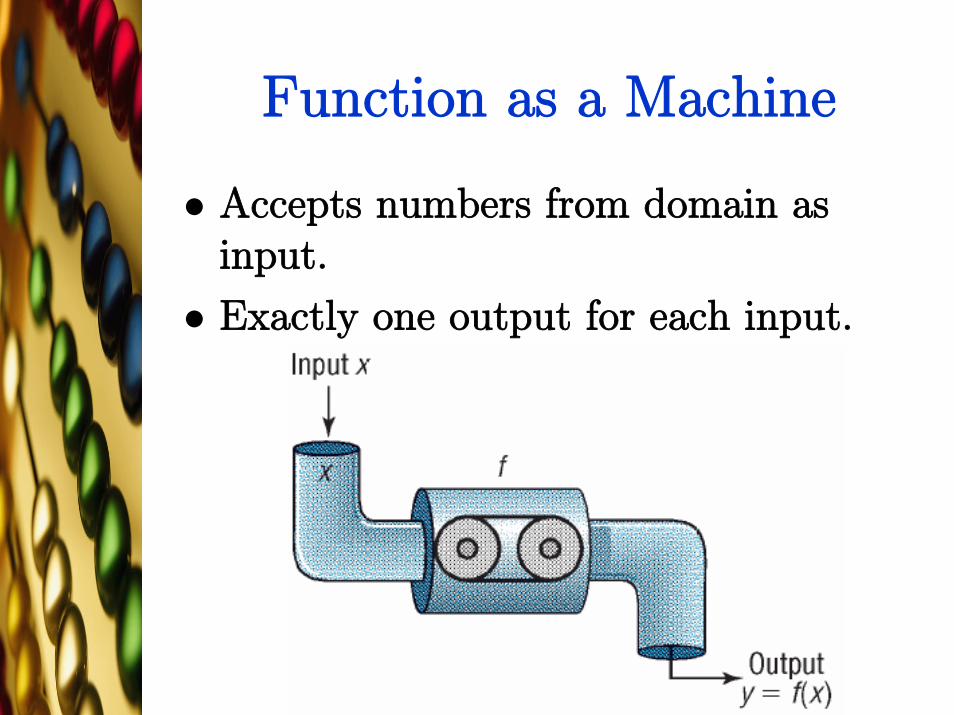
Function as a Machine
Accepts numbers from domain as input.
Exactly one output for each input.
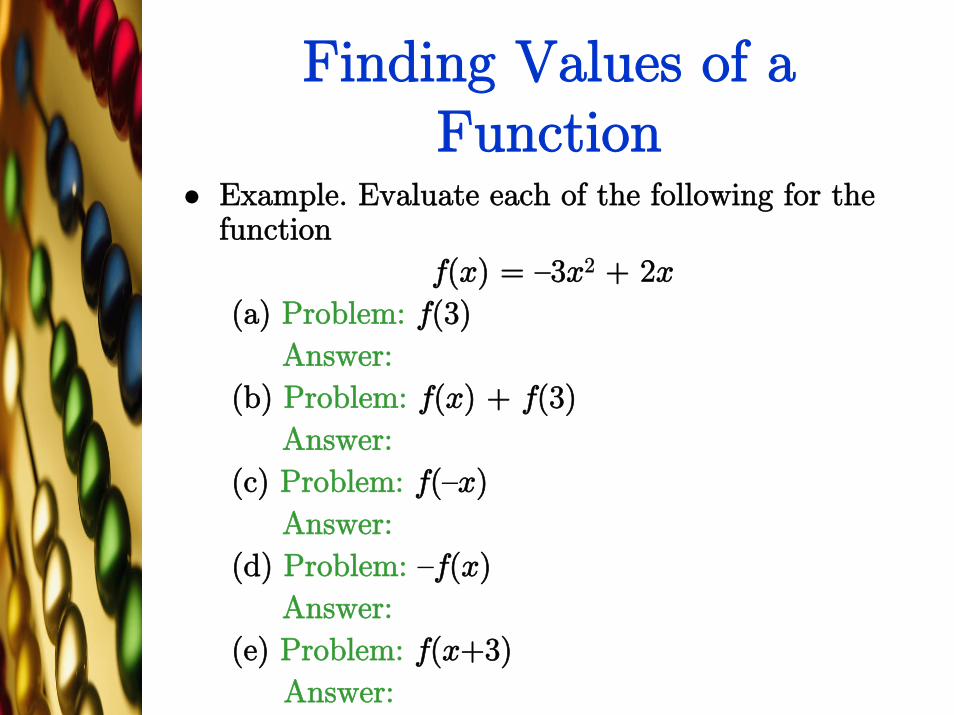
Finding Values of a Function
Example. Evaluate each of the following for the function
f(x) = —3x2 + 2x
(a) Problem: f(3)
Answer:
(b) Problem: f(x) + f(3)
Answer:
(c) Problem: f(—x)
Answer:
(d) Problem: —f(x)
Answer:
(e) Problem: f(x+3)
Answer:

Finding Values of a Function
Example. Evaluate the difference
quotient
of the function
Problem: f(x) = — 3x2 + 2x.
Answer:

Implicit Form of a Function
A function given in terms of xand y is given implicitly.
If we can solve an equation for yin terms of x, the function is given explicitly
Implicit Form of a Function
Example. Find the explicit form of the implicit function.
(a) Problem: 3x + y = 5
Answer:
(b) Problem: xy + x = 1
Answer:
Important Facts
For each x in the domain of f, there is exactly one image f(x) in the range
An element in the range can result from more than one x in the domain
We usually call x the independentvariable
y is the dependent variable
Finding the Domain
If the domain isn’t specified, it will always be the largest set of real numbers for which f(x) is a real number
We can’t take square roots of negative numbers (yet) or divide by zero
Finding the Domain
Example. Find the domain of each of the following functions.
(a) Problem: f(x) = x2 — 9
Answer:
(b) Problem:
Answer:
(c) Problem:
Answer:
Finding the Domain
Example. A rectangular garden has a perimeter of 100 feet.
(a) Problem: Express the area A of the
garden as a function of the width w.
Answer:
(b) Problem: Find the domain of A(w)
Answer:
Operations on Functions
Arithmetic on functions f and g
Sum of functions:
(f + g)(x) = f(x) + g(x)
Difference of functions:
(f — g)(x) = f(x) — g(x)
Domains: Set of all real numbers in the domains of both f and g.
For both sum and difference

Operations on Functions
Arithmetic on functions f and g
Product of functions f and g is
(f · g)(x) = f(x) · g(x)
The quotient of functions f and g is
Domain of product: Set of all real numbers in the domains of both f and g
Domain of quotient: Set of all real numbers in
the domains of both f and g with g(x) ≠ 0
)(
)()(
xg
xfx
g
f=⎟⎟
⎠
⎞⎜⎜⎝
⎛
Operations on Functions
Example. Given f(x) = 2x2 + 3 and g(x) = 4x3 + 1.
(a) Problem: Find f+g and its domain
Answer:
(b) Problem: Find f — g and its domain
Answer:

Operations on Functions
Example. Given f(x) = 2x2 + 3 and g(x) = 4x3 + 1.
(c) Problem: Find f·g and its domain
Answer:
(d) Problem: Find f/g and its domain
Answer:

Key Points
Relations
Functions
Domain and Range
Equations as Functions
Function as a Machine
Finding Values of a Function
Implicit Form of a Function
Important Facts
Finding the Domain

Key Points (cont.)
Operations on Functions

The Graph of a Function
Section 2.2

Vertical-line Test
Theorem. [Vertical-Line Test]
A set of points in the xy-plane is the
graph of a function if and only if
every vertical line intersects the
graphs in at most one point.
Vertical-line Test
-6 -4 -2 2 4 6
-6
-4
-2
2
4
6
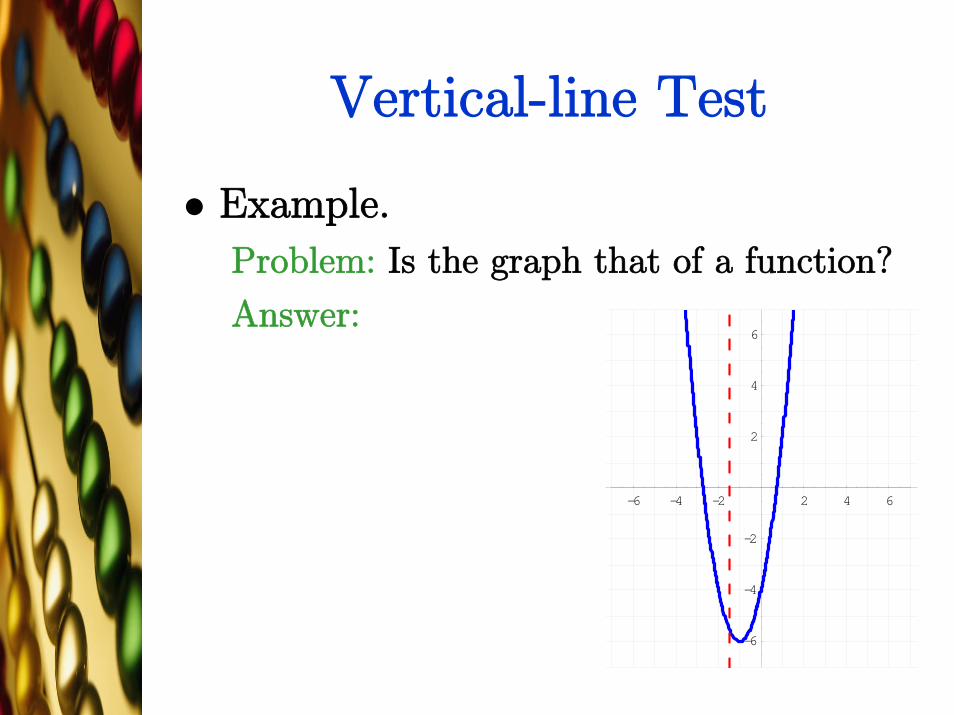
Example.
Problem: Is the graph that of a function?
Answer:

Vertical-line Test
-6 -4 -2 2 4 6
-6
-4
-2
2
4
6
Example.
Problem: Is the graph that of a function?
Answer:
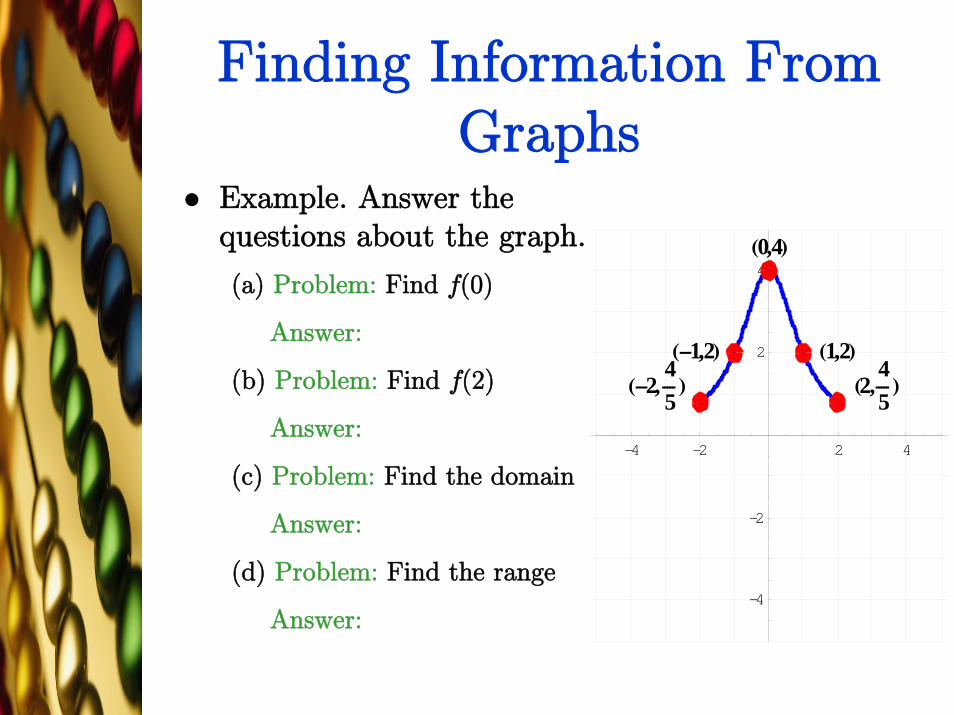
Finding Information From Graphs
Example. Answer the questions about the graph.
(a) Problem: Find f(0)
Answer:
(b) Problem: Find f(2)
Answer:
(c) Problem: Find the domain
Answer:
(d) Problem: Find the range
Answer:
-4 -2 2 4
-4
-2
2
4
H2,4ÄÄÄÄÄ5LH-2, 4
ÄÄÄÄÄ5L
H1,2LH-1,2L
H0,4L

Finding Information From Graphs
Example. Answer the questions about the graph.
(e) Problem: Find the
x-intercepts:
Answer:
(f) Problem: Find the
y-intercepts:
Answer:
-4 -2 2 4
-4
-2
2
4
H2,4ÄÄÄÄÄ5LH-2, 4
ÄÄÄÄÄ5L
H1,2LH-1,2L
H0,4L

Finding Information From Graphs
Example. Answer the questions about the graph.
(g) Problem: How often does
the line y = 3 intersect the
graph?
Answer:
(h) Problem: For what values
of x does f(x) = 2?
Answer:
(i) Problem: For what values
of x is f(x) > 0?
Answer:
-4 -2 2 4
-4
-2
2
4
H2,4ÄÄÄÄÄ5LH-2, 4
ÄÄÄÄÄ5L
H1,2LH-1,2L
H0,4L
Finding Information From Formulas
Example. Answer the following questions for the function
f(x) = 2x2 — 5(a) Problem: Is the point (2,3) on the graph of
y = f(x)?
Answer:
(b) Problem: If x = —1, what is f(x)? What is the corresponding point on the graph?
Answer:
(c) Problem: If f(x) = 1, what is x? What is (are) the corresponding point(s) on the graph?
Answer:
Key Points
Vertical-line Test
Finding Information From Graphs
Finding Information From Formulas

Properties of Functions
Section 2.3

Even and Odd Functions
Even function:
For every number x in its domain, the
number —x is also in the domain
f(—x) = f(x)
Odd function:
For every number x in its domain, the
number —x is also in the domain
f(—x) = —f(x)

Description of Even and Odd Functions
Even functions:
If (x, y) is on the graph, so is (—x, y)
Odd functions:
If (x, y) is on the graph, so is (—x, —y)

Description of Even and Odd Functions
Theorem. A function is even if and only if its graph is symmetric with respect to the y-axis.A function is odd if and only if its graph is symmetric with respect to the origin.
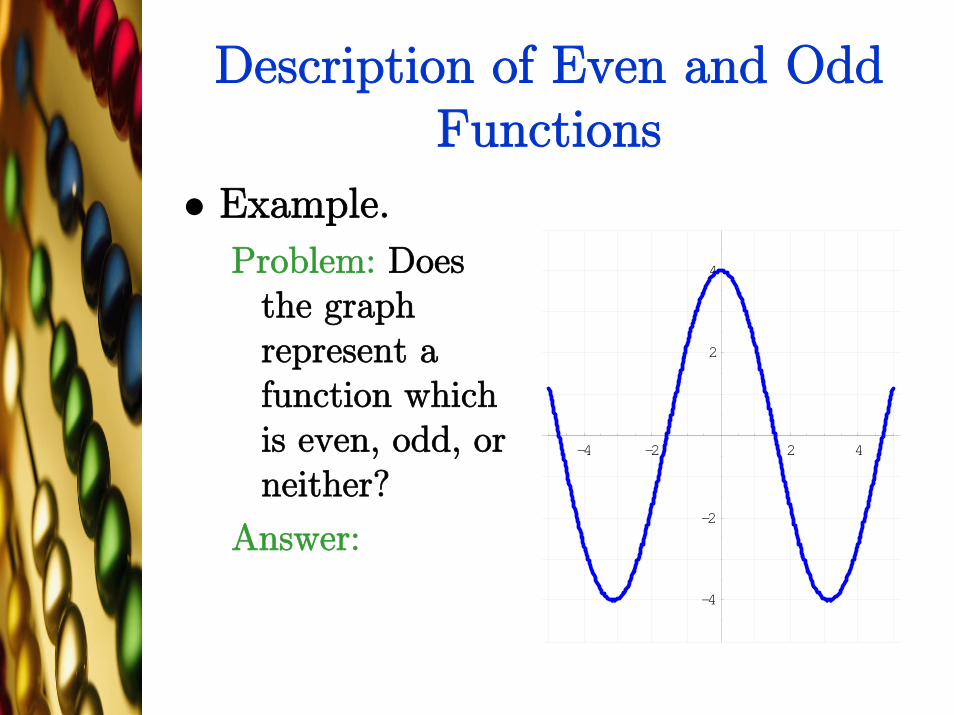
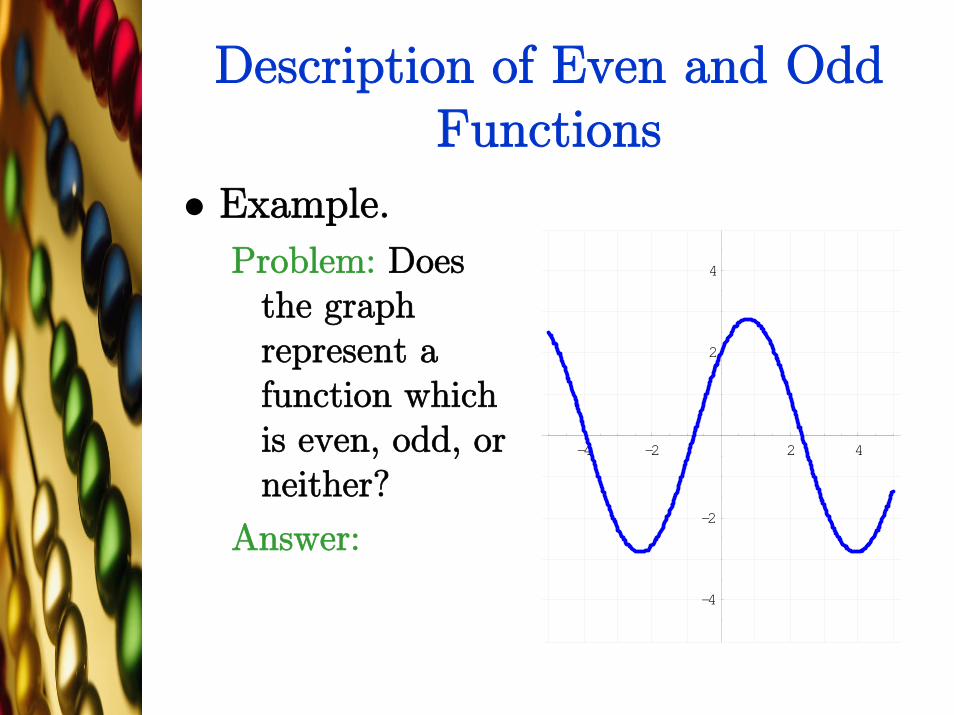
Description of Even and Odd Functions
Example.
Problem: Does the graph represent a function which is even, odd, or neither?
Answer:
-4 -2 2 4
-4
-2
2
4
Description of Even and Odd Functions
Example.
Problem: Does the graph represent a function which is even, odd, or neither?
Answer:
-4 -2 2 4
-4
-2
2
4

Description of Even and Odd Functions
Example.
Problem: Does the graph represent a function which is even, odd, or neither?
Answer:
-4 -2 2 4
-4
-2
2
4
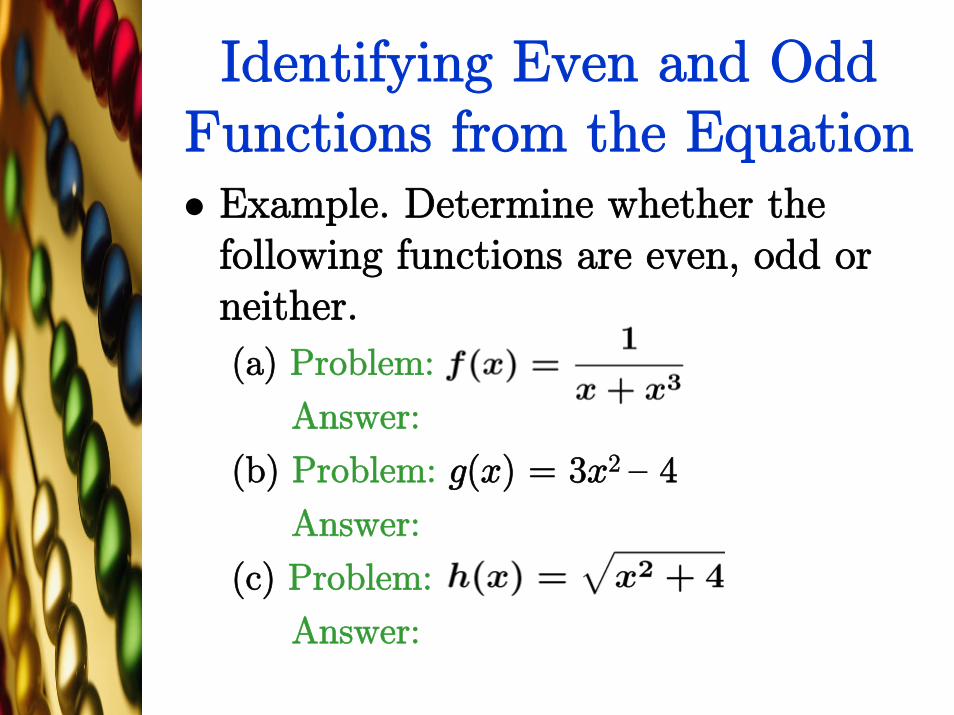
Identifying Even and Odd Functions from the Equation
Example. Determine whether the following functions are even, odd or neither.
(a) Problem:
Answer:
(b) Problem: g(x) = 3x2 — 4
Answer:
(c) Problem:
Answer:

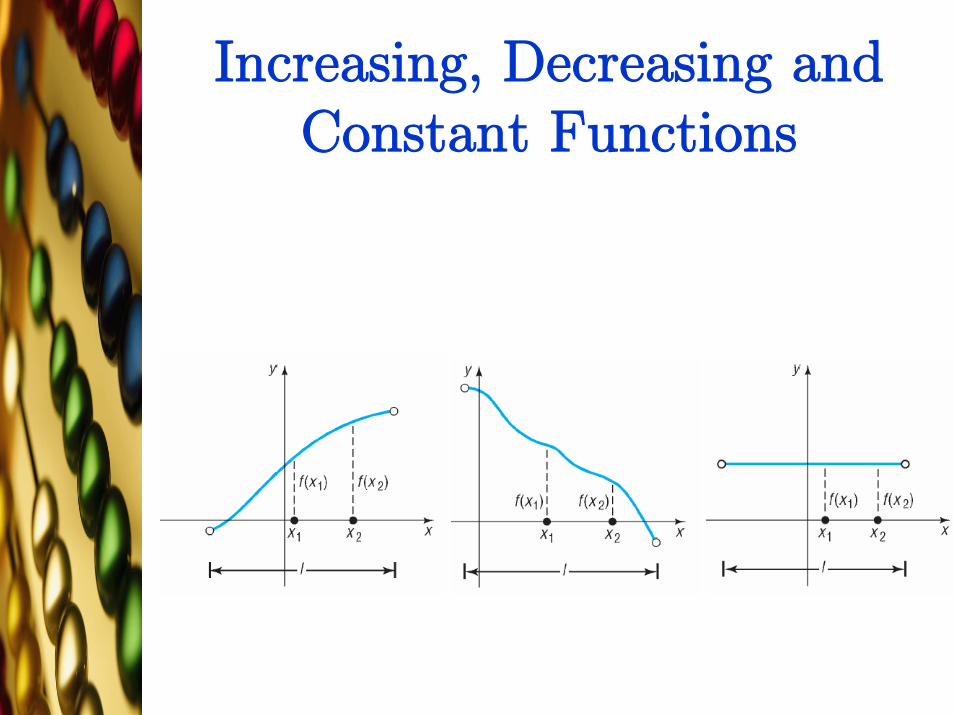
Increasing, Decreasing and Constant Functions
Increasing function (on an open interval I).
For any choice of x1 and x2 in I, with x1 < x2, we have f(x1) < f(x2)
Decreasing function (on an open interval I)
For any choice of x1 and x2 in I, with x1 < x2, we have f(x1) > f(x2)
Constant function (on an open interval I) For all choices of x in I, the values f(x) are equal.
Increasing, Decreasing and Constant Functions
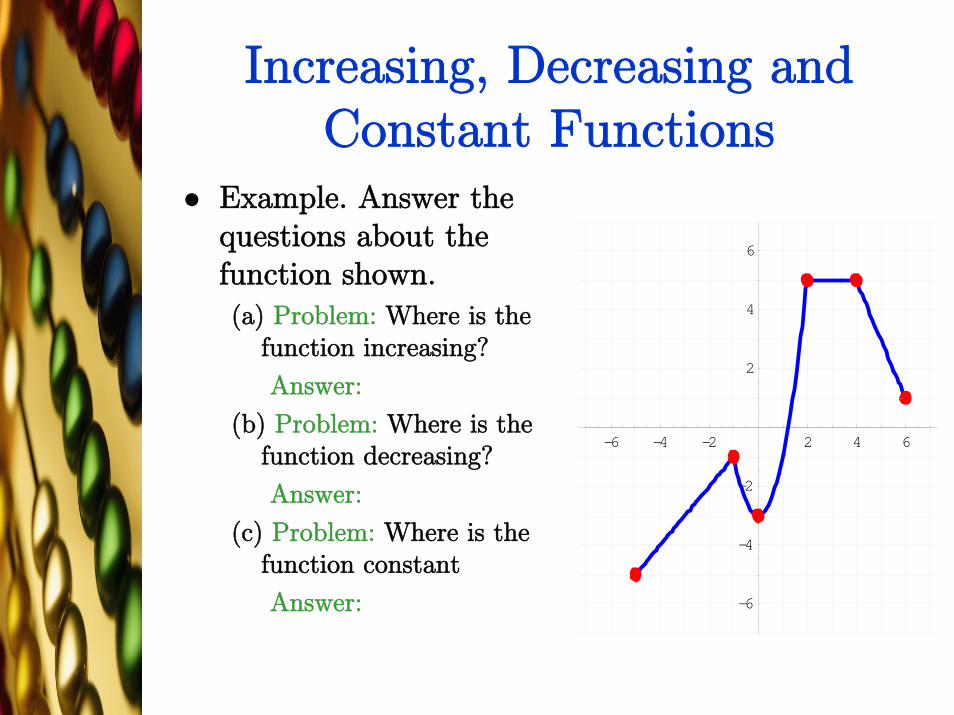
Increasing, Decreasing and Constant Functions
Example. Answer the questions about the function shown.(a) Problem: Where is the
function increasing?
Answer:
(b) Problem: Where is the function decreasing?
Answer:
(c) Problem: Where is the function constant
Answer:
-6 -4 -2 2 4 6
-6
-4
-2
2
4
6
Increasing, Decreasing and Constant Functions
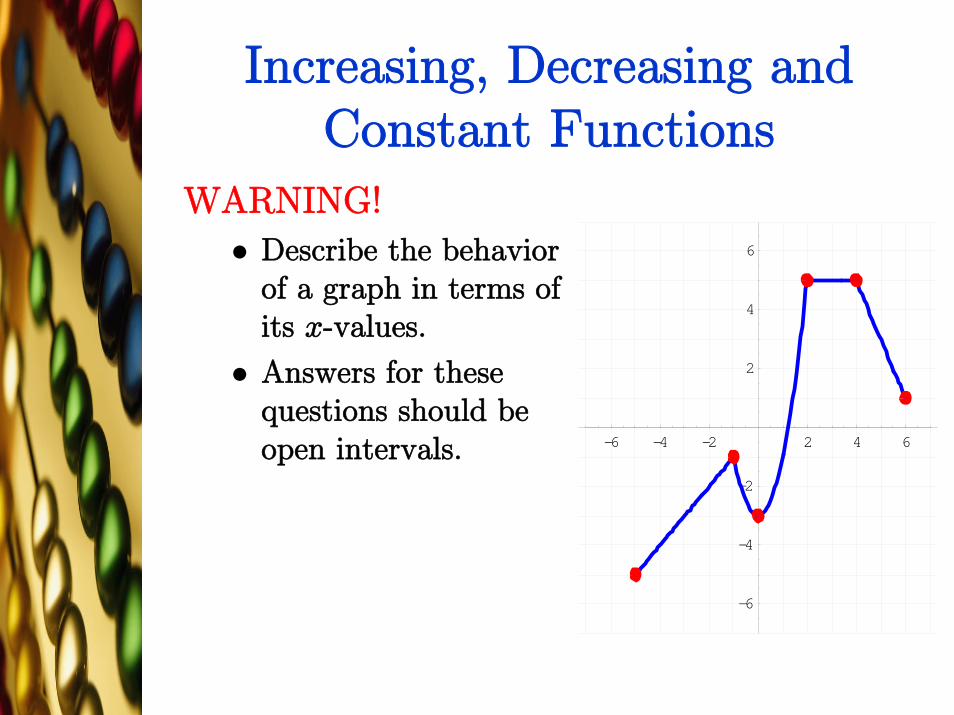
WARNING!
Describe the behavior of a graph in terms of its x-values.
Answers for these questions should be open intervals. -6 -4 -2 2 4 6
-6
-4
-2
2
4
6
Local Extrema
Local maximum at c:
Open interval I containing x so that, for all x ≤ c in I, f(x) ≤ f(c).
f(c) is a local maximum of f.
Local minimum at c:
Open interval I containing x so that, for all x ≤ c in I, f(x) ≥ f(c).
f(c) is a local minimum of f.
Local extrema.
Collection of local maxima and minima

Local Extrema
For local maxima:
Graph is increasing to the left of c
Graph is decreasing to the right of c.
For local minima:
Graph is decreasing to the left of c
Graph is increasing to the right of c.

Local Extrema
Example. Answer the questions about the given graph of f.
(a) Problem: At which
number(s) does f have a
local maximum?
Answer:
(b) Problem: At which
number(s) does f have a
local minimum?
Answer:
-7.5 -5 -2.5 2.5 5 7.5
-6
-4
-2
2
4
6

Average Rate of Change
Slope of a line can be interpreted as the average rate of change
Average rate of change: If c is in the domain of y = f(x)
Also called the difference quotient of fat c
Average Rate of Change
Example. Find the average rates of change of
(a) Problem: From 0 to 1.
Answer:
(b) Problem: From 0 to 3.
Answer:
(c) Problem: From 1 to 3:
Answer:
Secant Lines
Geometric interpretation to the average rate of change
Label two points (c, f(c)) and (x, f(x))
Draw a line containing the points.
This is the secant line.
Theorem. [Slope of the Secant Line]The average rate of change of a function equals the slope of the secant line containing two points on its graph

Secant Lines

-7.5 -5 -2.5 2.5 5 7.5
-5
-2.5
2.5
5
7.5
10
12.5
15
Secant Lines
Example.
Problem: Find an
equation of the
secant line to
containing (0, f(0))
and (5, f(5))
Answer:

Key Points
Even and Odd Functions
Description of Even and Odd Functions
Identifying Even and Odd Functions from the Equation
Increasing, Decreasing and Constant Functions
Local Extrema
Average Rate of Change
Key Points (cont.)
Secant Lines
Linear Functions and Models
Section 2.4
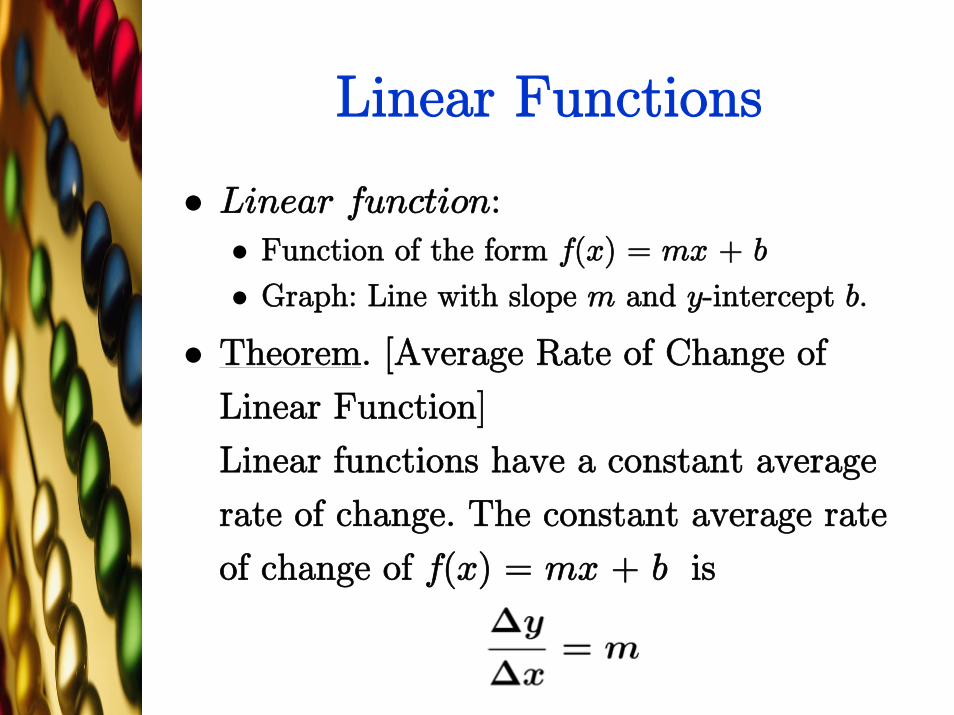
Linear Functions
Linear function:
Function of the form f(x) = mx + b
Graph: Line with slope m and y-intercept b.
Theorem. [Average Rate of Change of
Linear Function]
Linear functions have a constant average
rate of change. The constant average rate
of change of f(x) = mx + b is

-10 -5 5 10
-10
-7.5
-5
-2.5
2.5
5
7.5
10
Linear Functions
Example.
Problem: Graph the linear function
f(x) = 2x — 5
Answer:

Application: Straight-Line Depreciation
Example. Suppose that a company has just purchased a new machine for its manufacturing facility for $120,000. The company chooses to depreciate the machine using the straight-line method over 10 years.For straight-line depreciation, the value of the asset declines by a fixed amount every year.

2 4 6 8 10 12 14
-40000
-20000
20000
40000
60000
80000100000
120000
140000
Example. (cont.)
(a) Problem: Write a linear function that expresses the book value of the machine as a function of its age, x
Answer:
(b) Problem: Graph the linear function
Answer:
Application: Straight-Line Depreciation

Example. (cont.)
(c) Problem: What is the book value of the machine after 4 years?
Answer:
(d) Problem: When will the machine be worth $20,000?
Answer:
Application: Straight-Line Depreciation

Scatter Diagrams
Example. The amount of money that a lending institution will allow you to borrow mainly depends on the interest rate and your annual income.
The following data represent the annual income, I, required by a bank in order to lend L dollars at an interest rate of 7.5% for 30 years.
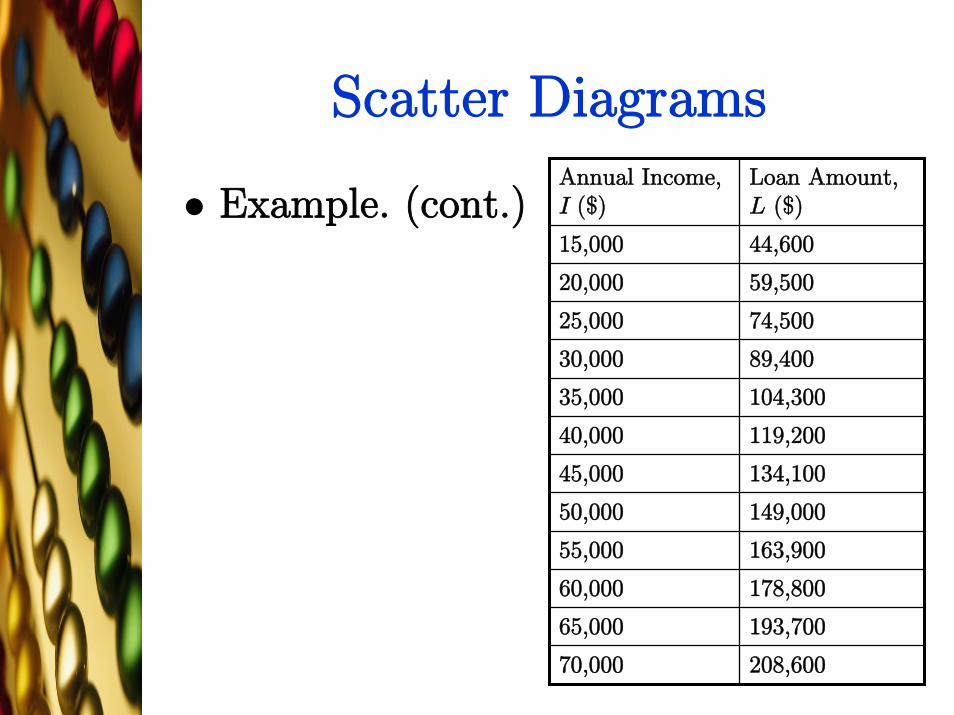
Scatter Diagrams
Example. (cont.) Annual Income, I ($)
Loan Amount, L ($)
15,000 44,600
20,000 59,500
25,000 74,500
30,000 89,400
35,000 104,300
40,000 119,200
45,000 134,100
50,000 149,000
55,000 163,900
60,000 178,800
65,000 193,700
70,000 208,600
Scatter Diagrams
Example. (cont.)
Problem: Use a graphing utility to draw a scatter diagram of the data.
Answer:
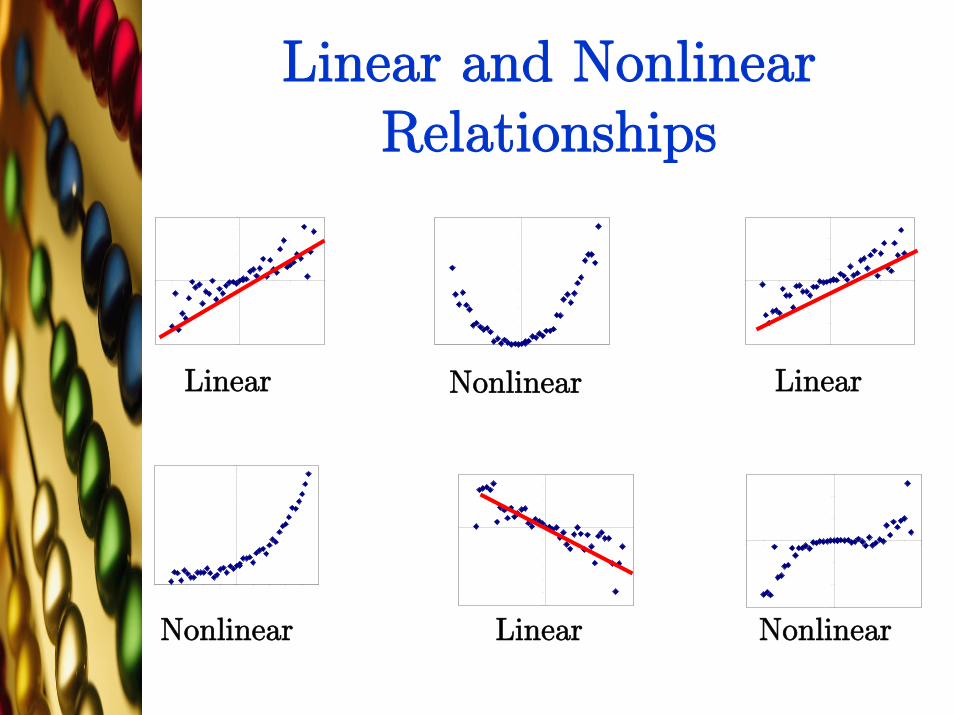
Linear and Nonlinear Relationships
0 .0
1 .0
2 .0
3 .0
4 .0
5 .0
6 .0
7 .0
-2 .5 -2 -1 .5 -1 -0 .5 0 0 .5 1 1 .5 2 2 .5
0 .0
1 .0
2 .0
3 .0
4 .0
5 .0
6 .0
7 .0
8 .0
9 .0
1 0 .0
-2 .5 -2 -1 .5 -1 -0 .5 0 0 .5 1 1 .5 2 2 .5
-1 0 .0
-8 .0
-6 .0
-4 .0
-2 .0
0 .0
2 .0
4 .0
6 .0
8 .0
1 0 .0
-2 .5 -2 -1 .5 -1 -0 .5 0 0 .5 1 1 .5 2 2 .5
-1 2 .0
-1 0 .0
-8 .0
-6 .0
-4 .0
-2 .0
0 .0
2 .0
4 .0
6 .0
8 .0
-2 .5 -2 -1 .5 -1 -0 .5 0 0 .5 1 1 .5 2 2 .5
-1 5 .0
-1 0 .0
-5 .0
0 .0
5 .0
1 0 .0
1 5 .0
-2 .5 -2 -1 .5 -1 -0 .5 0 0 .5 1 1 .5 2 2 .5
-1 5 .0
-1 0 .0
-5 .0
0 .0
5 .0
1 0 .0
1 5 .0
-2 .5 -2 -1 .5 -1 -0 .5 0 0 .5 1 1 .5 2 2 .5
Linear Nonlinear Linear
Nonlinear Linear Nonlinear
Line of Best Fit
For linearly related scatter diagram
Line is line of best fit.
Use graphing calculator to find
Example.
(a) Problem: Use a graphing utility to find the line of best fit to the data in the last example.
Answer:
Line of Best Fit
Example. (cont.)
(b) Problem: Graph the line of best fit from the last example on the scatter diagram.
Answer:
Line of Best Fit
Example. (cont.)
(c) Problem: Determine the loan amount that an individual would qualify for if her income is $42,000.
Answer:

Direct Variation
Variation or proportionality.
y varies directly with x, or is directly proportional to x:
There is a nonzero number such that y = kx.
k is the constant of proportionality.
Direct Variation
Example. Suppose y varies directly with x. Suppose as well that y = 15 when x = 3.
(a) Problem: Find the constant of proportionality.
Answer:
(b) Problem: Find x when y = 124.53.
Answer:
Key Points
Linear Functions
Application: Straight-Line Depreciation
Scatter Diagrams
Linear and Nonlinear Relationships
Line of Best Fit
Direct Variation

Library of Functions;Piecewise-defined Functions
Section 2.5
Linear Functions
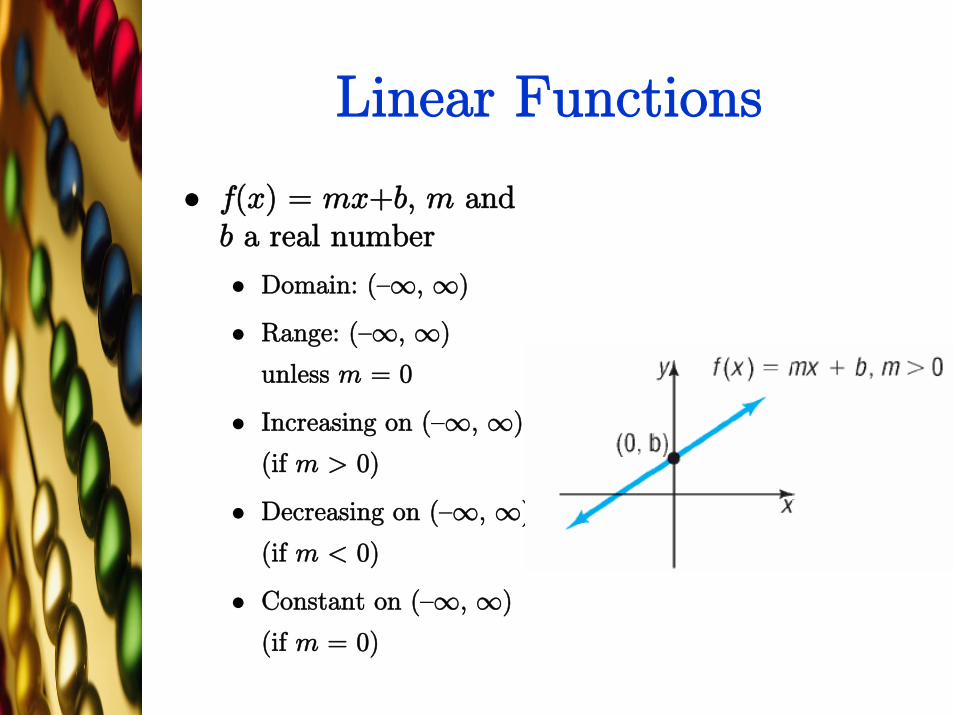
f(x) = mx+b, m and b a real number
Domain: (—∞, ∞)
Range: (—∞, ∞)
unless m = 0
Increasing on (—∞, ∞)
(if m > 0)
Decreasing on (—∞, ∞)
(if m < 0)
Constant on (—∞, ∞)
(if m = 0)
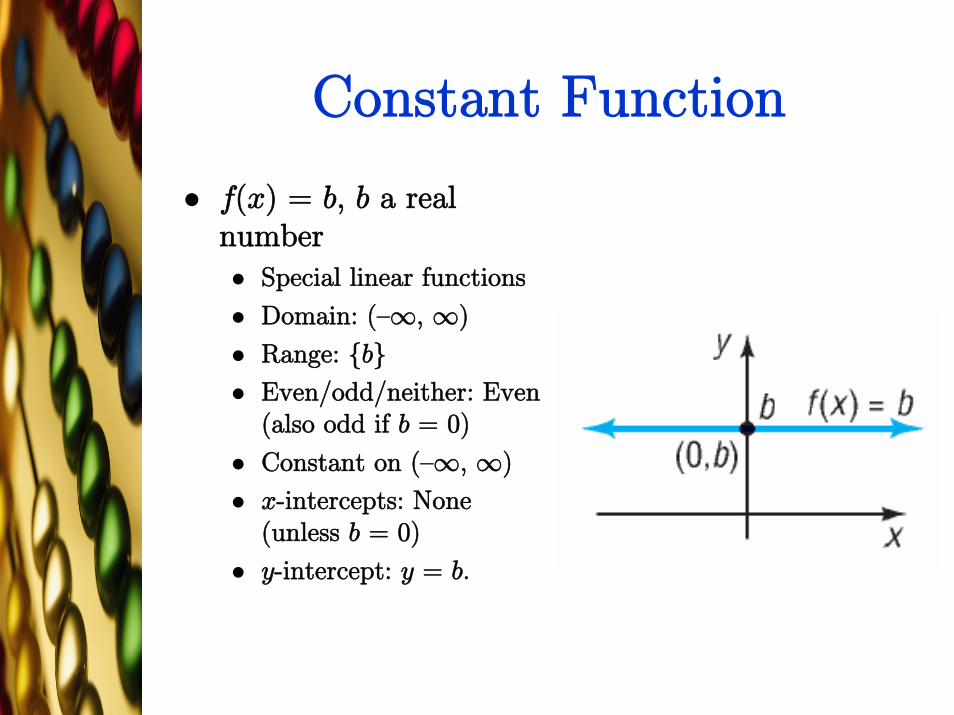
Constant Function
f(x) = b, b a real number
Special linear functions
Domain: (—∞, ∞)
Range: {b}
Even/odd/neither: Even (also odd if b = 0)
Constant on (—∞, ∞)
x-intercepts: None (unless b = 0)
y-intercept: y = b.

Identity Function
f(x) = xSpecial linear function
Domain: (—∞, ∞)
Range: (—∞, ∞)
Even/odd/neither: Odd
Increasing on (—∞, ∞)
x-intercepts: x = 0
y-intercept: y = 0.
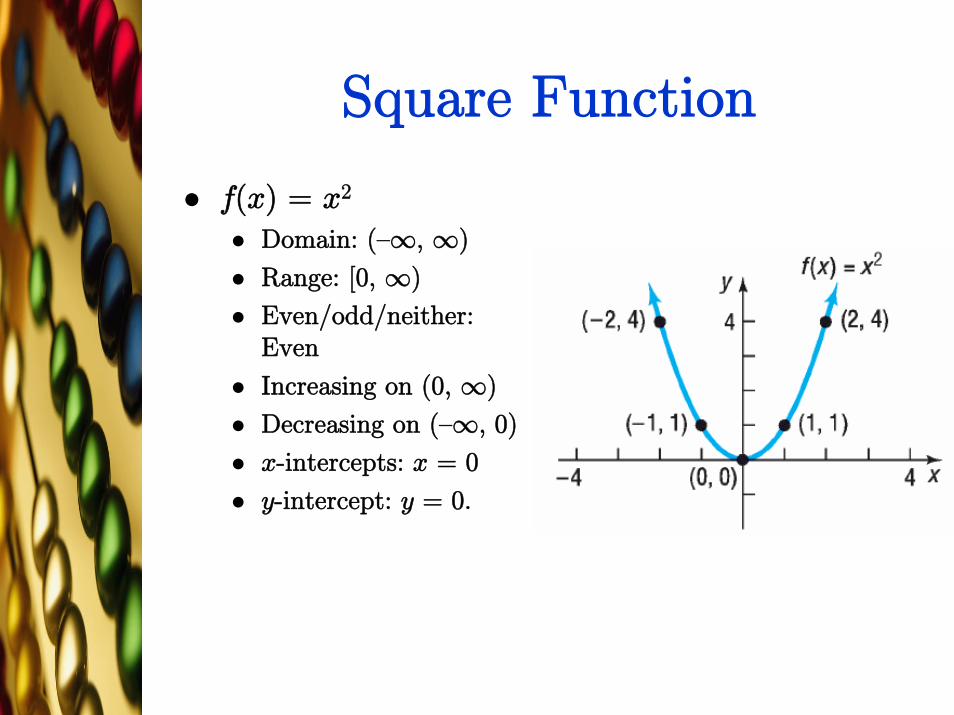
Square Function
f(x) = x2
Domain: (—∞, ∞)
Range: [0, ∞)
Even/odd/neither: Even
Increasing on (0, ∞)
Decreasing on (—∞, 0)
x-intercepts: x = 0
y-intercept: y = 0.
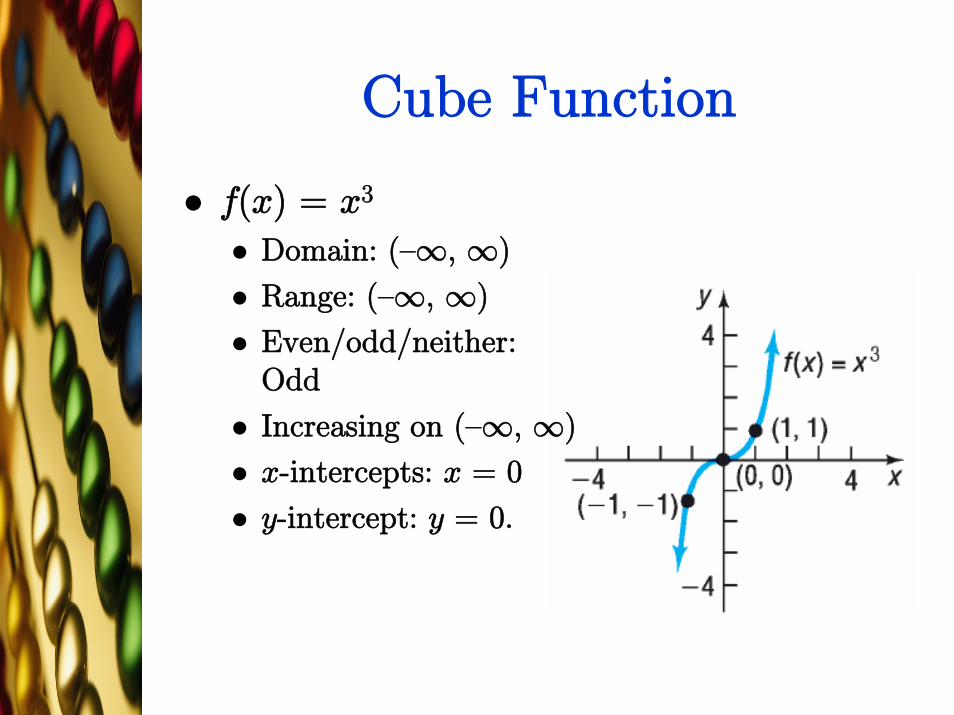
Cube Function
f(x) = x3
Domain: (—∞, ∞)
Range: (—∞, ∞)
Even/odd/neither: Odd
Increasing on (—∞, ∞)
x-intercepts: x = 0
y-intercept: y = 0.

Square Root Function
Domain: [0, ∞)
Range: [0, ∞)
Even/odd/neither: Neither
Increasing on (0, ∞)
x-intercepts: x = 0
y-intercept: y = 0
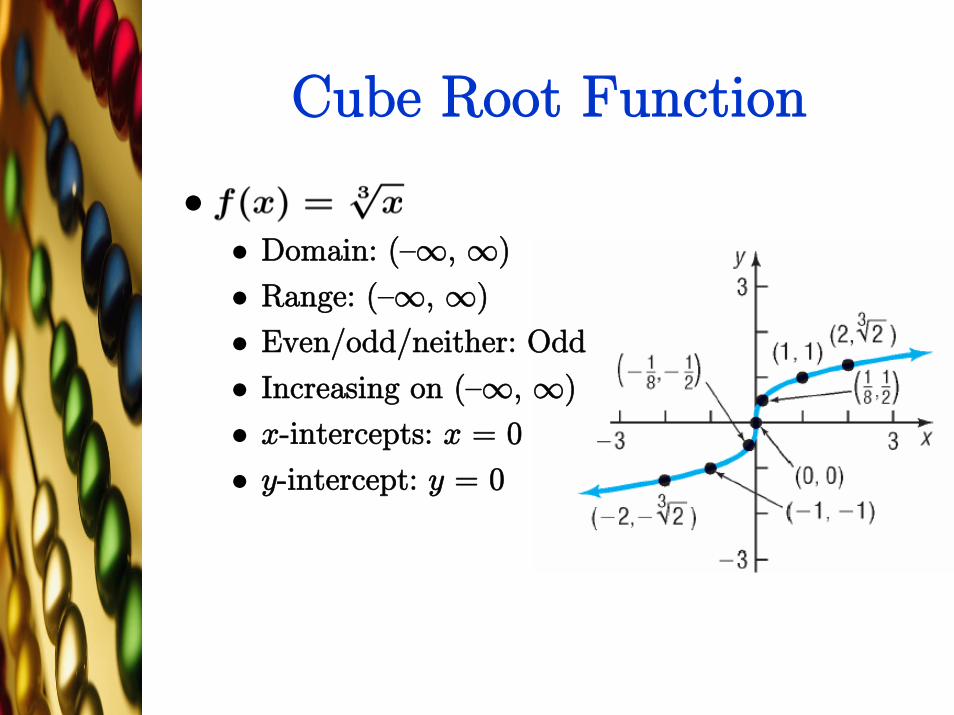
Cube Root Function
Domain: (—∞, ∞)
Range: (—∞, ∞)
Even/odd/neither: Odd
Increasing on (—∞, ∞)
x-intercepts: x = 0
y-intercept: y = 0

Reciprocal Function
Domain: x ≠ 0
Range: x ≠ 0
Even/odd/neither: Odd
Decreasing on (—∞, 0) ∪ (0, ∞)
x-intercepts: None
y-intercept: None
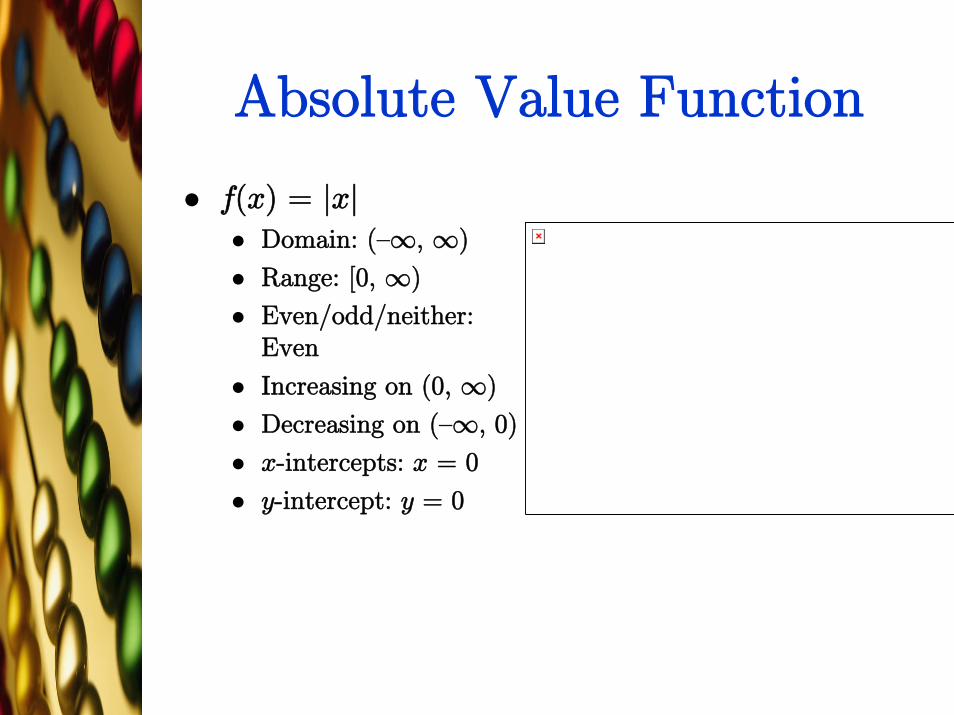
Absolute Value Function
f(x) = |x|Domain: (—∞, ∞)
Range: [0, ∞)
Even/odd/neither: Even
Increasing on (0, ∞)
Decreasing on (—∞, 0)
x-intercepts: x = 0
y-intercept: y = 0

Absolute Value Function
Can also write the absolute value function as
This is a piecewise-defined function.

Greatest Integer Function
f(x) = int(x)greatest integer less than or equal to x
Domain: (—∞, ∞)
Range: Integers (Z)
Even/odd/neither: Neither
y-intercept: y = 0
Called a step function

Greatest Integer Function
-7.5 -5 -2.5 2.5 5 7.5
-8
-6
-4
-2
2
4
6
8
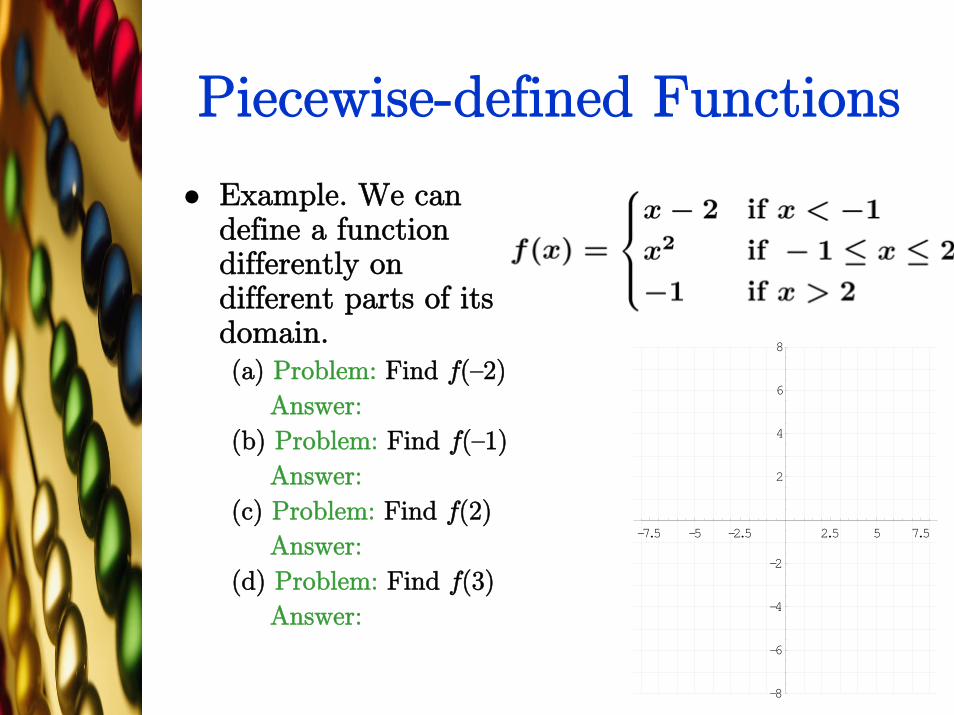
Piecewise-defined Functions
Example. We can define a function differently on different parts of its domain.(a) Problem: Find f(—2)
Answer:
(b) Problem: Find f(—1)
Answer:
(c) Problem: Find f(2)
Answer:
(d) Problem: Find f(3)
Answer:

Key Points
Linear Functions
Constant Function
Identity Function
Square Function
Cube Function
Square Root Function
Cube Root Function
Reciprocal Function
Absolute Value Function

Key Points (cont.)
Greatest Integer Function
Piecewise-defined Functions

Graphing Techniques: Transformations
Section 2.6

Transformations
Use basic library of functions and transformations to plot many other functions.
Plot graphs that look “almost” like one of the basic functions.

Shifts
Example.
Problem: Plot f(x) = x3, g(x) = x3 — 1 and h(x) = x3 + 2 on the same axes
Answer:
-4 -2 2 4
-4
-3
-2
-1
1
2
3
4

Shifts
Vertical shift:
A real number k is added to the right side of a function y = f(x),
New function y = f(x) + k
Graph of new function:
Graph of f shifted vertically up k units (if k > 0)
Down |k| units (if k < 0)
-4 -2 2 4
-4
-3
-2
-1
1
2
3
4
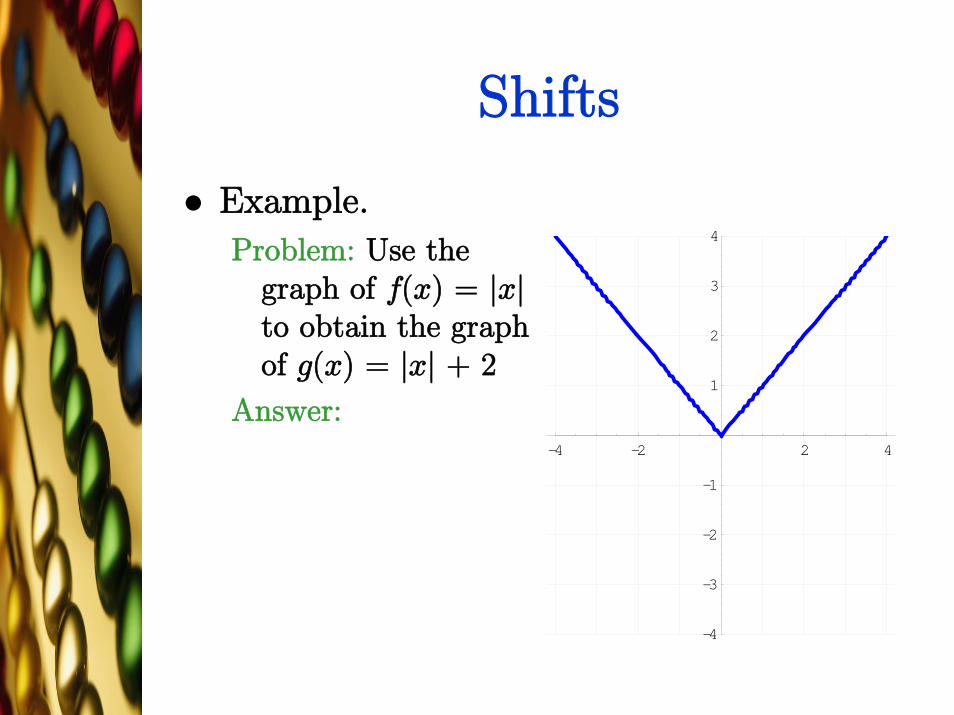
Shifts
Example.
Problem: Use the graph of f(x) = |x|to obtain the graph of g(x) = |x| + 2
Answer:
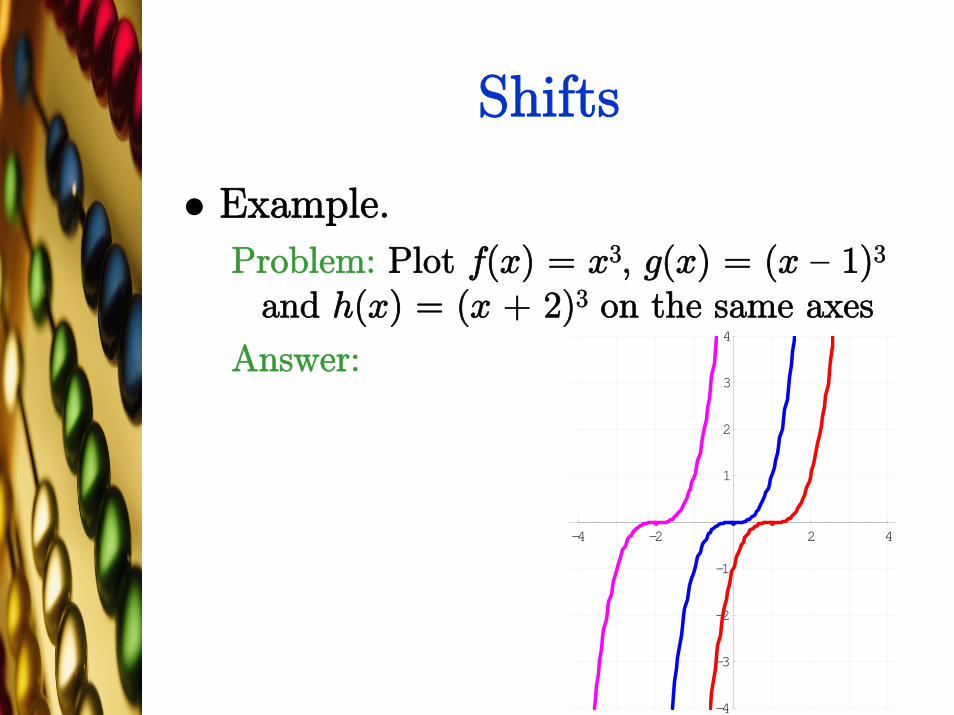
Shifts
Example.
Problem: Plot f(x) = x3, g(x) = (x — 1)3
and h(x) = (x + 2)3 on the same axes
Answer:
-4 -2 2 4
-4
-3
-2
-1
1
2
3
4
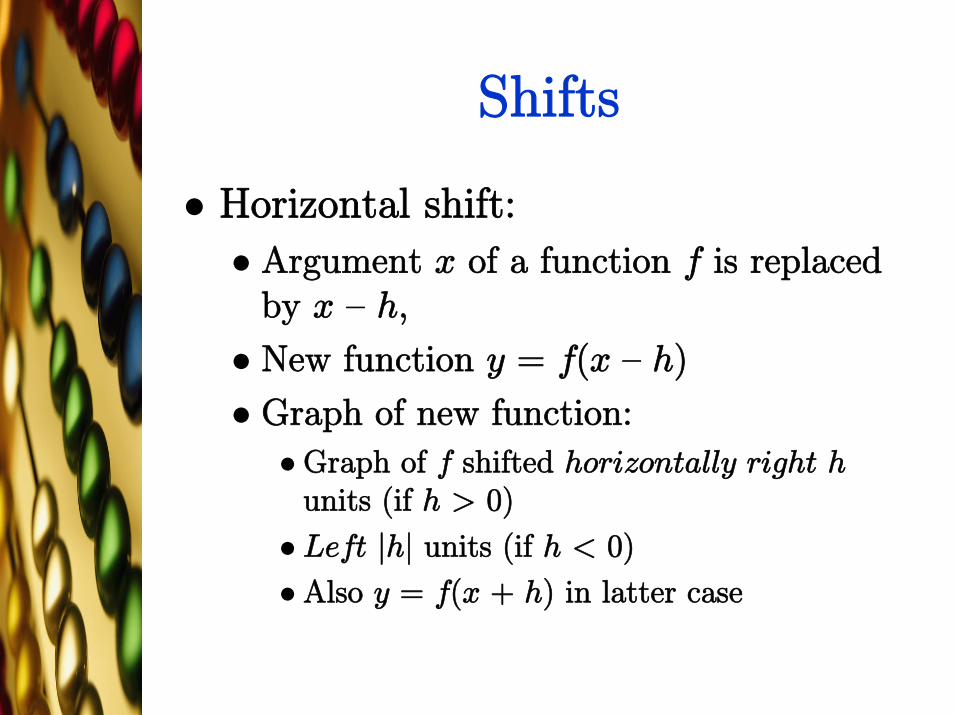
Shifts
Horizontal shift:
Argument x of a function f is replaced by x — h,
New function y = f(x — h)
Graph of new function:
Graph of f shifted horizontally right hunits (if h > 0)
Left |h| units (if h < 0)
Also y = f(x + h) in latter case

-4 -2 2 4
-4
-3
-2
-1
1
2
3
4
Shifts
Example.
Problem: Use the graph of f(x) = |x|to obtain the graph of g(x) = |x+2|
Answer:

-4 -2 2 4
-4
-3
-2
-1
1
2
3
4
Shifts
Example.
Problem: The graph of a function y = f(x) is given. Use it to plot g(x) = f(x — 3) + 2
Answer:
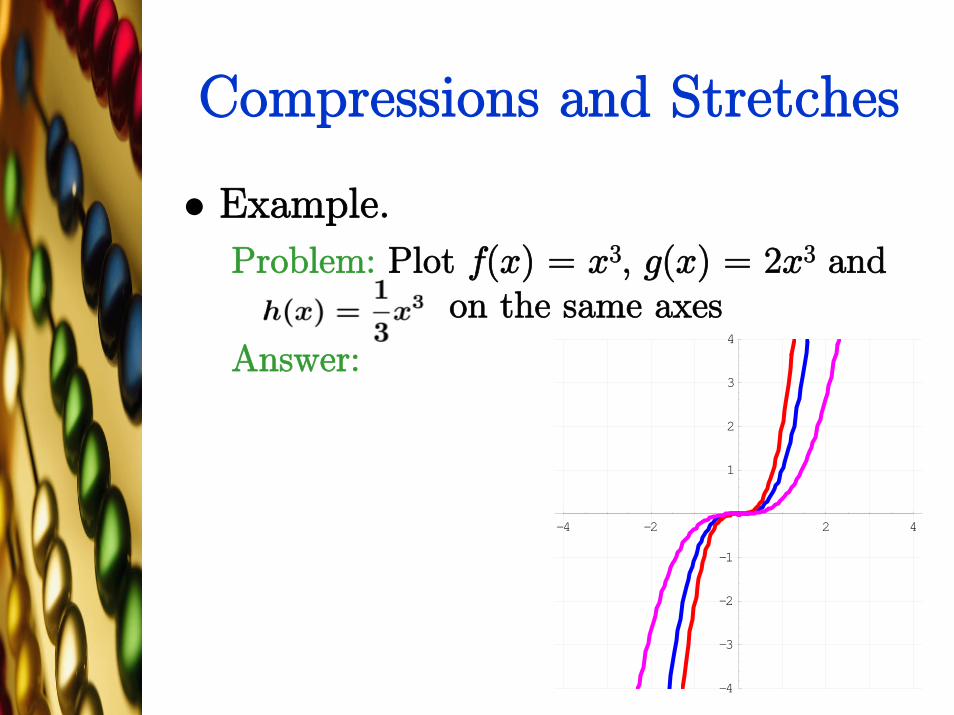
Compressions and Stretches
Example.
Problem: Plot f(x) = x3, g(x) = 2x3 and on the same axes
Answer:
-4 -2 2 4
-4
-3
-2
-1
1
2
3
4
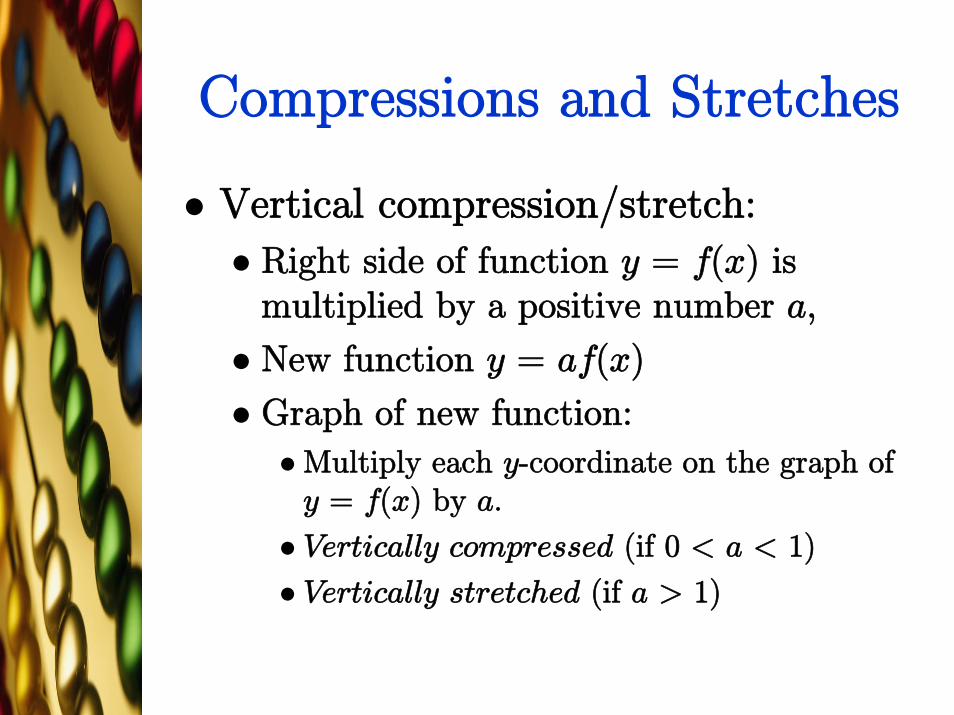
Compressions and Stretches
Vertical compression/stretch:
Right side of function y = f(x) is multiplied by a positive number a,
New function y = af(x)
Graph of new function:
Multiply each y-coordinate on the graph of y = f(x) by a.
Vertically compressed (if 0 < a < 1)
Vertically stretched (if a > 1)
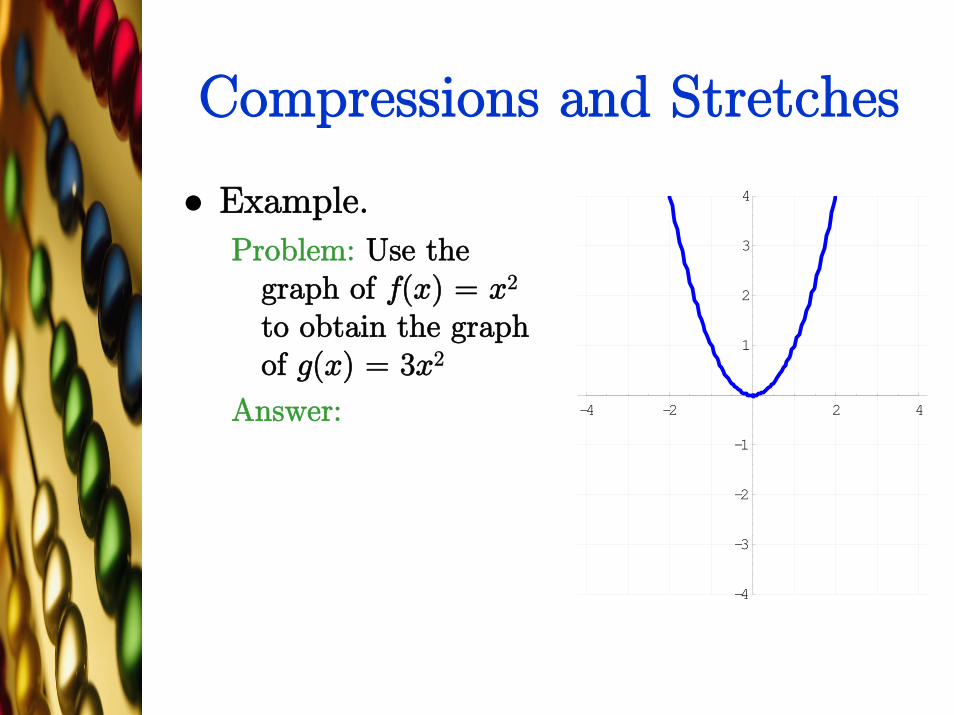
Compressions and Stretches
Example.
Problem: Use the graph of f(x) = x2
to obtain the graph of g(x) = 3x2
Answer: -4 -2 2 4
-4
-3
-2
-1
1
2
3
4

Compressions and Stretches
Example.
Problem: Plot f(x) = x3, g(x) = (2x)3
and on the same axes
Answer:
-4 -2 2 4
-4
-3
-2
-1
1
2
3
4
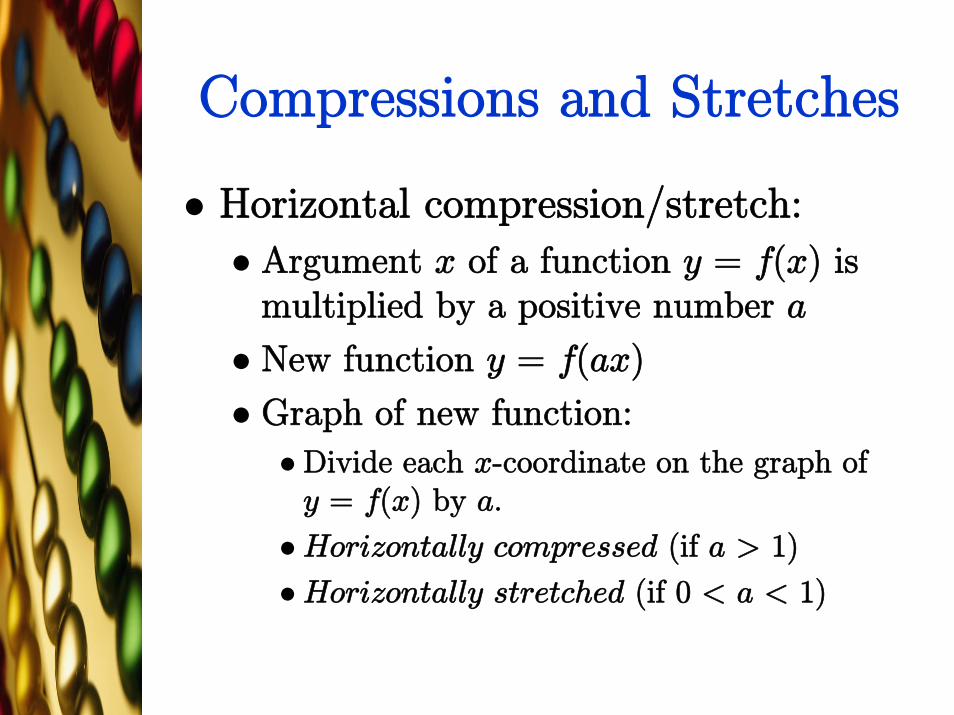
Compressions and Stretches
Horizontal compression/stretch:
Argument x of a function y = f(x) is multiplied by a positive number a
New function y = f(ax)
Graph of new function:
Divide each x-coordinate on the graph of y = f(x) by a.
Horizontally compressed (if a > 1)
Horizontally stretched (if 0 < a < 1)
-4 -2 2 4
-4
-3
-2
-1
1
2
3
4
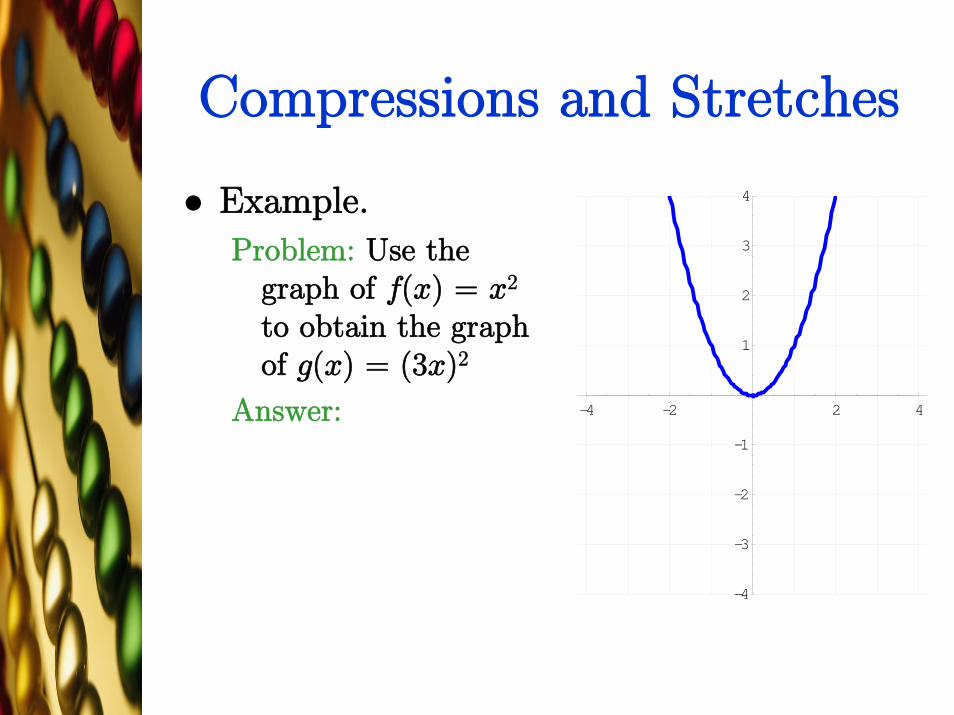
Compressions and Stretches
Example.
Problem: Use the graph of f(x) = x2
to obtain the graph of g(x) = (3x)2
Answer:

-4 -2 2 4
-4
-3
-2
-1
1
2
3
4
Compressions and Stretches
Example.
Problem: The graph of a function y = f(x) is given. Use it to plot g(x) = 3f(2x)
Answer:

Reflections
Example.
Problem: f(x) = x3 + 1 and
g(x) = —(x3 + 1) on the same axes
Answer:
-4 -2 2 4
-4
-3
-2
-1
1
2
3
4

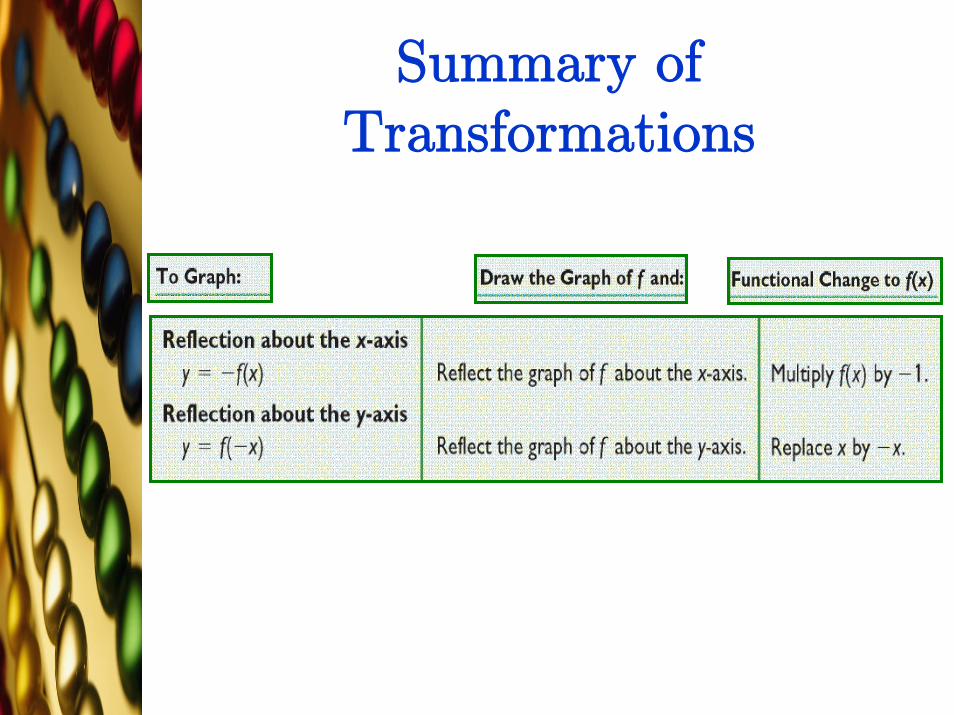
Reflections
Reflections about x-axis :
Right side of the function y = f(x) is multiplied by —1,
New function y = —f(x)
Graph of new function:
Reflection about the x-axis of the graph of the function y = f(x).

Reflections
Example.
Problem: f(x) = x3 + 1 and
g(x) = (—x)3 + 1 on the same axes
Answer:
-4 -2 2 4
-4
-3
-2
-1
1
2
3
4
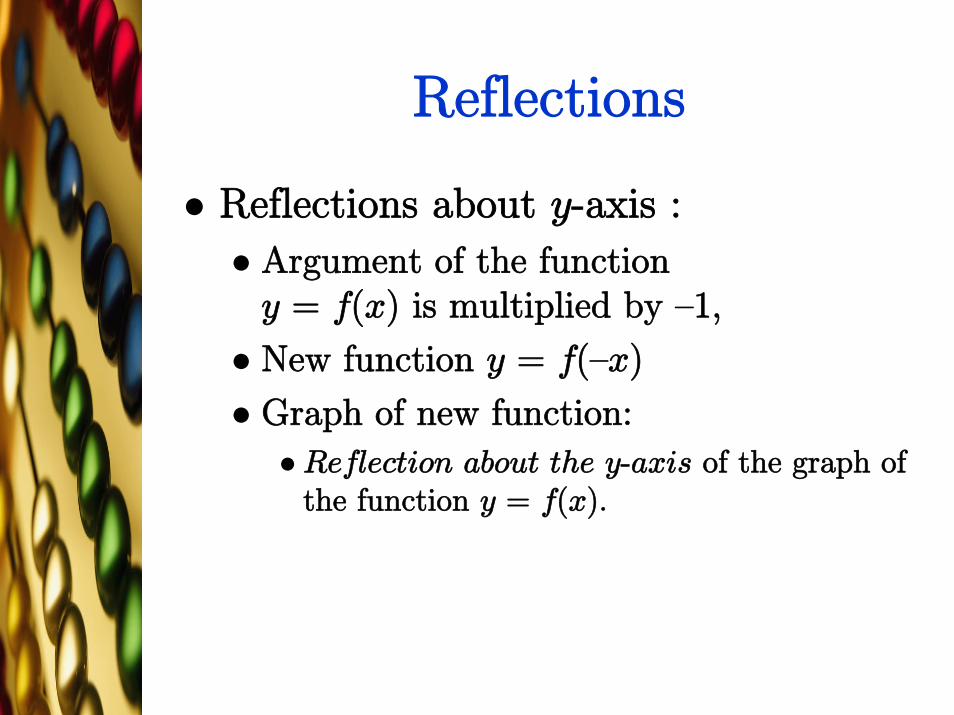
Reflections
Reflections about y-axis :
Argument of the function y = f(x) is multiplied by —1,
New function y = f(—x)
Graph of new function:
Reflection about the y-axis of the graph of the function y = f(x).

Summary of Transformations

Summary of Transformations
Summary of Transformations

-4 -2 2 4
-4
-3
-2
-1
1
2
3
4
Summary of Transformations
Example.
Problem: Use transformations to graph the function
Answer:
Key Points
Transformations
Shifts
Compressions and Stretches
Reflections
Summary of Transformations
Mathematical Models: Constructing Functions
Section 2.7
Mathematical Models
Example.
Problem: The volume V of a right circular
cylinder is V = πr2h. If the height is
three times the radius, express the
volume V as a function of r.
Answer:
Mathematical Models
Example. Anne has 5000 feet of fencing available to enclose a rectangular field. One side of the field lies along a river, so only three sides require fencing.(a) Problem: Express the area A of the
rectangle as a function of x, where x is the length of the side parallel to the river.
Answer:

1000 2000 3000 4000 5000 6000
500000
1×10⁶
1.5×10⁶
2×10⁶
2.5×10⁶
3×10⁶
3.5×10⁶
Mathematical Models
Example (cont.)
(b) Problem: Graph A = A(x) and find what value of xmakes the area largest.
Answer:
(c) Problem: What value of x makes the area largest?
Answer:
Key Points
Mathematical Models