
FUNCTIONAL CONNECTIVITY OF ENTORHINAL CORTEX IN ALZHEIMER
94
FUNCTIONAL CONNECTIVITY OF ENTORHINAL CORTEX IN ALZHEIMER’S DISEASE APPROVED BY SUPERVISORY COMMITTEE Greg Allen, Ph.D. C. Munro Cullum, Ph.D., ABPP Myron Weiner, M.D. Linda Hynan, Ph.D. Laura Lacritz, Ph.D., ABPP
Transcript of FUNCTIONAL CONNECTIVITY OF ENTORHINAL CORTEX IN ALZHEIMER

FUNCTIONAL CONNECTIVITY OF ENTORHINAL CORTEX
IN ALZHEIMER’S DISEASE
APPROVED BY SUPERVISORY COMMITTEE
Greg Allen, Ph.D.
C. Munro Cullum, Ph.D., ABPP
Myron Weiner, M.D.
Linda Hynan, Ph.D.
Laura Lacritz, Ph.D., ABPP

ACKNOWLEDGEMENTS
I would like to thank my dissertation Chair, Greg Allen, for mentoring me over
the past four years, and for his continued support and encouragement in my educational
endeavors. I would also like to give thanks to committee members, Munro Cullum,
Myron Weiner, and Linda Hynan, for providing motivation and expertise throughout the
dissertation process. To Laura Lacritz I am exceptionally grateful for the ceaseless
knowledge and support offered throughout my doctoral experience, and for being a. role
model of grace and distinction in all aspects of her profession. I would also like to thank
my classmates, most notably Julie Fields, for the good times and support needed to make
this journey. And lastly, an expression of gratitude to my family, and my husband Jeff for
their tireless encouragement and love.

FUNCTIONAL CONNECTIVITY OF ENTORHINAL CORTEX
IN ALZHEIMER’S DISEASE
by
SALLY FERDON LONG
DISSERTATION
Presented to the Faculty of the Graduate School of Biomedical Sciences
The University of Texas Southwestern Medical Center at Dallas
In Partial Fulfillment of the Requirements
For the Degree of
DOCTOR OF PHILOSOPHY
The University of Texas Southwestern Medical Center at Dallas
Dallas, Texas
July, 2008

Copyright
by
SALLY FERDON LONG, 2008
All Rights Reserved

v
FUNCTIONAL CONNECTIVITY OF ENTORHINAL CORTEX
IN ALZHEIMER’S DISEASE
Sally Ferdon Long, Ph.D.
The University of Texas Southwestern Medical Center at Dallas, 2008
Greg Allen, Ph.D.
ABSTRACTAlzheimer’s disease (AD) is a progressive neurodegenerative disease
characterized by prominent memory impairment, executive dysfunction, language,
construction, and visuospatial deficits. In AD, the accumulation of neurofibrillary tangles
neuritic plaques, and other associated neuropathology, results in widespread disruption of
cortical connections. The entorhinal cortex (EC) is a region of cortical gray matter in the
medial temporal lobe important in memory processing, and has been identified as the first
structure affected in AD. The current study investigated the functional connectivity of the
EC in AD and normal control (NC) subjects using functional connectivity magnetic
vi
resonance imaging (fcMRI). Additional goals of the study were to examine relationships
between EC functional connectivity, EC volume, and neuropsychological measures of
episodic memory and global cognitive ability.
Nine NC and seven AD subjects were imaged using a 3.0 Tesla magnetic
resonance scanner while resting quietly. Compared to the NC group, AD subjects
exhibited significantly reduced functional connectivity with the EC in prefrontal cortex
(BA 47, 10, 6, 9, & 8), right superior temporal areas (BA 22 & 39), right fusiform gyrus
(BA 37), and right perirhinal/entorhinal cortex (BA 35) extending into the hippocampus.
Areas of significantly increased functional connectivity in AD subjects included bilateral
inferior frontal gyrus (BA 47), left middle frontal gyrus (BA 46), left
entorhinal/parahippocampal cortex (BA 28), and the left putamen. No significant
relationships were detected among EC functional connectivity, EC volume, and cognitive
measures.
The findings of reduced EC connectivity in frontal and temporal association
areas in AD are consistent with what is known about the progression of pathophysiology
of AD, and provide support for the use of fcMRI in examining cortical connectivity
patterns. Increased EC connectivity in prefrontal cortex may reflect the presence of
compensatory mechanisms in the neural connections of AD patients. The lack of
correlations among EC connectivity, EC volume, and neuropsychological measures
suggests that more complex relationships among the variable may exist than was
hypothesized. Future research investigating the relationships between functional integrity
and structural volume, and how these variables relate to cognitive performance is needed.

vii
TABLE OF CONTENTS
ABSTRACT....................................................................................................... v
I: INTRODUCTION ......................................................................................... 1
II: REVIEW OF THE LITERATURE ............................................................... 6
Neuroanatomy of the Entorhinal Cortex ................................................. 6
Corticocortical connections ............................................................. 6
Functional role ................................................................................ 9
Entorhinal Cortex in Healthy Aging ..................................................... 12
Structural MRI of Entorhinal Cortex in Alzheimer’s Disease ............... 15
Functional Connectivity in Alzheimer’s Disease .................................. 20
fcMRI of the medial temporal lobe ................................................. 23
fcMRI of the MTL in elderly adults and Alzheimer’s disease .......... 25
III: GOALS AND HYPOTHESES .................................................................. 29
IV: METHODOLOGY .................................................................................... 31
Participants .......................................................................................... 31
Neuropsychological Assessment .......................................................... 32
Magnetic Resonance Imaging .............................................................. 33
Data acquisition ............................................................................. 33
Structural volume measurements .................................................... 33
Functional connectivity analyses .................................................... 34
Statistical analyses ......................................................................... 36

viii
V: RESULTS .................................................................................................. 38
Demographic Characteristics ............................................................... 38
Hypothesis One ................................................................................... 39
Hypothesis Two ................................................................................... 50
Hypothesis Three ................................................................................. 51
Hypothesis Four ................................................................................... 51
VI: DISCUSSION ........................................................................................... 54
Hypothesis One ................................................................................... 54
Hypothesis Two ................................................................................... 61
Hypothesis Three ................................................................................. 61
Hypothesis Four ................................................................................... 62
Limitations .......................................................................................... 63
Conclusions and Future Directions ....................................................... 64
BIBLIOGRAPHY ........................................................................................... 67
ix
LIST OF FIGURES
Figure 1. z transformed values measuring functional connectivity between left
EC and left hippocampus in AD patients and NC individuals. ................... 40
Figure 2.Functional connectivity of left EC in control participants..................... 42
Figure 3. Functional connectivity of left EC in patients with AD ....................... 43
Figure 4. Group comparison of functional connectivity of the EC. .................... 48

x
LIST OF TABLES
Table 1. Demographic Variables ....................................................................... 39
Table 2. Brain regions demonstrating functional connectivity (Local Maxima)
with the Left EC in NC participants ........................................................... 44
Table 3. Brain regions demonstrating functional connectivity (Local Maxima)
with the Left EC in AD patients................................................................. 46
Table 4. Brain regions demonstrating reduced functional connectivity (Local
Maxima) with the Left EC in AD patients compared to NC participants..... 49
Table 5. Brain regions demonstrating reduced functional connectivity (Local
Maxima) with the Left EC in AD patients compared to NC participants..... 50
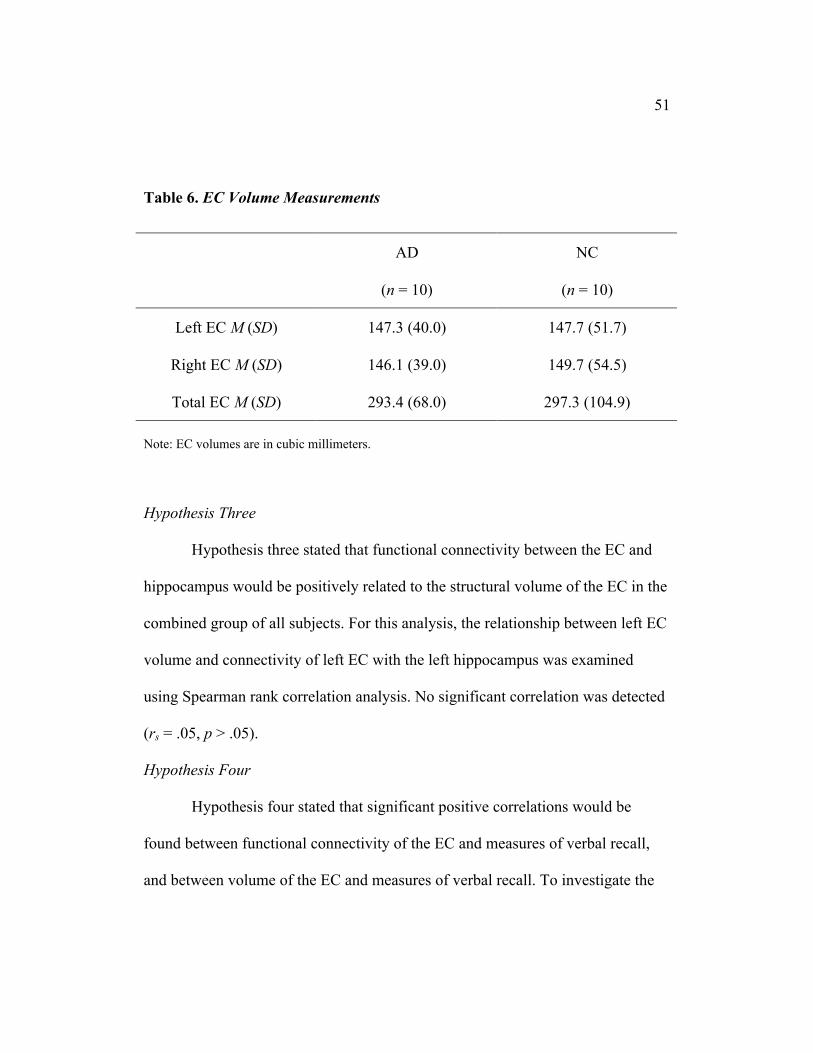
Table 6. EC Volume Measurements .................................................................. 51
Table 7. Neuropsychological and Functional Connectivity Measures................. 53

1
CHAPTER ONE
Introduction
Alzheimer’s disease (AD) is a progressive neurodegenerative disorder
whose cognitive deficits typically manifest late in life, and are characterized by
prominent memory impairment with rapid forgetting, executive dysfunction, and
difficulties with language, construction, and visuospatial skills (Welsh-Bohmer &
Warren, 2006).
AD is the most common form of dementia today, accounting for
approximately 70 % of all dementing illnesses, with a national prevalence rate
estimated to be 11.1 % of people over the age of 70 years (Plassman et al., 2007).
In 2004, it was the seventh leading cause of death for adults in the United States
(Heron, 2007). Currently, the number of people in the United States who are 65
years of age or older is about 37 million, and this number is projected to double
by the year 2040 (Federal Interagency Forum on Aging-Related Statistics, 2006),
placing a significant and growing demand on healthcare for dementia patients that
will have serious economic and medical implications. Recent trends in clinical
practice (Petersen et al., 2001) and research (Wierenga & Bondi, 2007) emphasize
the need for techniques that aid in early detection of AD, thus, allowing for earlier
intervention and improvement in the quality of life for these individuals and
maintenance of function.
2
The neuropathology of AD is characterized grossly by frontotemporal
atrophy and microscopically by loss of synapses (Davies, Mann, Sumpter, &
Yates, 1987). The two cardinal microscopic features are the abnormal
accumulation of neurofibrillary tangles (NFTs) and neuritic plaques (NPs) (Braak
& Braak, 1991). The buildup of NFTs and NPs in the basal forebrain appears to
result in the degeneration of neurons in the cholinergic pathway and an overall
reduction of acetylcholine (Whitehouse et al., 1982), a neurotransmitter essential
to memory processing. Though the pathophysiology of AD is not fully
understood, it targets medial temporal lobe (MTL) structures early in the disease
process before progressing to temporal, frontal, and parietal association cortices
(Braak & Braak, 1991). Histological studies examining the distribution pattern of
NFTs indicate that the transentorhinal and entorhinal cortices are the first areas to
become affected in AD, before spreading to the hippocampus and amygdala in the
early stages (Braak & Braak, 1991; Gomez-Isla et al., 1996). These MTL
structures play a crucial role in episodic memory functioning (Eichenbaum,
Yonelinas, & Ranganath, 2007; Squire, Stark, & Clark, 2004), and the early
deterioration of neurons in this area is consistent with the initial deficits of
learning and memory seen in AD.
A diagnosis of definite AD can only be made by examining brain tissue
and documenting the presence of sufficient levels of NFTs and NPs. The clinical
diagnosis of AD by McKhann et al. (1984) criteria achieves an 87% accuracy rate
3
(Ranginwala, Hynan, Weiner, & White, 2008). With the aid of a comprehensive
neuropsychological assessment, a diagnostic accuracy rate of 89% can be
achieved for mildly impaired individuals (Salmon et al., 2002).
On the other hand, preclinical detection of the disease process with
neuropsychological measures is difficult (Goldman et al., 2001). The
neuropathological changes characteristic of the AD brain begin long before a
clinically observable decline in cognition occurs (Braak & Braak, 1991, 1998;
Price, Davis, Morris, & White, 1991; Selkoe, 2002; Whitehouse et al., 1982).
Thus, more sensitive tools may be required to detect preclinical markers of the
disease. The advent of brain imaging technology has allowed researchers to
modify and extend research on histological and animal studies in characterizing
early structural and functional changes and how they progress over time, in an
attempt to identify potential biomarkers that may allow for earlier detection of
AD.
Research on aging and AD indicates that the entorhinal cortex (EC) is
particularly sensitive to AD pathology, while remaining relatively unaffected by
the normal aging process (Gomez-Isla et al., 1996; Raz, Rodrigue, Head,
Kennedy, & Acker, 2004; Rodrigue & Raz, 2004; Small, Tsai, DeLaPaz, Mayeux,
& Stern, 2002), making this structure a likely candidate as a potential disease
biomarker. In support of this idea, structural magnetic resonance imaging (MRI)
studies have found significant reductions in EC volume in individuals with mild
4
cognitive impairment (MCI) (Devanand et al., 2007; Dickerson et al., 2001;
Killiany et al., 2002; Pennanen et al., 2004; Whitwell et al., 2007; Xu et al.,
2000), which is characterized by significant cognitive dysfunction in the absence
of functional impairment (Petersen et al., 1999). Moreover, there is evidence that
the EC atrophies at a faster rate than the hippocampus in patients with MCI (Du et
al., 2003). In reviewing the literature on pathology in AD, it is evident that
functional changes in the EC precede the cell loss and resultant volumetric
changes detectable in structural MRI studies (Davies et al., 1987; Selkoe, 2002;
Small et al., 2002), highlighting the importance of examining functional
differences in the EC of patients with AD.
Functional connectivity MRI (fcMRI) is a relatively new technique used to
examine functional synchrony, or coherence, among brain regions. Brain areas
that are functionally related show significant spontaneous fluctuations in neural
activity that are correlated during the resting state (Biswal, Yetkin, Haughton, &
Hyde, 1995; Cordes et al., 2000; Lowe, Mock, & Sorenson, 1998). Researchers
employing fcMRI to investigate functional coherence in AD have found
significant changes in connectivity patterns with the hippocampus (Allen et al.,
2007; He et al., 2007; Li et al., 2002; K. Wang et al., 2007) when compared to
healthy elderly subjects. Additionally, researchers studying the default mode
network, a set of brain regions that are consistently active together during rest
periods of task-dependent fMRI studies (Greicius, Krasnow, Reiss, & Menon,

5
2003; Raichle et al., 2001), have demonstrated a disruption in functional
coherence of this network in AD (Buckner et al., 2005; Greicius, Srivastava,
Reiss, & Menon, 2004; Greicius, Supekar, Menon, & Dougherty, 2008; He et al.,
2007; K. Wang et al., 2007). These studies demonstrate the utility of fcMRI in
detecting the degradation of functional networks in AD.
Though the EC has been identified as the first structure affected in AD,
resting-state functional connectivity of the EC has not been investigated in this
disease. Furthermore, the nature of the relationship between functional
connectivity and structural volume in this disease has not been established. The
goal of the present study is to conduct a pilot investigation of the effect of AD on
functional coherence of the EC using fcMRI, and examine the correspondence of
this coherence to EC volume. Additionally, the relationship of functional and
structural changes to memory test performance will be examined. The results of
this study will increase our understanding of the relationship between functional
integrity and cognitive performance.

6
CHAPTER TWO
Review of the Literature
Due to the widespread disruption of cortical connections in this disease,
some have conceptualized AD as a disconnection syndrome (De Lacoste &
White, 1993). De Lacoste and White (1993) presented a model predicting that the
initial pathology seen in AD occurs in the EC and results in damage to this
structure. This damage leads to a disconnection of the hippocampal formation
from the rest of the cerebral cortex. As the disease progresses and neuropathology
spreads, further disruption along corticocortical connections becomes apparent.
The interconnections of the EC are described below.
Neuroanatomy of the Entorhinal Cortex
Corticocortical connections. The MTL is composed of several structures
that together form the hippocampal formation and the parahippocampal region.
The hippocampal formation includes the dentate gyrus (DG), areas CA1-3, and
the subiculum (Witter, Wouterlood, Naber, & Van Haeften, 2000). The cortical
area adjacent to and surrounding the hippocampal formation comprises the
hippocampal region, and includes the presubiculum, parasubiculum, and
entorhinal, perirhinal, and parahippocampal (or postrhinal in nonprimates)
cortices (Witter et al., 2000). The EC (Brodmann area 28) lies in the
parahippocampal gyrus, ventromedially to the periamygdaloid cortex and
rostromedially to the presubiculum (Amaral & Insausti, 1990; Insausti, Tunon,

7
Sobreviela, Insausti, & Gonzalo, 1995). It extends laterally to the medial bank of
the collateral sulcus, where it is bordered by the perirhinal cortex.
Cytoarchitecturally, the EC can be divided into six cellular layers, and has been
subdivided into lateral and medial areas based on connectivity patterns (Kerr,
Agster, Furtak, & Burwell, 2007).
Current understanding of the corticocortical projections of the EC has
been advanced through histopathological studies of animals, primarily the rat, cat,
and monkey (Amaral & Insausti, 1990; Burwell, 2000), in which it has been
shown that the EC is highly interconnected with other MTL structures and areas
of frontal, temporal, and parietal cortices. The memory system of the MTL is one
of the most studied networks in the brain; as such, the interconnections of the EC
within this region are well documented (Amaral & Insausti, 1990; Burwell, 2000;
Insausti et al., 1998; Kerr et al., 2007; Witter et al., 2000). Multimodal sensory
information from association cortex in the frontal, temporal, and parietal lobes
reaches the EC through the perirhinal and parahippocampal cortex (Burwell,
2000). Research on non-human primates indicates that perirhinal cortex receives
visual object information from the superior temporal sulcus and parahippocampal
cortex, while somatosensory input is received from the insular cortex. This
information is then projected to the lateral EC (Kerr et al., 2007).
Parahippocampal cortex receives visuospatial input from posterior parietal cortex
and area V4, while somatosensory information comes from insular cortex, and

8
auditory information from the auditory association cortex. This multimodal
sensory information is projected primarily to the medial EC (Kerr et al., 2007).
The EC then projects to the DG through a collection of fibers arising mainly from
layer II, called the perforant path, which is the primary source of cortical input to
the hippocampus (Witter, 2007). Efferents from the EC also connect to the
subiculum, presubiculum, and parasubiculum (collectively called the subiculum
complex) and areas CA1 and CA3 (Amaral & Insausti, 1990). Completing the
circuit, the EC receives output back from CA1 and the subiculum complex, which
it forwards to the perirhinal and parahippocampal cortices. In primates,
information from the presubiculum is projected through the hippocampal
commissure to the EC of the contralateral hemisphere, accounting for the most
prominent link between the MTLs of the left and right side of the brain (Amaral
& Insausti, 1990).
Subcortical reciprocal connections with the EC are found in the claustrum,
amydgala, nucleus accumbens, hypothalamus, caudate and putamen of the basal
ganglia, and dorsal and ventral regions of the thalamus (Amaral & Insausti, 1990;
Kerr et al., 2007). The septal complex of the basal forebrain also projects to the
EC, and is considered to be the primary cholinergic innervation of the MTL.
Neocortical projections to the EC come from the superior temporal gyrus,
and orbitofrontal, dorsolateral frontal, medial frontal, and retrosplenial cortices.
Reciprocal projections of the EC have been found with pyriform, frontal, insular,

9
temporal polar, cingulate, parietal, and occipital regions (Amaral & Insausti,
1990; Kerr et al., 2007). These long-range cortical and subcortical connections
through the EC provide the hippocampal formation extensive influence over
frontal, temporal, and parietal regions of the brain (Amaral & Insausti, 1990).
Functional role. The prevailing view of MTL function is that it supports
processing of episodic, or declarative, memory (i.e., memory for facts and
events). The development of a model for MTL-dependent memory functions
began with a description of H.M., who underwent bilateral surgical resection of
the anterior MTLs as treatment for intractable epilepsy (Scoville & Milner, 1957).
Following surgery, H.M. was unable to form new episodic memories, and was
thus rendered profoundly amnesic. Subsequent studies of amnestic patients and
the development of animal models of human amnesia led to the discovery of
structural correlates of episodic memory functioning. Squire and Zola-Morgan
(1991) summarized these studies and proposed a model of MTL function. In their
paper, they describe a series of lesion studies in monkeys that demonstrate the
importance of the hippocampal formation in episodic memory functioning. Larger
lesions, involving the hippocampal formation and surrounding areas of entorhinal,
perirhinal, and parahippocampal cortices resulted in more extensive memory
deficits, indicating that these regions are also necessary for episodic memory
functioning, independent of the hippocampal formation. Different pieces of
sensory information about an event travel from association cortex in frontal,

10
temporal, and parietal lobes to the MTL circuit, where they are bound together, or
consolidated, to represent a whole event. Information then leaves the MTL system
through the EC and subiculum complex, and is projected back to association
cortex. As evidenced by amnestic patients who have the ability to recall old
memories, the information that is consolidated in the MTL memory system is not
stored there long-term, but instead is stored in relevant association cortex
networks (Squire et al., 2004).
Current efforts to further elucidate the structural components of memory
processing attempt to determine the differential contributions of structures within
the MTL. The results of these efforts have been unclear. Some researchers
propose that the different components of the episodic memory network serve
distinct functions (Daselaar, Fleck, Dobbins, Madden, & Cabeza, 2006;
Eichenbaum et al., 2007; Murray, Bussey, & Saksida, 2007; Witter & Moser,
2006; Yonelinas et al., 2007), while others maintain that the different structures
are more likely to overlap in their functional contributions (Squire et al., 2004;
Stark, Bayley, & Squire, 2002). One theory focuses on the distinction between
recollection and familiarity, two components of recognition memory that are
proposed to be separate processes (Eichenbaum et al., 2007; Yonelinas et al.,
2007). Recollection requires the retrieval of specific information about an event,
such as when it happened, or where it happened, and thus could be described as a
relational or associative process (Eichenbaum et al., 2007). Sensory information

11
flows from association cortex through the hippocampal region and converges in
the hippocampus. Based on this anatomical model, some researchers propose that
the function of the hippocampus is to consolidate different kinds of sensory
information related to a single event (Squire et al., 2004). Therefore, relational
memory processes, such as recollection, are dependent on the hippocampus.
Familiarity, on the other hand, refers to knowing that an event was previously
encountered, but without the contextual information. Proponents of this theory
posit that familiarity depends on cortical areas that surround the hippocampus,
and are earlier in the path of information flow (Eichenbaum et al., 2007). Some
studies indicate that familiarity depends predominately on the EC (Yonelinas et
al., 2007). Others propose that the perirhinal cortex is important for familiarity,
while the EC cortex plays a role in both familiarity and recollection (Eichenbaum
et al., 2007).
Despite supporting evidence, a study by Stark, Bayley, and Squire (2002)
presents an opposing view on the different functions within the MTL structures.
They used an associative learning task to examine relational learning, and a
recognition memory task to investigate familiarity in patients with circumscribed
hippocampal lesions. Patients were equally impaired on both tasks, suggesting
that the hippocampus is important in both familiarity and recollection, or
relational learning, tasks. The conflicting findings on the role of the hippocampus,
entorhinal, and perirhinal cortices in familiarity and relational learning indicate

12
that there is not a simple division of labor in memory processing among MTL
structures (Squire et al., 2004).
More recently, the EC has been found to be critically involved in spatial
navigation in rats. Hafting, Fyhn, Molden, Moser, and Moser (2005) discovered
neuronal spatial maps in the dorsocaudal part of the medial EC composed of
“grid” cells. The grid-like firing pattern of these cells is dependent on the spatial
environment and the animal’s location in that environment. The function of these
spatial maps is not fully understood, though it suggests that the EC is important in
keeping track of position, direction, and distance in space. The presence of grid
cells in humans has not yet been established, though they may have interesting
implications for AD. The grid cells were found primarily in layer II of the EC, an
area that is especially targeted by AD pathology. Deterioration of these neurons
may relate to the spatial navigation deficits noted in AD (deIpolyi, Rankin,
Mucke, Miller, & Gorno-Tempini, 2007) and MCI (Hort et al., 2007).
Entorhinal Cortex in Healthy Aging
A cross-sectional stereological study by Gomez-Isla, et al. (1996)
examined the number of neurons in the EC of healthy elderly and individuals with
AD. The researchers found that neuron number, volume, and cell density of the
EC remained stable when comparing healthy elderly individuals in their 60s to
healthy elderly individuals in their 90s. In the group with AD, EC neuron number
and volume were significantly reduced, and cell density was significantly reduced

13
in layer II of the EC, compared to healthy elderly. In addition, when comparing
very mildly impaired subjects with AD to individuals with moderate AD and a
control group, a significant reduction was found in EC neuron number in those
with mild AD, especially in layers II and IV, with a more pronounced reduction in
moderately impaired AD subjects. These findings indicate that the EC has already
been substantially affected by the pathology of AD at a stage when cognitive
dysfunction is just beginning to emerge, and yet remains relatively stable
throughout the normal aging process.
The finding that the EC is relatively impervious to normal aging has been
replicated using structural MRI as well. Raz, Rodigue, Head, Kennedy, and Acker
(2004) compared the effects of aging on the hippocampus and EC over a span of 5
years. Using a sample of healthy adults between the ages of 26 and 82 years, the
researchers demonstrated that the volume of the hippocampus shrank over two
times as much as the EC, and correlated more strongly with age than the EC.
Additionally, shrinkage in the hippocampus occurred at a faster rate than in the
EC. Contrary to the results found by Gomez-Isla et al. (1996), Raz et al. found
that volume of the EC was associated with age in elderly adults. When comparing
adults less than 50 years of age to those 50 years old and older, EC volume
remained stable in the younger adults; however, the older group exhibited a mild
degree of volume loss. Hippocampal shrinkage was evident in both groups,
though to a greater degree in the older group. While this evidence of EC volume

14
decline in older adults may appear to be in conflict with previous findings
(Gomez-Isla et al., 1996), the authors note that the broad screening measures used
to assess cognitive decline may not be sensitive enough to detect early cognitive
changes indicative of mild impairment. The possibility that some individuals with
mild cognitive dysfunction were included in their sample cannot be ruled out, and
could account for the association between EC volume loss and age found in the
older adults. An important implication of this study is that age has a differentially
negative impact on the hippocampus as compared to the EC.
Further evidence that the EC may be uniquely sensitive to neurological
changes associated with preclinical AD was reported by Rodigue and Raz (2004).
Using structural MRI, the researchers investigated longitudinal change in the
volumes of EC, hippocampus, and prefrontal cortex (PFC) across a wide age
range of healthy adults (26 to 82 years of age), and the relationships of these
volumes to memory test performance. Consistent with prior research, results
indicated that the rate of EC volume loss did not correlate with age, while the
hippocampus and PFC exhibited greater shrinkage across the age span.
Interestingly, greater losses of EC volume over a five-year time period predicted a
decline in memory performance after accounting for the effects of age, as opposed
to hippocampus and PFC volume shrinkage that had no relationship to memory
scores over and above the effects of age.

15
One of the challenges for preclinical markers of disease is to differentiate
preclinical AD from healthy aging. The biggest risk factor of AD is advancing age
(Keller, 2006). Therefore, the EC’s relative resistance to the effects of healthy
aging may allow for easier detection of structural or functional changes associated
with very early AD. Though both EC and the hippocampus are known to be
involved in AD, a review of the literature indicates a higher potential for
discovering early AD biomarkers in the EC as compared to the hippocampus, due
to the difficulty in differentiating the effects of normal aging from pathological
changes in the hippocampus in very early stages of the disease. These studies
highlight the importance of investigating changes in structural and functional
integrity in healthy aging and AD.
Structural MRI of Entorhinal Cortex in Alzheimer’s Disease
The investigation of structural changes in AD have typically focused on
the hippocampus, due to its high degree of involvement in AD, central role in
episodic memory processing, and distinctive boundaries easily identifiable on
magnetic resonance (MR) images. Though AD-related pathological changes are
noted even earlier in the EC, the difficulty in distinguishing the structural
boundaries in MRI has precluded many from investigating this structure.
However, recent publications of established protocols for identifying EC
boundaries on MR images have resulted in several volumetry studies comparing
structural changes in the EC and hippocampus in AD (Goncharova, Dickerson,

16
Stoub, & deToledo-Morrell, 2001; Insausti et al., 1998; Killiany et al., 2002;
Pruessner et al., 2002). A review of early studies investigating these two
structures confirmed the consistent finding of volume loss in both, and
furthermore, indicated that the EC, in combination with temporal neocortex,
provided the most accurate prediction of conversion to AD in patients with MCI
(Chetelat & Baron, 2003). However, many of these studies employed cross-
sectional designs, and the use of inconsistent sampling procedures and MRI
tracing protocols have led to some conflicting results. Recent studies using
longitudinal designs have extended our understanding of the EC and hippocampus
volume in AD (deToledo-Morrell et al., 2004; Dickerson et al., 2001; Killiany et
al., 2002), although the predictive utility of these structures in determining who
will develop dementia is still unclear.
The most consistent findings among MRI studies of MTL volume pertain
to the ability of brain structure measurements to differentiate between healthy
elderly, patients with AD, and those at risk for developing the disease by virtue of
having MCI or subjective memory complaints. Although there has been at least
one study that found no discriminative ability in the volumes of the EC or the
hippocampus (Xu et al., 2000), the majority of findings indicate that the volume
of the EC differentiates between healthy elderly and MCI with more sensitivity
and specificity than the volume of the hippocampus (Dickerson et al., 2001;
Killiany et al., 2002; Pennanen et al., 2004). These finding may be explained by

17
the EC’s earlier involvement in AD compared with the hippocampus.
Interestingly, when attempting to discriminate between MCI and AD, some
researchers found the volume of the hippocampus to have the best discriminative
power (Dickerson et al., 2001; Pennanen et al., 2004), while others concluded that
the EC was the most sensitive (Killiany et al., 2002).
Several research groups have examined the predictive utility of volumetry
in the conversion of the cognitively impaired to AD, though the data appear to be
unclear. By measuring baseline volumes of EC and the hippocampus, and then
following participants over time, investigators can compare which structures are
the best predictors of cognitive decline. DeToledo-Morrell’s laboratory
(Dickerson et al., 2001) followed a group of individuals with either MCI or
subjective cognitive complaints for a period of time ranging from 12 to 77
months. Over the period of observation, approximately half the participants
progressed to a diagnosis of AD. The researchers found baseline EC volume to be
significantly smaller in converters compared to non-converters. Furthermore,
volume of the EC, but not the hippocampus, was a significant predictor of
progression to dementia in this sample.
Another longitudinal study conducted by Killiany et al. (2002) compared
baseline volumetry of EC and the hippocampus in four groups of individuals:
healthy elderly, individuals with mild AD, people with cognitive decline (termed
“questionable,” indicated by a standard functional assessment interview), and

18
those from the questionable group that converted to AD over a period of three
years. Contrary to the previous study (Dickerson et al., 2001), in this investigation
neither the EC nor the hippocampus could differentiate between the questionable
group and those that converted to AD, although both structures were associated
with a greater likelihood of progressing to dementia. Interestingly, the EC
discriminated between all the other groups with greater sensitivity and specificity
than the hippocampus.
There are several methodological differences between these two studies
that might account for the conflicting results. One potential explanation pertains
to differences in protocols used to trace the regions of interest (ROIs). To
investigate this possibility, deToledo-Morrell et al. (2004) conducted another
investigation using similar methodology to their previous study. This time, their
sample of those at risk for developing AD included only individuals diagnosed
with MCI, rather than those with subjective cognitive complaints who have no
cognitive impairment on neuropsychological testing. Over the course of three
years, 10 of their 27 subjects met criteria for a diagnosis of AD. Using the same
tracing protocols as before, they found similar results to their previous study, in
that baseline EC volume was a better predictor of conversion to AD than the
volume of the hippocampus. Additionally, reanalyzing their data using the same
tracing protocol as Killiany et al. (2002) did not change the outcome of the study.
Therefore, the authors concluded that sampling differences are more likely to

19
account for the inconsistent findings than variability in MRI volumetry
techniques.
Volumetric changes in the EC and hippocampus have been the focus of
several longitudinal investigations. However, many studies have neglected to
include ROIs outside of the temporal lobe; therefore, the specificity of findings
related to these two structures has not been determined. Whitwell et al. (2007)
compared brains from a group of individuals with stable MCI (across three years)
to a group with MCI that progressed to AD within an 18-month time period. The
groups were examined using voxel-based morphometry (VBM), which provides a
voxel-by-voxel comparison of regional concentrations of gray matter, allowing
for a comprehensive assessment of differences between groups throughout the
entire brain. When compared to healthy control subjects, the group with stable
MCI showed no significant gray matter differences. In contrast, those that
progressed to AD exhibited significantly less gray matter concentration in the
anterior temporal lobe, including the EC, parahippocampal gyrus, hippocampus,
amygdala, fusiform gyrus, and inferior and middle temporal gyrus. Additional
reductions were noted in the parietal lobe, frontal lobe, basal forebrain, and insula.
A similar pattern of reduced gray matter concentration was observed in this group
when directly compared to the stable MCI group, with additional reductions in the
precuneus, and anterior and posterior cingulate. These findings are consistent with

20
patterns of neuropathology found in AD, spreading from the MTL to association
cortices in temporal, frontal, and parietal regions of the brain.
Overall, fairly consistent findings of reduced volume in the EC and
hippocampus in AD have been established. However, the utility of these changes
in predicting future decline in those at risk for developing dementia is still under
review, due to difficulties in obtaining consistent samples across studies. Research
investigating functional changes in MTL structures may be more useful in this
regard.
Functional Connectivity in Alzheimer’s Disease
Functional connectivity magnetic resonance imaging (fcMRI) is a
relatively new method of examining the integrity of functional networks that
involves the investigation of spontaneous low frequency fluctuations of neural
activity using functional MRI. Functional connectivity MRI or resting-state MRI,
examines the intrinsic coherence among functionally related brain regions during
rest, as opposed to standard fMRI studies that use a task to stimulate changes in
neuronal activity. As in a task-related design, these low frequency fluctuations
reflect modulation of the blood oxygen level dependent (BOLD) signal (Peltier &
Noll, 2002). The BOLD signal is an indirect index of neural activity that results
from an overall localized decrease in deoxyhemoglobin relative to
oxyhemoglobin in the blood following glucose metabolism (Bandettini & Wong,
1994).

21
Biswal, Yetkin, Haughton, and Hyde (1995) were the first to demonstrate
that areas of the brain that function together in networks also exhibit coherence in
spontaneous low frequency signal changes in FMRI. They found that low
frequency BOLD fluctuations in the left somatomotor cortex correlated with the
same region in the contralateral hemisphere and additional motor regions in the
absence of a motor task. These findings have been replicated (Cordes et al., 2001;
Cordes et al., 2000; Lowe et al., 1998), and additional neurocognitive and sensory
networks have also been studied using fcMRI, including cerebellar (Allen et al.,
2005), visual (Cordes et al., 2000; Lowe et al., 1998), auditory (Cordes et al.,
2000), language (Cordes et al., 2000), attention (Fox, Corbetta, Snyder, Vincent,
& Raichle, 2006), memory (Allen et al., 2007; Kahn, Andrews-Hanna, Vincent,
Snyder, & Buckner, 2008; Li et al., 2002; Vincent et al., 2006), and default mode
(Fox et al., 2005; Greicius et al., 2003; Greicius et al., 2004; Greicius et al., 2008;
He et al., 2007; K. Wang et al., 2007) systems. Additionally, the disruption of
resting state coherence has been investigated in multiple patient populations,
including multiple sclerosis (Lowe et al., 2008), autism (Kennedy & Courchesne,
2008; Turner, Frost, Linsenbardt, McIlroy, & Muller, 2006), attention-
deficit/hyperactivity disorder (Uddin et al., 2008), chronic pain (Baliki, Geha,
Apkarian, & Chialvo, 2008), and AD (Allen et al., 2007; Greicius et al., 2004;
Greicius et al., 2008; He et al., 2007; Li et al., 2000; K. Wang et al., 2007).

22
Standard methods of fcMRI studies involve identifying a “seed” region, or
primary ROI, averaging the temporal waveforms of all the voxels in that region,
and cross-correlating that average waveform with all other voxels in the brain.
After applying appropriate thresholds, significant areas of brain activity in
functionally related regions are identified. As mentioned above, fcMRI focuses on
coherence among low frequencies between brain regions, and pre-processing
analyses involve filtering out high frequency fluctuations. To further investigate
the frequencies related to the pattern of functional connectivity, Cordes et al.
(2001) conducted a study to examine the temporal patterns that contribute to the
cross-correlation between ROIs. By applying a spectral analysis to the cross-
correlation coefficient, they were able to determine that, on average, only low
frequencies of less than 0.1 Hz contribute significantly to intrinsic interregional
coherence. Therefore, most researchers employing fcMRI methods focus only on
frequencies less than 0.1 or 0.08 Hz (Fox & Raichle, 2007).
Spontaneous oscillations examined with fcMRI are presumed to reflect
neural connections, though little objective evidence for this exists. However, a
recent study combining fcMRI and diffusion tensor imaging (DTI) aims to clarify
this issue (Greicius et al., 2008). DTI is a noninvasive measure of white matter
tracts that allows for the estimation of structural connectivity in the brain.
Greicius, Krasnow, Reiss, and Menon (2008) applied DTI and fcMRI to three
regions of the brain involved in the default mode network, including posterior

23
cingulate cortex/retrosplenial cortex (PCC/RSC), medial prefrontal cortex (MPC),
and MTL. A comparison of the two resulting maps showed that the results are
similar, but with important differences. The DTI map reflected connectivity
between MPFC and PCC/RSC, as well as between MTL and PCC/RSC, areas that
animal studies have shown to be directly connected. White matter tracts between
MPFC and MTL regions could not be established, which the authors attribute to
the presence of an indirect connection between the two regions, via the uncinate
fasiculus, rather than a direct connection. Alternatively, the fcMRI map reflected
resting state coherence among all three regions. These results suggest that fcMRI
maps primarily reflect anatomical connectivity, though they are not direct
representations.
fcMRI of the medial temporal lobe. Most of what is currently known about
the structural and functional connectivity of the episodic memory system and
MTL comes from animal research. However, new imaging techniques provide the
opportunity for examination of neural networks in the human brain. Rombouts,
Stam, Kuijer, Scheltens, and Barkhof (2003) demonstrated functional synchrony
between right and left hippocampi in a small group of three young adults. A more
detailed study used fcMRI to determine how closely the memory system of
humans mirrors that of the monkey. In a sample of 55 young adults, Kahn,
Andrews-Hanna, Vincent, Snyder, and Buckner (2008) identified a total of 16
different seed regions within the left hemisphere of the MTL, including eight

24
across the length of the hippocampus, three in the perirhinal/entorhinal cortex,
and five in the parahippocampal cortex. The authors found distinct patterns of
spontaneous coherence. Seed regions in the head of the hippocampus and
posterior end of the perirhinal/entorhinal cortices showed similar patterns of
connectivity to the anterior inferior temporal sulcus (aITS), while seed regions in
the body of the hippocampus and the posterior parahippocampal cortex
overlapped in coherence with the inferior parietal lobule (IPL), retrosplenial
cortex, inferior posterior cingulate, and ventral medial prefrontal cortex,
suggesting the presence of two separate but parallel pathways within the MTL. In
an attempt to validate their findings, the research group used a second sample of
45 young adults to correlate seed regions in the aITS and IPL with those in the
parahippocampal cortex, perirhinal/entorhinal cortices, and hippocampus. They
found stronger correlations between the aITS and the anterior head of the
hippocampus, perirhinal/entorhinal cortices, and anterior portion of the
parahippocampal cortex, relative to the IPL. In contrast, the IPL showed greater
correlations with the posterior parahippocampal cortex, relative to the aITS.
With this method, Kahn, Andrews-Hanna, Vincent, Snyder, and Buckner
(2008) were able to establish the existence of two separate pathways linking
distinct subregions of the MTL that merge in the hippocampus, as has been found
in the monkey. The pathway that includes the IPL, retrosplenial cortex, posterior
cingulate cortex, and ventral medial prefrontal cortex has been found to be

25
involved in memory tasks (Vincent et al., 2006), as well as the default network
(Greicius et al., 2003). The authors note that these findings provide support for the
theory that the primary function of the hippocampus is to integrate spatial
information from the parahippocampal cortex with nonspatial sensory information
from the perirhinal cortex (Eichenbaum et al., 2007). However, it is important to
note that fcMRI cannot establish the direction of functional connectivity
pathways. Therefore, the presence of unidirectional and bidirectional coherence
pathways among regions (e.g. between the hippocampus and the
perirhinal/entorhinal cortices) has not been examined here, thus precluding
conclusions about distinct and separate functions occurring in these regions.
Additionally, future studies exploring differences in patterns of coherence among
the perirhinal and entorhinal cortices with other subregions of the MTL will be
useful in determining the functional and structural connectivity patterns of the
human episodic memory system.
fcMRI of the MTL in elderly adults and Alzheimer’s disease patients.
FcMRI has also been used to examine functional changes in the MTL in healthy
older adults and patients with AD, with a primary focus on the hippocampus.
However, unlike the proliferation of research focused on structural changes in the
MTL, only a few studies have investigated potential corresponding changes in the
functional integrity of this region. Li et al. (2002) examined low frequency
fluctuations in the left and right hippocampi in elderly adults, subjects with MCI,

26
and patients with AD. They found functional coherence between hippocampi in
the two hemispheres to be significantly reduced in those with MCI, as compared
with elderly, and even further reduced in the group with AD. Furthermore, the
degree of coherence correlated positively with cognitive performance on the Mini
Mental State Exam (Folstein, Folstein, & McHugh, 1975). Though conclusions
are limited by the restricted approach of examining functional connectivity only
between the hippocampi, it is an important study in that it was the first to
demonstrate the usefulness of fcMRI in detecting functional differences in AD
and MCI, and to establish a relationship between cognitive performance and
spontaneous coherence in these populations.
Extending these findings, two additional studies examined functional
coherence between the hippocampus and the rest of the brain in AD patients
(Allen et al., 2007; L. Wang et al., 2006). In elderly adults, Wang et al. (2006)
found low frequency fluctuations in the right hippocampus to correlate with
regions that overlap with the default mode network, including medial prefrontal
cortex, ventral anterior cingulate cortex, orbital frontal cortex, posterior cingulate
cortex, precuneus, left inferotemporal cortex, and right inferior parietal cortex.
Cross correlation of the left hippocampus revealed asymmetry in the coherence
maps, with similar but fewer regions correlating with the left hippocampus, and to
a lesser magnitude and spatial extent. Compared to this group, patients with mild
or very mild AD exhibited reduced coherence with the right hippocampus in
27
medial prefrontal cortex, ventral anterior cingulate cortex, right cuneus and
precuneus, right inferotemporal cortex (including inferior temporal gyrus and
perirhinal cortex), right superior temporal gyrus, and middle temporal gyrus. A
reduction in the right posterior cingulate cortex was also observed, though it did
not meet full criteria for significance. The only difference noted in connectivity of
the left hippocampus in the AD group was significantly increased coherence with
the right dorsolateral prefrontal cortex.
Allen et al. (2007) found a similar pattern of reduced functional
connectivity with the hippocampi in AD, though to a greater degree and with a
notable exception. Their sample of patients with mild AD showed reduced
coherence with parietal, occipital, and limbic regions, as well as with basal
ganglia and cerebellum. However, a complete loss of connectivity between the
hippocampus and the frontal lobes in AD patients was found, contrary to the
increase in functional synchrony between the left hippocampus and the right
dorsolateral prefrontal cortex reported by Wang et al. (2006). The authors
attribute this absence of connectivity with frontal regions to an overall greater
severity in cognitive decline in their sample of individuals with AD as compared
to the sample studied by Wang et al. , consistent with previous findings that
functional coherence declines as cognitive deficits increase (Li et al., 2002).
These studies demonstrate the utility of fcMRI in detecting functional in
vivo changes in the MTL with AD. Despite the central role of the EC in episodic

28
memory processing, and the knowledge that the EC is affected earlier in the
course of the AD than the hippocampus, spontaneous low frequency coherence of
this structure has not been examined in this population. The goal of this pilot
study is to examine functional connectivity of the EC with the rest of the brain in
AD using fcMRI. In particular, potential disruptions in connectivity with the
hippocampus will be investigated, and the relationship of low frequency
synchrony to structural volume and memory performance will be examined.
29
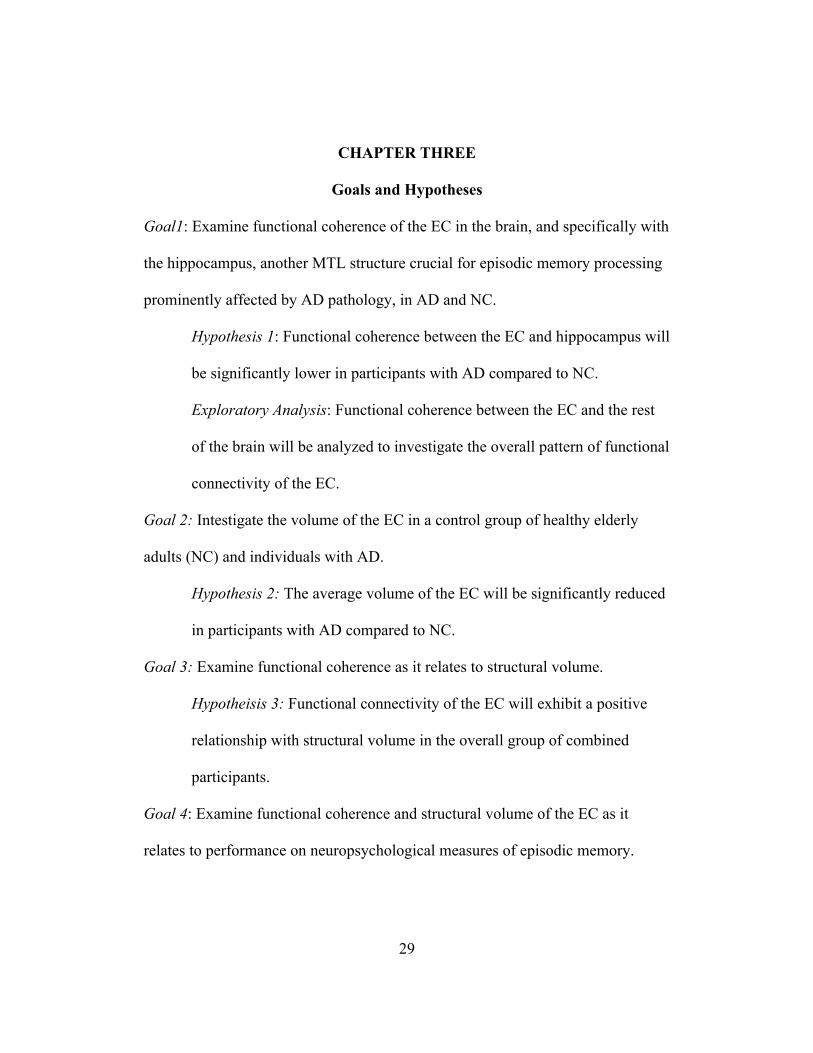
CHAPTER THREE
Goals and Hypotheses
Goal1: Examine functional coherence of the EC in the brain, and specifically with
the hippocampus, another MTL structure crucial for episodic memory processing
prominently affected by AD pathology, in AD and NC.
Hypothesis 1: Functional coherence between the EC and hippocampus will
be significantly lower in participants with AD compared to NC.
Exploratory Analysis: Functional coherence between the EC and the rest
of the brain will be analyzed to investigate the overall pattern of functional
connectivity of the EC.
Goal 2: Intestigate the volume of the EC in a control group of healthy elderly
adults (NC) and individuals with AD.
Hypothesis 2: The average volume of the EC will be significantly reduced
in participants with AD compared to NC.
Goal 3: Examine functional coherence as it relates to structural volume.
Hypotheisis 3: Functional connectivity of the EC will exhibit a positive
relationship with structural volume in the overall group of combined
participants.
Goal 4: Examine functional coherence and structural volume of the EC as it
relates to performance on neuropsychological measures of episodic memory.

30
Hypothesis 4: Significant positive correlations will be found between
functional coherence of the left EC with the hippocampus and measures of
verbal recall. Structural volume of the EC will show significant positive
correlations with measures of verbal recall.
Exploratory Goal: Examine the relationship of functional coherence and
structural volume of the EC with a global measure of cognitive ability.

31
CHAPTER FOUR
Methodology
Participants
Twenty participants were recruited from the Alzheimer’s Disease Center (ADC)
at the University of Texas Southwestern Medical Center (UTSW). The sample
included 10 patients with mild probable AD ranging in age from 56 to 83 years (6
females and 4 males, mean age = 69.8 years), and 10 healthy control subjects
(NC) ranging in age from 59 to 83 years (5 females and 5 males, mean age =
73.5). Participants in the groups were selected to be similar in age, gender, and
education. The UTSW institutional review board approved the study, and all
participants gave informed consent for their participation. A clinical diagnosis of
AD was made using the National Institute of Neurological and Communication
Disorders and Stroke/AD and Related Disorders Association (NINCDS/ADRDA)
criteria (McKhann et al., 1984). All patients underwent physical and neurological
examinations, and neuropsychological assessment. Functional decline was
assessed with the Clinical Dementia Rating Scale (Morris, 1997). All NC
participants had CDR scores of 0, while CDR scores for AD patients ranged from
0.5 to 1.0, indicating mild disease. All participants were English-speaking and
were screened for other brain disorders such as stroke, unstable medical
conditions, and contraindications for the MRI environment.

32
Neuropsychological Assessment
Participants underwent a neuropsychological evaluation that assessed
multiple cognitive domains. For the purpose of this study, a measure of recall,
Logical Memory-Story A of the Wechsler Memory Scale-Revised (WMS-R)
(Weschler, 1987), was selected from the battery in order to examine the
relationship between episodic memory and MRI measures of functional
connectivity of the EC. The WMS-R is a standardized battery of tests designed to
measure different aspects of memory functioning, originally published in 1945
and revised in 1987. The Logical Memory Immediate Recall subtest involves the
presentation of two short stories (i.e., Story A and Story B), with immediate recall
following the presentation of each story. A delayed free recall trial is administered
30 minutes following the conclusion of immediate recall. For the purpose of this
study, raw scores of immediate and delayed recall of Story A will be used.
Additionally, a measure of global cognitive ability, a total score (Chandler
et al., 2005) derived from the Consortium to Establish a Registry for Alzheimer’s
Disease (CERAD) Neuropsychological Battery (Morris et al., 1989), was selected
to investigate the relationship between EC and global cognitive functioning. The
set of tests developed for the CERAD are used to detect cognitive impairment in
AD. The battery consists of the MMSE and six additional subtests designed to
measure aspects of language and memory functioning: Verbal Fluency-Animals,
15-item Boston Naming Test, Constructional Praxis, Word List Memory, Word

33
List Recall, and Word List Recognition. The CERAD total score was computed
following the methods of Chandler et al. (2005) by adding Verbal Fluency, 15-
item Boston Naming Test, Word List Learning, Constructional Praxis, Word List
Recall, and Recognition Discriminability subtests.
Magnetic Resonance Imaging
Data acquisition. Imaging was performed on a 3T Phillips MRI scanner.
High-resolution T1-weighted structural images were acquired using a standard
three-dimensional (3D) whole-brain MP-RAGE sequence using sensitivity
encoding (SENSE) to reduce susceptibility artifacts in the images (TR = 2000 ms,
TE = 30 ms, flip angle = 12°, FOV = 256mm, sagittal slices, thickness = 1 mm).
Functional T2*-weighted images were acquired using a single-shot gradient echo
planar pulse sequence using SENSE with a TE of 30 ms, matrix size of 64 × 64,
and spatial resolution of 3.44 × 3.44 × 4.00 mm. This time series was composed
of 205 images acquired for each of 37 axial slices taken in an interleaved fashion.
To ensure stability of the MR signal, the first 5 images were not included in the
analyses. During the functional scan, participants were at rest in a darkened
scanner room, and followed the instructions to lie still with their eyes closed.
Structural volume measurements. Structural ROIs were manually traced
on the high resolution images, in the left and right hemispheres of each
participant, using the procedures described below.
34
The EC was identified based on the method described by Killiany and
colleagues (2002). This method measures the mid-region of the structure and
excludes the anterior and posterior edges, which are difficult to discern, to
increase the reliability of the tracings across subjects. Tracing began on the
coronal plane in which the junction of the mammillary bodies and the fornix was
evident. The outside edge of the rhinal sulcus and the inferior surface of the
subiculum formed the boundaries of the EC. These landmarks were used to trace
the EC on the two adjacent anterior and posterior slices to cover the extent of the
mid-region of the structure.
Hippocampal tracings were performed on coronal slices, following
the methods of Slavin and associates (2007). Tracing began on the most posterior
slice in which the tail of the hippocampus and the fornix was visible, and was
continued on each slice, moving anteriorly, until the amygdala became apparent.
These boundaries included regions CA1 through CA4, the subiculum, and dentate
gyrus.
Functional connectivity analyses. Image processing and analysis were
performed using Analysis of Functional NeuroImage (AFNI) software (Cox,
1996). First, images were transformed into the coordinate system of Talairach and
Tournoux (1993), to aid in anatomical localization and allow the combination of
data across subjects and comparisons between groups. Next a series of
preprocessing steps were taken to increase the signal-to-noise ratio in the images.

35
Differences in slice-dependent time shifts were corrected, and motion correction
was applied by using a 3D-registration algorithm to align the images through
time. Data was temporally band-pass filtered to retain only frequencies between
0.08 Hz and 0.009 Hz. This accomplishes the removal of high frequency
fluctuations as well as very low frequency oscillations associated with scanner
drift (Smith et al., 1999). Finally, linear trends and additional sources of spurious
variance were removed following the procedures of Fox and colleagues (2005).
Cardiac pulsations and respiratory cycles can result in neural fluctuations aliased
in the BOLD signal at low frequencies (Biswal, DeYoe, & Hyde, 1996). These
physiological sources of noise can be substantially reduced by regressing out
signals from brain regions where this noise is most prominent. Changes in
respiration rate and depth result in BOLD signal fluctuations throughout the brain,
which can be represented in a global signal created by averaging voxels across the
brain (Birn, Diamond, Smith, & Bandettini, 2006). An additional source of
respiratory-related noise is prominent in white matter tissue (Wise, Ide, Poulin, &
Tracey, 2004), while cardiac pulsations are reflected in the BOLD signal changes
of voxels in cerebral spinal fluid (CSF) (Birn et al., 2006). Therefore, the neural
signal from a voxel in the lateral ventricle, and the signal from a voxel located in
deep white matter, as well as the global signal, were removed using linear
regression methods.
36
To create seed regions for functional connectivity analyses, the high
resolution tracings of both structures were resampled to the functional resolution
in each subject and edited to include only gray matter within the boundaries of the
structures. The pre-processed BOLD time series was extracted from the seed
region in the EC and averaged to create a reference function for the left EC.
Resampled EC seed regions ranged in size from one to two voxels across
individuals. The resampled hippocampal tracing was created for the use of a mask
during the target analysis of functional connectivity between the left EC and
hippocampus (described below). Hippocampal ROIs ranged in size from 6 to 26
voxels upon resampling.
Statistical analyses. Volumetric measurements of the left EC in AD and
NC subjects were compared using a t test with equal variances not assumed.
For the whole brain analysis, the EC reference function was cross-
correlated with the BOLD signal time series of all other voxels in the brain to
produce a correlation map. To enable group comparisons, correlation coefficients
were transformed to z values using Fisher’s r-to-z transformation (Zar, 1996, as
cited in Vincent et al., 2006). Within-group t tests were conducted to identify
brain regions in the AD group and NC group that exhibit correlations with the left
EC that are significantly different from zero. A between-group t test was used to
identify brain regions that demonstrate a significant group difference in functional
connectivity with the EC. To protect against type I error typical of multiple
37
comparisons, two thresholds were applied to the output from these t tests. First, all
voxels whose t value do not exceed α = 0.01 were excluded from further analysis.
Then, Monte Carlo simulations were used to determine the probability of falsely
detecting clusters of various sizes. An overall (i.e., over the entire three-
dimensional image volume) significance level of p < 0.05 was used, and a
minimum cluster size that would occur with a probability of less than 0.05 for
each comparison was identified. Clusters that exceeded this cutoff were retained.
For the target analysis between the EC and the hippocampus, the average z
value of all voxels within the hippocampus was extracted from the unthresholded
whole brain analysis for each individual. Significant functional connectivity
between these two regions was examined in each group separately using single-
sample t tests on group averages of z values. A group comparison was also made
using a two-sample t test.
Correlational analyses were conducted to examine the relationships
between EC connectivity with the hippocampus and EC volume. Additional
correlational analyses were used to investigate the relationship between EC
volume and measures of episodic memory and global cognitive ability. These
same neuropsychological measures were correlated with EC connectivity.
Depending on the normality of the distributions of these variables, either Pearson
product moment or Spearman rank correlation analyses were conducted.

38
CHAPTER FIVE
Results
Demographic Characteristics
Of the 20 participants recruited for this study, four subjects were
eliminated due to significant signal loss in the MTL on the functional scan. The
remaining sample of AD subjects included 7 participants aged 56 to 76 years
(mean age 69.6 years), with 4 males and 3 females. They had an average
education level of 15.7 years, and an average MMSE score of 24.6 with scores
ranging from 21 to 28. The sample included one left-handed female. The NC
sample consisted of 9 participants (5 males and 4 females) aged 59 to 83 years
(mean age 73.8 years), with an average education level of 15.7 years, and an
average MMSE score of 29.6 (scores ranged from 29 to 30). The NC sample
included three left-handed subjects, two females and one male. The groups did not
differ significantly in age [t(14) = 1.00, p > .05] or education [t(14) = -0.05, p >
.05]. See Table 1 for a display of demographic information.

39
Table 1. Demographic Variables
AD NC
(n = 7) (n = 9)
Gender M/F 4/3 5/4
Age M (SD) 69.6 (6.8) 73.8 (9.2)
Education M (SD) 15.7 (1.2) 15.7 (2.3)
MMSE M (SD) 24.6 (2.6) 29.6 (0.5)
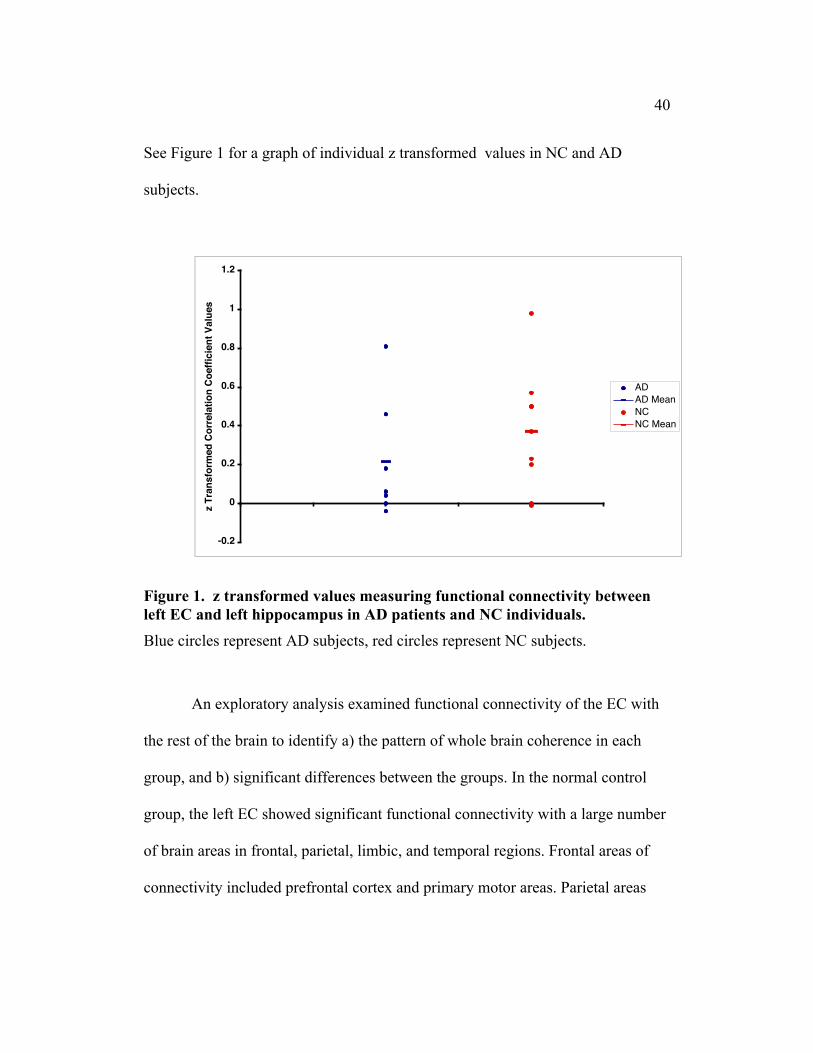
Hypothesis One
Hypothesis one stated that functional connectivity between the EC and
hippocampus would be significantly reduced in participants with AD compared to
NC. Across both groups, MTL signal dropout was more prevalent in the right
hemisphere, thus, fcMRI analyses were performed using only the left EC seed.
Significant functional connectivity was detected between these two regions in the
NC group, with an average z value of 0.4 (SD = 0.31) [t(6) = 3.60, p < .05].
However, no significant functional connectivity was observed in AD patients,
who had an average z value of 0.2 (SD = 0.31) [t(8) = 1.83, p > .05]. A
comparison of the two groups did not detect significantly different levels of
functional connectivity between the EC and hippocampus [t(14) = 1.00, p > .05].
40
See Figure 1 for a graph of individual z transformed values in NC and AD
subjects.
-0.2
0
0.2
0.4
0.6
0.8
1
1.2
z Tr
ansf
orm
ed C
orre
latio
n Co
effic
ient
Val
ues
ADAD MeanNCNC Mean
Figure 1. z transformed values measuring functional connectivity betweenleft EC and left hippocampus in AD patients and NC individuals.
Blue circles represent AD subjects, red circles represent NC subjects.
An exploratory analysis examined functional connectivity of the EC with
the rest of the brain to identify a) the pattern of whole brain coherence in each
group, and b) significant differences between the groups. In the normal control
group, the left EC showed significant functional connectivity with a large number
of brain areas in frontal, parietal, limbic, and temporal regions. Frontal areas of
connectivity included prefrontal cortex and primary motor areas. Parietal areas

41
included bilateral inferior parietal lobule, primary somatosensory cortex,
precuneus, and superior parietal lobule. Functional connectivity with the occipital
lobe was found in the right cuneus, left lingual gyrus, and left middle occipital
gyrus. Temporal lobe brain regions included bilateral middle temporal gyrus,
auditory cortex areas, and the right hippocampus. The limbic regions of anterior
cingulate cortex, posterior cingulate cortex, and the parahippocampal gyrus also
showed functional connectivity with the EC. Additional areas of functional
coherence included the insula, basal ganglia, and cerebellum (Figure 2). For a
complete table of these brain regions and associated Brodmann areas see Table 2.
AD patients showed patterns of functional connectivity in frontal, parietal,
temporal, occipital, and cerebellar regions, though substantially reduced across
the brain, most notably in frontal and temporal areas (Figure 3). See Table 3 for a
complete list of these brain regions.

42
Figure 2. Functional connectivity of left EC in control participants.LR
-1
1
LR

43
Figure 3. Functional connectivity of left EC in patients with AD
.
-1
1
LR

44
Table 2. Brain regions demonstrating functional connectivity (Local Maxima)with the Left EC in NC participants
Brain Region BA Side x y z t Value
Frontal IFG L/R -34/46 28/28 5/-6 8.28/19.60 MedFG 6 L/R -10/3 -25/-22 53/65 10.24/8.65 MidFG 6 L/R -23/30 -13/-4 62/61 12.04/7.54
8 R 26 22 45 7.449 R 41 16 31 4.8811 L/R -35/27 35/32 -11/-12 4.19/4.7847 R 45 38 -10 3.37
SFG 10 L/R -13/14 67/65 6/14 7.12/8.13 ParG 31 L -2 -18 46 4.25 PrG 6 L/R -53/50 -4/-3 6/36 10.83/7.91
4 R 18 -31 64 12.50Parietal IPL 40 L/R -41/62 -28/-25 39/31 3.39/4.46 PoG 3 L -24 -28 63 10.28
40 L -35 -35 54 5.197 L -11 -51 66 3.625 R 33 -42 61 5.80
PCun 39 L/R -38/43 -63/-65 37/37 4.70/4.297 L/R -24/25 -58/-76 51/46 4.57/3.6931 L/R -7/3 -47/-67 34/23 3.74/3.40
SPL 7 L/R -30/25 -67/-59 48/45 6.28/4.11Occipital Cuneus 19 R 17 -80 30 5.01
18 R 5 -83 24 4.50 LgG 18 L -21 -78 -10 4.76 MOG 18 L -25 -90 6 4.50

45
Table 2, Continued
Brain Region BA Side x y z t Value
Temporal MTG 37 L -47 -59 2 6.99
22 L/R -55/64 -39/-34 3/5 4.61/6.1421 R 51 1 -27 7.4239 L/R -45/47 -55/-63 12/20 3.84/5.85
STG 22 L -47 8 -4 3.7338 R 33 3 -15 8.65
TrG 41 R 56 -16 12 5.80 HC R 29 -30 -3 3.45Limbic ACC 32 L/R -11/3 45/40 -5/6 3.66/3.8 PCC 23 L -4 -32 22 5.20 PHG L -21 -16 -12 6.19 Amg R 27 -6 -18 7.08 Uncus 28 L -26 7 -19 7.73Insula 13 L/R -29/45 -28/8 14/-4 5.50/3.96Basal Ganglia GPl L -17 0 -3 3.61 Caudate L -31 -35 4 4.53Cerebellum
L/R -4/28 -57/-32 2/-21 10.25/6.05L/R -36/15 -60/-55 -22/-11 6.51/6.06L -10 -49 -29 5.40L -4 -55 -20 3.93R 23 -49 -32 4.43
Abbreviations: BA, Brodmann Area; x, right/left; y, anterior/posterior; z, superior/inferior; L, left;R, right; IFG, inferior frontal gyrus; MedFG, medial frontal gyrus, MidFG, middle frontal gyrus;ParG, paracentral gyrus; PrG, precentral gyrus; SFG, superior frontal gyrus; IPL, inferior parietallobule; PoG, postcentral gyrus; PCun, precuneus; SPL, superior parietal lobule; LgG, lingualgyrus; MOG, middle occipital gyrus; STG, superior temporal gyrus; TrG, transverse gyrus; HC,hippocampus; ACC, anterior cingulate cortex; PCC, posterior cingulate cortex; PHG,parahippocampal gyrus; GPl, globus pallidus (lateral). Threshold t value = 2.75, p < .01.

46
Table 3. Brain regions demonstrating functional connectivity (Local Maxima)with the Left EC in AD patients
Brain Region BA Side x y z t Value
Frontal IFG 47 L -35 15 -11 6.59 SubG 34 R 16 4 -12 5.44Parietal PCun 7 R 12 -69 36 4.24Occiptal FuG 19 R 26 -55 -8 3.79 LgG 19 L -25 -61 1 4.63Temporal MTG 20 L -51 -38 -12 4.20 STG 38 R 33 7 -19 11.98 HC R 3 29 -14 12.41Limbic CC 31 L/R -2/10 -32/-46 35/3 6.73/5.70 PCC 30 L -8 -55 9 7.31Insula 13 L -42 -18 7 6.60Basal Ganglia Putamen R 22 12 -6 4.67Cerebellum
R 12 -44 -2 4.43L -25 -64 -12 4.56
Abbreviations: BA, Brodmann Area; x, right/left; y, anterior/posterior; z,superior/inferior; L, left; R, right; IFG, inferior frontal gyrus; SubG, subcallosal gyrus; PCn,precuneus; FuG, fusiform gyrus; LgG, lingual gyrus; MTG, middle temporal gyrus; STG, superiortemporal gyrus, HC, hippocampus; CC, cingulate cortex; PCC, posterior cingulate cortex.Threshold t value = 2.97, p < .01.

47
Following correction for multiple comparisons by applying t value (t =
2.51, p < .025) and cluster size (43 voxels) thresholds, no brain regions with
significantly different levels of EC connectivity between the groups were
detected. Applying less stringent thresholds (t = 2.15, p < .05, cluster size = 15
voxels) resulted in the detection of significant differences among the groups.
Compared to the NC group, AD patients exhibited reduced functional
connectivity in bilateral prefrontal cortex, right temporal, and bilateral cerebellar
areas. Areas of significantly increased functional connectivity in AD patients
relative to control subjects were found in bilateral inferior frontal gyrus, left
middle frontal gyrus, left parahippocampal gyrus, and left putamen (see Figure 4,
Tables 4 and 5).

48
-1
1
LR
Figure 4. Group comparison of functional connectivity of the EC.
Yellow/red areas indicate brain regions with significantly reduced EC functionalconnectivity in AD patients compared to controls. Blue areas represent areas withsignificant increases in functional connectivity in AD patients relative to NCparticipants.

49
Table 4. Brain regions demonstrating reduced functional connectivity (LocalMaxima) with the Left EC in AD patients compared to NC participants
Brain Region BA Side x y z t Value
Frontal IFG 47 L -44 21 -14 3.90 MedFG 10 R 15 57 1 3.43 MidFG 6 L -35 10 57 3.24
10 L -36 56 18 2.97 SFG 6 L -4 8 60 3.34
9 L -21 54 35 3.248 R 23 28 45 3.33
Temporal STG 22 R 55 1 5 3.01
39 R 49 -59 28 2.69 FuG 37 R 46 -59 -17 2.91 PHG 35 R 23 -26 -11 3.69Cerebellum
L/R -30/28 -37/-44 -26/-16 4.52/2.86
Abbreviations: BA, Brodmann Area; x, right/left; y, anterior/posterior; z, superior/inferior; L, left;R, right; IFG, inferior frontal gyrus; MedFG, medial frontal gyrus; MidFG, middle frontal gyrus;SFG, superior frontal gyrus; STG, superior temporal gyrus; FuG, fusiform gyrus; PHG,parahippocampal gyrus. Threshold t value = 2.15, p < .05.
50
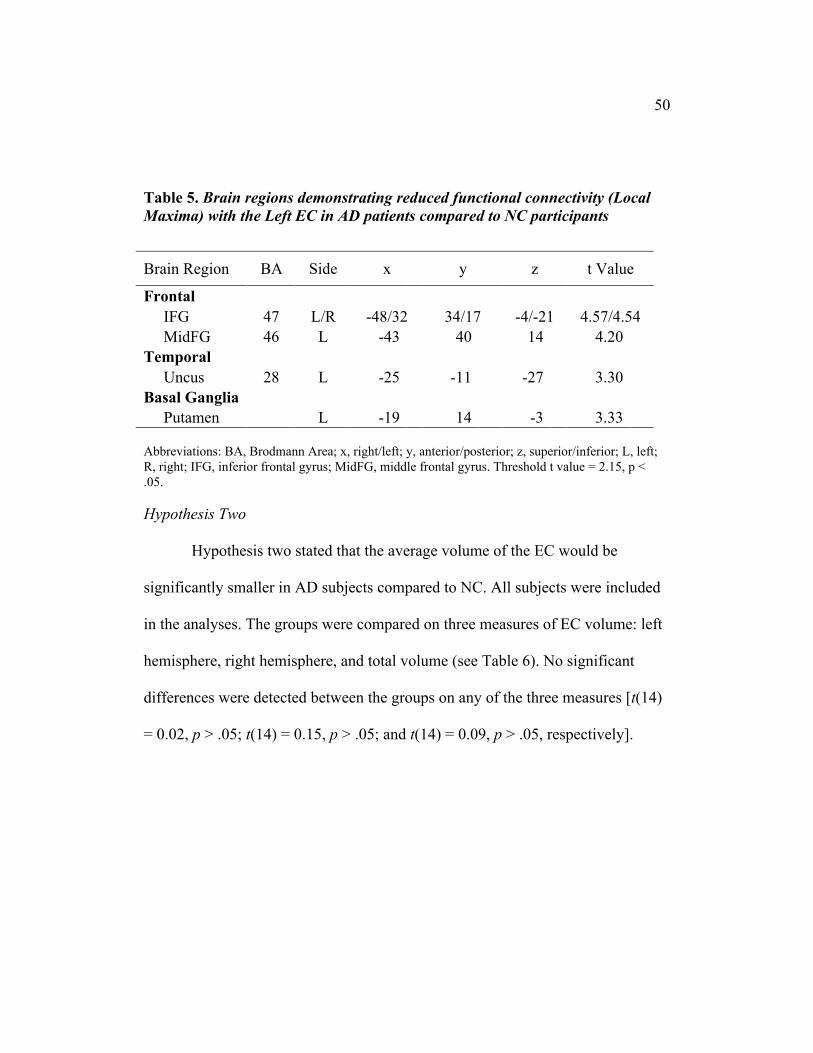
Table 5. Brain regions demonstrating reduced functional connectivity (LocalMaxima) with the Left EC in AD patients compared to NC participants
Brain Region BA Side x y z t Value
Frontal IFG 47 L/R -48/32 34/17 -4/-21 4.57/4.54 MidFG 46 L -43 40 14 4.20Temporal Uncus 28 L -25 -11 -27 3.30Basal Ganglia Putamen L -19 14 -3 3.33
Abbreviations: BA, Brodmann Area; x, right/left; y, anterior/posterior; z, superior/inferior; L, left;R, right; IFG, inferior frontal gyrus; MidFG, middle frontal gyrus. Threshold t value = 2.15, p <.05.
Hypothesis Two
Hypothesis two stated that the average volume of the EC would be
significantly smaller in AD subjects compared to NC. All subjects were included
in the analyses. The groups were compared on three measures of EC volume: left
hemisphere, right hemisphere, and total volume (see Table 6). No significant
differences were detected between the groups on any of the three measures [t(14)
= 0.02, p > .05; t(14) = 0.15, p > .05; and t(14) = 0.09, p > .05, respectively].
51
Table 6. EC Volume Measurements
AD NC
(n = 10) (n = 10)
Left EC M (SD) 147.3 (40.0) 147.7 (51.7)
Right EC M (SD) 146.1 (39.0) 149.7 (54.5)
Total EC M (SD) 293.4 (68.0) 297.3 (104.9)
Note: EC volumes are in cubic millimeters.
Hypothesis Three
Hypothesis three stated that functional connectivity between the EC and
hippocampus would be positively related to the structural volume of the EC in the
combined group of all subjects. For this analysis, the relationship between left EC
volume and connectivity of left EC with the left hippocampus was examined
using Spearman rank correlation analysis. No significant correlation was detected
(rs = .05, p > .05).
Hypothesis Four
Hypothesis four stated that significant positive correlations would be
found between functional connectivity of the EC and measures of verbal recall,
and between volume of the EC and measures of verbal recall. To investigate the

52
relationship of functional coherence of the EC and hippocampus to memory test
performance, individual average z values were correlated with raw scores on LM
I Story A and LM II Story A of the WMS-R (Wechsler, 1987) using Spearman
rank correlation analysis. No significant relationships were detected (rs = -.13, and
rs = .07 respectively, p > .05). Volume of the left EC was also correlated with LM
I Story A and LM II Story A. No significant relationships were detected (rs = .37,
and rs = .17, respectively, p > .05).
As an exploratory analysis, the relationship of EC functional connectivity
and EC volume to CERAD total score (Chandler et al., 2005) was examined with
Spearman rank correlation analysis. No significant correlations were detected (rs
= .16, and rs = .30, respectively, p > .05). See Table 6 for a display of group and
total sample median scores on these measures.

53
Table 7. Neuropsychological and Functional Connectivity Measures
ADMdn (IQR)
NCMdn (IQR)
Total SampleMdn (IQR)
LM I A 6.0 (4.0) 14.0 (8.5) 9.0 (8.0)
LM II A 4.0 (5.0) 15.0 (9.0) 7.0 (10.7)
CERAD Total 76.0 (18.0) 98.0 (7.5) 89.5 (22.7)
EC z value 0.1 (0.5) 0.4 (0.4) 0.2 (0.5)
Abbreviations: Mdn, median; IQR, interquartile range.
54
CHAPTER SIX
Discussion
The overall purpose of the present study was to examine functional
changes in the EC associated with AD using fcMRI, and to investigate the
relationship of these functional changes to memory performance and global
cognitive ability. This study represents the first investigation of functional
connectivity of the EC in AD patients.
Hypothesis One
The first hypothesis predicted that functional connectivity between the left
EC and hippocampus would be significantly lower in AD patients relative to NC.
Significant coherence with the hippocampus was found among NCs, a finding that
is consistent with existing literature (Kahn et al., 2008). No significant functional
connectivity between these regions was found in participants with AD. Despite
these disparate outcomes from single-sample analyses, no significant differences
were found in a direct comparison of the groups.
There are multiple factors that could account for this outcome. Most
notably among them is the lack of power due to small sample size. The data from
four subjects were not used in these analyses due to substantial signal loss in the
EC as a result of inhomogeneities in the magnetic field, likely resulting in a
substantial loss of power.

55
Another factor that may have influenced these results is the method of data
acquisition. Due to the small size of the EC, and the close proximity of this
structure to the hippocampus, a smaller voxel size may have allowed for better
detection of BOLD signal in these regions. The acquisition parameters used in
this investigation were optimized for whole brain coverage with a sampling rate
that attempts to minimize the aliasing effects of physiological noise. Collecting
data with a smaller voxel size provides a better resolution of the functional data,
though often restricts acquisition to only parts of the brain, and thus, prohibiting
whole brain analysis, or requiring a longer sampling rate thereby increasing the
presence of spurious physiological noise in the data.
In the present study, functional connectivity of the EC with the
hippocampus was examined by correlating the average time series of the EC seed
with the whole brain, and transforming these correlation coefficients to z values
using Fisher’s r-to-z transformation (Zar, 1996, as cited in (Vincent et al., 2006).
These z values were averaged across the length of the hippocampus in each
person. A study by Kahn et al. (2008) investigated whole brain functional
connectivity of the EC and subregions of the hippocampus in healthy adults. The
findings indicate different patterns of whole brain functional connectivity in
subregions of the hippocampus, with anterior hippocampal regions displaying
coherence patterns similar to that of the EC. These results indicate the possibility
of the presence of different connectivity patterns between the EC and subregions
56
of the hippocampus. By averaging across the hippocampus in the present study,
significant differences between the two groups may have been obscured. Future
studies investigating functional connectivity between the EC and different regions
of the hippocampus in AD patients may be warranted.
The whole brain exploratory analysis established patterns of connectivity
with the EC in both groups. In the NC group, areas showing significant functional
connectivity with the EC included sensory association cortex in parietal, occipital,
and temporal lobes, and subcortical and cerebellar regions.
Areas of coherence were found bilaterally in the inferior frontal gyrus,
medial frontal gyrus, and middle frontal gyrus regions of the prefrontal cortex.
This finding is consistent with animal studies showing neocortical projections
from the frontal regions to the EC (Amaral & Insausti, 1990; Kerr et al., 2007).
Functional connectivity was also found in bilateral primary motor cortex
(precentral gyrus).
Functional coherence in the parietal lobe was observed in left primary
somatosensory cortex (postcentral gyrus), as well as in bilateral inferior parietal
lobule, a multimodal sensory association area. This area has been shown to have
connections to the hippocampal formation in monkeys, and is thought to be
involved in spatial navigation (Clower, West, Lynch, & Strick, 2001). Additional
areas of significance in the parietal lobule include bilateral SPL, which plays a
role in forming spatial relationships (Naito et al., 2008), and bilateral precuneus,

57
an area involved in visuospatial imagery and episodic memory retrieval (Cavanna
& Trimble, 2006).
Occipital regions showing significant connectivity are associated with
visual processing, including the right cuneus, which contains portions of primary
visual cortex, and left middle occipital gyrus. In animal studies these regions
have been shown to have reciprocal connections to the EC (Kerr et al., 2007).
Functional connectivity with the EC was noted in several temporal
regions, including bilateral middle temporal gyrus, which plays a role in
multimodal sensory integration (Convit et al., 2000). Bilateral superior temporal
gyrus (STG) and the right transverse gyrus, areas of auditory processing, were
also correlated with the EC, as well as the right hippocampus, left uncus, right
amygdala, and left entorhinal cortex region of the parahippocampal gyrus.
Coherence in the left posterior cingulate was also noted, which is consistent with
existing functional connectivity literature examining the MTL (Fox et al., 2005;
Greicius et al., 2008).
Bilateral insula were observed to have significant coherence with the EC,
This structure processes somatosensory information and projects it to
parahippocampal cortex, where it is then sent to the EC (Kerr et al., 2007).
In sum, the overall pattern of connectivity includes primary sensory
cortical regions and sensory association cortex, as well as brain regions involved
in motor processing including primary motor cortex, basal ganglia, and the

58
cerebellum. These findings are consistent with animal literature (Kerr et al., 2007)
indicating that the EC receives different pieces of sensory information about
events that are projected to the MTL memory system where they are consolidated
into a whole before being projected back to association cortex (Squire & Zola-
Morgan, 1991). Much of what is known about neural networks has been gained
from animal studies. The results of this study provide evidence of similarities
between human and animal brains, and confirm the utility of fcMRI as a useful
method to study connectivity of the human brain.
In contrast to findings in controls, AD participants exhibited a much more
restricted pattern of functional connectivity with the EC. Interestingly, no
functional coherence was observed in the EC or the parahippocampal gyrus,
reflecting reduced interregional connectivity in this area. Connectivity was
observed with other areas of episodic memory processing, including the right
hippocampus and right precuneus. These findings may indicate that, in individuals
with mild AD, functional degradation of the EC initially results in a breakdown of
intraregional processing.
Statistical comparison of the two groups found no significant differences
when applying strict threshold criteria to control for multiple comparisons. The
use of less stringent thresholds revealed significant reductions in frontal,
temporal, and cerebellar areas. Consistent with Allen et al. (2007), this study
found the biggest reductions in prefrontal cortex of AD patients. Contrary to their
59
findings, areas of increased activity in AD patients relative to NC subjects were
found bilaterally in the inferior frontal gyrus region of the prefrontal cortex and
left dorsolateral prefrontal cortex. Increased functional connectivity or activation
in prefrontal cortex in AD patients has been evident in other imaging studies of
AD patients, including positron emission tomography (PET) (Horwitz et al.,
1995), fcMRI (L. Wang et al., 2006), and task-dependent fMRI studies of
memory (Yetkin, Rosenberg, Weiner, Purdy, & Cullum, 2006). These findings
have been interpreted as evidence of a compensatory process in an effort to
redistribute neural resources (Grady et al., 2003). In an fMRI study by Grady et
al. (2003) investigating semantic and episodic memory, AD subjects were found
to recruit more prefrontal cortex regions during the memory tasks compared to
control subjects. Furthermore, greater activation of these areas was associated
with better memory task performance in AD patients. In this study, increased
coherence was also found in the putamen of AD patients. Since the putamen
receives many of its afferents from cerebral cortex, this may also represent a
compensatory process in an effort to offset reduced input.
Reduced functional connectivity in AD subjects was also found in the
right perirhinal and entorhinal regions of the parahippocampal gyrus extending
into hippocampus. An unexpected finding was increased coherence in a small
region of the entorhinal and parahippocampal portion of the parahippocampal
gyrus. This finding is highly unusual, and may be due to the high degree of
60
variability in connectivity in the EC among the AD patients. Taken together, this
can be interpreted as reduced interhemispheric connectivity of the EC in AD
patients, while intrahemispheric coherence may remain intact at the mild stage of
the disease.
A consistent finding in functional connectivity studies investigating
coherence with the MTL in AD patients is reduced connectivity with the
ipsalateral superior temporal gyrus (STG) (Allen et al., 2007; K. Wang et al.,
2007), an area important in language and speech processing. The present study
found reduced coherence in subjects with AD in the right STG. MRI studies
investigating volumetric changes in AD have found reductions in the STG
(Chetelat & Baron, 2003) and those with MCI that progress to AD (Karas et al.,
2008). These findings suggest a particular vulnerability of this temporal lobe
region to AD pathology, and are consistent with neuropathological studies
demonstrating the abnormal accumulation of amyloid deposits in this region
(Braak & Braak, 1991).
Reduced functional coherence was also noted bilaterally in the cerebellum
of AD patients in this study. Microscopic neuropathological changes associated
with Alzheimer’s disease have been documented in the cerebellar cortex (Braak,
Braak, Bohl, & Lang, 1989). Posterior cerebellar volume is significantly reduced
in AD patients (Thomann et al., in press), and reduced functional connectivity
with this structure and the hippocampus has previously been found (Allen et al.,

61
2007). The findings from this study are consistent with research documenting the
disruption of cerebellar networks in AD.
Hypothesis Two
Hypothesis two stated that EC volume would be significantly reduced in
AD subjects. Interestingly, no significant difference in volume was found.
Research findings indicate that functional changes in the EC precede the cell and
volume loss typically found in AD patients (Davies et al., 1987; Selkoe, 2002;
Small et al., 2002). The level of disease in participants with AD in this study
ranged from very mild to mild. The similarity in EC volume in the NC and AD
subjects may indicate that at this level of disease, functional changes are more
evident than structural differences.
Hypothesis Three
Hypothesis three predicted a significant positive relationship between EC
volume and EC functional connectivity with the hippocampus. No significant
relationship was found. The relationship of functional connectivity to structural
volume has not been previously investigated. Research has shown that
pathological changes in AD result in the loss of cells (Davies et al., 1987; Gomez-
Isla et al., 1996), which eventually leads to a reduction of structural volume in
AD. Additionally, it has been shown that functional changes, such as the
breakdown of synapses (Selkoe, 2002) occurs earlier in the disease process than
structural changes. The NC and AD subjects in this study were very similar in
62
volume measurements of the EC. This lack of variability in volume between the
groups, combined with significant differences in functional connectivity are
consistent with research indicating earlier decline of function compared to volume
of the EC. Furthermore, the similarity in volume between the groups may explain
the lack of a relationship between volume and functional connectivity in the EC.
It is possible that a significant relationship between volume and functional
connectivity does not emerge until later stages of the disease when reductions in
volume become apparent.
Hypothesis Four
Hypothesis four predicted significant correlations between episodic
memory test performance and functional connectivity with EC and
hippocampus.A significant positive relationship between a global cognitive
measure, the CERAD total score, and coherence between EC and hippocampus
was also predicted. These hypotheses were not supported. One possible reason for
this is, again, the small sample size and large amount of variability in functional
connectivity of the EC. Alternatively, it is possible that the relationship between
functional connectivity and cognitive ability is different for AD patients and
healthy elderly adults. By combining these groups it is possible that important
relationships among these factors were obscured. Unfortunately, the low sample
size in this study prohibits further investigation of this. Future studies clarifying
the correspondence of cognitive abilities to functional integrity of the EC will be

63
useful in understanding how physiological changes in the brain translate into
behavioral functional impairment.
Volume of the EC was also predicted to correlate positively with episodic
memory measures and global cognitive ability, though no significant relationships
were found. As noted above, there was little variability between the groups in
volume of the EC, with no apparent reductions in AD subjects. The stability of
EC volume among AD patients in this sample may explain the lack of a
relationship between neuropsychological measures and volume.
Limitations
As mentioned above, two limitations to this study are the small sample
size and large voxel size. Low power resulting from a small sample size makes
detection of significant differences between groups difficult. Despite the small
sample size used in this pilot study, unique patterns of connectivity were detected
in NC and AD subjects. Replication and extension of these findings with a larger
sample size will be useful in furthering our understanding of functional
connectivity in AD.
A smaller voxel size would allow for a larger number of voxels to be
maintained in the EC seed region, and thus, provide a better sampling of
connectivity in that region. Several subjects in this study had EC seeds that were
one voxel in size, which may have limited the ability to measure connectivity.
However, research on the effect of seed size has not been conducted, and no

64
apparent pattern related to the size of the EC seed regions was observable in these
subjects.
An additional limitation of this study was the sampling procedure.
Participants were recruited from the UTSW ADC, and thus, were not randomly
selected. Overall, they were generally highly educated, and all were Caucasian,
with the exception of one African American subject. While this may limit
generalizability to some degree, it is important to note that the connectivity
findings are similar to other fcMRI studies of MTL functioning in AD (Allen et
al., 2007; Wang et al., 2006).
Additionally, a total of four left-handed subjects were included in the
sample, one AD patient and 3 NC participants. The effect of handedness on
fcMRI studies has not been investigated, yet differences in cortical organization
between left and right handed individuals have been documented (Hertz-Pannier
et al., 1997; Hines, Chiu, McAdams, Bentler, & Lipcamon, 1992). However,
functional MRI results of these subjects were examined individually, and no
apparent differences were found in coherence patterns as compared to right-
handed subjects
Conclusions and Future Directions
Results of this study examining functional coherence on EC in healthy
elderly participants are quite similar to findings from animal studies showing that
the EC is highly interconnected to primary sensory cortex and sensory association

65
cortex in frontal, temporal, parietal, and occipital cortex, indicating a similar
organization among humans. Compared to NC subjects, patients with AD
demonstrated reductions in frontal and temporal cortices. This pattern of reduced
connectivity in the AD group is consistent with what is known about the
progression of pathophysiology in AD, which begins in the EC and spreads to
areas in frontal and temporal cortex resulting in mild changes in cortical
association areas (Braak & Braak, 1991). Pathophysiological studies of AD
indicate that the neurofibrillary tangles and neuritic plaques tend to be distributed
in a particular pattern, with accumulations beginning in the transentorhinal and
entorhinal cortices, and then spreading to the hippocampal formation, and cortical
association areas. Only in the late stages of the disease does the pathology spread
to superior parietal and occipital regions. Following this pattern of pathology, AD
subjects demonstrated reduced connectivity in frontal and temporal association
cortices, while no differences were observed in parietal or occipital regions.
However, due to the small sample size and limited corrections for multiple
comparisons, replication of these findings is needed, and caution is warranted in
the interpretation of results.
Future studies that include people at risk for AD, as well as patients with
more advanced levels of disease, will help expand our knowledge on the pattern
of cortical connectivity with the EC across the spectrum from healthy aging to
AD. Additionally, studies using a higher resolution of functional data would allow
66
for the investigation of differences in patterns of connectivity among the
subregions of the hippocampal formation and parahippocampal gyrus, thus,
providing information about the interconnections of the MTL in AD and healthy
aging. Multiple fcMRI studies of AD have identified reduced connectivity
between the MTL and prefrontal cortex (Allen et al., 2007; L. Wang et al., 2006).
Future studies investigating functional connectivity of prefrontal cortex in AD
would provide a better understanding of the diversity of function in this area and
its cortical connections. Due to the small sample size in this study, little
information was gained about the relationship of functional connectivity of the
EC and episodic memory functioning. Future research investigating the
relationship of functional integrity to cognitive performance is needed.

67
BIBLIOGRAPHY
Allen, G., Barnard, H., McColl, R., Hester, A. L., Fields, J. A., Weiner, M. F., et
al. (2007). Reduced hippocampal functional connectivity in Alzheimer
disease. Archives of Neurology, 64(10), 1482-1487.
Allen, G., McColl, R., Barnard, H., Ringe, W. K., Fleckenstein, J., & Cullum, C.
M. (2005). Magnetic resonance imaging of cerebellar-prefrontal and
cerebellar-parietal functional connectivity. Neuroimage, 28(1), 39-48.
Amaral, D. G., & Insausti, R. (1990). Hippocampal formation. In G. Paxinos
(Ed.), The Human Nervous System (pp. 711-755). San Diego: Academic
Press.
American Psychiatric Association. (2000). Diagnostic and Statistical manual of
mental dosrders (4th edition, text revision). Washington, DC: Author.
Baliki, M. N., Geha, P. Y., Apkarian, A. V., & Chialvo, D. R. (2008). Beyond
feeling: chronic pain hurts the brain, disrupting the default-mode network
dynamics. Journal of Neuroscience, 28(6), 1398-1403.
Bandettini, P. A., & Wong, E. C. (1994). Magnetic resonance imaging of human
brain functiong. Neurosurgery Clinics of North America, 35(6), 662-672.
Birn, R. M., Diamond, J. B., Smith, M. A., & Bandettini, P. A. (2006). Separating
respiratory-variation-related fluctuations from neuronal-activity-related
fluctuations in fMRI. Neuroimage, 31(4), 1536-1548.

68
Biswal, B., DeYoe, A. E., & Hyde, J. S. (1996). Reduction of physiological
fluctuations in fMRI using digital filters. Magnetic Resonance in
Medicine, 35(1), 107-113.
Biswal, B., Yetkin, F. Z., Haughton, V. M., & Hyde, J. S. (1995). Functional
connectivity in the motor cortex of resting human brain using echo-planar
MRI. Magnetic Resonance in Medicine, 34(4), 537-541.
Braak, H., & Braak, E. (1991). Neuropathological stageing of Alzheimer-related
changes. Acta Neuropathol, 82(4), 239-259.
Braak, H., & Braak, E. (1998). Evolution of neuronal changes in the course of
Alzheimer's disease. Journal of Neural Transmission. Supplementum, 53,
127-140.
Braak, H., Braak, E., Bohl, J., & Lang, W. (1989). Alzheimer's disease: amyloid
plaques in the cerebellum. Journal of the Neurological Sciences, 93(2-3),
277-287.
Buckner, R. L., Snyder, A. Z., Shannon, B. J., LaRossa, G., Sachs, R., Fotenos, A.
F., et al. (2005). Molecular, structural, and functional characterization of
Alzheimer's disease: evidence for a relationship between default activity,
amyloid, and memory. Journal of Neuroscience, 25(34), 7709-7717.
Burwell, R. D. (2000). The parahippocampal region: corticocortical connectivity.
Annals of the New York Academy of Sciences, 911, 25-42.
69
Cavanna, A. E., & Trimble, M. R. (2006). The precuneus: a review of its
functional anatomy and behavioural correlates. Brain, 129(Pt 3), 564-583.
Chandler, M. J., Lacritz, L. H., Hynan, L. S., Barnard, H. D., Allen, G., Deschner,
M., et al. (2005). A total score for the CERAD neuropsychological battery.
Neurology, 65(1), 102-106.
Chetelat, G., & Baron, J. C. (2003). Early diagnosis of Alzheimer's disease:
contribution of structural neuroimaging. Neuroimage, 18(2), 525-541.
Clower, D. M., West, R. A., Lynch, J. C., & Strick, P. L. (2001). The inferior
parietal lobule is the target of output from the superior colliculus,
hippocampus, and cerebellum. Journal of Neuroscience, 21(16), 6283-
6291.
Convit, A., de Asis, J., de Leon, M. J., Tarshish, C. Y., De Santi, S., & Rusinek,
H. (2000). Atrophy of the medial occipitotemporal, inferior, and middle
temporal gyri in non-demented elderly predict decline to Alzheimer's
disease. Neurobiology of Aging, 21(1), 19-26.
Cordes, D., Haughton, V. M., Arfanakis, K., Carew, J. D., Turski, P. A., Moritz,
C. H., et al. (2001). Frequencies contributing to functional connectivity in
the cerebral cortex in "resting-state" data. AJNR. American Journal of
Neuroradiology, 22(7), 1326-1333.
Cordes, D., Haughton, V. M., Arfanakis, K., Wendt, G. J., Turski, P. A., Moritz,
C. H., et al. (2000). Mapping functionally related regions of brain with

70
functional connectivity MR imaging. AJNR. American Journal of
Neuroradiology, 21(9), 1636-1644.
Cox, R. W. (1996). AFNI: software for analysis and visualization of functional
magnetic resonance neuroimages. Computers and Biomedical Research,
29(3), 162-173.
Daselaar, S. M., Fleck, M. S., Dobbins, I. G., Madden, D. J., & Cabeza, R. (2006).
Effects of healthy aging on hippocampal and rhinal memory functions: an
event-related fMRI study. Cerebral Cortex, 16(12), 1771-1782.
Davies, C. A., Mann, D. M., Sumpter, P. Q., & Yates, P. O. (1987). A quantitative
morphometric analysis of the neuronal and synaptic content of the frontal
and temporal cortex in patients with Alzheimer's disease. Journal of the
Neurological Sciences, 78(2), 151-164.
De Lacoste, M. C., & White, C. L., 3rd. (1993). The role of cortical connectivity
in Alzheimer's disease pathogenesis: a review and model system.
Neurobiology of Aging, 14(1), 1-16.
deIpolyi, A. R., Rankin, K. P., Mucke, L., Miller, B. L., & Gorno-Tempini, M. L.
(2007). Spatial cognition and the human navigation network in AD and
MCI. Neurology, 69(10), 986-997.
deToledo-Morrell, L., Stoub, T. R., Bulgakova, M., Wilson, R. S., Bennett, D. A.,
Leurgans, S., et al. (2004). MRI-derived entorhinal volume is a good

71
predictor of conversion from MCI to AD. Neurobiology of Aging, 25(9),
1197-1203.
Devanand, D. P., Pradhaban, G., Liu, X., Khandji, A., De Santi, S., Segal, S., et
al. (2007). Hippocampal and entorhinal atrophy in mild cognitive
impairment: prediction of Alzheimer disease. Neurology, 68(11), 828-836.
Dickerson, B. C., Goncharova, I., Sullivan, M. P., Forchetti, C., Wilson, R. S.,
Bennett, D. A., et al. (2001). MRI-derived entorhinal and hippocampal
atrophy in incipient and very mild Alzheimer's disease. Neurobiology of
Aging, 22(5), 747-754.
Du, A. T., Schuff, N., Zhu, X. P., Jagust, W. J., Miller, B. L., Reed, B. R., et al.
(2003). Atrophy rates of entorhinal cortex in AD and normal aging.
Neurology, 60(3), 481-486.
Eichenbaum, H., Yonelinas, A. P., & Ranganath, C. (2007). The medial temporal
lobe and recognition memory. Annual Review of Neuroscience, 30, 123-
152.
Federal Interagency Forum on Aging-Related Statistics (2006). Older Americans
Update 2006: Key indicators of well-being. Washington, DC: U.S.
Government Printing Office.
Folstein, M. F., Folstein, S. E., & McHugh, P. R. (1975). "Mini-mental state". A
practical method for grading the cognitive state of patients for the
clinician. Journal of Psychiatric Research, 12(3), 189-198.
72
Fox, M. D., Corbetta, M., Snyder, A. Z., Vincent, J. L., & Raichle, M. E. (2006).
Spontaneous neuronal activity distinguishes human dorsal and ventral
attention systems. Proceedings of the National Academy of Sciences of the
United States of America, 103(26), 10046-10051.
Fox, M. D., & Raichle, M. E. (2007). Spontaneous fluctuations in brain activity
observed with functional magnetic resonance imaging. Nat Rev Neurosci,
8(9), 700-711.
Fox, M. D., Snyder, A. Z., Vincent, J. L., Corbetta, M., Van Essen, D. C., &
Raichle, M. E. (2005). The human brain is intrinsically organized into
dynamic, anticorrelated functional networks. Proceedings of the National
Academy of Sciences of the United States of America, 102(27), 9673-9678.
Goldman, W. P., Price, J. L., Storandt, M., Grant, E. A., McKeel, D. W., Jr.,
Rubin, E. H., et al. (2001). Absence of cognitive impairment or decline in
preclinical Alzheimer's disease. Neurology, 56(3), 361-367.
Gomez-Isla, T., Price, J. L., McKeel, D. W., Jr., Morris, J. C., Growdon, J. H., &
Hyman, B. T. (1996). Profound loss of layer II entorhinal cortex neurons
occurs in very mild Alzheimer's disease. Journal of Neuroscience, 16(14),
4491-4500.
Goncharova, II, Dickerson, B. C., Stoub, T. R., & deToledo-Morrell, L. (2001).
MRI of human entorhinal cortex: a reliable protocol for volumetric
measurement. Neurobiology of Aging, 22(5), 737-745.

73
Grady, C. L., McIntosh, A. R., Beig, S., Keightley, M. L., Burian, H., & Black, S.
E. (2003). Evidence from functional neuroimaging of a compensatory
prefrontal network in Alzheimer's disease. Journal of Neuroscience, 23(3),
986-993.
Greicius, M. D., Krasnow, B., Reiss, A. L., & Menon, V. (2003). Functional
connectivity in the resting brain: a network analysis of the default mode
hypothesis. Proceedings of the National Academy of Sciences of the
United States of America, 100(1), 253-258.
Greicius, M. D., Srivastava, G., Reiss, A. L., & Menon, V. (2004). Default-mode
network activity distinguishes Alzheimer's disease from healthy aging:
evidence from functional MRI. Proceedings of the National Academy of
Sciences of the United States of America, 101(13), 4637-4642.
Greicius, M. D., Supekar, K., Menon, V., & Dougherty, R. F. (2008). Resting-
State Functional Connectivity Reflects Structural Connectivity in the
Default Mode Network. Cerebral Cortex.
Hafting, T., Fyhn, M., Molden, S., Moser, M. B., & Moser, E. I. (2005).
Microstructure of a spatial map in the entorhinal cortex. Nature,
436(7052), 801-8-6.
He, Y., Wang, L., Zang, Y., Tian, L., Zhang, X., Li, K., et al. (2007). Regional
coherence changes in the early stages of Alzheimer's disease: a combined

74
structural and resting-state functional MRI study. Neuroimage, 35(2), 488-
500.
Heaton, R., Grant, I., & Matthews, C. (1991). Comprehensive norms for an
expanded Halstead-Reitan Battery: Demographic corrections, research
findings, and clinical applications. Odessa: Psychological Assessment
Resources.
Heron, M. (2007). Deaths: Leading causes for 2004. National vital statistics
reports : from the Centers for Disease Control and Prevention, National
Center for Health Statistics, National Vital Statistics System, 56(5), 1-95.
Hertz-Pannier, L., Gaillard, W. D., Mott, S. H., Cuenod, C. A., Bookheimer, S.
Y., Weinstein, S., et al. (1997). Noninvasive assessment of language
dominance in children and adolescents with functional MRI: a preliminary
study. Neurology, 48(4), 1003-1012.
Hines, M., Chiu, L., McAdams, L. A., Bentler, P. M., & Lipcamon, J. (1992).
Cognition and the corpus callosum: verbal fluency, visuospatial ability,
and language lateralization related to midsagittal surface areas of callosal
subregions. Behavioral Neuroscience, 106(1), 3-14.
Hort, J., Laczo, J., Vyhnalek, M., Bojar, M., Bures, J., & Vlcek, K. (2007). Spatial
navigation deficit in amnestic mild cognitive impairment. Proceedings of
the National Academy of Sciences of the United States of America,
104(10), 4042-4047.

75
Horwitz, B., McIntosh, A. R., Haxby, J. V., Furey, M., Salerno, J. A., Schapiro,
M. B., et al. (1995). Network analysis of PET-mapped visual pathways in
Alzheimer type dementia. Neuroreport, 6(17), 2287-2292.
Insausti, R., Juottonen, K., Soininen, H., Insausti, A. M., Partanen, K., Vainio, P.,
et al. (1998). MR volumetric analysis of the human entorhinal, perirhinal,
and temporopolar cortices. AJNR. American Journal of Neuroradiology,
19(4), 659-671.
Insausti, R., Tunon, T., Sobreviela, T., Insausti, A. M., & Gonzalo, L. M. (1995).
The human entorhinal cortex: a cytoarchitectonic analysis. Journal of
Comparative Neurology, 355(2), 171-198.
Kahn, I., Andrews-Hanna, J. R., Vincent, J. L., Snyder, A. Z., & Buckner, R. L.
(2008). Distinct cortical anatomy linked to subregions of the medial
temporal lobe revealed by intrinsic functional connectivity. Journal of
Neurophysiology, 100(1), 129-139.
Karas, G., Sluimer, J., Goekoop, R., van der Flier, W., Rombouts, S. A., Vrenken,
H., et al. (2008). Amnestic mild cognitive impairment: structural MR
imaging findings predictive of conversion to Alzheimer disease. AJNR.
American Journal of Neuroradiology, 29(5), 944-949.
Keller, J. N. (2006). Age-related neuropathology, cognitive decline, and
Alzheimer's disease. Ageing Res Rev, 5(1), 1-13.

76
Kennedy, D. P., & Courchesne, E. (2008). The intrinsic functional organization of
the brain is altered in autism. Neuroimage, 39(4), 1877-1885.
Kerr, K. M., Agster, K. L., Furtak, S. C., & Burwell, R. D. (2007). Functional
neuroanatomy of the parahippocampal region: the lateral and medial
entorhinal areas. Hippocampus, 17(9), 697-708.
Killiany, R. J., Hyman, B. T., Gomez-Isla, T., Moss, M. B., Kikinis, R., Jolesz, F.,
et al. (2002). MRI measures of entorhinal cortex vs hippocampus in
preclinical AD. Neurology, 58(8), 1188-1196.
Li, S. J., Biswal, B., Li, Z., Risinger, R., Rainey, C., Cho, J. K., et al. (2000).
Cocaine administration decreases functional connectivity in human
primary visual and motor cortex as detected by functional MRI. Magnetic
Resonance in Medicine, 43(1), 45-51.
Li, S. J., Li, Z., Wu, G., Zhang, M. J., Franczak, M., & Antuono, P. G. (2002).
Alzheimer Disease: evaluation of a functional MR imaging index as a
marker. Radiology, 225(1), 253-259.
Lowe, M. J., Beall, E. B., Sakaie, K. E., Koenig, K. A., Stone, L., Marrie, R. A.,
et al. (2008). Resting state sensorimotor functional connectivity in
multiple sclerosis inversely correlates with transcallosal motor pathway
transverse diffusivity. Human Brain Mapping.

77
Lowe, M. J., Mock, B. J., & Sorenson, J. A. (1998). Functional connectivity in
single and multislice echoplanar imaging using resting-state fluctuations.
Neuroimage, 7(2), 119-132.
McKhann, G., Drachman, D., Folstein, M., Katzman, R., Price, D., & Stadlan, E.
M. (1984). Clinical diagnosis of Alzheimer's disease: report of the
NINCDS-ADRDA Work Group under the auspices of Department of
Health and Human Services Task Force on Alzheimer's Disease.
Neurology, 34(7), 939-944.
Morris, J. C. (1997). Clinical assessment of Alzheimer's disease. Neurology, 49(3
Suppl 3), S7-10.
Morris, J. C., Heyman, A., Mohs, R. C., Hughes, J. P., van Belle, G., Fillenbaum,
G., et al. (1989). The Consortium to Establish a Registry for Alzheimer's
Disease (CERAD). Part I. Clinical and neuropsychological assessment of
Alzheimer's disease. Neurology, 39(9), 1159-1165.
Murray, E. A., Bussey, T. J., & Saksida, L. M. (2007). Visual perception and
memory: a new view of medial temporal lobe function in primates and
rodents. Annual Review of Neuroscience, 30, 99-122.
Peltier, S. J., & Noll, D. C. (2002). T(2)(*) dependence of low frequency
functional connectivity. Neuroimage, 16(4), 985-992.
Pennanen, C., Kivipelto, M., Tuomainen, S., Hartikainen, P., Hanninen, T.,
Laakso, M. P., et al. (2004). Hippocampus and entorhinal cortex in mild

78
cognitive impairment and early AD. Neurobiology of Aging, 25(3), 303-
310.
Petersen, R. C., Smith, G. E., Waring, S. C., Ivnik, R. J., Tangalos, E. G., &
Kokmen, E. (1999). Mild cognitive impairment: clinical characterization
and outcome. Archives of Neurology, 56(3), 303-308.
Petersen, R. C., Stevens, J. C., Ganguli, M., Tangalos, E. G., Cummings, J. L., &
DeKosky, S. T. (2001). Practice parameter: early detection of dementia:
mild cognitive impairment (an evidence-based review). Report of the
Quality Standards Subcommittee of the American Academy of Neurology.
Neurology, 56(9), 1133-1142.
Plassman, B. L., Langa, K. M., Fisher, G. G., Heeringa, S. G., Weir, D. R.,
Ofstedal, M. B., et al. (2007). Prevalence of dementia in the United States:
the aging, demographics, and memory study. Neuroepidemiology, 29(1-2),
125-132.
Price, J. L., Davis, P. B., Morris, J. C., & White, D. L. (1991). The distribution of
tangles, plaques and related immunohistochemical markers in healthy
aging and Alzheimer's disease. Neurobiology of Aging, 12(4), 295-312.
Pruessner, J. C., Kohler, S., Crane, J., Pruessner, M., Lord, C., Byrne, A., et al.
(2002). Volumetry of temporopolar, perirhinal, entorhinal and
parahippocampal cortex from high-resolution MR images: considering the
variability of the collateral sulcus. Cerebral Cortex, 12(12), 1342-1353.
79
Raichle, M. E., MacLeod, A. M., Snyder, A. Z., Powers, W. J., Gusnard, D. A., &
Shulman, G. L. (2001). A default mode of brain function. Proceedings of
the National Academy of Sciences of the United States of America, 98(2),
676-682.
Ranginwala, N. A., Hynan, L. S., Weiner, M. F., & White, C. L., 3rd. (2008).
Clinical criteria for the diagnosis of Alzheimer disease: still good after all
these years. American Journal of Geriatric Psychiatry, 16(5), 384-388.
Raz, N., Rodrigue, K. M., Head, D., Kennedy, K. M., & Acker, J. D. (2004).
Differential aging of the medial temporal lobe: a study of a five-year
change. Neurology, 62(3), 433-438.
Reitan, R., & Wolfson, D. (1993). The Halstead-Reitan Neuropsychological Test
Battery: Theory and Clinical Interpretation (2nd ed.). Tucson, AZ:
Neuropsychology Press.
Rodrigue, K. M., & Raz, N. (2004). Shrinkage of the entorhinal cortex over five
years predicts memory performance in healthy adults. Journal of
Neuroscience, 24(4), 956-963.
Rombouts, S. A., Stam, C. J., Kuijer, J. P., Scheltens, P., & Barkhof, F. (2003).
Identifying confounds to increase specificity during a "no task condition".
Evidence for hippocampal hile this may place some limits on tconnectivity
using fMRI. Neuroimage, 20(2), 1236-1245.

80
Salmon, D. P., Thomas, R. G., Pay, M. M., Booth, A., Hofstetter, C. R., Thal, L.
J., et al. (2002). Alzheimer's disease can be accurately diagnosed in very
mildly impaired individuals. Neurology, 59(7), 1022-1028.
Scoville, W. B., & Milner, B. (1957). Loss of recent memory after bilateral
hippocampal lesions. Journal of Neurology, Neurosurgery and Psychiatry,
20(1), 11-21.
Selkoe, D. J. (2002). Alzheimer's disease is a synaptic failure. Science, 298(5594),
789-791.
Slavin, M. J., Sandstrom, C. K., Tran, T. T., Doraiswamy, P. M., & Petrella, J. R.
(2007). Hippocampal volume and the Mini-Mental State Examination in
the diagnosis of amnestic mild cognitive impairment. AJR. American
Journal of Roentgenology, 188(5), 1404-1410.
Small, S. A., Tsai, W. Y., DeLaPaz, R., Mayeux, R., & Stern, Y. (2002). Imaging
hippocampal function across the human life span: is memory decline
normal or not? Annals of Neurology, 51(3), 290-295.
Smith, A. M., Lewis, B. K., Ruttimann, U. E., Ye, F. Q., Sinnwell, T. M., Yang,
Y., et al. (1999). Investigation of low frequency drift in fMRI signal.
Neuroimage, 9(5), 526-533.
Squire, L. R., Stark, C. E., & Clark, R. E. (2004). The medial temporal lobe.
Annual Review of Neuroscience, 27, 279-306.

81
Squire, L. R., & Zola-Morgan, S. (1991). The medial temporal lobe memory
system. Science, 253(5026), 1380-1386.
Stark, C. E., Bayley, P. J., & Squire, L. R. (2002). Recognition memory for single
items and for associations is similarly impaired following damage to the
hippocampal region. Learning and Memory, 9(5), 238-242.
Talairach, J., & Tournoux, P. (1993). Referentially Oriented Cerebral MRI
Anatomy, Atlas of Stereotaxic Anatomical Correlations for Gray and
White Matter. New York, Thieme Medical Publishers, Inc.
Turner, K. C., Frost, L., Linsenbardt, D., McIlroy, J. R., & Muller, R. A. (2006).
Atypically diffuse functional connectivity between caudate nuclei and
cerebral cortex in autism. Behav Brain Funct, 2, 34.
Uddin, L. Q., Kelly, A. M., Biswal, B. B., Margulies, D. S., Shehzad, Z., Shaw,
D., et al. (2008). Network homogeneity reveals decreased integrity of
default-mode network in ADHD. Journal of Neuroscience Methods,
169(1), 249-254.
Vincent, J. L., Snyder, A. Z., Fox, M. D., Shannon, B. J., Andrews, J. R., Raichle,
M. E., et al. (2006). Coherent spontaneous activity identifies a
hippocampal-parietal memory network. Journal of Neurophysiology,
96(6), 3517-3531.

82
Wang, K., Liang, M., Wang, L., Tian, L., Zhang, X., Li, K., et al. (2007). Altered
functional connectivity in early Alzheimer's disease: a resting-state fMRI
study. Human Brain Mapping, 28(10), 967-978.
Wang, L., Zang, Y., He, Y., Liang, M., Zhang, X., Tian, L., et al. (2006). Changes
in hippocampal connectivity in the early stages of Alzheimer's disease:
evidence from resting state fMRI. Neuroimage, 31(2), 496-504.
Wechsler, D. (1987). Wechsler Memory Scale-Revised (WMS-R). San Antonio:
The Psychological Corporation.
Wechsler, D. (1987). Wechsler Adult Intelligence Scale-Revised (WAIS-R). San
Antonio: The Psychological Corporation.
Welsh, K. A., Butters, N., Mohs, R. C., Beekly, D., Edland, S., Fillenbaum, G., et
al. (1994). The Consortium to Establish a Registry for Alzheimer's
Disease (CERAD). Part V. A normative study of the neuropsychological
battery. Neurology, 44(4), 609-614.
Welsh-Bohmer, K., & Warren, L. (2006). Neurodegenerative dementias. In D.
Attix & K. Welsh-Bohmer (Eds.), Geriatric neuropsychology: Assessment
and intervention (pp. 56-88). New York: The Guilford Press.
Whitehouse, P. J., Price, D. L., Struble, R. G., Clark, A. W., Coyle, J. T., &
Delon, M. R. (1982). Alzheimer's disease and senile dementia: loss of
neurons in the basal forebrain. Science, 215(4537), 1237-1239.

83
Whitwell, J. L., Petersen, R. C., Negash, S., Weigand, S. D., Kantarci, K., Ivnik,
R. J., et al. (2007). Patterns of atrophy differ among specific subtypes of
mild cognitive impairment. Archives of Neurology, 64(8), 1130-1138.
Wierenga, C. E., & Bondi, M. W. (2007). Use of functional magnetic resonance
imaging in the early identification of Alzheimer's disease.
Neuropsychology Review, 17(2), 127-143.
Wise, R. G., Ide, K., Poulin, M. J., & Tracey, I. (2004). Resting fluctuations in
arterial carbon dioxide induce significant low frequency variations in
BOLD signal. Neuroimage, 21(4), 1652-1664.
Witter, M. P. (2007). The perforant path: projections from the entorhinal cortex to
the dentate gyrus. Progress in Brain Research, 163, 43-61.
Witter, M. P., & Moser, E. I. (2006). Spatial representation and the architecture of
the entorhinal cortex. Trends in Neurosciences, 29(12), 671-678.
Witter, M. P., Wouterlood, F. G., Naber, P. A., & Van Haeften, T. (2000).
Anatomical organization of the parahippocampal-hippocampal network.
Annals of the New York Academy of Sciences, 911, 1-24.
Xu, Y., Jack, C. R., Jr., O'Brien, P. C., Kokmen, E., Smith, G. E., Ivnik, R. J., et
al. (2000). Usefulness of MRI measures of entorhinal cortex versus
hippocampus in AD. Neurology, 54(9), 1760-1767.
Yetkin, F. Z., Rosenberg, R. N., Weiner, M. F., Purdy, P. D., & Cullum, C. M.
(2006). FMRI of working memory in patients with mild cognitive
84
impairment and probable Alzheimer's disease. European Radiology, 16(1),
193-206.
Yonelinas, A. P., Widaman, K., Mungas, D., Reed, B., Weiner, M. W., & Chui,
H. C. (2007). Memory in the aging brain: doubly dissociating the
contribution of the hippocampus and entorhinal cortex. Hippocampus,
17(11), 1134-1140.


![EADC-ADNI HARMONIZED PROTOCOL FOR MANUAL … · Reference information relative to the entorhinal/perirhinal cortex was taken from [5]. Additional material is available at . Individual](https://static.fdocuments.net/doc/165x107/5f50c4a212fdc94da604af63/eadc-adni-harmonized-protocol-for-manual-reference-information-relative-to-the-entorhinalperirhinal.jpg)