Functional Brain Signal Processing: EEG & fMRI Lesson 15
19
Functional Brain Signal Processing: EEG & fMRI Lesson 15 Kaushik Majumdar Indian Statistical Institute Bangalore Center [email protected] .in M.Tech. (CS), Semester III, Course B50
-
Upload
hashim-reed -
Category
Documents
-
view
67 -
download
0
description
M.Tech. (CS), Semester III, Course B50. Functional Brain Signal Processing: EEG & fMRI Lesson 15. Kaushik Majumdar Indian Statistical Institute Bangalore Center [email protected]. Poldrack et al., 2011, Section 6.1. Group Statistics: An Example. Fixed Effect vs. Mixed Effect Model. - PowerPoint PPT Presentation
Transcript of Functional Brain Signal Processing: EEG & fMRI Lesson 15

Functional Brain Signal Processing: EEG & fMRI
Lesson 15
Kaushik Majumdar
Indian Statistical Institute Bangalore Center
M.Tech. (CS), Semester III, Course B50
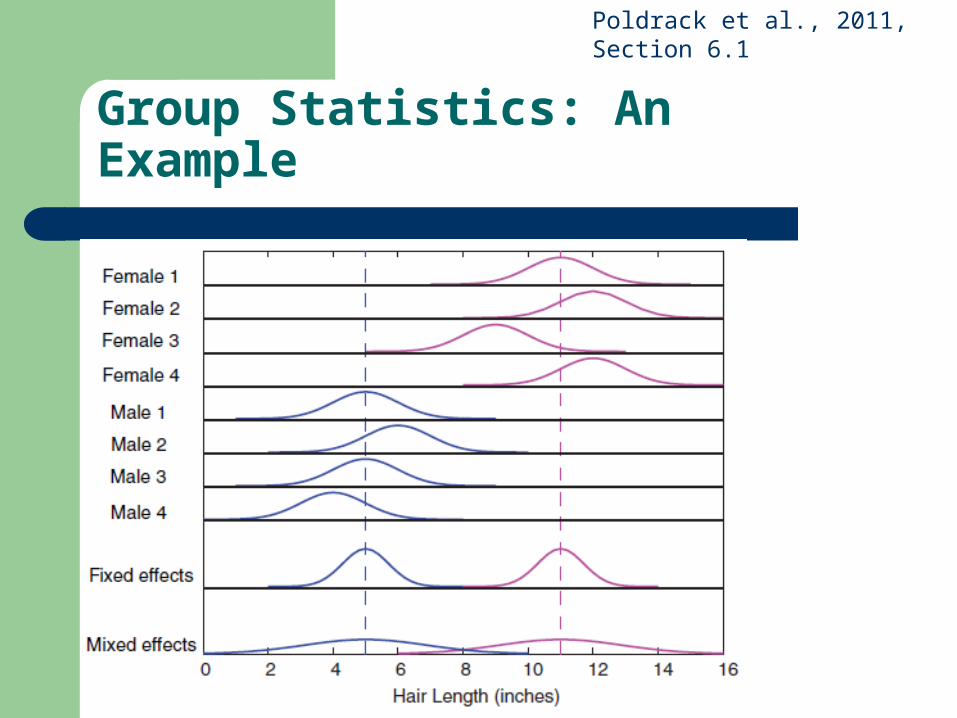
Group Statistics: An Example
Poldrack et al., 2011, Section 6.1

Fixed Effect vs. Mixed Effect Model
2 210.25
4FFX w is fixed effect variance in average hair length in a gender group. is within group variance, which is assumed to be 1 here.
FFXw
2 22 1 49
12.54 4 4 4w B
MFX
is the average mixed effect variance, where is the between the groups variance.
MFXB
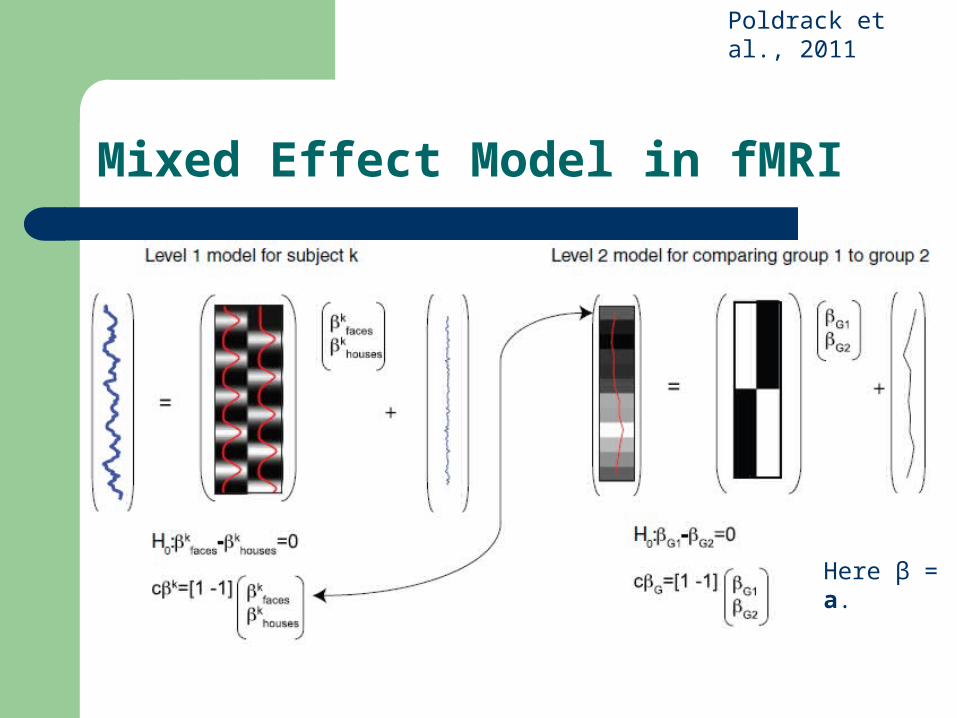
Mixed Effect Model in fMRI
Poldrack et al., 2011
Here β = a.
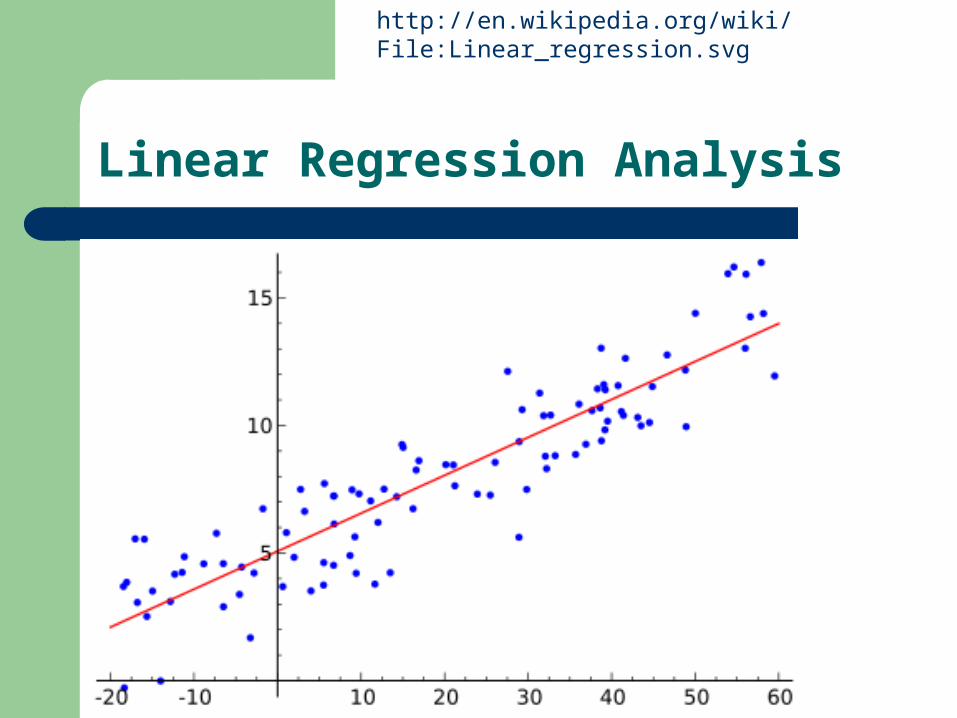
Linear Regression Analysis
http://en.wikipedia.org/wiki/File:Linear_regression.svg
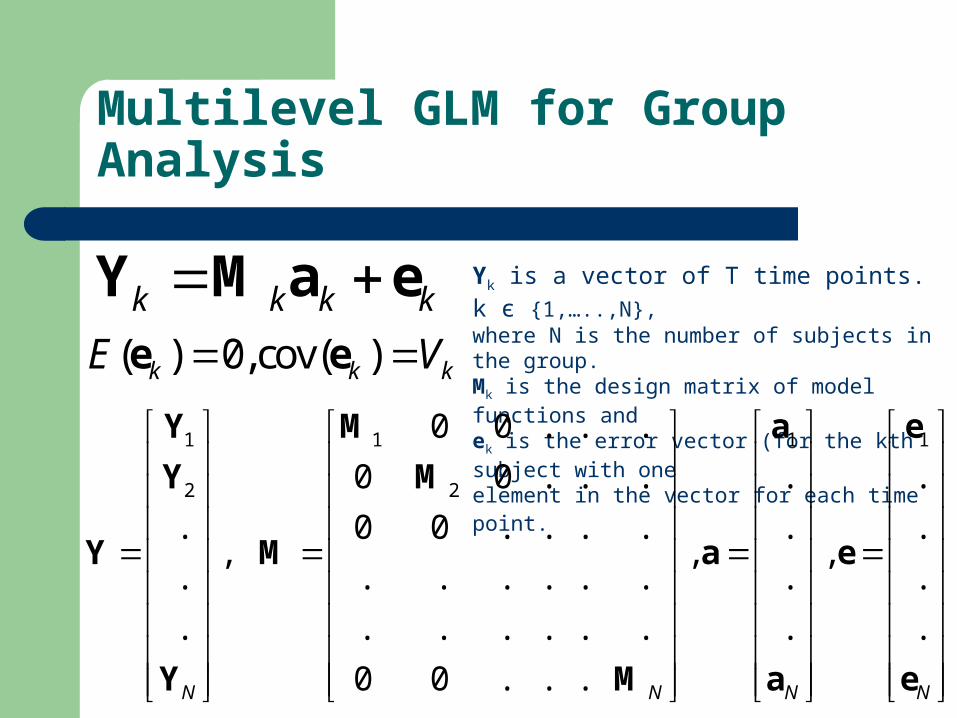
Multilevel GLM for Group Analysis
k k k k Y M a e Yk is a vector of T time points. k є {1,…..,N},
where N is the number of subjects in the group.Mk is the design matrix of model functions andek is the error vector (for the kth subject with one
element in the vector for each time point. ( ) 0,cov( )k k kE V e e
1 1 1 1
2 2
0 0 . . .
0 0 . . . . .
. 0 0 . . . . . ., , ,
. . . . . . . . .
. . . . . . . . .
0 0 . . .N N N N
Y M a e
Y M
Y M a e
Y M a e
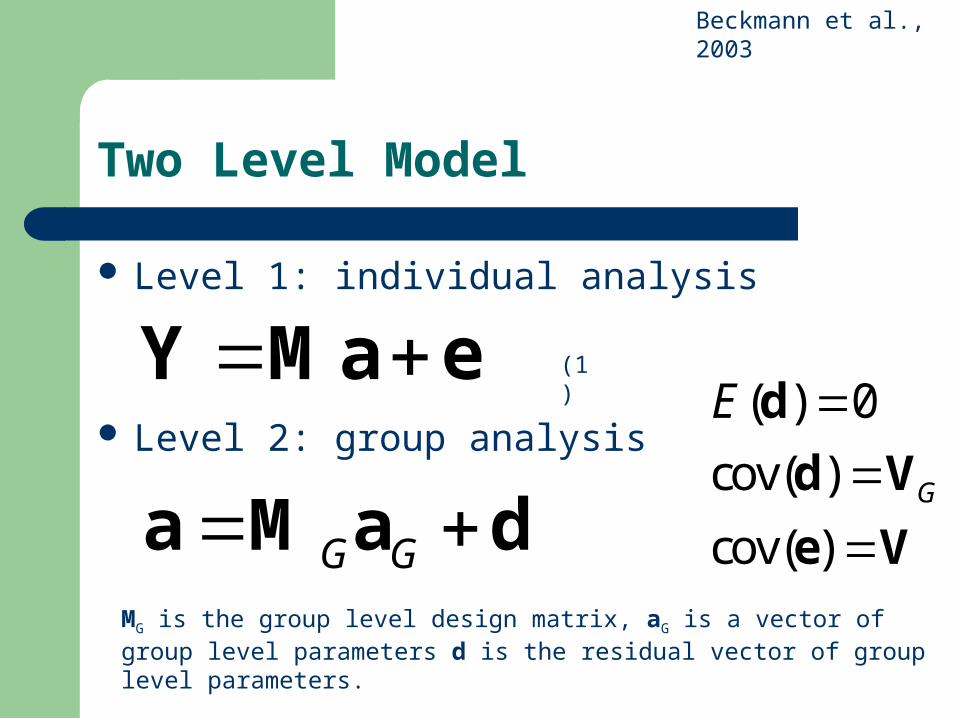
Two Level Model
Level 1: individual analysis
Level 2: group analysis
Y Ma e
G G a M a dMG is the group level design matrix, aG is a vector of group level parameters d is the residual vector of group level parameters.
( ) 0
cov( )
cov( )G
E
d
d V
e V
Beckmann et al., 2003
(1)
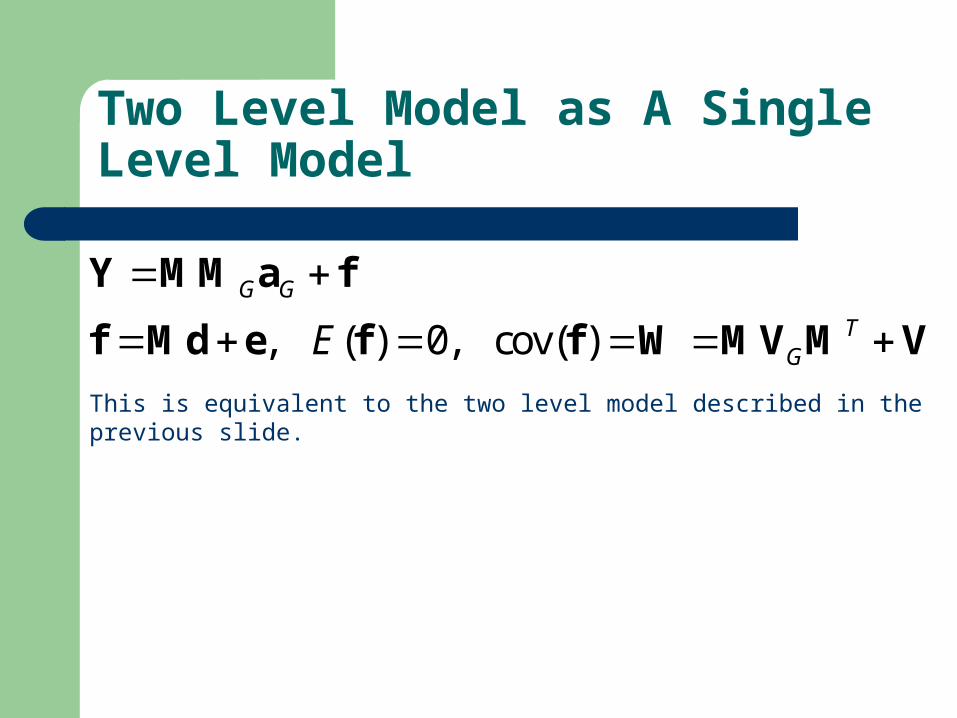
Two Level Model as A Single Level Model
, ( ) 0, cov( )
G G
TGE
Y MM a f
f Md e f f W MV M V
This is equivalent to the two level model described in the previous slide.
Parameter Estimation at Two Levels
Linear spaces generated by the columns of M and MTM are the same (Rao, 1974, p. 222).
Proof: Let λ be an eigenvalue of M. Then there is an eigenvector v such that Mv = λv or M = λI MT = λI. So, MTMv = MTλv = λ2v. In other words M and MTM have same eigenvectors and therefore generate the same eigen space.
Parameter Estimation (cont)
In general Y = Ma may be inconsistent (may not have unique solution), but MTMa = MTY always has a unique solution in a, because MTY is in the space generated by columns of MTM. Let â be a solution of MTMa = MTY, then (Y – Ma)T(Y – Ma) = [Y – Mâ + M(â – a)]T[Y – Mâ + M(â – a)] = (Y – Mâ)T(Y – Mâ) + (â – a)TMTM(â – a) ≥ (Y – Mâ)T(Y – Mâ).
This shows that the minimum of (Y – Ma)T(Y – Ma) is (Y – Mâ)T(Y – Mâ) and is attained for
Parameter Estimation (cont)
a = â, which is unique for all solutions â of MTMa = MTY.

Solution for Two Level GL Model
1 1 1
2 1 1
ˆ ( )
ˆ ˆ ( )
T T
T T
a M V M M V Y
aa M V M For individual.
1 1 1
2 1 1
ˆ ˆ( )
ˆ ˆ ( )
T TG G G G G G
T TG G G G G G
a M V M M M a
a a M V M For group.
1ˆ ˆ
G G a M a f This together with (1) gives the second level estimation of the parameters.
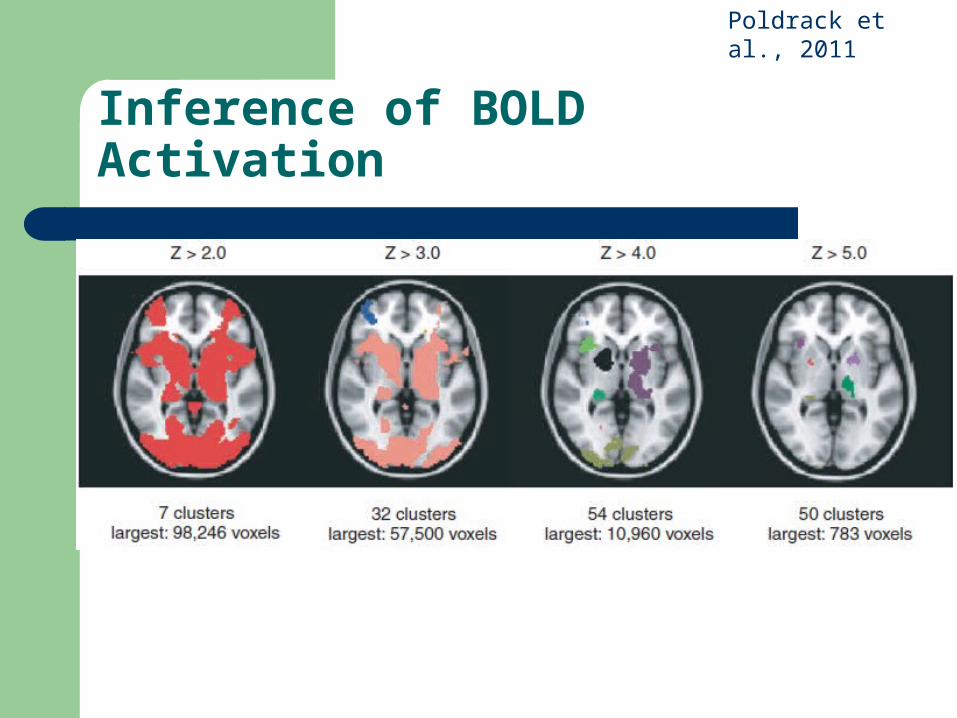
Inference of BOLD Activation
Poldrack et al., 2011
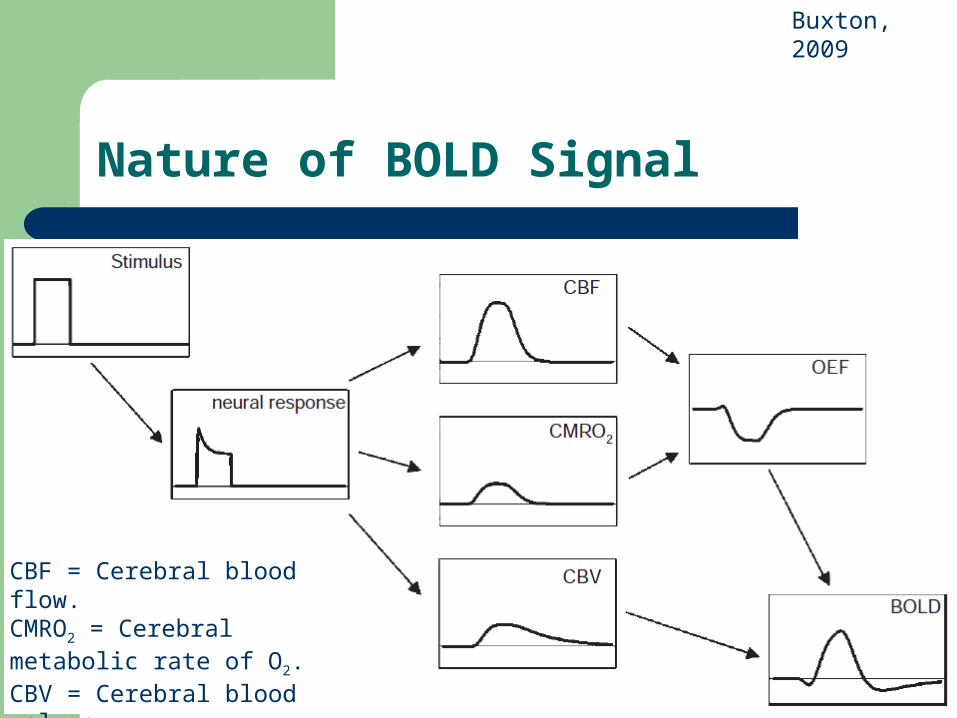
Nature of BOLD Signal
Buxton, 2009
CBF = Cerebral blood flow.CMRO2 = Cerebral metabolic rate of O2.CBV = Cerebral blood volume.
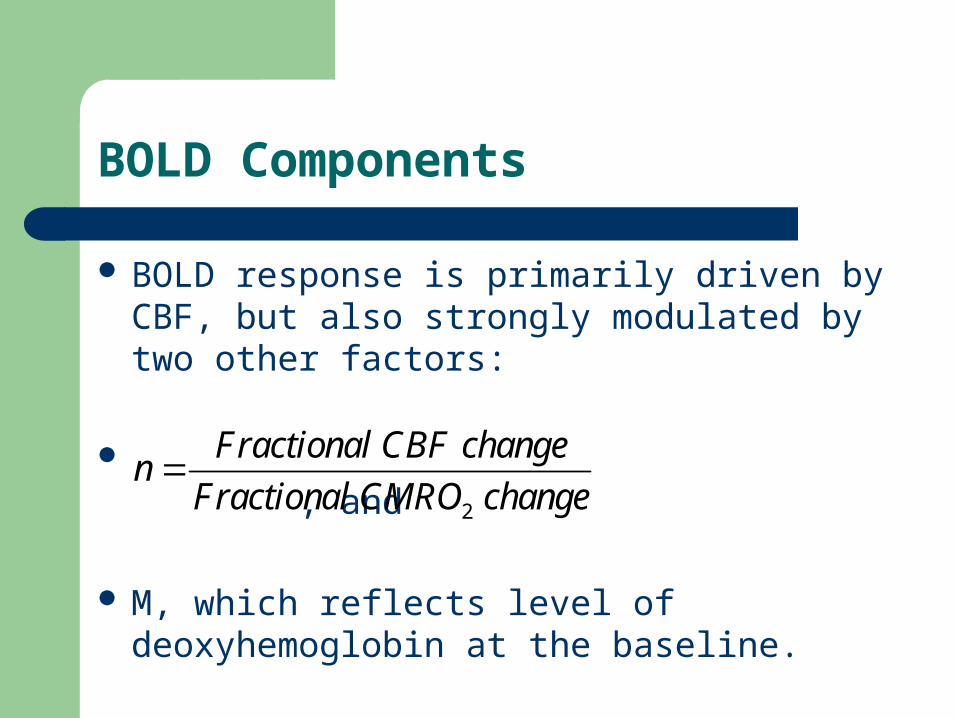
BOLD Components
BOLD response is primarily driven by CBF, but also strongly modulated by two other factors:
, and
M, which reflects level of deoxyhemoglobin at the baseline.
2
Fractional CBF changen
Fractional CMRO change
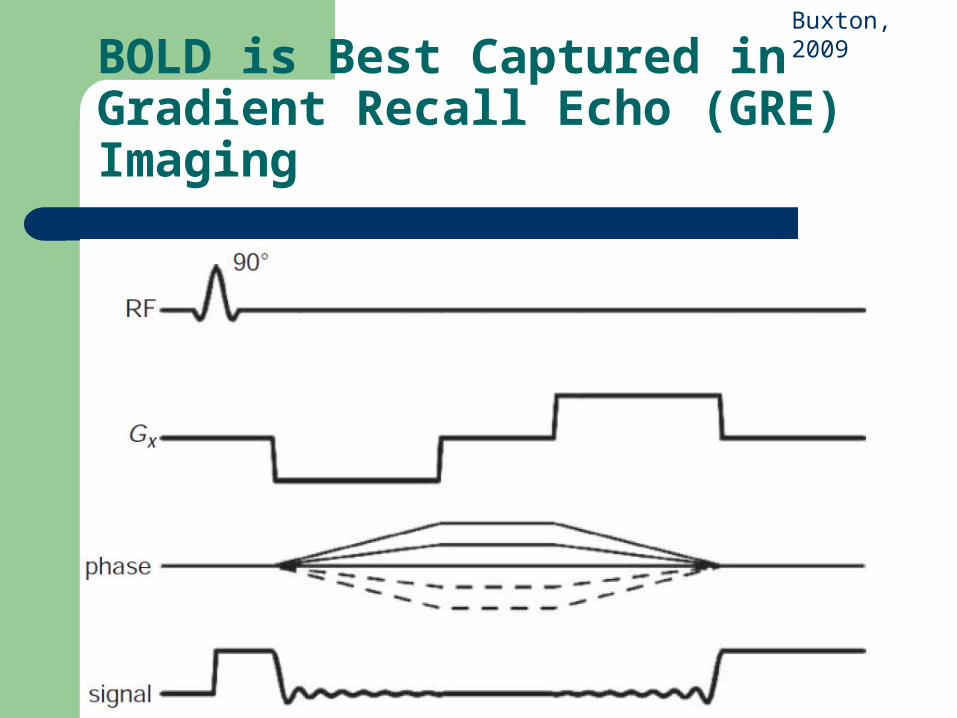
BOLD is Best Captured in Gradient Recall Echo (GRE) Imaging
Buxton, 2009
References
R. A. Poldrack, J. A. Mumford and T. E. Nichols, Handbook of Functional MRI Data Analysis, Cambridge University Press, Cambridge, New York, 2011. Chapter 6.
C. F. Beckmann, M. Jenkinson and S. M. Smith, General multilevel linear modeling for group analysis in fMRI, NeuroImage, 20: 1052 – 1063, 2003.

References (cont)
C. R. Rao, Linear Statistical Inference and Its Applications, 2e, Wiley Eastern Ltd., New Delhi, 1974, Chapter 4 (Theory of least squares and analysis of variance).
THANK YOU
This lecture is available at http://www.isibang.ac.in/~kaushik