FullPaper IWA 9324 Recycling of Refinery and Petrochemical Effluents Employing Advanced Multi...
9
(Initial page layout) Recycling of refinery and petrochemical effluents employing advanced multi-barrier systems J. Lahnsteiner*, P. Andrade** and R. D. Mittal*** *VA TECH WABAG GmbH, Dresdner Strasse 87-91, 1200 Vienna, Austria (E-mail: [email protected] ) **VA TECH WABAG Ltd, Bhakti Plaza, 2nd Floor, Aundh - 411007, Pune, India (E-mail: [email protected]) *** VA TECH WABAG Ltd, 11, Murray´s Gate Road, Alwarpet, Chennai 600 018, India (E-mail: [email protected]) Abstract The Indian Oil Corporation Ltd. Panipat had to build two water reclamation plants as a response to the demands of the environmental authorities. The plants, which treat secondary refinery and various refinery/petrochemical process effluents, were commissioned in 2006 and 2010 respectively. Advanced multi-barrier systems (including ultrafiltration and reverse osmosis) have been employed in order to meet the stringent quality requirements for the recycling of boiler make- up water. Excellent results with regard to the removal of the major parameters such as total dissolved solids (TDS) and silica have been accomplished, e.g. silica is mainly removed by RO (from 11.6 mg/L in the UF outlet to 0.09 mg/L in the RO permeate (99.2 % removal)) and is then reduced further to 0.007 mg/L (7 μg/L; total removal 99.94 %) in the mixed bed ion exchanger (20 μg/L is the specified limit for boiler make-up water in various power plant guidelines). Both UF process units have shown relatively good performance. The older UF has been in operation for more than five years with still acceptable permeability values and a relatively low number of fibre breakages. Keywords Water recycling, refinery effluents, ultrafiltration, reverse osmosis, boiler make-up water INTRODUCTION On January 31, 2012 India´s Ministry of Water Resources announced a new draft water policy (GWI, 2012). This document includes a set of provisions (national Water Framework Law, etc.), which if finally implemented, will cause a “quantum leap” in Indian water management. Subsidies and incentives are foreseen for the industrial sector in order to encourage water recycling and reuse. This will further promote industrial water reclamation, which in several special cases was already implemented in the middle of the last decade. In this context, industrial water recycling and reuse in Chennai the capital city of the state of Tamil Nadu is worthy of mention as a prime example. In this water-stressed city, reclaimed water (from secondary municipal effluent and internal effluents) is reused or recycled by industrial companies such as Chennai Petroleum Corporation Ltd (CPCL), Madras Fertilizer Ltd and Manali Petro Chemicals (Lahnsteiner 2010). The reason for reuse and recycling is the chronic water shortage in the Chennai metropolitan area, i.e. all available sources including seawater desalination have to be employed. Furthermore, it must be mentioned that whenever there is a drought, the authorities first cut off industry from the public water supply. Another example is reclamation and recycling at the Indian Oil Corporation Ltd. (IOCL) refinery in the seaport town of Paradip, which is located on the Bay of Bengal in the state of Orissa. The major reason for recycling in this case is that reclaimed water is cheaper than seawater desalination. The reclamation plant employs an advanced multi-barrier system (including UF and RO) with a design capacity of 26,500 m 3 /day (reclaimed water, i.e. RO permeate) and will become operative in the second half of 2012. Apart from the reclamation plant, the overall wastewater management system includes the pre-treatment of different refinery effluents (e.g. wet air oxidation of spent caustic
-
Upload
ankit-kadam -
Category
Documents
-
view
219 -
download
4
Transcript of FullPaper IWA 9324 Recycling of Refinery and Petrochemical Effluents Employing Advanced Multi...

(Initial page layout)
Recycling of refinery and petrochemical effluents employing
advanced multi-barrier systems J. Lahnsteiner*, P. Andrade** and R. D. Mittal***
*VA TECH WABAG GmbH, Dresdner Strasse 87-91, 1200 Vienna, Austria (E-mail: [email protected]) **VA TECH WABAG Ltd, Bhakti Plaza, 2nd Floor, Aundh - 411007, Pune, India (E-mail: [email protected]) *** VA TECH WABAG Ltd, 11, Murray´s Gate Road, Alwarpet, Chennai 600 018, India
(E-mail: [email protected])
Abstract The Indian Oil Corporation Ltd. Panipat had to build two water reclamation plants as a response to
the demands of the environmental authorities. The plants, which treat secondary refinery and various refinery/petrochemical process effluents, were commissioned in 2006 and 2010
respectively. Advanced multi-barrier systems (including ultrafiltration and reverse osmosis) have been employed in order to meet the stringent quality requirements for the recycling of boiler make-up water. Excellent results with regard to the removal of the major parameters such as total dissolved solids (TDS) and silica have been accomplished, e.g. silica is mainly removed by RO (from 11.6 mg/L in the UF outlet to 0.09 mg/L in the RO permeate (99.2 % removal)) and is then
reduced further to 0.007 mg/L (7 µg/L; total removal 99.94 %) in the mixed bed ion exchanger (20 µg/L is the specified limit for boiler make-up water in various power plant guidelines). Both UF process units have shown relatively good performance. The older UF has been in operation for
more than five years with still acceptable permeability values and a relatively low number of fibre breakages.
Keywords
Water recycling, refinery effluents, ultrafiltration, reverse osmosis, boiler make-up water
INTRODUCTION On January 31, 2012 India´s Ministry of Water Resources announced a new draft water policy
(GWI, 2012). This document includes a set of provisions (national Water Framework Law, etc.), which if finally implemented, will cause a “quantum leap” in Indian water management. Subsidies and incentives are foreseen for the industrial sector in order to encourage water recycling and reuse.
This will further promote industrial water reclamation, which in several special cases was already implemented in the middle of the last decade.
In this context, industrial water recycling and reuse in Chennai the capital city of the state of Tamil
Nadu is worthy of mention as a prime example. In this water-stressed city, reclaimed water (from secondary municipal effluent and internal effluents) is reused or recycled by industrial companies such as Chennai Petroleum Corporation Ltd (CPCL), Madras Fertilizer Ltd and Manali Petro
Chemicals (Lahnsteiner 2010). The reason for reuse and recycling is the chronic water shortage in the Chennai metropolitan area, i.e. all available sources including seawater desalination have to be employed. Furthermore, it must be mentioned that whenever there is a drought, the authorities first cut off industry from the public water supply.
Another example is reclamation and recycling at the Indian Oil Corporation Ltd. (IOCL) refinery in the seaport town of Paradip, which is located on the Bay of Bengal in the state of Orissa. The major
reason for recycling in this case is that reclaimed water is cheaper than seawater desalination. The reclamation plant employs an advanced multi-barrier system (including UF and RO) with a design capacity of 26,500 m3/day (reclaimed water, i.e. RO permeate) and will become operative in the
second half of 2012. Apart from the reclamation plant, the overall wastewater management system includes the pre-treatment of different refinery effluents (e.g. wet air oxidation of spent caustic

soda), secondary biological treatment and the treatment of RO brine (removal of recalcitrant COD)
by PAC adsorption.
In this paper, recycling plants at the IOCL Panipat refinery and petrochemical complex are presented and compared. The original Panipat refinery (6 million metric tons per annum [MMTPA])
was commissioned in 1998 and the refinery expansion (doubling of refining capacity) commissioned in 2006. This expansion also included the petrochemical production of paraxylene (PX) and purified terephtalic acid (PTA), which form the basis for producing polyester staple fibres,
polyester filament yarns and other resins. The Panipat Refinery Expansion Water Reclamation Plant (PRE-WRP), which treats both secondary refinery effluents and various refinery/petrochemical process effluents, was commissioned at the end of 2006. In 2009 the refinery was further expanded to 15 MMTPA. The naphtha cracker and its downstream polymer units (Naphtha Cracker Complex)
were commissioned in 2010. The Panipat Naphtha Cracker Water Reclamation Plant (PNC-WRP), which is virtually identical with the PRE-WRP (practically the same process and hydraulic capacity but with a different RO design) and reclaims process water from naphtha cracker secondary
effluent, cooling tower blow-downs and demineralisation regenerates, went on-line in June 2010.
IOCL is India’s largest commercial enterprise and was ranked 125th on the Fortune Global 500 list in 2010. It owns and operates ten of India’s 19 refineries with a combined refining capacity of 65.7
million metric tons per annum (MMTPA).
Panipat is located in Haryana State, 90 km northwest of Delhi. Annual precipitation totals approx.
500 mm, but over 70 % of this rainfall occurs during the monsoon months of July to September. Nevertheless, there is practically no water shortage in the Panipat region due to the availability of sufficient surface water (river water). The Panipat Refinery is located in farmland irrigated by the
Yamuna canal, which is used mainly for potable water production and agricultural irrigation and thus cannot be employed as a recipient. Therefore, rather than due to a lack of water for industrial use, reclamation plants have been installed to meet stringent governmental regulations (zero liquid discharge in the mid-term) and prevent the pollution of nearby water bodies. Water losses during
the refining processes are compensated for by fresh water from the Yamuna canal. The reclamation of secondary municipal effluent was not considered due to the availability of sufficient volumes of fresh water, the distance between the municipal sewage treatment plant and the refinery, and the
installation of zero liquid discharge facilities in the mid-term.
METHODOLOGY
In both cases, advanced multi-barrier systems have been utilised in order to meet the strict quality requirements for the recycling as boiler make-up water. As mentioned above, both reclamation plants are located at the Panipat Refinery and Petrochemical Complex, VA TECH WABAG India
having been commissioned with their construction, operation and surveillance. The following represents a description of the two cases.
The different wastewater streams treated in the reclamation plants (PRE-WRP and PNC-WRP) are shown in Table 1.

Table 1 Panipat Refinery and Naphtha Cracker Plant - Wastewater Streams
Reclamation Plants – Flow
Wastewater Streams Unit PRE-WRP PNC-WRP
Secondary refinery effluent - ETP I m3/h 400
Secondary refinery effluent - ETP II1)
PX2)/PTA3) effluent including cooling tower blow-down
Demineralisation regenerate from Panipat Refinery I Demineralisation regenerate from Panipat Refinery II1) Cooling tower blow-down from in-house power plant I Cooling tower blow-down from in-house power plant II1)
Secondary naphtha cracker effluent - ETP Cooling tower 1 blow down – NCU4)
Cooling tower 2 blow down - Polymer Cooling tower 3 blow down - CPP5) Blow down from CPP boiler CPU6) wastewater (intermittent)
m3/h m3/h
m3/h
m3/h m3/h m3/h
m3/h m3/h
m3/h
m3/h m3/h m3/h
300 272
60 140 18 50
150 308
253 130 15 45
1)Expansion of refinery; 2)PX…Para-Xylene; 3)PTA...Purified Terephtalic Acid; 4) NCU…Naphtha Cracker Unit; 5)
CPP…Cogeneration Power Plant; 6)
CPU…Condensate Polishing Unit
The major design parameters of the blended wastewater flows (inlet to the reclamation plants) are
shown in Table 2.
Table 2 Design Parameters of PRE-WRP and PNC-WRP
Water Reclamation Plants
Parameter Unit PRE_RP PNC_RP
T °C 15-35 25 TDS
Silica COD
BOD5
mg/L
mg/L mg/L mg/L
1,786
98 150 10
800
100 125 10
Oil mg/L 10 5 Q m3/h 900 871
Basically, the reclamation plants (design capacity = 900 for PRE-WRP and 871 m3/h for PNC-
WRP) incorporate high rate clarification, pressure sand filtration, ultrafiltration (UF) and reverse osmosis (RO) phases. The RO permeate is polished by mixed bed ion exchange filters and is then mostly recycled as boiler make-up water for the refinery and naphtha cracker power plants. Figure 1
shows the process flow diagram, which is more or less representative for both reclamation plants. The major difference is in the RO design (three stages in PRE-WRP, two stages in PNC-WRP). Figure 2 shows the PRE-WRP process units high rate clarification (left), as well as sand filtration
and mixed bed ion-exchanger (right).

Figure 1 Water reclamation and recycling process diagram
Figure 2 High rate clarifier (left), sand filtration and mixed bed ion
Figure 3 shows a 3D drawing of the PRE
osmosis and mixed bed ion exchanger, which are contained in a building (theas can be seen above in the open air).
Figure 3 3D PRE-WRP representation
Water reclamation and recycling process diagram – PRE-WRP
High rate clarifier (left), sand filtration and mixed bed ion-exchanger (right)
Figure 3 shows a 3D drawing of the PRE-WRP process steps sand filtration, ultrafiltration, reverse
osmosis and mixed bed ion exchanger, which are contained in a building (the high rate clarifiers are as can be seen above in the open air).
WRP representation
exchanger (right)
WRP process steps sand filtration, ultrafiltration, reverse
high rate clarifiers are

Membrane process steps in both plants
The same UF and RO membranes are employed in both plants. The ultrafiltration process steps consist of pressure-driven, inside-out, hollow fibre systems (X-Flow Xiga; Table 3). Both systems are operated in a dead-end mode. The major task of the UF is to reduce the silt density index (SDI) and remove turbidity, as well as suspended and colloidal matter, in order to minimise fouling of the
downstream reverse osmosis process step. The UF membrane fouling caused by the aforementioned impurities is removed by regular backwashing with permeate. The backwash is enhanced once a day in both UF plants using chemicals (chemical enhanced backwash - CEB with caustic NaOCl
and HCl). As can be seen in Table 3, both UF systems were designed with a comparable flux (46
L/m2·h resp. 44 L/m
2·h net flux). The resulting membrane areas are 16,416 m
2 for the PRE-WRP
UF and 17,280 m2 for the PNC-WRP UF. The retentate of the PRE-WRP UF process step is recycled to the equalisation tanks (feed collection tanks) upstream of the pre-treatment stages of the
reclamation plant. The retentate of the PNC-WRP UF is reused in the fire fighting water system together with the dual media filter backwash water, the RO II brine and the mixed bed ion-exchanger regenerate.
Table 3 Ultrafiltration design parameters
Membrane parameters PRE-WRP PNC-WRP
Membrane material Hollow fibre polyether-sulfone Hollow fibre polyether-sulfone
Average feed flow [m3/h] 894 870
Design gross flux [L/m2·h] 54 50
Design permeate flow [m³/h] 760 766
Design net flux [L/m2·h] 46 44
Recovery [%] 85 88
Skids 6 (+ 1 standby) 6 (+ 1 standby)
Pressure vessels/skid 18 18
Vessels total 108 108
Elements/vessel 4 4
Elements total 432 432
Membrane area/element [m2] 38 40
Membrane area [m2] 16,416 17,280
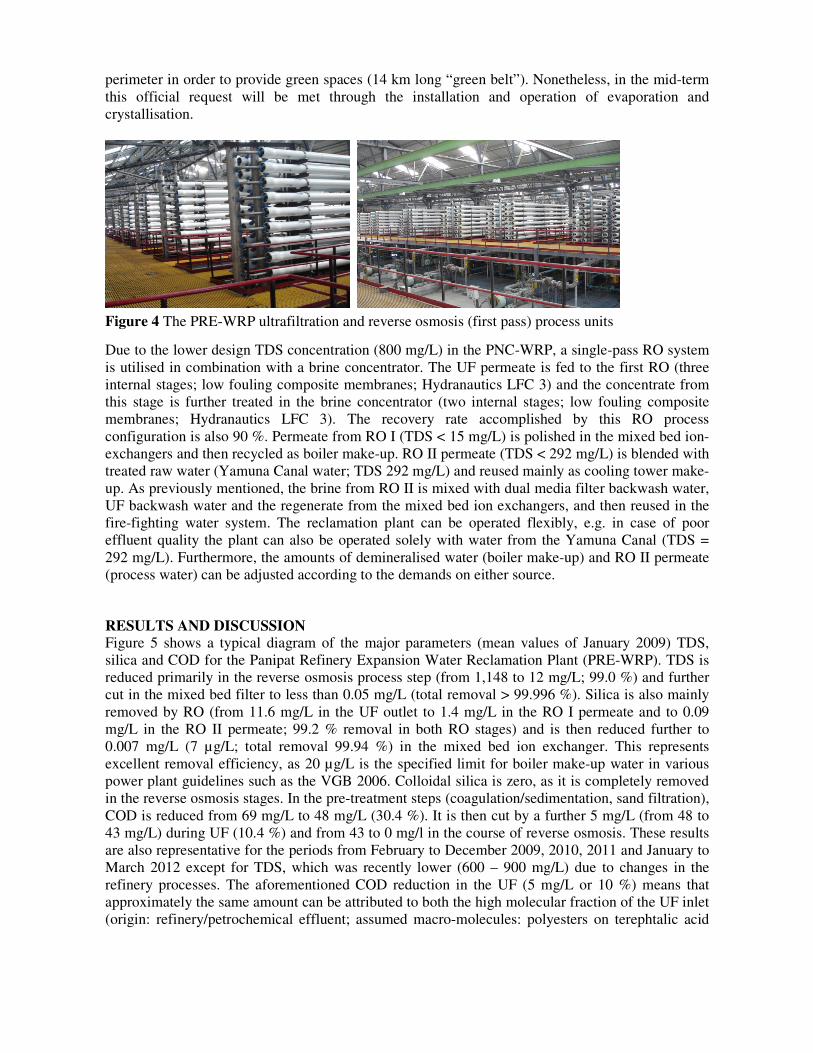
In the refinery reclamation plant (PRE-WRP), a two-pass RO system is employed in combination with a brine concentrator. Figure 4 shows the PRE-WRP ultrafiltration and reverse osmosis (first
pass) process units. The UF permeate is fed to RO pass I (three internal stages; low fouling composite membranes; Hydranautics LFC 3). The RO I permeate is further desalinated in RO pass II (three internal stages; low fouling composite membranes) and the RO I reject is fed to the brine
concentrator (two internal stages; seawater membranes; Hydranautics SWC 3). The brine concentrator permeate is recycled to RO II. The recovery rate accomplished by this process configuration is 90 %. The RO II permeate is degassed and in order to allow the further removal of dissolved solids, polished in mixed bed ion-exchangers containing strong acid cat-ion and strong
base an-ion resins mixed in a single vessel. As previously mentioned, the authorities have stipulated that the refinery has to achieve zero liquid discharge. However, it has temporary permission to dispose of the liquid waste produced in the reclamation process (R.O. brine). Currently 100 % of
the brine is used for refinery coke quenching. Other options are to blend the brine with fire-fighting water, or to use it for the irrigation (blended with low TDS water) of the free land along the refinery
perimeter in order to provide green spaces (14 km long “green belt”). Nonetheless, in the mid-term
this official request will be met through the installation and operation of evaporation and crystallisation.
Figure 4 The PRE-WRP ultrafiltration and reverse osmosis (first pass) process units
Due to the lower design TDS concentration (800 mg/L) in the PNC-WRP, a single-pass RO system
is utilised in combination with a brine concentrator. The UF permeate is fed to the first RO (three internal stages; low fouling composite membranes; Hydranautics LFC 3) and the concentrate from this stage is further treated in the brine concentrator (two internal stages; low fouling composite membranes; Hydranautics LFC 3). The recovery rate accomplished by this RO process
configuration is also 90 %. Permeate from RO I (TDS < 15 mg/L) is polished in the mixed bed ion-exchangers and then recycled as boiler make-up. RO II permeate (TDS < 292 mg/L) is blended with treated raw water (Yamuna Canal water; TDS 292 mg/L) and reused mainly as cooling tower make-
up. As previously mentioned, the brine from RO II is mixed with dual media filter backwash water, UF backwash water and the regenerate from the mixed bed ion exchangers, and then reused in the fire-fighting water system. The reclamation plant can be operated flexibly, e.g. in case of poor effluent quality the plant can also be operated solely with water from the Yamuna Canal (TDS =
292 mg/L). Furthermore, the amounts of demineralised water (boiler make-up) and RO II permeate (process water) can be adjusted according to the demands on either source.
RESULTS AND DISCUSSION
Figure 5 shows a typical diagram of the major parameters (mean values of January 2009) TDS, silica and COD for the Panipat Refinery Expansion Water Reclamation Plant (PRE-WRP). TDS is reduced primarily in the reverse osmosis process step (from 1,148 to 12 mg/L; 99.0 %) and further cut in the mixed bed filter to less than 0.05 mg/L (total removal > 99.996 %). Silica is also mainly
removed by RO (from 11.6 mg/L in the UF outlet to 1.4 mg/L in the RO I permeate and to 0.09 mg/L in the RO II permeate; 99.2 % removal in both RO stages) and is then reduced further to 0.007 mg/L (7 µg/L; total removal 99.94 %) in the mixed bed ion exchanger. This represents
excellent removal efficiency, as 20 µg/L is the specified limit for boiler make-up water in various power plant guidelines such as the VGB 2006. Colloidal silica is zero, as it is completely removed in the reverse osmosis stages. In the pre-treatment steps (coagulation/sedimentation, sand filtration),
COD is reduced from 69 mg/L to 48 mg/L (30.4 %). It is then cut by a further 5 mg/L (from 48 to 43 mg/L) during UF (10.4 %) and from 43 to 0 mg/l in the course of reverse osmosis. These results are also representative for the periods from February to December 2009, 2010, 2011 and January to March 2012 except for TDS, which was recently lower (600 – 900 mg/L) due to changes in the
refinery processes. The aforementioned COD reduction in the UF (5 mg/L or 10 %) means that approximately the same amount can be attributed to both the high molecular fraction of the UF inlet (origin: refinery/petrochemical effluent; assumed macro-molecules: polyesters on terephtalic acid

basis, etc.) and hydrophobic compounds, which are adsorbed on the polyether
The UF design gross flux of 54 L/m
removal rate of 270 mg COD/m2·h, which can be regarded as moderate. O
removed relatively easily by CEB with caustic NaOCl (e.g. by saponification of esters), at least during regular operation. Since startdesign flux (and a little above). SDI out
(inlet SDI is 6.7; the design outlet value is 3.0) and the turbidity values have been less than 0.1 NTU(limit of detection). An integrity test conducted in December 2008 showed that there were onfew fibre breakages - (e.g. in skid G: 36 in 72 membrane elements, i.e. 0.025 ‰ fibre breakages per year).
Figure 5 Removal of TDS, COD and silica
The ultrafiltration process demonstrated stable filtration performance in the first twooperation. However, after 26 months of operation, a permeability loss of approximately 25 % was observed. The main reason was that, at the request of the refinery, 50
effluent had been additionally treated in the reclamatCOD concentrations in the 200 - 300 mg/l range, which fouled the UF membranes. This fouling has been removed by more frequent CEBs. However, the original permeability values could not be recovered completely (as already mentioned: 25% permeability loss). Basically, relatively high
fluctuations in the permeability values have been observed due to which are caused periodically by subtreatment plants (ETP I and II). The poor performance of the ETPs can be traced to inhibiting or
partly toxic substances from the refinery processes and in winter, the low wastewater temperatures (15°C vs. up to 33°C in summer time). It would seem macro-molecules leave the ETPs and this subsequently causes fouling on the UF membranes.
In the last quarter of 2010 and first quarter of 2011, after four resp. four and a half years of operation, permeability remained acceptable (70 request the rack A and B membranes were exchanged for spare membranes (rack A on November
25, 2010; rack B on April 14, 2011). The old membranes from rack A were integrity tested result showed that after four years of operation there was still a relatively low specific fibre breakage rate (skid A: 119 breakages in 72 membrane elements, i.e. 0.041 ‰ fibre breakages per
basis, etc.) and hydrophobic compounds, which are adsorbed on the polyether-sulfone membrane.
/m2·h and a COD reduction of 5 mg/L result in a specific COD
h, which can be regarded as moderate. Organic fouling can be removed relatively easily by CEB with caustic NaOCl (e.g. by saponification of esters), at least during regular operation. Since start-up in December 2006, the PRE-WRP UF has been operated at
SDI outlet values have generally been within a range of 2.1 to 2.4
(inlet SDI is 6.7; the design outlet value is 3.0) and the turbidity values have been less than 0.1 NTU(limit of detection). An integrity test conducted in December 2008 showed that there were on
(e.g. in skid G: 36 in 72 membrane elements, i.e. 0.025 ‰ fibre breakages per
Removal of TDS, COD and silica - PRE-WRP
The ultrafiltration process demonstrated stable filtration performance in the first twooperation. However, after 26 months of operation, a permeability loss of approximately 25 % was observed. The main reason was that, at the request of the refinery, 50 - 100 m3/h petrochemical
effluent had been additionally treated in the reclamation plant. This effluent con300 mg/l range, which fouled the UF membranes. This fouling has
been removed by more frequent CEBs. However, the original permeability values could not be already mentioned: 25% permeability loss). Basically, relatively high
fluctuations in the permeability values have been observed due to unfavourable raw water qualities, which are caused periodically by sub-optimum performance in the upstream biological e
). The poor performance of the ETPs can be traced to inhibiting or
partly toxic substances from the refinery processes and in winter, the low wastewater temperatures 33°C in summer time). It would seem that under these disruptive conditions more
molecules leave the ETPs and this subsequently causes fouling on the UF membranes.
In the last quarter of 2010 and first quarter of 2011, after four resp. four and a half years of remained acceptable (70 - 180 L/m2
·h bar), but nevertheless at the client’s request the rack A and B membranes were exchanged for spare membranes (rack A on November
25, 2010; rack B on April 14, 2011). The old membranes from rack A were integrity tested result showed that after four years of operation there was still a relatively low specific fibre breakage rate (skid A: 119 breakages in 72 membrane elements, i.e. 0.041 ‰ fibre breakages per
sulfone membrane.
result in a specific COD
rganic fouling can be removed relatively easily by CEB with caustic NaOCl (e.g. by saponification of esters), at least
UF has been operated at let values have generally been within a range of 2.1 to 2.4
(inlet SDI is 6.7; the design outlet value is 3.0) and the turbidity values have been less than 0.1 NTU (limit of detection). An integrity test conducted in December 2008 showed that there were only a
(e.g. in skid G: 36 in 72 membrane elements, i.e. 0.025 ‰ fibre breakages per
The ultrafiltration process demonstrated stable filtration performance in the first two years of operation. However, after 26 months of operation, a permeability loss of approximately 25 % was
/h petrochemical
contained increased 300 mg/l range, which fouled the UF membranes. This fouling has
been removed by more frequent CEBs. However, the original permeability values could not be already mentioned: 25% permeability loss). Basically, relatively high
rable raw water qualities, optimum performance in the upstream biological effluent
). The poor performance of the ETPs can be traced to inhibiting or
partly toxic substances from the refinery processes and in winter, the low wastewater temperatures that under these disruptive conditions more
molecules leave the ETPs and this subsequently causes fouling on the UF membranes.
In the last quarter of 2010 and first quarter of 2011, after four resp. four and a half years of h bar), but nevertheless at the client’s
request the rack A and B membranes were exchanged for spare membranes (rack A on November
25, 2010; rack B on April 14, 2011). The old membranes from rack A were integrity tested and the result showed that after four years of operation there was still a relatively low specific fibre breakage rate (skid A: 119 breakages in 72 membrane elements, i.e. 0.041 ‰ fibre breakages per
year; November 2010). In the second half of May 2011, thmembranes in rack A and B (approx. 200 L/m
membranes (approx. 100 L/m2·h bar; average of racks C, D, E, F and G).
The following describes a result from Q2/2011 regarding the removal of the major parameters TDS, COD, and silica (monthly average values for April 2011) at the Panipat Naphtha Cracker Water
Reclamation Plant. TDS in the UF permeate was reduced by reverse o(design value 800 mg/L) to 21 mg/L (94.7 % removal), whereas silica was cut by RO I from 5.6 mg/L to 1.2 mg/L (78.6 %). The COD was lowered from 26 to 16 mg/L (38.5 %) by coagulation
sedimentation and filtration, and from 16 to 14 mThis means that approximately 12.5 % of the UF inlet COD was of high molecular nature (origin: naphtha cracker and polymer unit effluents; macromolecules from polyethylene, ethylene glycol,
polypropylene and polybutadien production). The design gross flux of 50 L/m
reduction of 2 mg/L resulted in a typical specific removal rate of 100 mg COD/m
lower than in the PRE-WRP UF (normally > 200 mg COD/mCOD removal rates (200 - 250 mg COD/moptimum conditions in the PNC effluent treatment plant (PNC
higher concentrations of macromolecules. quality, caused by disruptive conditions in the biological effluent treatment plants, leads to problems in the UF process steps of both reclamation plants.
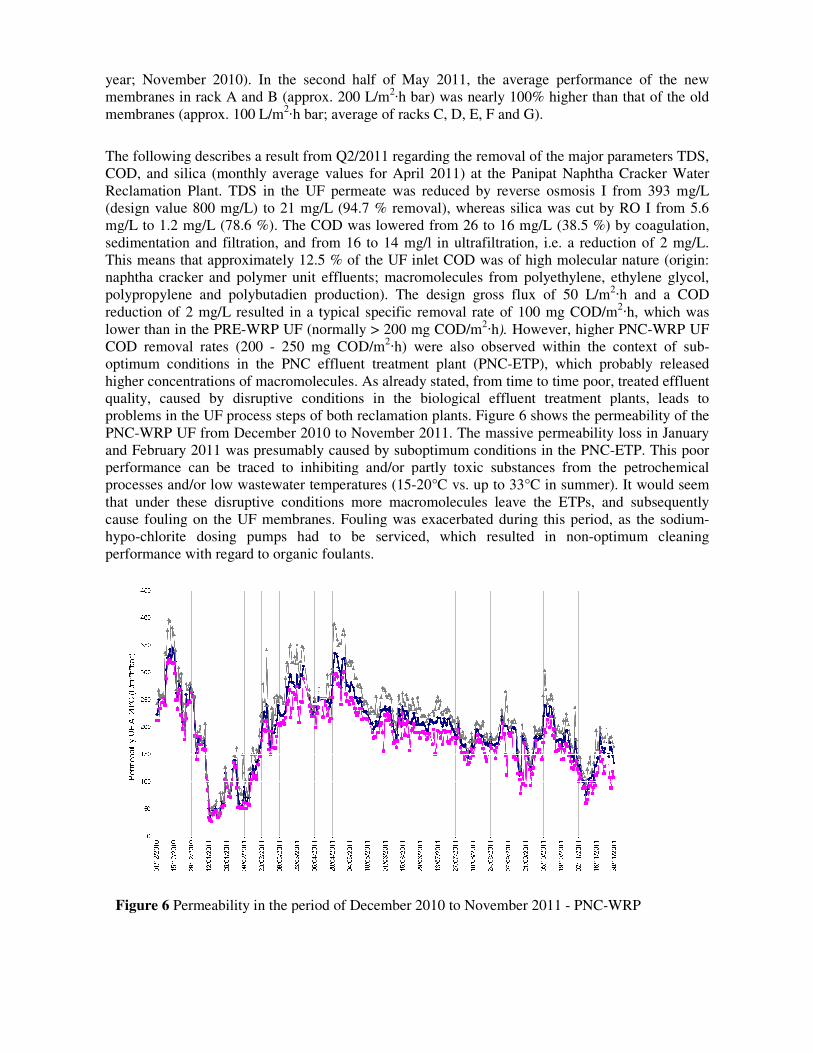
PNC-WRP UF from December 2010 to and February 2011 was presumably caused by suboptimum conditions in the PNCperformance can be traced to inhibiting processes and/or low wastewater temperatures (
that under these disruptive conditions more macromolecules leave the ETPs, and subsequently cause fouling on the UF membranes. Fouling was exacerbated during this period, as the sodihypo-chlorite dosing pumps had to be serviced, which resulted in non
performance with regard to organic foulants.
Figure 6 Permeability in the period of December 2010 to November 2011
year; November 2010). In the second half of May 2011, the average performance of the new membranes in rack A and B (approx. 200 L/m2
·h bar) was nearly 100% higher than that of the old
h bar; average of racks C, D, E, F and G).
The following describes a result from Q2/2011 regarding the removal of the major parameters TDS, COD, and silica (monthly average values for April 2011) at the Panipat Naphtha Cracker Water
Reclamation Plant. TDS in the UF permeate was reduced by reverse osmosis I from 393 mg/L (design value 800 mg/L) to 21 mg/L (94.7 % removal), whereas silica was cut by RO I from 5.6 mg/L to 1.2 mg/L (78.6 %). The COD was lowered from 26 to 16 mg/L (38.5 %) by coagulation
sedimentation and filtration, and from 16 to 14 mg/l in ultrafiltration, i.e. a reduction of 2 mg/L. This means that approximately 12.5 % of the UF inlet COD was of high molecular nature (origin: naphtha cracker and polymer unit effluents; macromolecules from polyethylene, ethylene glycol,
and polybutadien production). The design gross flux of 50 L/m
resulted in a typical specific removal rate of 100 mg COD/m
WRP UF (normally > 200 mg COD/m2·h). However, higher PNC
250 mg COD/m2·h) were also observed within the context of sub
optimum conditions in the PNC effluent treatment plant (PNC-ETP), which probably released
higher concentrations of macromolecules. As already stated, from time to time poor, treated effluent quality, caused by disruptive conditions in the biological effluent treatment plants, leads to problems in the UF process steps of both reclamation plants. Figure 6 shows the permeability of the
WRP UF from December 2010 to November 2011. The massive permeability loss in January and February 2011 was presumably caused by suboptimum conditions in the PNCperformance can be traced to inhibiting and/or partly toxic substances from the petrochemical
wastewater temperatures (15-20°C vs. up to 33°C in summer). It would seem
that under these disruptive conditions more macromolecules leave the ETPs, and subsequently cause fouling on the UF membranes. Fouling was exacerbated during this period, as the sodi
chlorite dosing pumps had to be serviced, which resulted in non-optimum cleaning
performance with regard to organic foulants.
Permeability in the period of December 2010 to November 2011 - PNC-
e average performance of the new h bar) was nearly 100% higher than that of the old
The following describes a result from Q2/2011 regarding the removal of the major parameters TDS, COD, and silica (monthly average values for April 2011) at the Panipat Naphtha Cracker Water
smosis I from 393 mg/L (design value 800 mg/L) to 21 mg/L (94.7 % removal), whereas silica was cut by RO I from 5.6 mg/L to 1.2 mg/L (78.6 %). The COD was lowered from 26 to 16 mg/L (38.5 %) by coagulation,
g/l in ultrafiltration, i.e. a reduction of 2 mg/L. This means that approximately 12.5 % of the UF inlet COD was of high molecular nature (origin: naphtha cracker and polymer unit effluents; macromolecules from polyethylene, ethylene glycol,
and polybutadien production). The design gross flux of 50 L/m2·h and a COD
resulted in a typical specific removal rate of 100 mg COD/m2·h, which was
However, higher PNC-WRP UF h) were also observed within the context of sub-
ETP), which probably released
or, treated effluent quality, caused by disruptive conditions in the biological effluent treatment plants, leads to
shows the permeability of the
2011. The massive permeability loss in January and February 2011 was presumably caused by suboptimum conditions in the PNC-ETP. This poor
or partly toxic substances from the petrochemical °C vs. up to 33°C in summer). It would seem
that under these disruptive conditions more macromolecules leave the ETPs, and subsequently cause fouling on the UF membranes. Fouling was exacerbated during this period, as the sodium-
optimum cleaning
-WRP
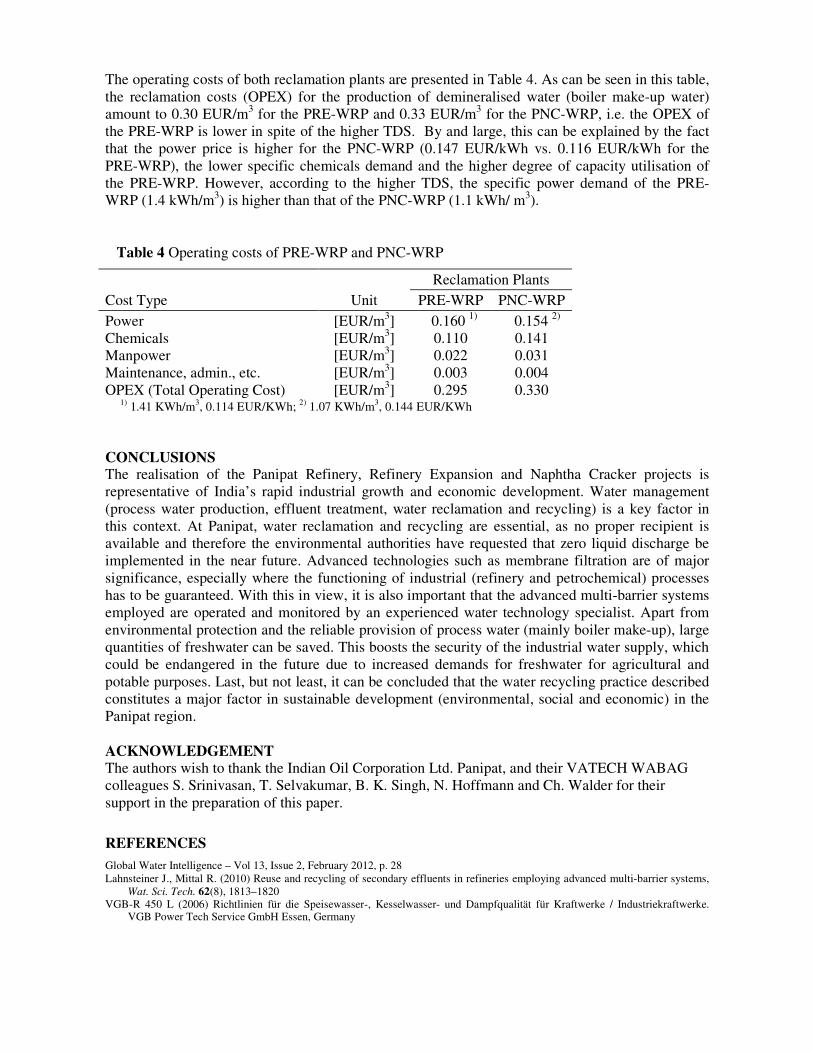
The operating costs of both reclamation plants are presented in Table 4. As can be seen in this table,
the reclamation costs (OPEX) for the production of demineralised water (boiler make-up water) amount to 0.30 EUR/m3 for the PRE-WRP and 0.33 EUR/m3 for the PNC-WRP, i.e. the OPEX of the PRE-WRP is lower in spite of the higher TDS. By and large, this can be explained by the fact that the power price is higher for the PNC-WRP (0.147 EUR/kWh vs. 0.116 EUR/kWh for the
PRE-WRP), the lower specific chemicals demand and the higher degree of capacity utilisation of the PRE-WRP. However, according to the higher TDS, the specific power demand of the PRE-WRP (1.4 kWh/m3) is higher than that of the PNC-WRP (1.1 kWh/ m3).
Table 4 Operating costs of PRE-WRP and PNC-WRP
Reclamation Plants
Cost Type Unit PRE-WRP PNC-WRP
Power [EUR/m3] 0.160 1) 0.154 2) Chemicals Manpower Maintenance, admin., etc.
OPEX (Total Operating Cost)
[EUR/m3]
[EUR/m3] [EUR/m3]
[EUR/m3]
0.110 0.022 0.003
0.295
0.141 0.031 0.004
0.330 1) 1.41 KWh/m3, 0.114 EUR/KWh; 2) 1.07 KWh/m3, 0.144 EUR/KWh
CONCLUSIONS The realisation of the Panipat Refinery, Refinery Expansion and Naphtha Cracker projects is representative of India’s rapid industrial growth and economic development. Water management
(process water production, effluent treatment, water reclamation and recycling) is a key factor in this context. At Panipat, water reclamation and recycling are essential, as no proper recipient is available and therefore the environmental authorities have requested that zero liquid discharge be implemented in the near future. Advanced technologies such as membrane filtration are of major
significance, especially where the functioning of industrial (refinery and petrochemical) processes has to be guaranteed. With this in view, it is also important that the advanced multi-barrier systems employed are operated and monitored by an experienced water technology specialist. Apart from
environmental protection and the reliable provision of process water (mainly boiler make-up), large quantities of freshwater can be saved. This boosts the security of the industrial water supply, which could be endangered in the future due to increased demands for freshwater for agricultural and
potable purposes. Last, but not least, it can be concluded that the water recycling practice described constitutes a major factor in sustainable development (environmental, social and economic) in the Panipat region.
ACKNOWLEDGEMENT
The authors wish to thank the Indian Oil Corporation Ltd. Panipat, and their VATECH WABAG colleagues S. Srinivasan, T. Selvakumar, B. K. Singh, N. Hoffmann and Ch. Walder for their
support in the preparation of this paper.
REFERENCES
Global Water Intelligence – Vol 13, Issue 2, February 2012, p. 28
Lahnsteiner J., Mittal R. (2010) Reuse and recycling of secondary effluents in refineries employing advanced multi-barrier systems, Wat. Sci. Tech. 62(8), 1813–1820
VGB-R 450 L (2006) Richtlinien für die Speisewasser-, Kesselwasser- und Dampfqualität für Kraftwerke / Industriekraftwerke. VGB Power Tech Service GmbH Essen, Germany


![Operating systems1[1]](https://static.fdocuments.net/doc/165x107/54b482124a7959df018b4581/operating-systems11.jpg)