
Full-year results 2019 - Nestlé
43
Full-year results 2020
Transcript of Full-year results 2019 - Nestlé

Full-year results 2020
Disclaimer
2 February 18, 2021 Nestlé full-year results 2020
This presentation contains forward looking statements which reflect
Management’s current views and estimates. The forward looking statements
involve certain risks and uncertainties that could cause actual results to differ
materially from those contained in the forward looking statements. Potential
risks and uncertainties include such factors as general economic conditions,
foreign exchange fluctuations, competitive product and pricing pressures and
regulatory developments.

Full-year results 2020Mark Schneider, CEO
Key messages 2020
4
• Rising to the challenge of the global pandemic
– Employee safety, business continuity, community support
• Strong financial results
– Organic sales growth of 3.6%
– Underlying trading operating profit margin increases by 10 bps to 17.7%
• Portfolio transformation fully on track
• Board proposes to raise dividend by 5 centimes per share to CHF 2.75
• Detailed roadmap to achieve net zero greenhouse gas emissions by 2050
February 18, 2021 Nestlé full-year results 2020

2.4
3.6
2017 2020
Third consecutive year of improved growth and margins
5 February 18, 2021 Nestlé full-year results 2020
16.5
17.7
2017
restated
2020
Underlying trading operating profit
(in % of sales)
Organic sales growth
(%)
Target set in 2017: 17.5% - 18.5%
Target set in 2017:mid-single digit
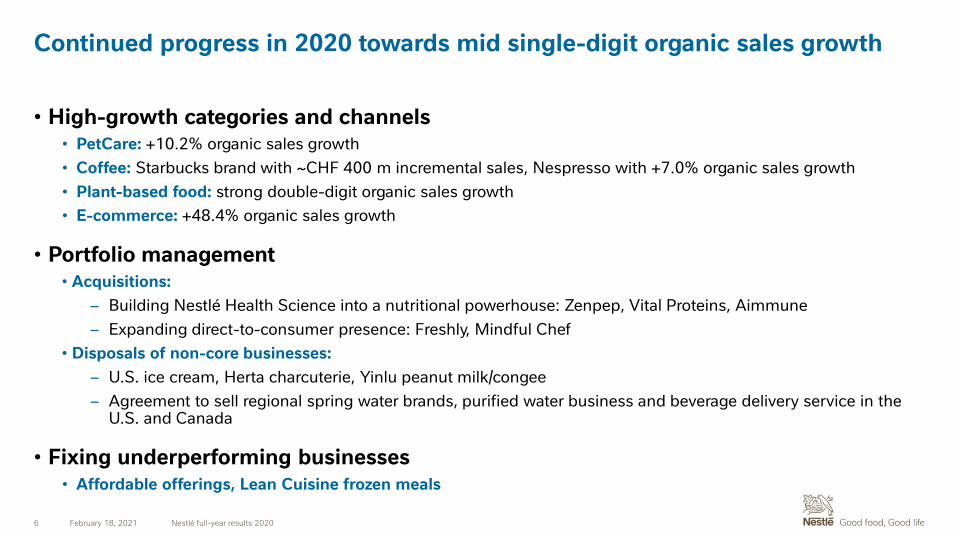
Continued progress in 2020 towards mid single-digit organic sales growth
• High-growth categories and channels• PetCare: +10.2% organic sales growth
• Coffee: Starbucks brand with ~CHF 400 m incremental sales, Nespresso with +7.0% organic sales growth
• Plant-based food: strong double-digit organic sales growth
• E-commerce: +48.4% organic sales growth
• Portfolio management • Acquisitions:
– Building Nestlé Health Science into a nutritional powerhouse: Zenpep, Vital Proteins, Aimmune
– Expanding direct-to-consumer presence: Freshly, Mindful Chef
• Disposals of non-core businesses:
– U.S. ice cream, Herta charcuterie, Yinlu peanut milk/congee
– Agreement to sell regional spring water brands, purified water business and beverage delivery service in the U.S. and Canada
• Fixing underperforming businesses• Affordable offerings, Lean Cuisine frozen meals
6 February 18, 2021 Nestlé full-year results 2020

Further developing our portfolio
7
Acquiring / investing in high-growth
and core segments
Divestingunder-performing
or non-core businesses
Ability to winMark
et
att
racti
ven
ess
> 75 transactions
closed or announced
since 2017, equivalent to
~ 18% of Group sales
Organic sales growth
contribution in 2020*
~60 bps
US Confectionery
* From acquisitions between 2017-2020
February 18, 2021 Nestlé full-year results 2020
North America Waters

Nestlé’s Net Zero Roadmap
Moving faster Scaling up Delivering our promise
Path to zero
emissions by 2050
Business as usual
Our path to regeneration for future generations
92mtonnes of
GHG emissions
20% reduction
by 2025 50% reduction
by 2030 Net Zeroby 2050

Sustainability is key to our value-creation strategy
9 February 18, 2021 Nestlé full-year results 2020
• Balancing short-term and long-term stakeholder expectations
• Creating competitive advantage by enhancing relevance with consumers,
regulators, employee base and investors
• Keeping sustainability investments earnings neutral through growth leverage and
structural cost reduction

2021 guidance
10 February 18, 2021 Nestlé full-year results 2020
• Continued increase in organic sales growth towards a mid single-digit rate
• Underlying trading operating profit margin with continued moderate
improvement
• Underlying earnings per share in constant currency and capital efficiency
expected to increase

Mid-term outlook
11 February 18, 2021 Nestlé full-year results 2020
• Sustained mid single-digit organic sales growth
• Continued moderate underlying trading operating profit margin improvements
• Continued prudent capital allocation and capital efficiency improvements
• Value creation for both society and our shareholders
Full-year results 2020François-Xavier Roger, CFO

Full-year sales growth
FY-2019 salesCHF bn
RIG Net M&A FY-2020 salesCHF bn
Pricing Foreign exchange
OG +3.6%
+0.4%
-4.6%
-7.9%
+3.2%
-30
84.3
92.6
Reported sales growth -8.9%
13 February 18, 2021 Nestlé full-year results 2020

Contrasted momentum by channel
14
Out-of-home*
* Includes Nestlé Professional, foodservice activities of Nespresso, Starbucks products and water, travel retail and Blue Bottle
FY-2019 FY-2020
Organic sales growth
FY-2019 FY-2020
3.4%
7.0%
Retail
-30.4%
4.0%
February 18, 2021 Nestlé full-year results 2020

Strong growth in retail sales
15
Q1-2020 Q2-2020 Q3-2020
Q1-2020 Q2-2020 Q3-2020
Out-of-home*Retail
* Includes Nestlé Professional, foodservice activities of Nespresso, Starbucks products and water, travel retail and Blue Bottle
Organic sales growth %
5.76.9
8.6
6.8
Q4-2020
-11.2
-54.7
-26.5 -27.0
Q4-2020
February 18, 2021 Nestlé full-year results 2020

Broad-based growth with strong momentum in the Americas
16
Each geography includes zones, Nestlé Waters, Nespresso, Nestlé Health Science and Nestlé Skin Health
Sales(in CHF)
RIG
Pricing
OG
AMS EMENA AOA
37.7 bn 24.5 bn
5.3% 2.6%
0.7% -0.2%
22.1 bn
0.5%
0.3%
6.0% 2.4% 0.8%
February 18, 2021 Nestlé full-year results 2020

Strong real internal growth in developed markets
17
Sales (in CHF)% of Group sales
49.4 bn59%
34.9 bn41%
4.6% 1.4%
-0.8% 2.0%
3.8% 3.4%
RIG
Pricing
OG
Developed Emerging
February 18, 2021 Nestlé full-year results 2020
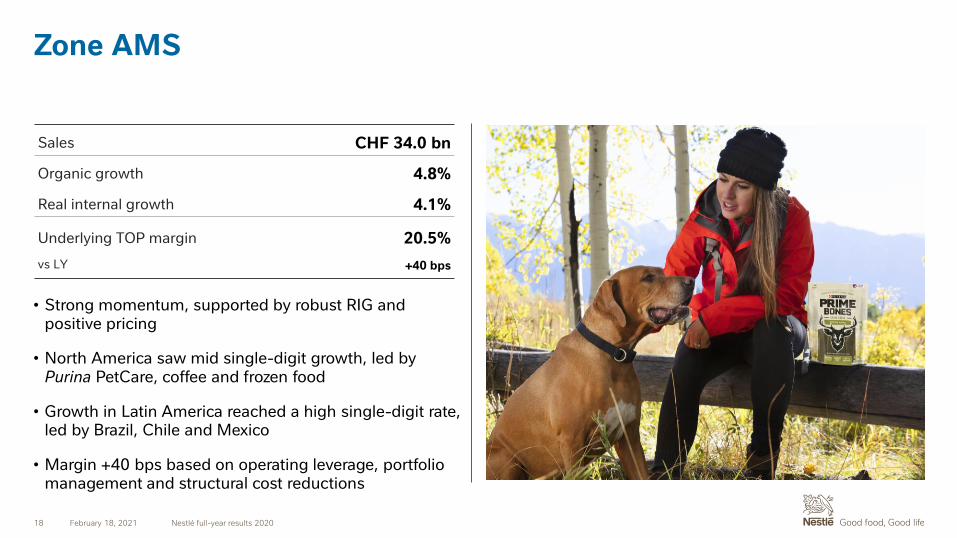
Zone AMS
18
• Strong momentum, supported by robust RIG and positive pricing
• North America saw mid single-digit growth, led by Purina PetCare, coffee and frozen food
• Growth in Latin America reached a high single-digit rate, led by Brazil, Chile and Mexico
• Margin +40 bps based on operating leverage, portfolio management and structural cost reductions
Sales CHF 34.0 bn
Organic growth 4.8%
Real internal growth 4.1%
Underlying TOP margin
vs LY
20.5%
+40 bps
February 18, 2021 Nestlé full-year results 2020

Zone EMENA
19
• Highest organic growth in the last five years, with broad-based market share gains
• All regions contributed positively, with strong momentum in Russia, Germany, the UK and Israel
• Coffee, Purina PetCare and culinary were the main contributors to growth
• Margin +50 bps based on lower marketing expenses, structural cost reductions and portfolio management
Sales CHF 20.2 bn
Organic growth 2.9%
Real internal growth 3.3%
Underlying TOP margin
vs LY
18.6%
+50 bps
February 18, 2021 Nestlé full-year results 2020

Zone AOA
20
• Positive organic growth, led by pricing
• China saw negative growth due to the timing of Chinese New Year and declines in out-of-home channels
• Other regions combined grew at a mid single-digit rate, supported by Sub-Saharan Africa, Philippines and India
• Margin -30 bps reflecting commodity inflation and COVID-19-related costs
Sales CHF 20.7 bn
Organic growth 0.5%
Real internal growth 0.0%
Underlying TOP margin
vs LY
22.2%
-30 bps
February 18, 2021 Nestlé full-year results 2020

Other Businesses
21
• Nespresso accelerated to 7.0% organic growth, led by e-commerce and the Vertuo system
• Nestlé Health Science posted 12.2% organic growth, with strong demand for products that support health and immunity
• Margin +90 bps based on operating leverage and structural cost reductions
Sales CHF 9.4 bn
Organic growth 7.9%
Real internal growth 7.3%
Underlying TOP margin
vs LY
19.6%
+90 bps
February 18, 2021 Nestlé full-year results 2020

Contrasted category dynamics
22
Milk productsand Ice cream
7.9%
Confectionery
-1.5%
Prepared dishesand cooking aids
4.7%
10.2%
PetCarePowdered and Liquid Beverages
3.2%
Total Group
3.6%
-7.0%
Water
Nutrition and Health Science
1.7%
Organic sales growth %
February 18, 2021 Nestlé full-year results 2020
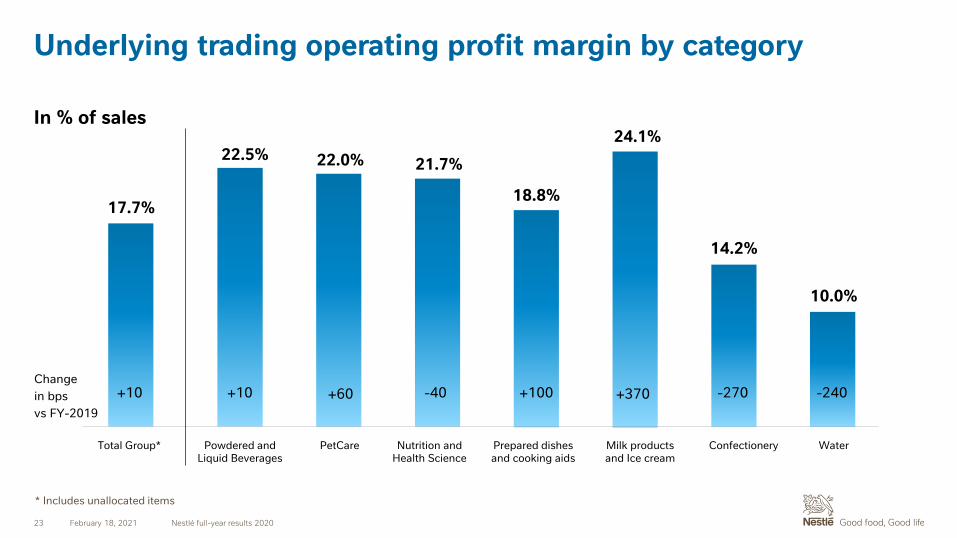
Underlying trading operating profit margin by category
23
* Includes unallocated items
17.7%
22.5%
10.0%
24.1%
22.0%
18.8%
14.2%
21.7%
+10 +10 +60 +370-40 +100 -270 -240Change
in bps
vs FY-2019
In % of sales
PetCareTotal Group* Powdered and Liquid Beverages
Milk productsand Ice cream
Prepared dishesand cooking aids
ConfectioneryNutrition and Health Science
Water
February 18, 2021 Nestlé full-year results 2020

49.1%*
49.6% 49.6%
49.1%
48.3%*
48.7%49.0%
49.1%
Further improvement in gross marginExcluding Nestlé Skin Health
24
2017 2018 2019 2020
* Restated to reflect implementation of IFRS 15, IFRS 16 and reclassification of certain cost items from marketing and administration to cost of goods sold
Excl. Nestlé Skin Health
Gross margin = (Sales - Cost of good sold) / Sales
February 18, 2021 Nestlé full-year results 2020

Continued margin expansion
25
17.1%
-30
17.4%
+70 bps
Currency impact
Administration,Marketing,
R&D
+10 bps
COGS &Distribution
-60 bps
Underlying TOPFY-2019
17.6%
Underlying TOP FY-2020
in constant currency
17.8%
February 18, 2021 Nestlé full-year results 2020
Margin increased by +20 bps in constant currency
Underlying TOP FY-2020
17.7%
Underlying TOP margin, including Nestlé Skin Health

Continued margin expansion
26
17.5%
-30
17.4%
+10 bps
Currency impact
Administration,Marketing,
R&D
+10 bps
COGS &Distribution
+10 bps
Underlying TOPFY-2019 pro forma
17.5%
Underlying TOP FY-2020
in constant currency
17.8%
February 18, 2021 Nestlé full-year results 2020
Margin increased by + 30 bps in constant currency
Underlying TOP FY-2020
17.7%
Underlying TOP margin pro forma, excluding Nestlé Skin Health

Increased underlying EPS in constant currency
27
* In constant currency
% of sales 2020 vs 2019
Underlying trading operating profit 17.7% +10 bpsRestructuringImpairment of assetsOnerous contracts, litigations and other operating income / expenses
+30 bps+130 bps
+40 bps
Trading operating profit 16.9% +210 bps
Gain / loss on disposalsTaxes Income from associates / joint ventures Others
-170 bps-60 bps
+120 bps-10 bps
Net profit 14.5% +90 bps
Weighted average number of shares outstanding 2 845 m -2.9%
Underlying EPS CHF 4.21 +3.5%*
February 18, 2021 Nestlé full-year results 2020

5.3%4.7%
2.8%
2.2%
1.6%1.4%
0.6%
0.0%
IFRS restatement
Continued improvement in working capital Working capital as a % of sales, calculated on a 5-quarter average
2014 2015 2016 2017 2018 2019 2020
Note: 2017 restated, reflecting implementation of IFRS 15 and IFRS 16
28 February 18, 2021 Nestlé full-year results 2020

10.8% 10.9%11.2%
11.4%
12.1%
13.1%
14.7%
Steady progress in ROIC, led by disciplined capital allocation
29
* Excludes impairment of Nestlé Skin Health and restated to reflect implementation of IFRS 15 and IFRS 16** Excludes impairment of Yinlu
*
February 18, 2021 Nestlé full-year results 2020
2014 2015 2016 2017 2018 2019 2020
**

Strong free cash flow
30
10.4%
11.8%
12.9%
12.1%
8.5%
9.0%
9.5%
10.0%
10.5%
11.0%
11.5%
12.0%
12.5%
13.0%
13.5%
Free cash flow in % of sales
2017 2018 2019 2020
* Restated, reflecting implementation of IFRS 15 and IFRS 16
*
February 18, 2021 Nestlé full-year results 2020

Net debt
31
Sharebuyback
+6.8
-30
27.1
Net debt increased by CHF 4.2 bn
Other
-0.7
Free cashflow
-10.2
CHF 14.5 bn returned to shareholders
+7.7
Dividends
+0.6
M&A(net)
31.3
Net debtDec 31, 2020
Net debt/Adjusted EBITDA: 1.4x
Net debt/Adjusted EBITDA: 1.7x
Net debtJan 1, 2020
In CHF bn
February 18, 2021 Nestlé full-year results 2020

Full-year results 2020Q&A

Full-year results 2020Supporting slides

FY-2020 Operating segments – quarterly summary
34 February 18, 2021 Nestlé full-year results 2020
Q4-2020 sales
Sales RIG Pricing OG
(CHF m) % % %
Zone AMS 9 019 2.6 1.6 4.2
Zone EMENA 5 274 3.3 -0.2 3.1
Zone AOA 5 479 0.7 0.9 1.6
Other Businesses 2 659 8.7 0.5 9.2
Total Group 22 431 3.0 0.9 3.9
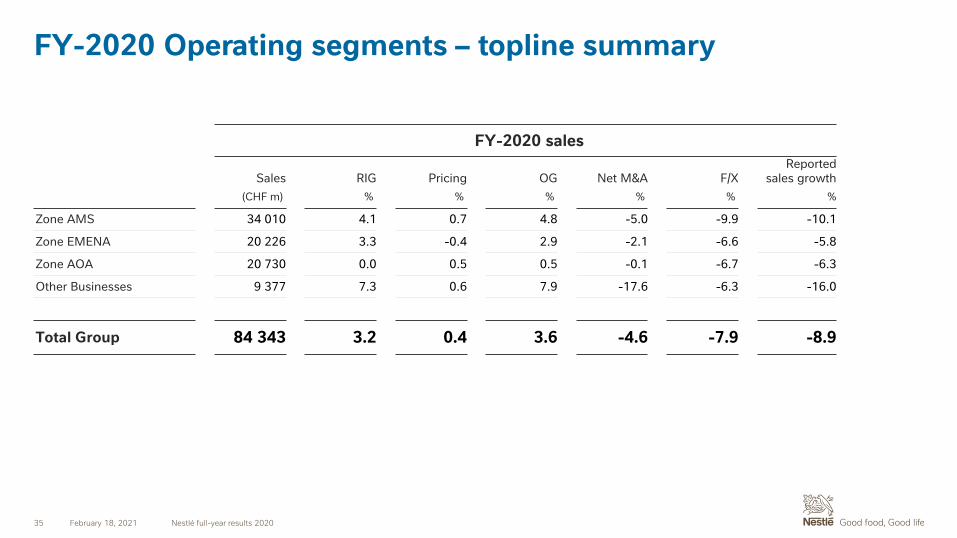
FY-2020 Operating segments – topline summary
35 February 18, 2021 Nestlé full-year results 2020
FY-2020 sales
Sales RIG Pricing OG Net M&A F/XReported
sales growth
(CHF m) % % % % % %
Zone AMS 34 010 4.1 0.7 4.8 -5.0 -9.9 -10.1
Zone EMENA 20 226 3.3 -0.4 2.9 -2.1 -6.6 -5.8
Zone AOA 20 730 0.0 0.5 0.5 -0.1 -6.7 -6.3
Other Businesses 9 377 7.3 0.6 7.9 -17.6 -6.3 -16.0
Total Group 84 343 3.2 0.4 3.6 -4.6 -7.9 -8.9

FY-2020 Products – topline summary
36 February 18, 2021 Nestlé full-year results 2020
FY-2020 sales
Sales RIG Pricing OG
(CHF m) % % %
Powdered and liquid beverages 22 256 2.8 0.4 3.2
Water 6 421 -5.5 -1.5 -7.0
Milk products and ice cream 11 007 5.6 2.3 7.9
Nutrition and Health Science 12 160 1.2 0.5 1.7
Prepared dishes and cooking aids 11 523 4.7 0.0 4.7
Confectionery 6 975 -1.1 -0.4 -1.5
Petcare 14 001 9.7 0.5 10.2
Total Group 84 343 3.2 0.4 3.6

FY-2020 historical eight quarters
37 February 18, 2021 Nestlé full-year results 2020
Period RIG%
Pricing%
OG%
Q1-2019 2.2 1.2 3.4
Q2-2019 3.0 0.9 3.9
Q3-2019 3.9 -0.2 3.7
Q4-2019 2.5 0.5 3.0
Q1-2020 4.7 -0.4 4.3
Q2-2020 0.5 0.8 1.3
Q3-2020 4.8 0.1 4.9
Q4-2020 3.0 0.9 3.9

FY-2020 Operating segments – revenue and results
38 February 18, 2021 Nestlé full-year results 2020
In CHF m
Sales
Underlying
trading
operating
profit
Trading
operating
profit
Net other
trading
income/
(expense)
Of which
impairment
of property,
plant and
equipment
Of which
restructuring
costs
Depreciation
and
amortization
Zone AMS 34 010 6 975 6 724 (251) (126) -- (1 106)
Zone EMENA 20 226 3 766 3 575 (191) (43) (162) (852)
Zone AOA 20 730 4 599 4 466 (133) (82) (53) (705)
Other businesses 9 377 1 841 1 796 (45) (28) (4) (530)
Unallocated items -- (2 278) (2 328) (50) (23) (1) (272)
Total Group 84 343 14 903 14 233 (670) (302) (220) (3 465)

FY-2020 Products – revenue and results
39 February 18, 2021 Nestlé full-year results 2020
In CHF m
Sales
Underlying
trading
operating
profit
Trading
operating
profit
Net other
trading income/
(expense)
Of which
impairment of
property, plant
and equipment
Of which
restructuring
costs
Powdered and Liquid Beverages 22 256 5 008 4 824 (184) (93) (38)
Water 6 421 639 522 (117) (19) (77)
Milk products and Ice cream 11 007 2 652 2 615 (37) (20) (5)
Nutrition and Health Science 12 160 2 640 2 490 (150) (55) (37)
Prepared dishes and cooking aids 11 523 2 171 2 147 (24) (24) (40)
Confectionery 6 975 990 874 (116) (67) (28)
Petcare 14 001 3 081 3 089 8 (1) 6
Unallocated items -- (2 278) (2 328) (50) (23) (1)
Total Group 84 343 14 903 14 233 (670) (302) (220)

FY-2020 currency overview
40 February 18, 2021 Nestlé full-year results 2020
Weighted average rate
FY-2019 FY-2020 Variation in %
US Dollar 1 USD 0.993 0.937 -5.6%
Euro 1 EUR 1.112 1.070 -3.8%
Chinese Yuan Renminbi 100 CNY 14.366 13.596 -5.4%
UK Pound Sterling 1 GBP 1.269 1.202 -5.3%
Brazilian Reais 100 BRL 25.118 18.175 -27.6%
Philippine Peso 100 PHP 1.920 1.893 -1.4%
Mexican Pesos 100 MXN 5.159 4.395 -14.8%
Canadian Dollar 1 CAD 0.749 0.698 -6.8%
Japanese Yen 100 JPY 0.911 0.877 -3.7%
Indian Rupee 100 INR 1.410 1.267 -10.1%
Russian Federation Ruble 100 RUB 1.537 1.292 15.9%
Australian Dollar 1 AUD 0.692 0.646 -6.6%

FY-2020 underlying EPS reconciliation (1 of 2)
41 February 18, 2021 Nestlé full-year results 2020
From net profit to underlying net profit In CHF m
FY-2019 FY-2020
Net profit 12 609 12 232
Restructuring costs 553 220
Impairments of property, plant & equipment, goodwill and int. assets 2 336 711
Net result on disposal of businesses (3 416) (1 678)
Other adjustment in Net other income/(expense) 710 854
Adjustment for income from associates and joint ventures 285 (577)
Tax effect on above items & adjustment of one-off tax items (135) 400
Adjustment in non-controlling interests (20) (179)
Underlying net profit 12 922 11 983
Weighted Average number of shares outstanding (m) 2 929 2 845
Underlying EPS 4.41 4.21
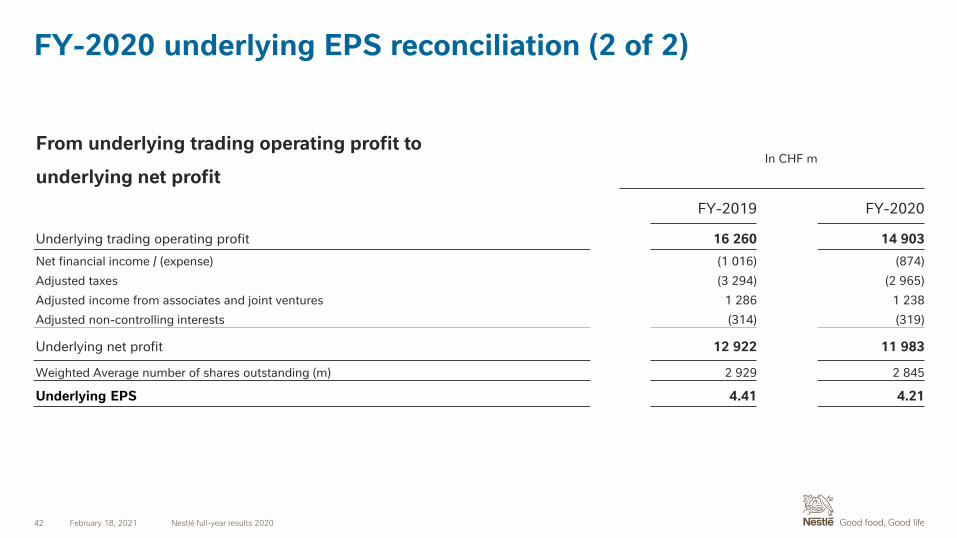
FY-2020 underlying EPS reconciliation (2 of 2)
42 February 18, 2021 Nestlé full-year results 2020
From underlying trading operating profit to
underlying net profitIn CHF m
FY-2019 FY-2020
Underlying trading operating profit 16 260 14 903
Net financial income / (expense) (1 016) (874)
Adjusted taxes (3 294) (2 965)
Adjusted income from associates and joint ventures 1 286 1 238
Adjusted non-controlling interests (314) (319)
Underlying net profit 12 922 11 983
Weighted Average number of shares outstanding (m) 2 929 2 845
Underlying EPS 4.41 4.21
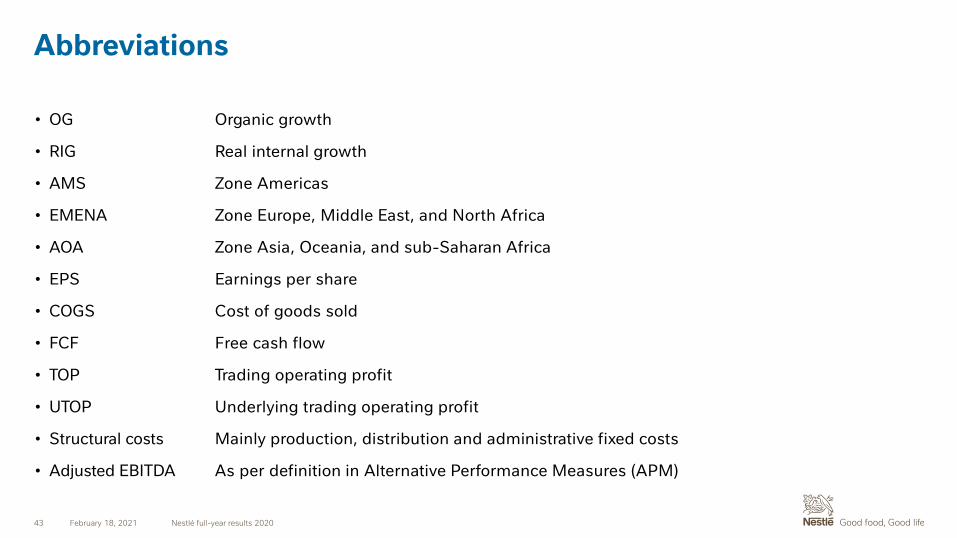
Abbreviations
43 February 18, 2021 Nestlé full-year results 2020
• OG
• RIG
• AMS
• EMENA
• AOA
• EPS
• COGS
• FCF
• TOP
• UTOP
• Structural costs
• Adjusted EBITDA
Organic growth
Real internal growth
Zone Americas
Zone Europe, Middle East, and North Africa
Zone Asia, Oceania, and sub-Saharan Africa
Earnings per share
Cost of goods sold
Free cash flow
Trading operating profit
Underlying trading operating profit
Mainly production, distribution and administrative fixed costs
As per definition in Alternative Performance Measures (APM)


