Full Year Consolidated Financial Results for the Fiscal ... · NEC has changed the accounting...
63
Press Release - Media Contact: Diane Foley / Makoto Miyakawa TEL: +81-3-3798-6511 ***** For immediate use May 21, 2007 Full Year Consolidated Financial Results for the Fiscal Year Ended March 31, 2007 Consolidated Financial Results Fiscal Year Ended March 31, 2007 Fiscal Year Ended March 31, 2006 Change In billions of yen In billions of yen % Net sales 4,652.6 4,930.0 -5.6 Operating income 70.0 72.5 -3.5 Ordinary income 16.3 15.0 +9.3 Net income (loss) 9.1 (10.1) - yen yen yen Net income (loss) per share: Basic 4.43 (5.26) 9.69 Diluted 4.23 - - In billions of yen In billions of yen % Total assets 3,731.7 3,802.8 -1.9 Number of employees 154,786 154,180 - (Notes) 1. NEC has changed the accounting principles for preparing its consolidated financial statements from accounting principles generally accepted in the U.S. (“U.S. GAAP”), to accounting principles generally accepted in Japan (“Japan GAAP”). 2. Number of consolidated subsidiaries and affiliated companies accounted for by the equity method is as follows: As of March 31, 2007 As of March 31, 2006 Consolidated subsidiaries 342 356 Affiliated companies accounted for by the equity method 68 68 1
-
Upload
duongkhanh -
Category
Documents
-
view
215 -
download
2
Transcript of Full Year Consolidated Financial Results for the Fiscal ... · NEC has changed the accounting...

Press Release - Media Contact: Diane Foley / Makoto Miyakawa TEL: +81-3-3798-6511 ***** For immediate use May 21, 2007
Full Year Consolidated Financial Results for the Fiscal Year Ended
March 31, 2007 Consolidated Financial Results
Fiscal Year Ended March
31, 2007
Fiscal Year Ended March
31, 2006
Change
In billions of yen In billions of yen %
Net sales 4,652.6 4,930.0 -5.6 Operating income 70.0 72.5 -3.5 Ordinary income 16.3 15.0 +9.3 Net income (loss) 9.1 (10.1) - yen yen yen
Net income (loss) per share:
Basic 4.43 (5.26) 9.69 Diluted 4.23 - -
In billions of yen In billions of yen %
Total assets 3,731.7 3,802.8 -1.9 Number of employees 154,786 154,180 -
(Notes) 1. NEC has changed the accounting principles for preparing its consolidated financial statements
from accounting principles generally accepted in the U.S. (“U.S. GAAP”), to accounting
principles generally accepted in Japan (“Japan GAAP”).
2. Number of consolidated subsidiaries and affiliated companies accounted for by the equity
method is as follows:
As of March 31,
2007
As of March 31,
2006
Consolidated subsidiaries 342 356
Affiliated companies accounted for by the equity method 68 68
1

Business Results
1. Analysis of Business Results
<1> Overview of the fiscal year ended March 31, 2007, and outlook for the fiscal year
ending March 31, 2008
NEC previously disclosed its consolidated financial results based on the financial
statements prepared in accordance with the terms, formats and preparation methods of
U.S. GAAP. As has been previously announced, however, NEC has elected, starting
with the first half of the fiscal year ended March 31, 2007, to prepare and disclose its
consolidated financial statements required under Japanese law in accordance with Japan
GAAP. Accordingly, the financial results for the fiscal year ended March 31, 2007,
including figures presented for purposes of comparison with the previous fiscal year, are
presented under Japan GAAP. This change in accounting principles came about
because NEC has not been able to prepare its consolidated financial statements under
U.S. GAAP for the fiscal year ended March 31, 2006, based on U.S. GAAP, as the
audits relating to NEC’s annual report to be filed with the U.S. Securities and Exchange
Commission (“SEC”), have not been completed under the audit standards by the U.S.
Public Company Accounting Oversight Board. In addition, NEC filed an
Improvement Report required by Tokyo and other stock exchanges in Japan in relation
to the correction of its financial results (Japan GAAP) for the first half of the fiscal year
ended March 31, 2007, which contained measures to improve its information disclosure
controls and procedures. NEC sincerely apologizes to all concerned parties for any
2
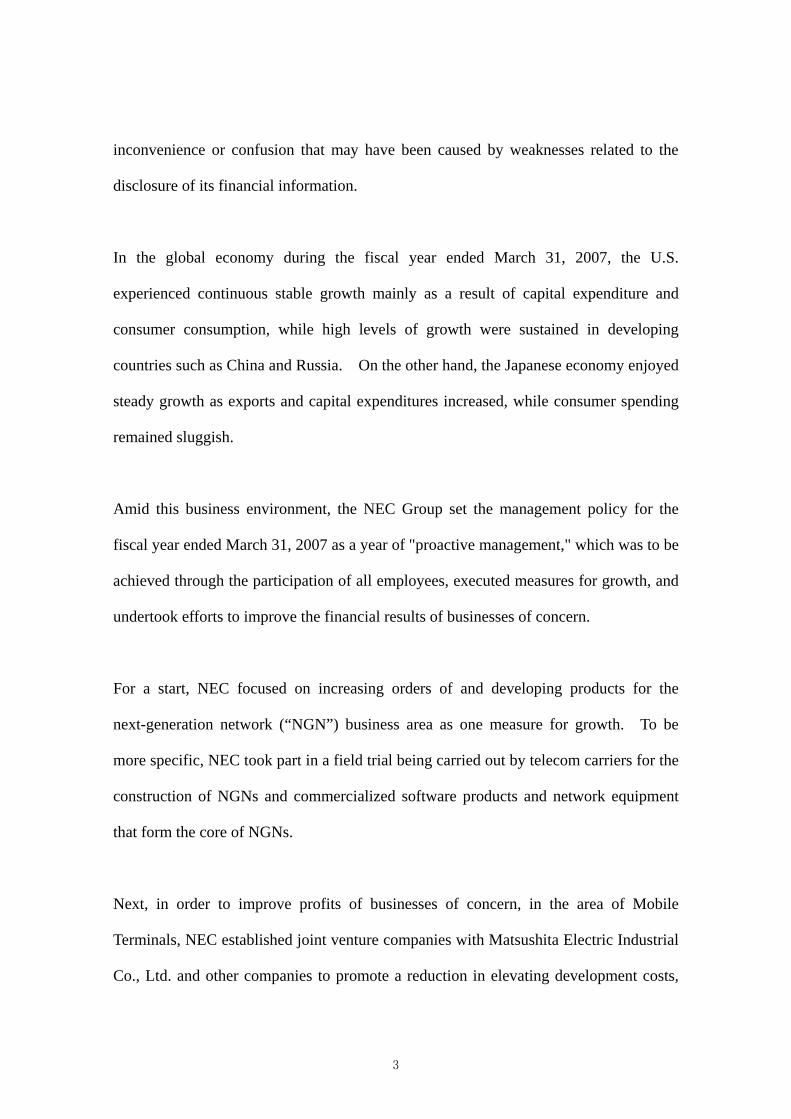
inconvenience or confusion that may have been caused by weaknesses related to the
disclosure of its financial information.
In the global economy during the fiscal year ended March 31, 2007, the U.S.
experienced continuous stable growth mainly as a result of capital expenditure and
consumer consumption, while high levels of growth were sustained in developing
countries such as China and Russia. On the other hand, the Japanese economy enjoyed
steady growth as exports and capital expenditures increased, while consumer spending
remained sluggish.
Amid this business environment, the NEC Group set the management policy for the
fiscal year ended March 31, 2007 as a year of "proactive management," which was to be
achieved through the participation of all employees, executed measures for growth, and
undertook efforts to improve the financial results of businesses of concern.
For a start, NEC focused on increasing orders of and developing products for the
next-generation network (“NGN”) business area as one measure for growth. To be
more specific, NEC took part in a field trial being carried out by telecom carriers for the
construction of NGNs and commercialized software products and network equipment
that form the core of NGNs.
Next, in order to improve profits of businesses of concern, in the area of Mobile
Terminals, NEC established joint venture companies with Matsushita Electric Industrial
Co., Ltd. and other companies to promote a reduction in elevating development costs,
3

streamlined unprofitable businesses overseas, and promoted strengthening of product
competitiveness to increase shipments and recover market shares.
At the same time, in the area of Semiconductors, although sales increased due to the
implementation of measures for obtaining orders, such as collaboration with
semiconductor trading companies and strengthening of the sales structure in China, a
strict condition prevailed for the fiscal year ended March 31, 2007, mainly owing to
product price decline, an increase in development costs through dispersion of the
product lineup, and a delay in cost reduction.
NEC recorded consolidated net sales of 4,652.6 billion yen for the fiscal year ended
March 31, 2007, a decrease of 277.3 billion yen (5.6%) year on year. Despite an
increase in sales, mainly of semiconductors in the Electron Devices business, this fall
was mainly due to sales in line with those of the previous fiscal year in the IT/Network
Solutions business, sale of the personal computer (“PC”) business in Europe,
streamlining of overseas business, and a decrease in the number of units shipped in
Japan in the area of Mobile Terminals in the Mobile/Personal Solutions business.
Regarding profitability, operating income fell by 2.6 billion yen (3.5%) year on year, to
70.0 billion yen. Although there was an improvement in profit in the Mobile/Personal
Solutions business as a result of streamlining of overseas business in the area of Mobile
Terminals and in the Electron Devices business due to an increase in sales, the fall in
operating income is mainly due to the accrual of estimated warranty costs for products
already sold in the IT/Network Solutions business.
4

Ordinary income rose by 1.4 billion yen (9.3%) year on year, to 16.3 billion yen. NEC
recorded income before income taxes of 96.3 billion yen, an increase of 44.6 billion yen
year on year. This was due to an increase in ordinary income, in addition to the
recording of an increase in special gains and losses of 43.2 billion yen accompanying
cancellation of a part of NEC’s pension trust. In addition, consolidated net income
improved by 19.2 billion yen year on year, to 9.1 billion yen.
For the fiscal year ending March 31, 2008, NEC projects an increase in consolidated net
sales of 1.0% as compared with the fiscal year ended March 31, 2007, to 4,700.0 billion
yen. This target reflects anticipated sustained growth in the market environment of the
IT Services/System Integration area, in addition to an expected increase in sales in the
area of Network Systems, such as the wireless system “Pasolink” that is enjoying
sustained growth, and forecasted recovery of the Electron Devices business, despite the
fall in sales that will result from the sale of the PC business in Europe this fiscal year.
Forecasting recovery in the Mobile Terminal area and the Electron Devices business, as
well as an increase in sales, NEC anticipates consolidated operating income of 130.0
billion yen, an increase of 60.0 billion yen as compared with the fiscal year ended
March 31, 2007. In addition, NEC expects 30.0 billion yen in consolidated net income,
mainly as a result of an increase in consolidated operating income.
5

Consolidated Target for fiscal year ending
March 31, 2008
Comparison with fiscal year
ended March 31, 2007
In billions of yen
Net sales 4,700.0 +1.0%
Operating income 130.0 +60.0 billion yen
Ordinary income 80.0 +63.7 billion yen
Net income 30.0 +20.9 billion yen
<2> Results by business segments (including inter-segment transactions and profit/loss
figures)
Sales and operating income of NEC’s main segments were as follows (figures in
brackets denote increases or decreases as compared with the previous fiscal year):
IT/Network Solutions Business
Sales: 2,758.8 billion yen (-0.1%)
Operating income: 154.1 billion yen (- 26.8 billion yen)
Sales by subsegment (including inter-segment transactions)
Subsegment Fiscal year ended
March 31, 2007
Fiscal year ended
March 31, 2006
Change
In billions of yen In billions of yen %
IT Services/System Integration 775.6 771.2 +0.6
IT Platforms 651.4 683.6 -4.7
Network Systems 1,026.3 992.9 +3.4
Social Infrastructure 305.5 314.7 -2.9
Total 2,758.8 2,762.4 -0.1
6
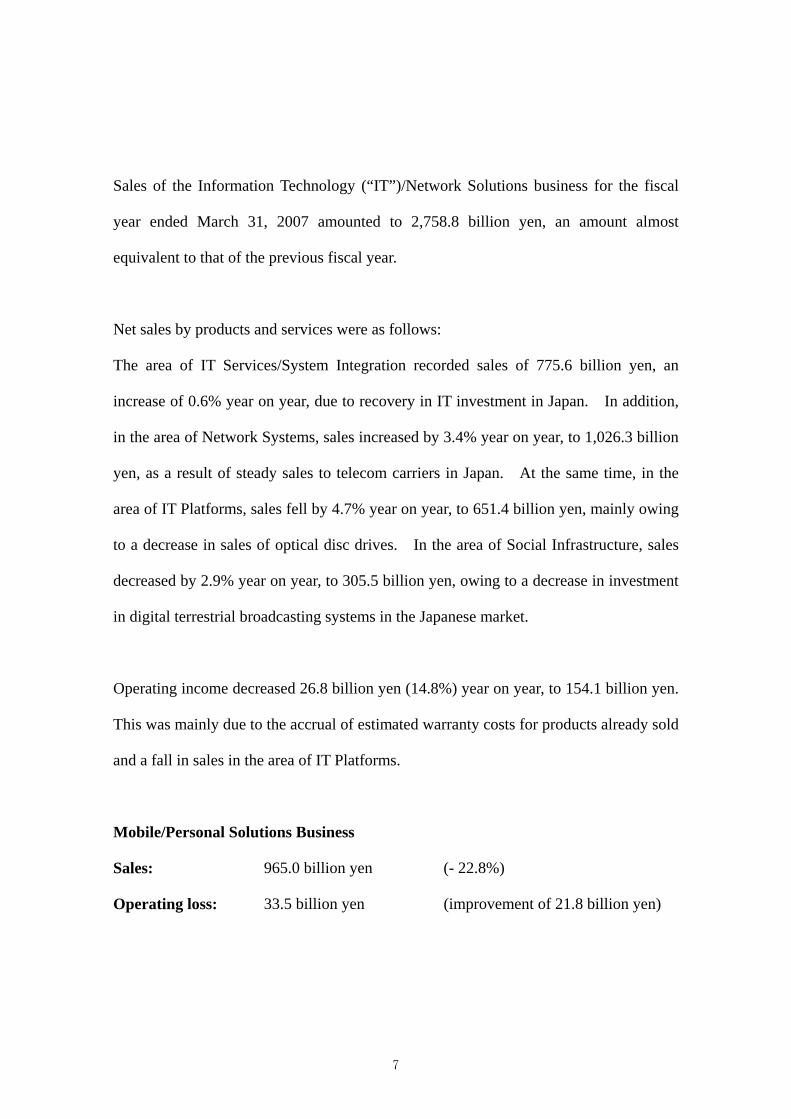
Sales of the Information Technology (“IT”)/Network Solutions business for the fiscal
year ended March 31, 2007 amounted to 2,758.8 billion yen, an amount almost
equivalent to that of the previous fiscal year.
Net sales by products and services were as follows:
The area of IT Services/System Integration recorded sales of 775.6 billion yen, an
increase of 0.6% year on year, due to recovery in IT investment in Japan. In addition,
in the area of Network Systems, sales increased by 3.4% year on year, to 1,026.3 billion
yen, as a result of steady sales to telecom carriers in Japan. At the same time, in the
area of IT Platforms, sales fell by 4.7% year on year, to 651.4 billion yen, mainly owing
to a decrease in sales of optical disc drives. In the area of Social Infrastructure, sales
decreased by 2.9% year on year, to 305.5 billion yen, owing to a decrease in investment
in digital terrestrial broadcasting systems in the Japanese market.
Operating income decreased 26.8 billion yen (14.8%) year on year, to 154.1 billion yen.
This was mainly due to the accrual of estimated warranty costs for products already sold
and a fall in sales in the area of IT Platforms.
Mobile/Personal Solutions Business
Sales: 965.0 billion yen (- 22.8%)
Operating loss: 33.5 billion yen (improvement of 21.8 billion yen)
7

Sales by subsegment (including inter-segment transactions)
Subsegment Fiscal year ended
March 31, 2007
Fiscal year ended
March 31, 2006
Change
In billions of yen In billions of yen %
Mobile Terminals 349.9 480.9 -27.2
Personal Solutions 615.1 769.4 -20.1
Total 965.0 1,250.3 -22.8
Sales in the Mobile/Personal Solutions business for the fiscal year ended March 31,
2007 were 965.0 billion yen, a decrease of 285.3 billion yen (22.8%) year on year.
Net sales by products and services were as follows:
In the area of Mobile Terminals, sales were 349.9 billion yen, a decrease of 27.2% year
on year. In addition to streamlining of overseas business, this was due to a decrease of
shipments in Japan. In the area of Personal Solutions, sales fell by 20.1% year on year,
to 615.1 billion yen. This was due to the sale of the PC business in Europe and
stagnant growth in the Japanese PC market.
Despite an improvement in profit of 21.8 billion yen (39.5%) year on year mainly due to
reduced loss as a result of streamlining of overseas business in the area of Mobile
Terminals, the Mobile/Personal Solutions business recorded an operating loss of 33.5
billion yen.
8

Electron Devices Business
Sales: 861.0 billion yen (+ 5.5%)
Operating loss: 23.0 billion yen (Improvement of 7.8 billion yen)
Sales by subsegment (including inter-segment transaction)
Subsegment Fiscal year ended
March 31, 2007
Fiscal year ended
March 31, 2006
Change
In billions of yen In billions of yen %
Semiconductors 692.3 646.0 +7.2
Electronic Components and
Others 168.7 169.9 -0.7
Total 861.0 815.9 +5.5
Sales of the Electron Devices business for the fiscal year ended March 31, 2007
amounted to 861.0 billion yen, an increase of 45.1 billion yen (5.5%) year on year.
Net sales by products and services were as follows:
In the area of Semiconductors, sales amounted to 692.3 billion yen, an increase of 7.2%
year on year. This was mainly due to an increase in sales of semiconductors for games
consoles and general purpose microcontrollers. In the area of Electronic Components
and Others, although there was steady overall demand in the market for electronic
components, sales fell by 0.7% year on year, to 168.7 billion yen, owing to a decrease in
sales of small-sized liquid crystal displays, for which there were large-scale orders in
the previous fiscal year.
9
Although profit improved year on year by 7.8 billion yen (25.2 %), there was an
operating loss of 23.0 billion yen in the Electron Devices business. This was mainly
due to the effect of product price decline, the recording of expenses to improve
profitability, an increase in research and development costs, and investment to enhance
manufacturing capabilities in the area of Semiconductors, despite an increase in sales in
this area.
(Note)
The results for the area of Semiconductors are the official public figures of NEC Electronics
Corporation, which are prepared in accordance with U.S. GAAP. The difference that arises as
a result of the adjustment to Japan GAAP is included in Electronic Components and Others.
2. Analysis of Financial Condition
<1> Analysis of condition of assets, liabilities, net assets, and cash flow
Total assets at the end of the fiscal year ended March 31, 2007 were 3,731.7 billion yen,
a 71.1 billion yen decrease year on year. Despite an increase of 16.2 billion yen in
notes and accounts receivable, trade, current assets decreased by 51.7 billion yen,
mainly owing to a decrease in cash and cash equivalents of 29.0 billion yen and a
decrease in other current assets of 47.5 billion yen, mainly due to a decrease in accounts
receivable, others. Fixed assets at the end of the fiscal year ended March 31, 2007
10

decreased by 19.4 billion yen year on year, mainly due to a decrease of 21.3 billion yen
in prepaid pension expenses, a decrease of 35.5 billion yen in investment securities
through the sale of stock, and a decrease of 53.7 billion yen in long-term deferred tax
assets mainly as a result of the recording of valuation allowance, despite an increase of
111.5 billion yen in stock of affiliated companies accompanying cancellation of a part of
the pension trust.
Total liabilities at the end of the fiscal year ended March 31, 2007 were 2,491.5 billion
yen, a decrease of 68.6 billion yen year on year. This was mainly due to a decrease in
the balance of interest-bearing debt by 75.8 billion yen, to 859.3 billion yen, owing to
the redemption of bonds. Debt-equity ratio as of March 31, 2007 was 0.83 (an
improvement of 0.08 points as compared with the end of the previous fiscal year). The
balance of interest-bearing debt (net), obtained by offsetting the balance of
interest-bearing debt with the balance of cash and cash equivalents, amounted to 435.9
billion yen as of March 31, 2007, a reduction of 46.8 billion yen as compared with the
end of the previous fiscal year. Net debt-equity ratio was 0.42 (an improvement of 0.05
points as compared with the end of the previous fiscal year) as of March 31, 2007.
Total net assets at the end of the fiscal year ended March 31, 2007 were 1,240.1 billion
yen, a decrease of 2.5 billion yen year on year. As a result, owner's equity ratio as of
March 31, 2007 was 27.8% (an improvement of 0.7 points as compared with the end of
the previous fiscal year).
Net cash provided by operating activities for the fiscal year ended March 31, 2007 was
11

238.3 billion yen, an increase of 12.5 billion yen as compared with the previous fiscal
year. Although there was a decrease in cash received owing to a fall in sales, this was
mainly due to a decrease in cash used in payment of material costs as a result of cost
reductions.
Net cash used in investing activities for the fiscal year ended March 31, 2007 was 169.7
billion yen, a worsening of 85.0 billion yen year on year. This was mainly due to an
increase in cash used for capital expenditure relating to semiconductors, and a decrease
in cash provided by the sale of stock of affiliated companies as compared with the
previous fiscal year. As a result, free cash flows (the sum of cash flows from operating
activities and investing activities) for the fiscal year ended March 31, 2007 were cash
inflows of 68.6 billion yen, a worsening of 72.5 billion yen as compared with the
previous fiscal year.
Net cash used in financing activities for the fiscal year ended March 31, 2007 was 103.7
billion yen, mainly owing to the redemption of bonds and the payment of dividends.
As a result, cash and cash equivalents at the end of the fiscal year ended March 31, 2007
amounted to 423.4 billion yen, a decrease of 29.0 billion yen year on year.
12

<2> Changes in cash flow-relating indices
Year ended
March 31, 2007
Year ended
March 31, 2006
Owner’s equity ratio 27.8% 27.1%
Owner’s equity ratio on
market value basis
34.3% 43.3%
Cash flow to interest-bearing
debt ratio
3.8 times
Interest coverage ratio 14.7 times 13.4 times
Calculation methods for the above indices:
Owner’s equity ratio:
Owner’s equity at the end of each fiscal year / total assets at the end of each fiscal year
Owner’s equity ratio on market value basis:
Aggregated market value of owner's equity at the end of each fiscal year / total assets at
the end of each fiscal year
Cash flow to interest-baring debt ratio:
Average balance of interest-bearing debt / cash flows from operating activities
* Average balance of interest-bearing debt = (balance of interest-bearing debt at the
beginning of the fiscal year + balance of interest-bearing debt at the end of the fiscal
year) /2
13

Interest coverage ratio:
Cash flows from operating activities / interest expense
* The above indices do not show the figures for the cash flow to interest-bearing debt
ratio for the fiscal year ended March 31, 2006 as NEC’s audited consolidated financial
statements for the aforementioned fiscal year were not prepared under Japan GAAP.
3. Fundamental Policy on Distribution of Profits, and Dividends for the Fiscal Year
Ended March 31, 2007 and Fiscal Year Ending March 31, 2008
As NEC needs to adopt a flexible policy in order to better respond to the rapidly
changing business environment, NEC considers, among other factors, the following
factors in determining its cash dividends: the profits earned in the relevant fiscal period;
the financial outlook for the following fiscal periods, the dividend payout ratio, and the
internal demand for funds such as capital expenditures.
NEC will pay an annual dividend of 8 yen per share of common stock for the full year
ended March 31, 2007 (including an interim dividend of 4 yen per share of common
stock). NEC plans to pay an annual dividend of 8 yen per share of common stock for
the year ending March 31, 2008 (including an interim dividend of 4 yen per share of
common stock).
In addition, NEC may determine distribution of the surplus dividend flexibly through
14

resolutions of the Board of Directors in accordance with its Articles of Incorporation.
NEC will pay dividends twice annually, with the record dates of March 31 and
September 30, as in the past.
4. Risk Factors
The NEC Group's business is subject to many risks. The principal risks affecting the
NEC Group’s business are described briefly below.
<1> Intense competition
The NEC Group is subject to intense competition in many of the markets in which it
operates from various competitors ranging from large multinational corporations to
relatively small, rapidly growing, and highly specialized companies. The entrance of
additional competitors into the markets in which the NEC Group operates increases the
risk that the NEC Group's products and services will become subject to intense price
competition.
<2> Risk related to production process
The computer, communications, semiconductor, and other markets in which the NEC
Group operates are characterized by the introduction of products with short life cycles
in a rapidly changing technological environment. Production processes are highly
15

complex, require advanced and costly equipment, and must continuously be modified to
improve yields and performance. If production is interrupted by the defects,
malfunction or other failure of manufacturing facilities, the NEC Group may not be able
to shift production to other facilities quickly, and customers may purchase products
from other suppliers. The shortage of manufacturing capacity for some products could
adversely affect the NEC Group’s ability to compete. The resulting reductions in
revenues and damage to customer relationships could be significant. In addition,
during downturns, customers generally do not order products as far in advance of the
scheduled shipment date as they do when the industry is operating closer to capacity,
making it difficult to forecast production levels and revenues.
<3> Risk related to Semiconductor business
The market for semiconductors has a highly cyclical nature called a "silicon cycle" and
has suffered downturns from time to time. Downturns have been characterized by
diminished demand, excess inventories, and accelerated erosion of prices. Although
the NEC Group operates its business while carefully monitoring the cycle of the market,
downswing of the silicon cycle may have adverse effects on its operating results.
<4> Influence of economic conditions
The NEC Group’s business is highly dependent on the Japanese market. If the
Japanese economy were to again become sluggish, there could be a significant impact
on the NEC Group's financial results. The NEC Group also depends on markets
16

outside Japan, and its financial results are therefore subject to negative economic
developments in foreign countries.
<5> Laws and Government Policies
In many of the countries and regions in which the NEC Group operates, its business is
subject to various risks associated with unexpected regulatory changes and application
of laws, and uncertainty in their applications by government authorities, in addition to
uncertainty relating to governmental legal liabilities. Substantial changes in the
regulatory or legal environments in which the NEC Group operates could adversely
affect its business, operating results, and financial condition.
<6> Defects in products and services
There is a risk that defects may occur in the NEC Group's products and services. The
occurrence of these defects could make the NEC Group liable for damages caused by
these defects, including consequential damages. Negative publicity concerning such
defects could also discourage customers from purchasing the NEC Group's products and
services. Both could hurt the NEC Group's business, operating results, and financial
condition.
<7> Risk related to foreign currency exchange
Foreign exchange rate fluctuations may negatively impact the NEC Group’s business,
operating results, and financial condition. Changes in exchange rates can affect the
17

yen value of the NEC Group's equity investments and monetary assets and liabilities
arising from business transactions in foreign currencies. They can also affect the costs
and sales proceeds of products or services that are denominated in foreign currencies.
<8> Technological advances and response to customer needs
If the NEC Group fails to keep up with rapid technological changes and changes in
customers' needs, and to offer and support products and services (including new
products and new services) in response to such changes, the NEC Group's business,
operating results and financial condition may be adversely affected. In addition, the
development process could be lengthier than originally planned, and require the NEC
Group to commit many more resources. Furthermore, technology and standards may
change while the NEC Group is in a development stage, rendering the NEC Group's
products obsolete or uncompetitive before their introduction to the market.
<9> Finance and profit fluctuations
Any quarterly or yearly operating results of the NEC Group are not necessarily
indicative of results expected in future periods. Operating results of the NEC Group
have historically been, and are expected to continue to be, subject to quarterly and
yearly fluctuations as a result of a wide variety of factors, including the introduction and
market acceptance of new technologies, products, and services; variations in product
costs, the mix of products sold; the scale and timing of customer orders which in turn
will often depend on the success of customers' businesses or specific products and
18
services; the impact of acquired businesses and technologies; manufacturing capacity
and lead times; and fixed costs.
There are other trends and factors beyond the control of the NEC Group which may
affect the NEC Group's operations, and make it difficult to predict operating results for
a particular period, include the following:
! Adverse changes in the conditions in the markets of the products and services that
the NEC Group offers;
! Governmental decisions regarding the development and deployment of
communications and technology infrastructure, including the timing and scale of
governmental expenditures in these areas;
! Timing and scale of capital expenditures by customers of the NEC Group;
! Inventory practices of the NEC Group's customers;
! Conditions in the broader IT and communications markets or in the Japanese or
global economies;
! Changes in governmental regulation or intervention affecting communications,
data networking, or the Internet;
! Conditions in the public and private equity and debt markets; and
! Adverse changes in the credit quality of customers and suppliers of the NEC
Group.
These trends and factors could have a material adverse effect on the business, operating
results, and financial condition of the NEC Group.
19

<10> Risk related to intellectual property rights
The NEC Group depends on its proprietary technology and its ability to obtain patents,
licenses, and other intellectual property rights covering its products, services, business
models, and design and manufacturing processes. However, the protection afforded by
the NEC Group’s intellectual property rights, such as patents, and copyrights, may be
undercut by rapid changes in technologies in the industries in which the NEC Group
operates. Similarly, there can be no assurance that claims allowed on any future
patents will be sufficiently broad to protect the NEC Group’s technology. Effective
protection of intellectual property rights including trade secrets may be unavailable or
limited in some countries, and the NEC Group’s trade secrets may be vulnerable to
disclosure or misappropriation by employees, contractors, and other persons. In
addition, there may be cases of blatant disregard of the NEC Group’s intellectual
property rights, in which inferior, pirated products damage its brand image.
<11> Legal proceedings
From time to time, due to the nature of their business, NEC Group companies are
involved in various lawsuits and legal proceedings, including intellectual property
infringement claims. Due to the existence of a large number of intellectual property
rights in the fields of the NEC Group and the rapid rate of issuance of new
intellectual property rights, it is difficult to determine in advance whether a product
or any of its components may infringe upon the intellectual property rights of others.
Whether or not intellectual property infringement claims against the NEC Group
20
companies have merits, significant financial and management resources may be
required to defend the NEC Group from such claims. If an intellectual property
infringement claim by a third party is successful, and the license for the infringed
technology or substitutable non-infringing technology cannot be obtained, the business
of the NEC Group could be adversely affected.
The NEC group may also from time to time become involved in various lawsuits and
legal proceedings other than intellectual property infringement claims.
NEC Electronics America, Inc., a consolidated subsidiary of NEC, has been named as
one of the defendants in a number of class action civil antitrust lawsuits filed by direct
and indirect purchasers of dynamic random access memory (“DRAM”) and the
Attorneys General of a number of the states in the U.S., seeking damages for alleged
antitrust violations in the U.S. DRAM industry. The NEC Group has entered into
settlement agreements with a number of the customers to which it sold DRAM in the
past (including plaintiffs’ representatives in direct purchaser class actions), but
settlement negotiations with some customers are still underway.
In addition, the NEC Group is fully cooperating with the European Commission in an
investigation of potential violations of European competition laws in the DRAM
industry. Although the final outcome has not been reached at this time in connection
with the civil lawsuits or settlement negotiations in the U.S. or the investigations by the
European Commission, the NEC Group has provided an accrual in a reasonably
estimated amount in connection with the civil lawsuits and settlements with customers
21

in the U.S.
In addition to the above, since October 2006, the NEC Group has been among the
parties subject to investigations by the U.S. Department of Justice (“DOJ”) and the
European Commission regarding potential violations of antimonopoly laws (antitrust
and competition laws) in the static random access memory (“SRAM”) industry;
investigations by the Korea Fair Trade Commission regarding potential violations of
Korean competition laws in the semiconductor industry; and investigations by the Japan
Fair Trade Commission (“JFTC”), the DOJ, the European Commission, the Korea Fair
Trade Commission, and the Competition Bureau Canada regarding potential violations
of antimonopoly laws (antitrust and competition laws) in the TFT liquid crystal display
industry. Following the commencement of investigations by the DOJ regarding
potential antitrust violations in the SRAM industry, NEC Electronics America, Inc. has
been named as one of the defendants in a number of class action civil antitrust lawsuits
seeking damages for alleged antirust violations. Furthermore, following the
commencement of investigation by the DOJ regarding potential antitrust violations in
TFT liquid crystal display industry, NEC, NEC LCD Technologies, Ltd., NEC
Electronics America, Inc., and NEC Display Solutions of America, Inc. have been
named as defendants in a number of class action civil antitrust lawsuits seeking
damages for alleged antitrust violations. At present, no conclusions have yet to be
reached in these investigations by authorities and civil lawsuits.
In Japan, NEC received from the Tokyo High Court a judgment to annul a decision by
the JFTC to issue a cease and desist order with respect to NEC's bids for automatic
22
letter processing systems ordered by the Ministry of Posts and Telecommunications
(currently, Japan Post). The JFTC filed an appeal with the Supreme Court of Japan
with respect to such judgment, but on April 19, 2007, and as a result, the Supreme Court
rendered a judgment on April 19, 2007 that the original judgment be reversed, and
remanded to the Tokyo High Court. NEC has also attended hearings on the JFTC's
surcharge payment orders against NEC.
It is difficult to foresee the results of legal actions and proceedings currently involving
the NEC Group or of those which may arise in the future, and an adverse result in these
matters could have a significant negative effect on the NEC Group's business,
performance, or financial condition.
In addition, any legal or administrative proceedings which we are subject to could
require the significant involvement of senior management of the NEC Group, and may
divert management attention from the NEC Group's business and operations.
<12> Risk related to natural disasters
If any of the NEC Group's facilities and buildings were to suffer catastrophic damage
from earthquakes or other natural disasters, it could disrupt the NEC Group's operations
and delay production and shipments, which would in turn bring about reduced revenue,
and result in large losses and expenses to repair or replace the facilities.
23

<13> Risk related to material procurement
The NEC Group’s manufacturing operations depend on obtaining deliveries of raw
materials, components, equipment, and other supplies in a timely manner. Because the
products that the NEC Group purchases are often complex or specialized, it may be
difficult for the NEC Group to substitute one supplier for another or one product for
another, as some products are only available from a limited number of suppliers or a
single supplier. Delays or interruptions in the supply of products to the NEC Group or
unexpected increases in industry demands could result in shortages of essential
materials. The NEC Group’s results of operations would suffer if the NEC Group
could not obtain adequate delivery of these supplies in a timely manner, or if the NEC
Group had to pay significantly more for them. In addition, the possibility of defective
raw materials, components, equipment, or other supplies could adversely affect the
reliability and reputation of the NEC Group’s products.
<14> Risk related to potential acquisitions and investments
From time to time, the NEC Group takes advantage of opportunities to expand its
business through acquisitions and investments. Any acquisition that the NEC Group
pursues exposes it to the risk that it might be unable to integrate new businesses with its
culture and strategies. The NEC Group also cannot be certain that it will be able to
retain the customers of a business that it acquires or key employees. Furthermore, the
NEC Group may not be able to achieve the benefits that it expects from a particular
acquisition. The NEC Group's business, operating results, and financial condition may
24

suffer if the company fails to allocate its resources effectively and appropriately to meet
the respective requirements of both its existing businesses and any businesses it may
acquire.
<15> Dependence on the NTT Group
The NEC Group derived approximately 11.1% of its net sales in the fiscal year ended
March 31, 2007 from NIPPON TELEGRAPH AND TELEPHONE CORPORATION,
NTT DoCoMo, Inc., and their affiliates ("The NTT Group"). If the NTT Group were to
reduce its level of capital expenditures or current procurement from the NEC Group, its
business, operating results and financial condition may be adversely affected. In
addition, the NEC Group's business may be adversely affected if the NTT Group began
to manufacture products that the NEC Group supplies or acquired a competitor of the
NEC Group.
<16> Shortage in reserve for pension and retirement benefits
The NEC Group has amortized unrecognized prior service costs and actuarial losses over
the average remaining service period of employees expected to receive benefits under
these plans. The amount of actuarial loss may change depending on future changes in
the discount rate or other factors such as the return on plan assets.
<17> Risk related to deferred tax assets
25
The NEC Group currently has deferred tax assets resulting from net operating loss carry
forwards and deductible temporary differences, both of which will reduce taxable
income in the future.
In the event of a deterioration in market conditions or results of operations, in which
NEC determines that all or part of such deferred tax assets are unlikely to be realized, an
adjustment to deferred tax assets may be made and the NEC Group’s income could be
decreased for the period of adjustment.
<18> Risk related to information management
The NEC Group possesses a voluminous amount of personal information and
confidential information in connection with the operation of its business. There is
always a possibility that such information may be leaked or improperly accessed and
subsequently misused, and if such an event occurs, it could negatively affect the NEC
Group's reputation, consume significant financial resources to resolve the situation, and
lower the NEC Group's brand value, thereby hurting the NEC Group's operating results.
<19> Risk related to fraudulent acts and mistakes
It is essential for the NEC Group to maintain effective internal controls and corporate
compliance functions, as well as accounting systems to enable the management of the
NEC Group's assets and operations. Furthermore, under the U.S. Sarbanes-Oxley Act
of 2002, which applies to NEC, NEC is required to establish internal control over the
26
NEC Group's financial reporting and NEC's management is required to assess the
effectiveness of the NEC Group's internal control over financial reporting and disclose
whether such internal control is effective.
The NEC Group's auditors must conduct audits to evaluate management's assessment of
the effectiveness of the internal controls over financial reporting, and then must render
an opinion on the NEC Group's assessment and the effectiveness of its internal controls
over financial reporting.
Designing and implementing an effective system of internal controls capable of
monitoring and managing the NEC Group's business and operations represents a
significant challenge for the NEC Group. The NEC Group is taking action to improve
and strengthen its internal controls systems by expanding documentation of the financial
reporting system, and by implementing stronger internal financial audit and internal
operational audit functions. However, the NEC Group may discover possible
fraudulent acts such as false financial reporting or embezzlement, or mistakes resulting,
for example, from insufficient implementation of internal controls related to financial
reporting. Such events would require adjustments to financial statements and could
decrease the NEC Group’s income.
For example, in March 2006, NEC announced that it had discovered certain fictitious
purchases and sales that were made by an employee of an NEC subsidiary. In
consideration of the impact of such fictitious transactions on NEC’s consolidated
financial statements, as well as changes in accounting processes and the assumptions
27

behind financial results, NEC has disclosed the preliminary adjustment amounts
(audited under Japan GAAS and not PCAOB standards) on its consolidated financial
statements under U.S. GAAP for past fiscal years.
The internal control framework to be implemented by the NEC Group will need to be
able to identify and prevent similar occurrences on a group-wide basis. The design
and implementation of internal controls may require significant management and human
resources, and result in considerable costs.
<20> Risk related to restatement of past financial statements
Pursuant to the U.S. Securities and Exchange Act of 1934, NEC is required to file its
annual reports with the SEC as an issuer of American Depositary Receipts ("ADRs").
However, NEC failed to file its annual report with the SEC for the fiscal year ended
March 31, 2006 ("2006 Annual Report") by the filing deadline of October 2, 2006.
This is because NEC was not able to complete its analysis to support its revenue
recognition, which was requested during the audit procedure of its consolidated
financial statements. There is a risk that NEC may not be able to file its annual report
with the SEC for some time, in which case The Nasdaq Stock Market, Inc.
(“NASDAQ”) may determine to delist NEC's ADRs.
Depending on the results of the analysis that is currently underway, NEC may be
required to restate the financial statements included in its annual reports filed with the
SEC for, or prior to, the fiscal year ended March 31, 2005 to reflect the results of the
analysis. Such a restatement would be in addition to the restatement already required
28

(but not yet complete nor audited) to adjust for the false transactions at an NEC
subsidiary, as described in �<19> Risk related to fraudulent acts and mistakes” above, as
well as restatements for other necessary adjustments and for certain discontinued
operations.
If a restatement is required as a result of the current analysis, a restatement of
consolidated financial statements included in the Annual Securities Report
(“Yukashoken Hokokusho”) filed under the Securities Exchange Law of Japan for, or
prior to, the fiscal year ended March 31, 2006 may also be required. Necessary
corrections may also be required for other documents that include consolidated financial
results that require restatement.
Furthermore, NEC is subject to an informal inquiry by the SEC, and the SEC may
impose sanctions under the U.S. securities law against NEC depending on the results of
any such inquiry. In the event that NEC is unable to prepare the audited financial
statements necessary to file its 2006 Annual Report with the SEC, it could face certain
penalties and other consequences owing to this failure.
Management Policy
1. Fundamental Management Policy
IT and network technology have become indispensable to our daily lives, enterprises,
and national and local governments. Due to advancements in broadband (high speed,
29

large capacity networks and related services) and mobile (accessibility via mobile
information terminals) technology and the convergence of IT and network technologies,
a “ubiquitous networked society” is being realized, in which necessary information can
be exchanged anytime, anywhere through various information and telecommunication
devices.
Furthermore, it is anticipated that NGNs will provide the platform to create a
convenient, comfortable, and safe and secure society, a variety of new services will be
born on this platform, and the markets not only for telecommunications and service
providers, but also for enterprises utilizing NGNs will be revitalized.
In order to enable individuals to spend safe, happy and rich lives, and enterprises to
enhance their competitiveness and management efficiency by utilizing IT and networks
in this new society, the NEC Group, under the corporate slogan “Empowered by
Innovation,” intends to contribute to realizing the new potential of people and society
through continuing innovation for “improved customer satisfaction.”
The NEC Group aims to provide solutions of true value for its customers and to
contribute to the realization of a ubiquitous networked society through its IT/Network
Solutions business and Mobile/Personal Solutions business as well as Electron Devices
business, including semiconductors.
Finally, the NEC Group aims at sustained growth of society and enterprises by fulfilling
its social responsibility as a good corporate citizen. At the same time, the NEC Group
30

is working to increase its corporate value acknowledging its duty toward its
stakeholders including its shareholders, customers, and employees.
2. Management Indicator Goal’s
The NEC Group aims to realize certain operating results as an excellent, global
corporate group, and attaches paramount importance to ROE as a management indicator
for expanding profitability.
NEC has set a concrete goal of 15% ROE, and aims to achieve this goal leveraging new
business opportunities in the changing business environment, such as the realization of a
ubiquitous networked society and the advancement of NGNs.
3. Mid- to Long-Term Business Strategy
As there are no material changes from the contents disclosed in the amendment of the
consolidated financial results for the first half of the fiscal year ended March 31, 2007,
disclosed on December 22, 2006, this section has been omitted. The aforementioned
financial results are available at the below URL.
NEC’s website
http://www.nec.co.jp/press/en/0612/2201.html
(Tokyo Stock Exchange website “Company Search”)
31

http://www.tse.or.jp/tseHpFront/HPLCDS0101E.do?method=init&callJorEFlg=1
* NEC’s code is 6701.
4. Challenges to be addressed by NEC Group
Through the advancement of IT and network technologies, a ubiquitous networked
society, which enables interchange of necessary information via a variety of information
communication devices at anytime, and anywhere, is now being realized. In addition,
it is anticipated that NGNs will become the platform to create a convenient, comfortable,
and safe and secure society, and a variety of new services will be created on this
platform.
Embracing these changes in the business environment as new business opportunities,
the NEC Group will promote further growth through the provision of total solutions,
leveraging its world-class technological competence in the three business domains of
IT/Network Solutions, Mobile/Personal Solutions, and Electron Devices.
To be more exact, leveraging NGNs, the NEC Group will create a wide variety of
solutions that will be useful for the realization of a ubiquitous networked society in
areas such as national and local governments, communications and media, distribution,
finance, transport, and medical care as well as telecom carriers. Along with expanding
its business in markets revitalized by NGNs, the NEC Group will expand the product
and device businesses that support NGNs, aiming for increasing profitability in its
NGN-related businesses which mainly provide service platforms.
32
In addition, it is necessary to further expand the global businesses of the NEC Group in
order to promote its enhanced growth. The NEC Group is currently strengthening its
operating bases by realigning overseas subsidiaries in the United States, Europe and
Asia, aiming to create synergy in each country or region, and strengthening its sales and
technical support structure. The NEC Group will carry out aggressive sales activities
in overseas markets, focusing primarily on mobile communication systems in the area
of Network Systems, and on competitive solutions and products, such as thin client
systems, in the areas of IT Services/System Integration and IT Platforms.
Furthermore, to increase profitability, in addition to further strengthening ongoing
production innovation in the software development divisions and product manufacturing
divisions, the NEC Group is aiming to secure profitability in the mobile terminal area
through acceleration of mobile handset development and strengthening of supply chain
management. In addition, in the area of Semiconductors, the NEC Group is
strengthening collaboration between NEC Electronics Corporation and all of the other
NEC Group companies toward steady execution of the restructuring measures disclosed
by NEC Electronics Corporation in February, 2007, such as concentration of its
resources in the digital consumer and automotive areas, and reduction of manufacturing
costs by reorganizing its manufacturing lines in Japan and overseas,
By executing these measures, the NEC Group aims to develop into a global and
innovative corporate group, achieving business growth and enhanced profitability.
NEC changed the accounting principles for preparing its consolidated financial
33
statements under Japanese law from U.S. GAAP to Japan GAAP, as of the first half of
the fiscal year ended March 31, 2007. NEC disclosed its half year financial results
under Japan GAAP at the Tokyo Stock Exchange, Inc., etc. in November, 2006, and
corrected these financial results in December 2006. Taking this matter seriously, NEC
has already implemented corrective measures, such as the use of a consolidated
accounting system designed to comply with Japan GAAP, and the creation and
familiarization of an accounting manual that lays out a unified accounting method for
the NEC Group. Furthermore, the NEC Group is promoting improvement of its
disclosure structure by implementing a series of measures described in the Improvement
Report submitted to the Tokyo and other stock exchanges in Japan concerning the
correction of its financial results, such as the enhancement of information systems and
an increase of the number and enhanced training of personnel in accounting divisions.
NEC will continue to gather necessary transaction data and is conducting the analysis
required for the audit of its consolidated financial statements to be included in its annual
report for the fiscal year ended March 31, 2006, to be filed with the SEC, and is
working diligently to regain its status of compliance by filing the report as early as
possible.
NEC's ADRs are currently subject to review by NASDAQ for delisting from NASDAQ
as a result of the delay in filing of NEC’s annual report with the SEC. NEC will
endeavor to complete and submit the annual report and to maintain the listing of its
ADRs on NASDAQ.
34

CONSOLIDATED BALANCE SHEETS
March 31,2007
March 31,2006
Increase(Decrease)
March 31,2007
Current assets JPY 2,047,681 JPY 2,099,343 (JPY 51,662) $17,353
Cash and deposit 332,446 404,303 (71,857) 2,817
Notes and accounts receivable, trade 874,543 858,328 16,215 7,411
Current securities 91,570 49,242 42,328 776
Inventories 493,224 492,414 810 4,180
Deferred tax assets 114,560 106,243 8,317 971
Other current assets 150,895 198,430 (47,535) 1,279
Allowance for doubtful notes and accounts (9,557) (9,617) 60 (81)
Long-term assets 1,683,988 1,703,432 (19,444) 14,271
Property, plant and equipment 684,529 677,269 7,260 5,801
Buildings and structures 238,677 244,534 (5,857) 2,023
Machinery and equipment 214,833 197,839 16,994 1,821
Tools and other equipment 104,925 104,861 64 889
Land 92,203 91,694 509 781
Construction in progress 33,891 38,341 (4,450) 287
Intangible assets 221,991 236,345 (14,354) 1,881
Goodwill 89,566 79,397 10,169 759
Software 126,339 149,892 (23,553) 1,071
Other intangible assets 6,086 7,056 (970) 51
Investments and other assets 777,468 789,818 (12,350) 6,589
Investment securities 230,504 266,040 (35,536) 1,953
Stock of affiliated companies 221,864 110,319 111,545 1,880
Deferred tax assets 160,810 214,525 (53,715) 1,363
Other 181,098 229,845 (48,747) 1,535
Allowance for doubtful notes and accounts (16,808) (30,911) 14,103 (142)
Total assets JPY 3,731,669 JPY 3,802,775 (JPY 71,106) $31,624
(Note)
*US dollar amounts are translated from yen, for convenience only, at the rate of US$1 = 118 yen.
Cash and cash equivalents in CONSOLIDATED STATEMENTS OF CASH FLOWS are calculated as follows.
(In millions of yen, millions of U.S.dollars)
Cash and deposit JPY 332,446 JPY 404,303 (JPY 71,857) $2,817
Current securities 91,570 49,242 42,328 776
(647) (1,175) 528 (5)
Cash and cash equivalents JPY 423,369 JPY 452,370 (JPY 29,001) $3,588
Time deposit and Current securitieswith maturity of more than three months
(In millions of yen, millions of U.S.dollars)
35

CONSOLIDATED BALANCE SHEETS (CONTINUED)
March 31,2007
March 31,2006
Increase(Decrease)
March 31,2007
Current liabilities JPY 1,695,479 JPY 1,675,308 JPY 20,171 $14,369
Notes and accounts payable, trade 786,899 826,335 (39,436) 6,669
Short-term borrowings 110,385 106,979 3,406 935
Commercial Paper 102,943 35,000 67,943 872
Long-term borrowings (within one year) 41,562 29,777 11,785 352
Bonds payable (within one year) 76,570 129,268 (52,698) 649
Accounts payable, other and accrued expenses 285,039 284,502 537 2,416
Advances from customers 66,730 52,753 13,977 566
Reserve for bonus to directors 401 - 401 3
Current product warranty liabilities 34,459 11,229 23,230 292
Other current liabilities 190,491 199,465 (8,974) 1,615
Long-term liabilities 796,067 884,817 (88,750) 6,746
Bonds payable 443,219 519,791 (76,572) 3,756
Long-term borrowings 42,759 76,268 (33,509) 362
Deferred tax liabilities 11,424 9,661 1,763 97
Accrued pension and severance costs 216,769 197,434 19,335 1,837
Provision for loss on repurchase of computers 16,355 19,532 (3,177) 139
Long-term product warranty liabilities 2,380 840 1,540 20
Provision for recycling expenses of personal computers 5,634 6,137 (503) 48
Other 57,527 55,154 2,373 487
Total liabilities 2,491,546 2,560,125 (68,579) 21,115
Shareholders' equity 972,438 949,915 22,523 8,241
Common stock 337,822 337,821 1 2,863
Additional paid-in capital 464,838 441,155 23,683 3,939
Retained earnings 173,003 173,808 (805) 1,466
Treasury stock (3,225) (2,869) (356) (27)
Valuation and translation adjustments 66,370 79,892 (13,522) 562
Unrealized gains (losses) on marketable securities 57,706 78,128 (20,422) 489
Unrealized gains (losses) on hedging (143) - (143) (1)
Foreign currency translation adjustments 8,807 1,764 7,043 74
Share subscription rights 81 - 81 1
Minority interests 201,234 212,843 (11,609) 1,705
Total net assets 1,240,123 1,242,650 (2,527) 10,509
Total liabilities and net assets JPY 3,731,669 JPY 3,802,775 (JPY 71,106) $31,624
Interest-bearing debt JPY 859,292 JPY 935,103 (JPY 75,811) $7,282Net interest-bearing debt (*1) 435,923 482,733 (46,810) 3,694Owner's equity (*2) 1,038,808 1,029,807 9,001 8,803Owner's equity ratio (%) (*3) 27.8 27.1 0.7Shareholders' equity ratio (%) (*3) 26.1 25.0 1.1Debt-equity ratio (times) (*4) 0.83 0.91 (0.08)Net debt-equity ratio (times) (*4) 0.42 0.47 (0.05)
(Notes)
*1 Net interest-bearing debt is interest-bearing debt less cash and cash equivalents. *2 Owner's equity is total net assets less share subscription rights and minority interests. *3 Owner's equity ratio is owner's equity divided by total assets. Shareholders' equity ratio is shareholders' equity divided by total assets. *4 Debt-equity ratio and net debt-equity ratio are interest-bearing debt and net interest-bearing debt divided by owner's equity, respectively.
(In millions of yen, millions of U.S.dollars)
36
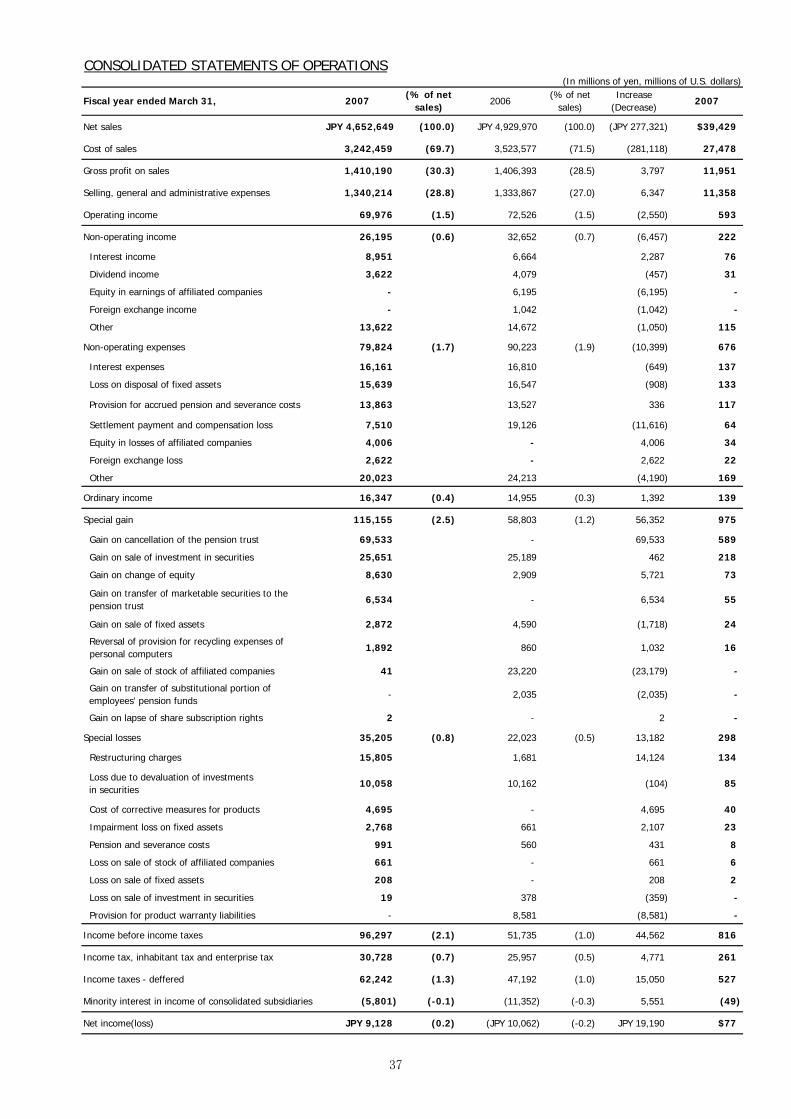
Net sales JPY 4,652,649 (100.0) JPY 4,929,970 (100.0) (JPY 277,321) $39,429
Cost of sales 3,242,459 (69.7) 3,523,577 (71.5) (281,118) 27,478
Gross profit on sales 1,410,190 (30.3) 1,406,393 (28.5) 3,797 11,951
Selling, general and administrative expenses 1,340,214 (28.8) 1,333,867 (27.0) 6,347 11,358
Operating income 69,976 (1.5) 72,526 (1.5) (2,550) 593
Non-operating income 26,195 (0.6) 32,652 (0.7) (6,457) 222
Interest income 8,951 6,664 2,287 76
Dividend income 3,622 4,079 (457) 31
Equity in earnings of affiliated companies - 6,195 (6,195) -
Foreign exchange income - 1,042 (1,042) -
Other 13,622 14,672 (1,050) 115
Non-operating expenses 79,824 (1.7) 90,223 (1.9) (10,399) 676
Interest expenses 16,161 16,810 (649) 137
Loss on disposal of fixed assets 15,639 16,547 (908) 133
Provision for accrued pension and severance costs 13,863 13,527 336 117
Settlement payment and compensation loss 7,510 19,126 (11,616) 64
Equity in losses of affiliated companies 4,006 - 4,006 34
Foreign exchange loss 2,622 - 2,622 22
Other 20,023 24,213 (4,190) 169
Ordinary income 16,347 (0.4) 14,955 (0.3) 1,392 139
Special gain 115,155 (2.5) 58,803 (1.2) 56,352 975
Gain on cancellation of the pension trust 69,533 - 69,533 589
Gain on sale of investment in securities 25,651 25,189 462 218
Gain on change of equity 8,630 2,909 5,721 73
Gain on transfer of marketable securities to the pension trust
6,534 - 6,534 55
Gain on sale of fixed assets 2,872 4,590 (1,718) 24
Reversal of provision for recycling expenses of personal computers
1,892 860 1,032 16
Gain on sale of stock of affiliated companies 41 23,220 (23,179) -
Gain on transfer of substitutional portion of employees' pension funds
- 2,035 (2,035) -
Gain on lapse of share subscription rights 2 - 2 -
Special losses 35,205 (0.8) 22,023 (0.5) 13,182 298
Restructuring charges 15,805 1,681 14,124 134
Loss due to devaluation of investments in securities
10,058 10,162 (104) 85
Cost of corrective measures for products 4,695 - 4,695 40
Impairment loss on fixed assets 2,768 661 2,107 23
Pension and severance costs 991 560 431 8
Loss on sale of stock of affiliated companies 661 - 661 6
Loss on sale of fixed assets 208 - 208 2
Loss on sale of investment in securities 19 378 (359) -
Provision for product warranty liabilities - 8,581 (8,581) -
Income before income taxes 96,297 (2.1) 51,735 (1.0) 44,562 816
Income tax, inhabitant tax and enterprise tax 30,728 (0.7) 25,957 (0.5) 4,771 261
Income taxes - deffered 62,242 (1.3) 47,192 (1.0) 15,050 527
Minority interest in income of consolidated subsidiaries (5,801) (-0.1) (11,352) (-0.3) 5,551 (49)
Net income(loss) JPY 9,128 (0.2) (JPY 10,062) (-0.2) JPY 19,190 $77
CONSOLIDATED STATEMENTS OF OPERATIONS(In millions of yen, millions of U.S. dollars)
(% of netsales)
(% of netsales)
Increase(Decrease)
2007 2006 2007Fiscal year ended March 31,
37

CONSOLIDATED STATEMENTS OF SHAREHOLDERS' EQUITY
Fiscal year ended March 31, 2007 (In millions of yen)
Balance as of March 31, 2006 337,821 441,155 173,808 △ 2,869 949,915
Changes of items during the period
Increase by stock-for-stock exchange 24,382 24,382
Conversion of convertible bond type warrant 1 1 2
Bonus to directors △ 200 △ 200
Dividends △ 14,081 △ 14,081
Net income 9,128 9,128
Purchase of treasury stock △ 558 △ 558
Disposal of treasury stock △ 153 202 49
Changes in the scope of equity method 4,348 4,348
Others △ 547 △ 547
Net changes in items other thanthose in shareholder's equity
-
Total changes of items during the period 1 23,683 △ 805 △ 356 22,523
Balance as of March 31, 2007 337,822 464,838 173,003 △ 3,225 972,438
Balance as of March 31, 2006 78,128 - 1,764 - 212,843 1,242,650
Changes of items during the period
Increase by stock-for-stock exchange 24,382
Conversion of convertible bond type warrant 2
Bonus to directors △ 200
Dividends △ 14,081
Net income 9,128
Purchase of treasury stock △ 558
Disposal of treasury stock 49
Changes in the scope of equity method 4,348
Others △ 547
Net changes in items other thanthose in shareholders' equity
△ 20,422 △ 143 7,043 81 △ 11,609 △ 25,050
Total changes of items during the period △ 20,422 △ 143 7,043 81 △ 11,609 △ 2,527
Balance as of March 31, 2007 57,706 △ 143 8,807 81 201,234 1,240,123
Sharesubscription
rights
Total netassets
Minorityinterests
Shareholders' equity
Commonstock
Treasury stock Total
Foreigncurrency
translationadjustments
Valuation and translation adjustments
Additionalpaid-in capital
Retainedearnings
Unrealized gains(losses) onmarketablesecurities
Unrealized gains(losses) on
hedging
38

Income before income taxes JPY 96,297 JPY 51,735 JPY 44,562 $816
Depreciation 198,398 198,956 (558) 1,681
Equity in (earnings) losses of affiliated companies 4,006 (6,195) 10,201 34
Gain on change of equity (8,630) (2,909) (5,721) (73)
Decrease (increase) in notes and accounts receivable (31,524) (76,683) 45,159 (267)
Decrease (increase) in inventories (14,098) 34,878 (48,976) (119)
Increase (decrease) in notes and accounts payable (24,413) 14,650 (39,063) (207)
Income taxes paid (28,107) (38,042) 9,935 (238)
Other, net 46,389 49,414 (3,025) 393
Net cash provided by operating activities 238,318 225,804 12,514 2,020
Net payment from acquisitions and sales of property, plant andequipment (136,499) (89,990) (46,509) (1,157)
Acquisitions of intangible assets (36,262) (47,635) 11,373 (307)Net proceeds from (payment of) purchases and sales ofsecurities 3,751 51,789 (48,038) 32
Other, net (666) 1,149 (1,815) (6)
Net cash used in investing activities (169,676) (84,687) (84,989) (1,438)
Net proceeds from (repayment of) bonds and borrowings (101,458) (189,883) 88,425 (860)
Dividends paid (14,060) (11,729) (2,331) (119)
Other, net 11,779 1,413 10,366 100
Net cash used in financing activities (103,739) (200,199) 96,460 (879)
Effect of exchange rate changeson cash and cash equivalents 6,096 9,950 (3,854) 51
Net decrease in cash and cash equivalents (29,001) (49,132) 20,131 (246)
Cash and cash equivalents, beginning of period 452,370 501,502 (49,132) 3,834
Cash and cash equivalents, end of period JPY 423,369 JPY 452,370 (JPY 29,001) $3,588
I. Cash flows from operating activities:
Increase(Decrease)
II. Cash flows from investing activities:
III. Cash flows from financing activities:
Fiscal year ended March 31,
CONDENSED CONSOLIDATED STATEMENTS OF CASH FLOWS(In millions of yen, millions of U.S. dollars)
2007 2006 2007
39

Significant accounting policies 1. Significant changes of accounting principles
NEC previously disclosed its consolidated financial results based on the financial statements prepared in accordance with the terms, formats, and preparation methods of accounting principles generally accepted in the U.S. ("U.S. GAAP") pursuant to the provisions of Article 93 (Article 87 ,when it was applied) of the “Regulations Concerning Terminology, Forms, and Method for Preparing Consolidated Financial Statements” (1976 Ministry of Finance Ordinance No. 28; hereinafter the “Regulations Concerning Consolidated Financial Statements”). However, NEC has adopted, starting with the half year period ended September 30, 2006, accounting principles generally accepted in Japan ("Japan GAAP")for preparing and disclosing its consolidated financial statements required under the Japanese Securities and Exchange Law instead of application of Article 93 (Article 87 ,when it was applied) of the Regulations Concerning Consolidated Financial Statements. This change in accounting principles came about as NEC was unable to file its annual report for the fiscal year ended March 31, 2006 (Form 20-F), prepared under U.S. GAAP, with the U.S. Securities and Exchange Commission ("SEC"), pursuant to the U.S. Securities and Exchange Act of 1934, by the predetermined filing deadline.
2. Scope of consolidation
Number of consolidated subsidiaries 342 Major consolidated subsidiaries
NEC Electronics Corporation, NEC Corporation of America, NEC Personal Products, Ltd., NEC Europe Ltd., NEC (China) Co.,Ltd.,NEC Networks and System Integration Corporation, NEC TOKIN Corporation, NEC Infrontia Corporation, NEC Fielding, Ltd., Nippon Avionics Co., Ltd., NEC Mobiling, Ltd.
The consolidated financial statements for the fiscal year ended March 31, 2007 have added 32 companies to consolidation while excluding 46 companies from consolidation, major companies of which are as stated below:
Number of companies categorized as consolidated subsidiaries due to acquisition or establishment 32
Major companies NEC BIGLOBE, Ltd., NEC Electronics Korea Ltd., NEC Philips Unified Solutions B.V., NEC TOKIN Korea Co.,Ltd., and others
Number of companies liquidated or sold 36 Major companies
Hokko Denshi Co., Ltd.,Packard Bell B.V.,NEC USA, NEC Laser & Automation, Ltd., NEC Gotemba Ltd., and others
Number of companies decreased due to merger 10
(Previous) (New) TOKIN Shoko Corporation NEC TOKIN Toyama,Ltd. NEC TOKIN Iwate,Ltd. NEC TOKIN Tochigi,Ltd. NEC TOKIN Hyogo, Ltd. NEC TOKIN Corporation
NEC TOKIN Corporation
NEC America Inc. NEC Solutions (America), Inc.
NEC Corporation of America
NEC Compound Semiconductor Devices, Ltd. NEC Deviceport, Ltd NEC Electronics Corporation
NEC Electronics Corporation
E.Piphany Solutions ABeam System Engineering Ltd.
ABeam System Engineering Ltd.
Qorval Integrated Solutions,Inc. ABeam Consulting (USA) Ltd.
ABeam Consulting (USA) Ltd.
40
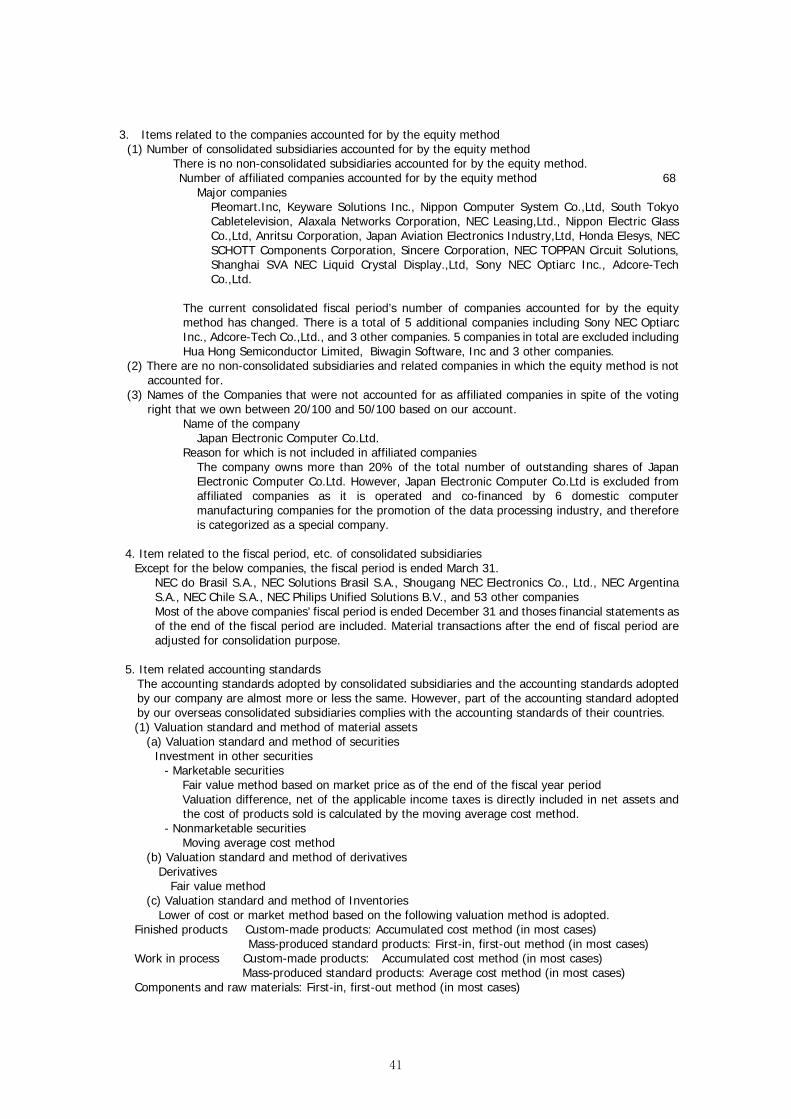
3. Items related to the companies accounted for by the equity method
(1) Number of consolidated subsidiaries accounted for by the equity method There is no non-consolidated subsidiaries accounted for by the equity method. Number of affiliated companies accounted for by the equity method 68
Major companies Pleomart.Inc, Keyware Solutions Inc., Nippon Computer System Co.,Ltd, South Tokyo Cabletelevision, Alaxala Networks Corporation, NEC Leasing,Ltd., Nippon Electric Glass Co.,Ltd, Anritsu Corporation, Japan Aviation Electronics Industry,Ltd, Honda Elesys, NEC SCHOTT Components Corporation, Sincere Corporation, NEC TOPPAN Circuit Solutions, Shanghai SVA NEC Liquid Crystal Display.,Ltd, Sony NEC Optiarc Inc., Adcore-Tech Co.,Ltd.
The current consolidated fiscal period’s number of companies accounted for by the equity method has changed. There is a total of 5 additional companies including Sony NEC Optiarc Inc., Adcore-Tech Co.,Ltd., and 3 other companies. 5 companies in total are excluded including Hua Hong Semiconductor Limited, Biwagin Software, Inc and 3 other companies.
(2) There are no non-consolidated subsidiaries and related companies in which the equity method is not accounted for.
(3) Names of the Companies that were not accounted for as affiliated companies in spite of the voting right that we own between 20/100 and 50/100 based on our account.
Name of the company Japan Electronic Computer Co.Ltd.
Reason for which is not included in affiliated companies The company owns more than 20% of the total number of outstanding shares of Japan Electronic Computer Co.Ltd. However, Japan Electronic Computer Co.Ltd is excluded from affiliated companies as it is operated and co-financed by 6 domestic computer manufacturing companies for the promotion of the data processing industry, and therefore is categorized as a special company.
4. Item related to the fiscal period, etc. of consolidated subsidiaries
Except for the below companies, the fiscal period is ended March 31. NEC do Brasil S.A., NEC Solutions Brasil S.A., Shougang NEC Electronics Co., Ltd., NEC Argentina S.A., NEC Chile S.A., NEC Philips Unified Solutions B.V., and 53 other companies Most of the above companies’ fiscal period is ended December 31 and thoses financial statements as of the end of the fiscal period are included. Material transactions after the end of fiscal period are adjusted for consolidation purpose.
5. Item related accounting standards
The accounting standards adopted by consolidated subsidiaries and the accounting standards adopted by our company are almost more or less the same. However, part of the accounting standard adopted by our overseas consolidated subsidiaries complies with the accounting standards of their countries. (1) Valuation standard and method of material assets (a) Valuation standard and method of securities
Investment in other securities - Marketable securities Fair value method based on market price as of the end of the fiscal year period Valuation difference, net of the applicable income taxes is directly included in net assets and
the cost of products sold is calculated by the moving average cost method. - Nonmarketable securities Moving average cost method (b) Valuation standard and method of derivatives Derivatives Fair value method (c) Valuation standard and method of Inventories Lower of cost or market method based on the following valuation method is adopted. Finished products Custom-made products: Accumulated cost method (in most cases) Mass-produced standard products: First-in, first-out method (in most cases) Work in process Custom-made products: Accumulated cost method (in most cases) Mass-produced standard products: Average cost method (in most cases) Components and raw materials: First-in, first-out method (in most cases)
41
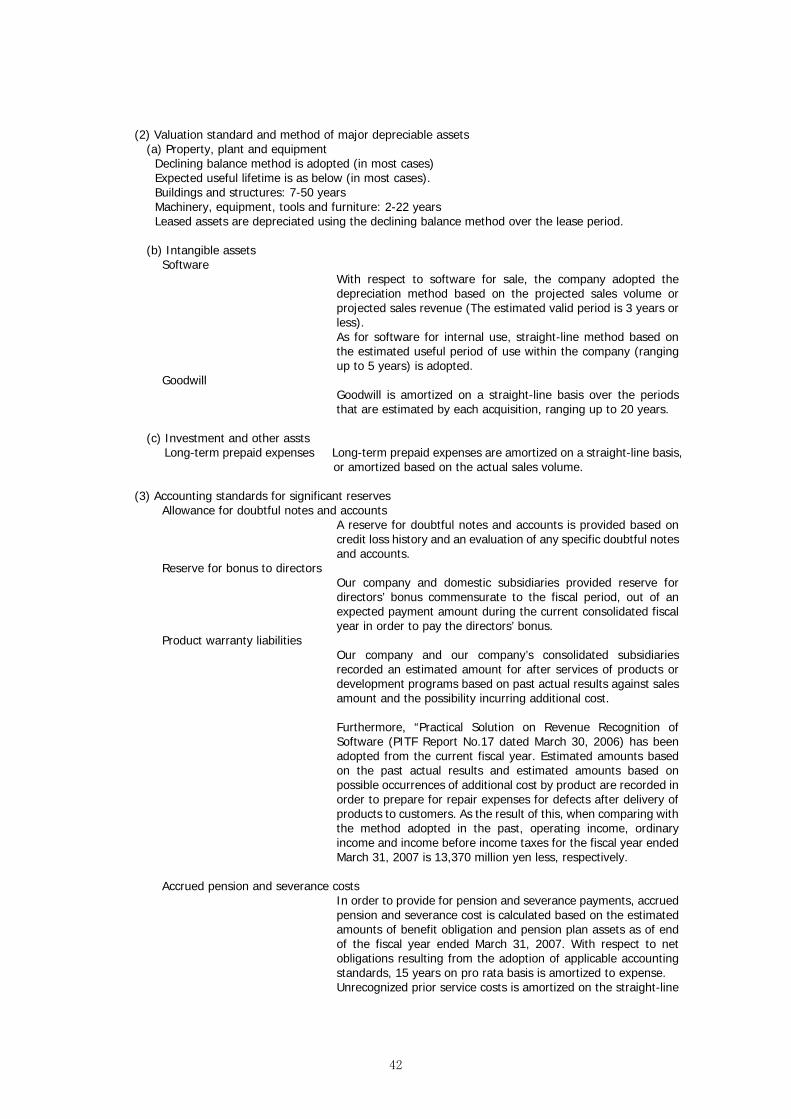
(2) Valuation standard and method of major depreciable assets (a) Property, plant and equipment
Declining balance method is adopted (in most cases) Expected useful lifetime is as below (in most cases). Buildings and structures: 7-50 years Machinery, equipment, tools and furniture: 2-22 years Leased assets are depreciated using the declining balance method over the lease period.
(b) Intangible assets
Software With respect to software for sale, the company adopted the depreciation method based on the projected sales volume or projected sales revenue (The estimated valid period is 3 years or less). As for software for internal use, straight-line method based on the estimated useful period of use within the company (ranging up to 5 years) is adopted.
Goodwill Goodwill is amortized on a straight-line basis over the periods that are estimated by each acquisition, ranging up to 20 years.
(c) Investment and other assts Long-term prepaid expenses Long-term prepaid expenses are amortized on a straight-line basis,
or amortized based on the actual sales volume.
(3) Accounting standards for significant reserves Allowance for doubtful notes and accounts
A reserve for doubtful notes and accounts is provided based on credit loss history and an evaluation of any specific doubtful notes and accounts.
Reserve for bonus to directors Our company and domestic subsidiaries provided reserve for directors’ bonus commensurate to the fiscal period, out of an expected payment amount during the current consolidated fiscal year in order to pay the directors’ bonus.
Product warranty liabilities Our company and our company’s consolidated subsidiaries recorded an estimated amount for after services of products or development programs based on past actual results against sales amount and the possibility incurring additional cost. Furthermore, “Practical Solution on Revenue Recognition of Software (PITF Report No.17 dated March 30, 2006) has been adopted from the current fiscal year. Estimated amounts based on the past actual results and estimated amounts based on possible occurrences of additional cost by product are recorded in order to prepare for repair expenses for defects after delivery of products to customers. As the result of this, when comparing with the method adopted in the past, operating income, ordinary income and income before income taxes for the fiscal year ended March 31, 2007 is 13,370 million yen less, respectively.
Accrued pension and severance costs In order to provide for pension and severance payments, accrued pension and severance cost is calculated based on the estimated amounts of benefit obligation and pension plan assets as of end of the fiscal year ended March 31, 2007. With respect to net obligations resulting from the adoption of applicable accounting standards, 15 years on pro rata basis is amortized to expense. Unrecognized prior service costs is amortized on the straight-line
42
method over the average remaining service period as of incurred (mainly 14 years) of employees expected to receive benefits under the plan. Actuarial loss is amortized on the straight-line method over the average remaining service period as of incurred (mainly 12 years) of employees expected to receive benefits under the plan.
Provision for loss on repurchase of computers An estimated amount for repurchase losses is recorded based on past actual results in order to cover losses at the time of repurchasing computers.
Provision for recycling expenses of personal computers An estimated amount for recycling expenses of personal computers is recorded based on the volume of shipments and the rate of collection to provide for recycling expenses of personal computers at the time of collecting domestic computers that were sold in accordance with the PC Recycling System. Since factors for reserve are revised every term using the JEITA’s (Japan Electronics and Information Technology Industries Association) report and our company’s consolidated subsidiaries’ actual results of recycling, the previous period’s revised amount is recorded as special gains.
(4) Other significant accounting issues Standard for converting material foreign assets or debts to domestic currency Receivables and payables in foreign currency are converted into yen at the spot exchange rate at the
fiscal year-end and the translation difference is recorded as a profit or loss. As for the assets and liabilities of overseas subsidiaries, etc., they are converted into yen at the spot exchange rate at the fiscal year-end and the income and expenses are converted into yen at the average rate of the period and the translation difference is included in the minority interests and foreign currency translation adjustment of net assets.
Material leasing transactions The lessee’s financial lease transactions are accounted in the same way as ordinary sales transactions. Accounting for material hedging activities (a) Accounting for hedging activities
The Company adopts the deferred hedge accounting method for the derivative transaction in order to hedge the interest rate risk.
(b) Hedging instruments and hedged items Hedging instruments: interest rate swap Hedged items: bonds and loans (c) Hedging policy
Derivative transactions are utilized in order to offset market fluctuations or to fix the cash flow according to the company’s Risk Control Rules.
(d) Assessment of hedge effectiveness The Company assesses the hedge effectiveness based on comparing fluctuations in the market of hedged items or cumulative amounts of change in cash flow with fluctuations in the market of hedging instruments or cumulative amounts of change in cash flow.
Accounting for consumption taxes Transactions subject to consumption taxes are recorded at amounts exclusive of consumption taxes.
Consolidated tax return system The Company adopts the consolidated tax return system.
6. Valuation of assets and liabilities of consolidated subsidiaries Assets and liabilities of consolidated subsidiaries are valued using the partial market value method.
43
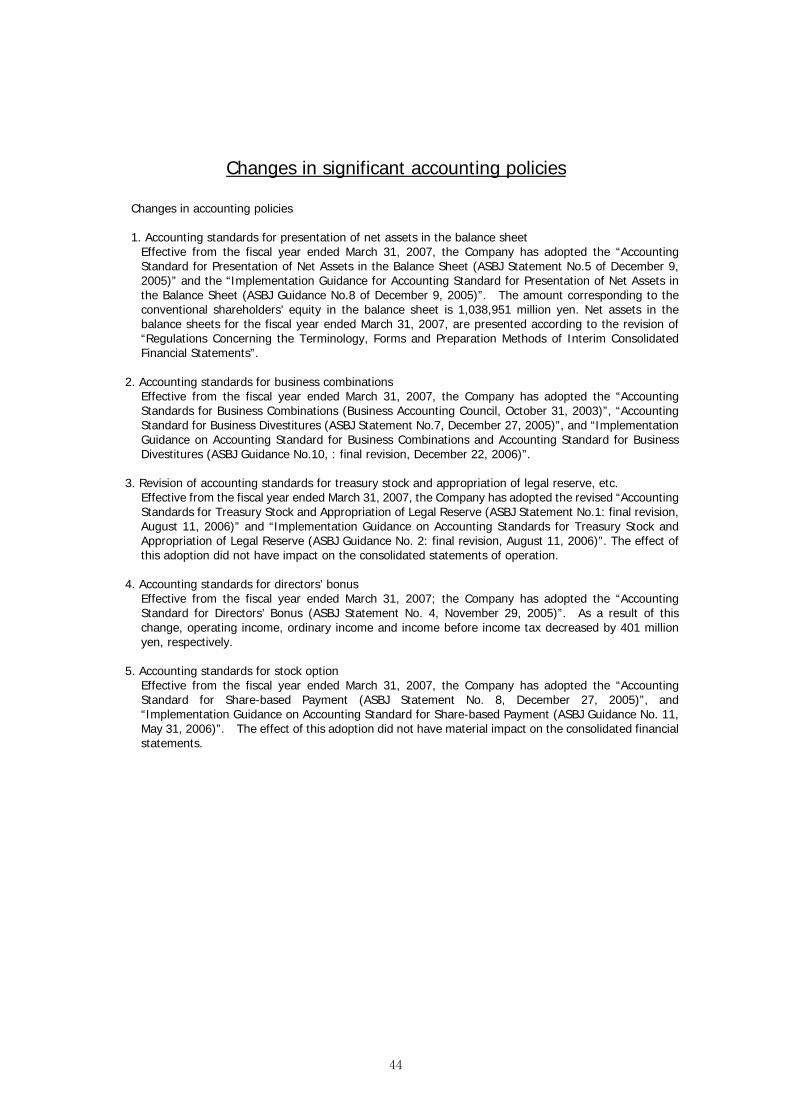
Changes in significant accounting policies
Changes in accounting policies 1. Accounting standards for presentation of net assets in the balance sheet
Effective from the fiscal year ended March 31, 2007, the Company has adopted the “Accounting Standard for Presentation of Net Assets in the Balance Sheet (ASBJ Statement No.5 of December 9, 2005)” and the “Implementation Guidance for Accounting Standard for Presentation of Net Assets in the Balance Sheet (ASBJ Guidance No.8 of December 9, 2005)”. The amount corresponding to the conventional shareholders’ equity in the balance sheet is 1,038,951 million yen. Net assets in the balance sheets for the fiscal year ended March 31, 2007, are presented according to the revision of “Regulations Concerning the Terminology, Forms and Preparation Methods of Interim Consolidated Financial Statements”.
2. Accounting standards for business combinations
Effective from the fiscal year ended March 31, 2007, the Company has adopted the “Accounting Standards for Business Combinations (Business Accounting Council, October 31, 2003)”, “Accounting Standard for Business Divestitures (ASBJ Statement No.7, December 27, 2005)”, and “Implementation Guidance on Accounting Standard for Business Combinations and Accounting Standard for Business Divestitures (ASBJ Guidance No.10, : final revision, December 22, 2006)”.
3. Revision of accounting standards for treasury stock and appropriation of legal reserve, etc.
Effective from the fiscal year ended March 31, 2007, the Company has adopted the revised “Accounting Standards for Treasury Stock and Appropriation of Legal Reserve (ASBJ Statement No.1: final revision, August 11, 2006)” and “Implementation Guidance on Accounting Standards for Treasury Stock and Appropriation of Legal Reserve (ASBJ Guidance No. 2: final revision, August 11, 2006)”. The effect of this adoption did not have impact on the consolidated statements of operation.
4. Accounting standards for directors’ bonus
Effective from the fiscal year ended March 31, 2007; the Company has adopted the “Accounting Standard for Directors’ Bonus (ASBJ Statement No. 4, November 29, 2005)”. As a result of this change, operating income, ordinary income and income before income tax decreased by 401 million yen, respectively.
5. Accounting standards for stock option
Effective from the fiscal year ended March 31, 2007, the Company has adopted the “Accounting Standard for Share-based Payment (ASBJ Statement No. 8, December 27, 2005)”, and “Implementation Guidance on Accounting Standard for Share-based Payment (ASBJ Guidance No. 11, May 31, 2006)”. The effect of this adoption did not have material impact on the consolidated financial statements.
44

Notes to Consolidated Financial Statements
(Consolidated Balance Sheet) As of March 31, 2007
(In millions of yen)1.Assets pledged as and liabilities secured by collateral
(1) Balance of assets pledged as collateral
Buildings and structures 6,846Machinery and equipment 1,385Land 7,132Other 103Total 15,466
(2) Balance of liabilities secured by collateral
Short-term borrowings 2,267Long-term borrowings 2,249Other 162Total 4,678
2.Accumulated depreciation of property, plant and equipment Accumulated depreciation 1,789,062
3.Guarantee obligation
Guaranty of liabilities for bank borrowings
Shanghai SVA NEC Liquid Crystal Display 20,688Employees 12,928Sony NEC Optiarc Inc. 770NEC Toppan Circuit Solutions 554Other 2,022Total 36,962
Guaranty on residual value of operating leases
SMBC Leasing 19,393BOT Lease 3,810IBJ Leasing 1,496Other 452Total 25,151
Important items
4.Notes receivable discounted 447
5.Notes receivable endorsed 959
NEC Electronics America, Inc., a consolidated subsidiary of the Company, has been suedby direct and indirect DRAM purchasers in a number of class action civil antitrust lawsuitsseeking damages for alleged antitrust violations and by attorney generals of a number ofstates in the United States. Although the Company has reached a compromise with manyof the purchasers (including proxies for the plaintiff) who directly purchased DRAMs fromNEC group companies, a number of cases have remained under negotiation with suchpurchasers. The Company is also co-operating with an investigation being conducted bythe European Commission by providing information regarding potential violations ofantitrust law in the DRAM industry. These civil proceedings, negotiations for settlement,and related investigations in the United States and Europe have drawn no conclusion atthis time. However, the Company has set aside an estimated amount in connection withthe civil proceedings and negotiations for settlement in the United States.
45

(Consolidated statements of operations) Fiscal Year Ended March 31, 2007
1. Gain on cancellation of marketable securities of the pension trust
2.Impairment loss on fixed assets
(1)Summary of assets and asset groups in recognition of impairment loss
Application Type Place
Business assetsBuildings and structures,Intangible assets
Shinagawa-ku,Tokyo
Business assetsBuildings and structures,Tools and other equipment
Yokohama CityKanagawa Prefecture
Idle assets Land, Machinery and equipmentTsuruoka CityYamagata Prefecture
Idle assets LandSunto-gun and other locationsShizuoka Prefecture
(2) Background to recognition of impairment loss
(3) Amount of impairment loss(In millions of yen)
Buildings and structures 231Land 400Machinery and equipment 338
310Software 1080Intangible assets-other 260
149Total 2,768
(4) Method for grouping assets
(5) Estimation of collectable amounts
In principle, the Company has grouped assets based on business units and managementcompanies that have continuously managed revenues and expenses of the business, except for idleassets which are classified into one asset group.
The higher of the net realizable value and the useful value of an asset for business is applied to thecollectable amount of the asset. The net realizable value is applied to idle assets. The net realizablevalue of a fixed asset is reasonably estimated based on the assessed value of the fixed asset. Theuseful value of an asset is assessed based on the memorandum value of the asset due to negativecash flow for the future.
The Company has recognized an impairment loss on fixed assets as special losses because therewere uncollectible amounts of investment due to lower profitability of fixed assets for business,and fall in the market values of idle assets.
NEC has an excess funding of plan assets at fair value for the retirement benefit obligation as a resultof an improvement in pension fund management. NEC cancelled a part of shares of Nippons ElectricGlass Co., Ltd. set in the trust and the gain was recorded.
Investments and other assets-other
Tools and other equipment
46
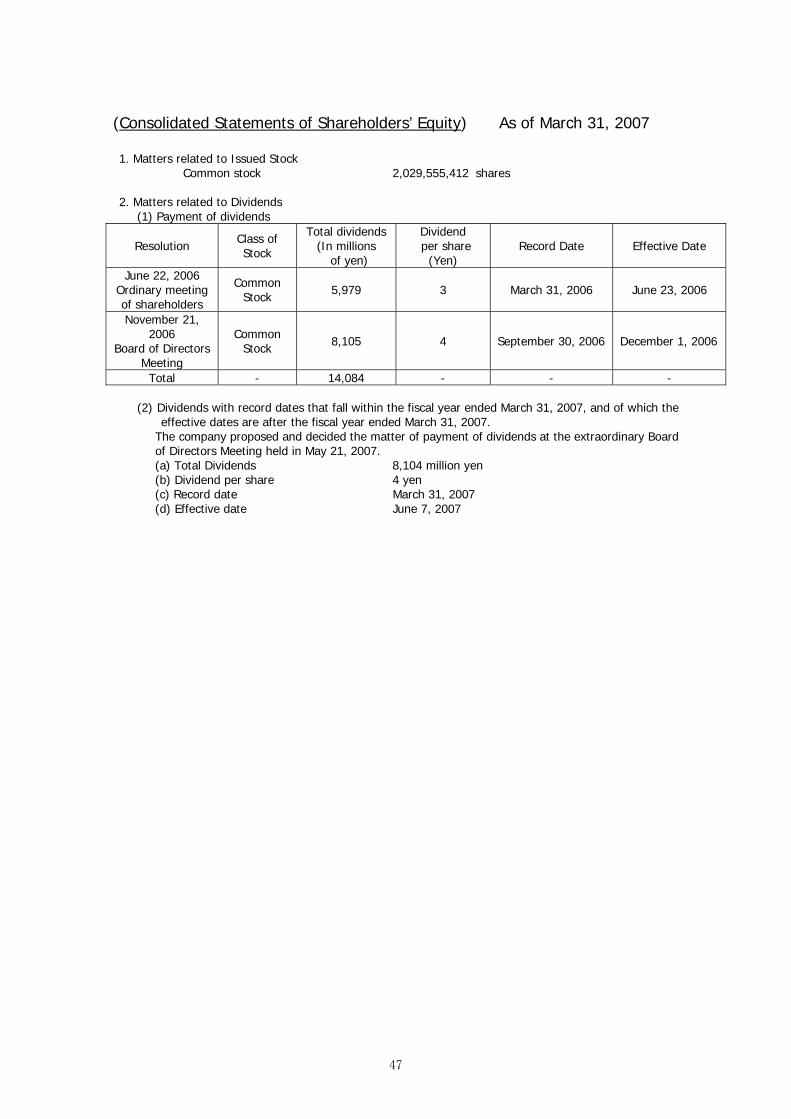
(Consolidated Statements of Shareholders’ Equity) As of March 31, 2007 1. Matters related to Issued Stock
Common stock 2,029,555,412 shares 2. Matters related to Dividends (1) Payment of dividends
Resolution Class of Stock
Total dividends(In millions
of yen)
Dividend per share
(Yen) Record Date Effective Date
June 22, 2006 Ordinary meeting of shareholders
Common Stock 5,979 3 March 31, 2006 June 23, 2006
November 21, 2006
Board of Directors Meeting
Common Stock 8,105 4 September 30, 2006 December 1, 2006
Total - 14,084 - - - (2) Dividends with record dates that fall within the fiscal year ended March 31, 2007, and of which the
effective dates are after the fiscal year ended March 31, 2007. The company proposed and decided the matter of payment of dividends at the extraordinary Board
of Directors Meeting held in May 21, 2007. (a) Total Dividends 8,104 million yen (b) Dividend per share 4 yen (c) Record date March 31, 2007 (d) Effective date June 7, 2007
47
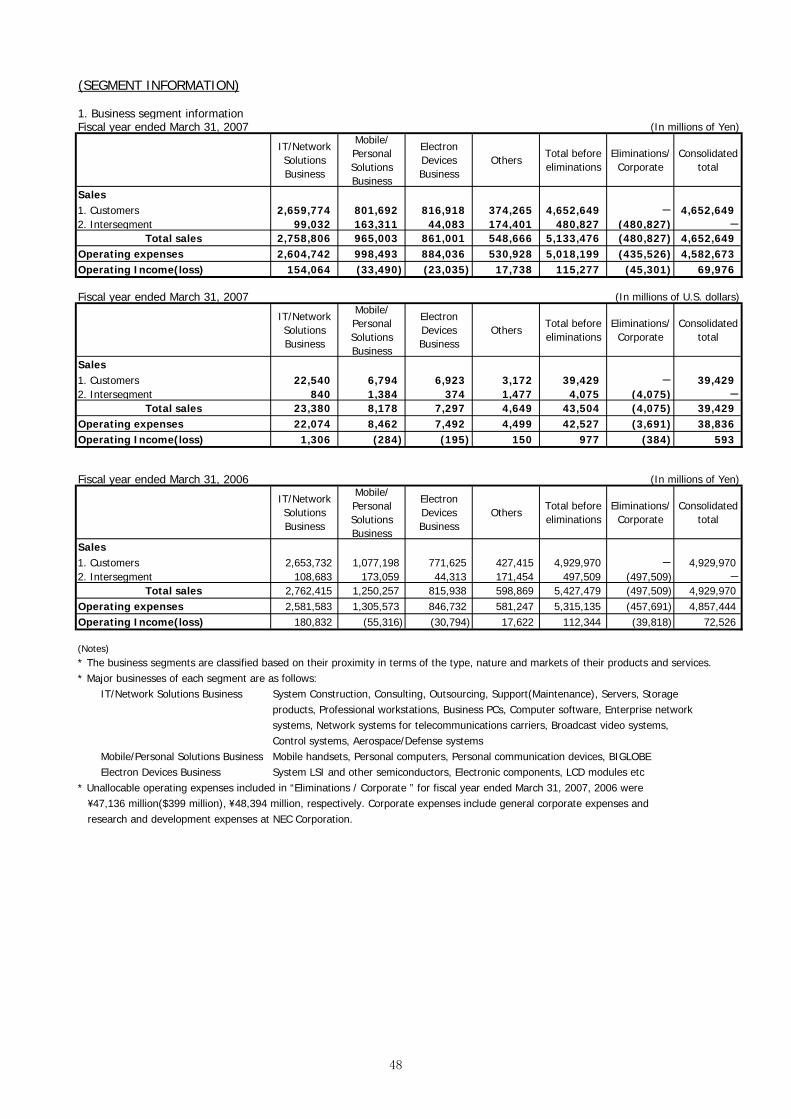
(SEGMENT INFORMATION)
1. Business segment informationFiscal year ended March 31, 2007 (In millions of Yen)
IT/NetworkSolutionsBusiness
Mobile/PersonalSolutionsBusiness
ElectronDevicesBusiness
OthersTotal beforeeliminations
Eliminations/Corporate
Consolidatedtotal
Sales1. Customers 2,659,774 801,692 816,918 374,265 4,652,649 - 4,652,6492. Intersegment 99,032 163,311 44,083 174,401 480,827 (480,827) -
Total sales 2,758,806 965,003 861,001 548,666 5,133,476 (480,827) 4,652,649Operating expenses 2,604,742 998,493 884,036 530,928 5,018,199 (435,526) 4,582,673Operating Income(loss) 154,064 (33,490) (23,035) 17,738 115,277 (45,301) 69,976
Fiscal year ended March 31, 2007 (In millions of U.S. dollars)
IT/NetworkSolutionsBusiness
Mobile/PersonalSolutionsBusiness
ElectronDevicesBusiness
OthersTotal beforeeliminations
Eliminations/Corporate
Consolidatedtotal
Sales1. Customers 22,540 6,794 6,923 3,172 39,429 - 39,4292. Intersegment 840 1,384 374 1,477 4,075 (4,075) -
Total sales 23,380 8,178 7,297 4,649 43,504 (4,075) 39,429Operating expenses 22,074 8,462 7,492 4,499 42,527 (3,691) 38,836Operating Income(loss) 1,306 (284) (195) 150 977 (384) 593
Fiscal year ended March 31, 2006 (In millions of Yen)
IT/NetworkSolutionsBusiness
Mobile/PersonalSolutionsBusiness
ElectronDevicesBusiness
OthersTotal beforeeliminations
Eliminations/Corporate
Consolidatedtotal
Sales1. Customers 2,653,732 1,077,198 771,625 427,415 4,929,970 - 4,929,9702. Intersegment 108,683 173,059 44,313 171,454 497,509 (497,509) -
Total sales 2,762,415 1,250,257 815,938 598,869 5,427,479 (497,509) 4,929,970Operating expenses 2,581,583 1,305,573 846,732 581,247 5,315,135 (457,691) 4,857,444Operating Income(loss) 180,832 (55,316) (30,794) 17,622 112,344 (39,818) 72,526
* The business segments are classified based on their proximity in terms of the type, nature and markets of their products and services.* Major businesses of each segment are as follows: IT/Network Solutions Business System Construction, Consulting, Outsourcing, Support(Maintenance), Servers, Storage
products, Professional workstations, Business PCs, Computer software, Enterprise networksystems, Network systems for telecommunications carriers, Broadcast video systems,Control systems, Aerospace/Defense systems
Mobile/Personal Solutions Business Mobile handsets, Personal computers, Personal communication devices, BIGLOBE Electron Devices Business System LSI and other semiconductors, Electronic components, LCD modules etc* Unallocable operating expenses included in “Eliminations / Corporate ” for fiscal year ended March 31, 2007, 2006 were 47,136 million($399 million), 48,394 million, respectively. Corporate expenses include general corporate expenses and \ \
research and development expenses at NEC Corporation.
(Notes)
48

2. Geographic segment informationFiscal year ended March 31, 2007 (In millions of Yen)
Japan Europe OthersTotal beforeeliminations
Eliminations/Corporate
Consolidatedtotal
Sales1. Customers 3,683,325 387,962 581,362 4,652,649 - 4,652,6492. Intersegment 418,520 17,255 205,108 640,883 (640,883) -
Total sales 4,101,845 405,217 786,470 5,293,532 (640,883) 4,652,649Operating expenses 4,024,759 409,139 785,276 5,219,174 (636,501) 4,582,673Operating Income(loss) 77,086 (3,922) 1,194 74,358 (4,382) 69,976
Fiscal year ended March 31, 2007 (In millions of U.S. dollars)
Japan Europe OthersTotal beforeeliminations
Eliminations/Corporate
Consolidatedtotal
Sales1. Customers 31,215 3,288 4,926 39,429 - 39,4292. Intersegment 3,546 146 1,739 5,431 (5,431) -
Total sales 34,761 3,434 6,665 44,860 (5,431) 39,429Operating expenses 34,108 3,467 6,655 44,230 (5,394) 38,836Operating Income(loss) 653 (33) 10 630 (37) 593
Fiscal year ended March 31, 2006 (In millions of Yen)
Japan Europe OthersTotal beforeeliminations
Eliminations/Corporate
Consolidatedtotal
Sales1. Customers 3,825,580 494,330 610,060 4,929,970 - 4,929,9702. Intersegment 440,730 20,007 256,735 717,472 (717,472) -
Total sales 4,266,310 514,337 866,795 5,647,442 (717,472) 4,929,970Operating expenses 4,203,954 512,159 862,437 5,578,550 (721,106) 4,857,444Operating Income(loss) 62,356 2,178 4,358 68,892 3,634 72,526
* Segmenting nations and areas is based on their geographical proximity.* Major nations and areas other than Japan Europe・・・U.K., France, the Netherlands, Germany, Italy, Spain.
(Notes)
3. Overseas salesFiscal year ended March 31, 2007 (In millions of Yen)
Overseas sales
Consolidated sales
Percentage of overseas sales to consolidated sales
Fiscal year ended March 31, 2007 (In millions of U.S. dollars)
Overseas sales
Consolidated sales
Fiscal year ended March 31, 2006 (In millions of Yen)
Overseas sales
Consolidated sales
Percentage of overseas sales to consolidated sales
* Segmenting nations and areas is based on their geographical proximity.* Major nations and areas other than Japan Europe・・・U.K., France, the Netherlands, Germany, Italy, Spain.
* Overseas sales refer to sales by the consolidated subsidiaries of the Company outside Japan.
26.1%
4,652,649
16.0%
16.5%
- 39,429
Total
6,484 10,285
27.3%
-
3,801
- -
-
9.6%
-
Europe Others
1,344,682
Europe Others
11.3%
448,487
Europe
1,213,685
4,929,970
Total
765,198
Others
Total
555,107 789,575
49

(Lease transactions)
(In millions of yen)
As of March 31, 2007 As of March 31, 2006 Operating leases (Lessee) Future minimum lease payments subsequent to March 31, 2007 Due in one year or less 41,856 Due after one year 144,979 Total 186,835
Operating leases (Lessee) Future minimum lease payments subsequent to March 31, 2006 Due in one year or less 39,543 Due after one year 159,528 Total 199,071
50

(DEFFERED INCOME TAXES)
(1) Significant components of deferred tax assets and liabilities
(Deferred tax assets) (In millions of yen)
As of March 31, 2007 2006Operating loss carryforwards JPY 173,034 JPY 102,524
Accrued retirement benefits 129,354 127,836
Investments in subsidiaries or affiliated companies 86,698 117,396
Accrued expenses and product warranty liabilities 72,709 63,706
Depreciation 42,854 44,819
Loss due to devaluation of investment in securities 17,878 21,779
Research and development costs 14,553 14,850
Unrealized gain due to inter-company transactionson inventories and fixed assets, etc.
13,320 14,701
Provision for loss on repurchase of computers 6,028 7,151
Other 86,399 86,478
Total deferred tax assets 642,827 601,240
Valluation allowance (185,136) (114,808)
Total deferred tax assets 457,691 486,432
Reacquiring shares of affiliated company in relation tothe cancellation of pension trust
(56,184) -
Gain on transfer of marketable securities to thepension trust
(47,742) (73,370)
Unrealized gain on marketable securities (29,300) (45,172)
Tax on undistributed earnings (27,204) (21,753)
Tax deductible reserve (3,779) (7,933)
Other (30,498) (28,139)
Total deferred tax liabilities (194,707) (176,367)
Net deferred tax assets JPY 262,984 JPY 310,065
Current assets ― Deferred tax assets JPY 114,560 JPY 106,243
Long term asstes ― Deferred tax assets 160,810 214,525
Current liabilities ― Other (962) (1,042)Long-term liabilities ― Deferred tax liabilities (11,424) (9,661)
(2)The reconciliation between the actual tax rate reflected in the consolidated finanacial statements
and the statuory tax rate is as follows:
Statutory tax rate 40.5 % 40.5 %
(Reconciliation)
Changes in valuation allowance 41.8 87.5
Tax on undistributed earnings 6.6 18.5
Non-deductible expenses for tax purpose 6.1 7.4
Non-deductible goodwill 3.5 4.8
Equity in (earnings)losses of affiliated companies 2.3 (7.1)
Unrealized gain due to inter-company transactionson inventories and fixed assets, etc.
1.7 (1.4)
International tax rate differences (1.5) (4.6)
Other (4.5) (4.2)
Actual tax rate after adoption of tax-effect 96.5 141.4
(Deferred tax liabilities)
*Net deferred tax assets and liabilities were included in the consolidated balance sheets as follows:
51

(SECURITIES)
Fiscal year ended March 31, 2007
(1) Other marketable securities as of March 31, 2007(In millions of yen)
Description1. JPY 57,317 JPY 144,790 JPY 87,4732.
5 8 3
- - -3. 58 95 37
57,380 144,893 87,5131. 5,918 5,051 (867)2.
22 22 0
600 598 (2)3. 1,657 1,616 (41)
8,197 7,287 (910)JPY 65,577 JPY 152,180 JPY 86,603
(2) Other marketable securities sold during the fiscal year ended March 31, 2007(In millions of yen)
JPY 38,432 JPY 25,651 JPY 19
(3) The carrying value and a description of major securities whose fair value was not determinable as of March 31, 2007(In millions of yen)
Other Securities1.Stocks JPY 70,1322.Bonds 24,979
3. 6,945
4. Commercial Paper 54,9705. M M F 11,477
(4) Redemption schedule of other securities with fixed maturities as of March 31, 2007(In millions of yen)
1.Bonds
JPY 23,983 - JPY 8 JPY 22
Corporate Bonds - 996 - 598 Commercial paper 54,970 - - -
2.Other 1,140 - - -Total JPY 80,093 JPY 996 JPY 8 JPY 620
(5) Change in the classification of securities during the fiscal year ended March 31, 2007
We changed the classification of Hua Hong Semiconductor Limited, heretofore considered as stock of affiliated companies,to other securities from the fiscal year ended March 31, 2007. The cause of this change is as follows.
Hua Hong Semiconductor Limitedmethod as we do not consider to have important influence
As a result, Investment securities increased 18,233 million yen and Stock of affiliated companies decreased by the same amount.
Other
StocksBonds
Governmental and municipal Bonds
Subtotal
Subtotal
value not exceedingacquisition cost
Securities with book
Governmental and municipal Bonds
This is because we excluded the company from the scope of equity
on the management of Hua Hong Semiconductor Limited.
Corporate BondsOther
StocksBonds
Governmental and municipal Bonds Corporate Bonds
Securities with bookvalue exceedingacquisition cost
Total
Gross realized gains
Acquisition cost Carrying value Unrealized gains(losses)
Carrying Value
Gross realized losses
Investment in limted partnership andsimilar partnership
1 to 5 yearsWithin 1 year 5 to 10 years Over 10years
Proceeds from sales
52

Fiscal year ended March 31, 2006
(1) Other marketable securities as of March 31, 2006(In millions of yen)
Description1. JPY 68,176 JPY 193,849 JPY 125,6732.
- - -
- - -3. 33 37 4
68,209 193,886 125,6771. 2,509 2,201 (308)2.
16 15 (1)
800 796 (4)3. 1,126 955 (171)
4,451 3,967 (484)JPY 72,660 JPY 197,853 JPY 125,193
(2) Other marketable securities sold during the fiscal year ended March 31, 2006(In millions of yen)
JPY 36,271 JPY 25,189 JPY 378
(3) The carrying value and a description of major securities whose fair value was not determinable as of March 31, 2006(In millions of yen)
Other Securities1.Stocks JPY 56,6322.Bonds 7,709
3. 7,679
4. Commercial Paper 40,0155. M M F 3,809
(4) Redemption schedule of other securities with fixed maturities as of March 31, 2006(In millions of yen)
1.Bonds
JPY 2,000 - - JPY 16
Corporate Bonds 210 3,696 - 600Commercial paper 40,015 - - -
2,003 - - -
2.Other 1,205 - - -Total JPY 45,433 JPY 3,696 - JPY 616
(5) Change in the classification of securities during the fiscal year ended March 31, 2006
We changed the classification of Elpida Memory,Inc and Toyo Communication Equipment Co.,Ltd (EPSON TOYOCOM CORPORATION), heretofore considered as stock of affiliated companies, to other securities from the year ended March 31, 2006.The causes of these changes are as follows.
Elpida Memory, Inc
Toyo Communication Equipment Co.,Ltd(EPSON TOYOCOM CORPORATION)
As a result, Investment securities increased 36,057 million yen, and Unrealized gains on marketable securities increased
26,601 million yen.
Bonds
Subtotal
Investment in limted partnership andsimilar partnership
StocksBonds
Subtotal
1 to 5 years
value not exceedingacquisition cost
Governmental and municipal Bonds Corporate BondsOther
Total
Proceeds from sales Gross realized gains
Goverment Bonds Municipal Bonds
Securities with book
Within 1 year
This is because we excluded the company from the scope of equitymethod, as a result of the sale of the shares with voting rights.
This is because we removed the company from our consolidatedaccounts after our equity stake in the company declined following thecompany's allotment of new shares to a third party.
Gross realized losses
Securities with book
Carrying Value
Interest bearingbank debenture
Acquisition cost Carrying value Unrealized gains(losses)
5 to 10 years Over 10years
Stocks
value exceedingacquisition cost
Governmental and municipal Bonds Corporate BondsOther
53

(Pension and Severance Plans) (1) Outline of pension and severance plans
NEC and its consolidated subsidiaries in Japan have defined benefit plans, which include non-contributory
defined benefit pension plans, tax-qualified pension plans and severance indemnity plans. In some cases,
extra retirement benefits are paid when an employee retires.
Most of the consolidated subsidiaries outside Japan have various retirement plans which are mainly defined
benefit plans and/or defined contribution plans covering substantially all of their employees.
NEC and some of its consolidated subsidiaries in Japan have pension trust. As a result of a recovery in stock
market conditions and some other factors, there has been an excess in funding of pension funds for the
pension obligation. NEC cancelled a part of its pension trust during the fiscal year ended March 31, 2007
where the condition of excess funding for the trust is logically expected to continue after cancellation.
NEC Pension Fund, established by NEC and certain consolidated subsidiaries in Japan received the approval
from the Minister of Health, Labor and Welfare to eliminate the benefit obligation related to future employee
service under the substitutional portion of the welfare pension fund plans on September 2002 and the
portion related to past service on December 2003. Following the approval, NEC and certain consolidated
subsidiaries in Japan transferred their welfare pension fund plans to non-contributory defined benefit
pension plan.
Some other consolidated subsidiaries in Japan, also having had welfare pension fund plan, were granted to
separate the benefit obligation related to past services by the Minister of Health, Labor and Welfare on
February 2006, and transferred the assets of the pension plans in May 2006.
Since the fiscal year ended March 31, 2004, NEC and certain consolidated subsidiaries in Japan have
amended their severance indemnity plans by introducing a “point-based benefits system,” under which
benefits are calculated based on accumulated points allocated to employees according to their job
classification and their performance.
Since the fiscal year ended March 31, 2004, NEC and certain consolidated subsidiaries in Japan have
transferred from welfare pension fund plan and/or tax-qualified pension plans to non-contributory defined
benefit pension plans, and a cash balance pension plan was established. Under a cash balance pension
plan, each participant has an account which is credited based on their job classification and interest crediting
rate calculated based on a market interest rate.
54

(2) Retirement benefit obligations(In millions of Yen)
2007 2006
A. Retirement benefit Obligation (JPY 1,093,808) (JPY 1,069,130)B. Plan assets 863,303 947,712
Unfunded retirement benefit obligations(A+B)
D. Unrecognized transition obligation due to accounting changes 116,897 131,829
E. Unrecognized actuarial differences 68,875 (5,325)Unrecognized Prior service cost (105,614) (114,793)(reduction in obligations)
G. Consolidated book value(C+D+E+F) (150,347) (109,707)H. Prepaid pension expenses 66,422 87,727I. Provisions for retirement benefits(G-H) (JPY 216,769) (JPY 197,434)
Note: Some subsidiaries use the simplified method in calculating the retirement benefit obligation.
(3) Retirement benefit expenses(In millions of Yen)
2007 2006
A. Service Cost JPY 45,739 JPY 44,674B. Interest cost 26,048 24,774C. Expected return on plan assets (15,292) (14,794)
D. Amortization of transition obligation due to accounting changes 14,782 14,834
E. Amortization of actuarial differences 3,311 17,260F. Amortization of prior service cost (8,838) (8,808)G. Other (Note) 3,633 2,428
Retirement benefit expenses(A+B+C+D+E+F+G)
I.Gain on transfer of substitutional portion of employees'pension funds
- (2,035)
Total(H+I) JPY 69,383 JPY 78,333Notes: 1. Retirement benefit expenses of consolidated subsidiaries that adopt simplified method
are collectively stated in “A. Service Cost”2. Item G is the amount of premiums paid into the defined contribution pension plan.
(230,505) (121,418)
69,383 80,368
As of March 31,
C.
H.
F.
Fiscal year ended March 31,
55

(4) Items Related to Basis of Calculation of Retirement Benefit Obligation
2007 2006
A. Allocation method for forecast retirement benefit cost Mainly, point basis Same as left
B. Discount Rate Mainly, 2.5% 2.5%
C. Expected rate of return on plan assets Mainly, 2.5% 2.5%
D. Period for amortization of prior service cost Mainly, 14 years(amortized on thestraight-line methodover the averageremaining serviceperiod of employeesexpected to receivebenefits under theplan)
Same as left
E. Period for amortization of actuarial differences Mainly, 12 years(amortized on thestraight-line methodover the averageremaining serviceperiod of employeesexpected to receivebenefits under theplan)
Mainly, 13 years(amortized on thestraight-line methodover the averageremaining serviceperiod of employeesexpected to receivebenefits under theplan)
F. Period for amortization of obligation due to accounting changes Mainly, 15 years Same as left
Fiscal year ended March 31,
56
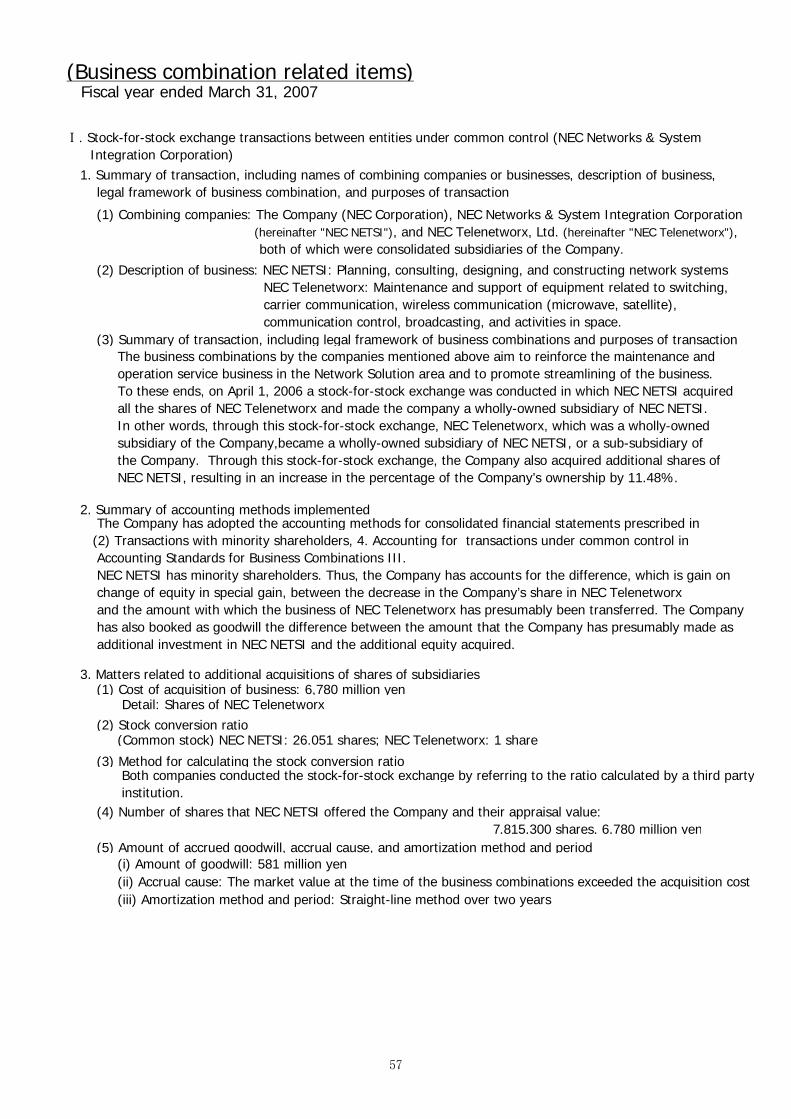
(Business combination related items) Fiscal year ended March 31, 2007
(1) Combining companies: The Company (NEC Corporation), NEC Networks & System Integration Corporation (hereinafter "NEC NETSI"), and NEC Telenetworx, Ltd. (hereinafter "NEC Telenetworx"), both of which were consolidated subsidiaries of the Company.
(2) Description of business: NEC NETSI: Planning, consulting, designing, and constructing network systems NEC Telenetworx: Maintenance and support of equipment related to switching, carrier communication, wireless communication (microwave, satellite), communication control, broadcasting, and activities in space.(3) Summary of transaction, including legal framework of business combinations and purposes of transaction The business combinations by the companies mentioned above aim to reinforce the maintenance and operation service business in the Network Solution area and to promote streamlining of the business. To these ends, on April 1, 2006 a stock-for-stock exchange was conducted in which NEC NETSI acquired all the shares of NEC Telenetworx and made the company a wholly-owned subsidiary of NEC NETSI. In other words, through this stock-for-stock exchange, NEC Telenetworx, which was a wholly-owned subsidiary of the Company,became a wholly-owned subsidiary of NEC NETSI, or a sub-subsidiary of the Company. Through this stock-for-stock exchange, the Company also acquired additional shares of NEC NETSI, resulting in an increase in the percentage of the Company’s ownership by 11.48%.
2. Summary of accounting methods implemented
3. Matters related to additional acquisitions of shares of subsidiaries(1) Cost of acquisition of business: 6,780 million yen
Detail: Shares of NEC Telenetworx(2) Stock conversion ratio (Common stock) NEC NETSI: 26.051 shares; NEC Telenetworx: 1 share
(3) Method for calculating the stock conversion ratio Both companies conducted the stock-for-stock exchange by referring to the ratio calculated by a third party institution.(4) Number of shares that NEC NETSI offered the Company and their appraisal value: 7,815,300 shares, 6,780 million yen(5) Amount of accrued goodwill, accrual cause, and amortization method and period (i) Amount of goodwill: 581 million yen (ii) Accrual cause: The market value at the time of the business combinations exceeded the acquisition cost (iii) Amortization method and period: Straight-line method over two years
Ⅰ. Stock-for-stock exchange transactions between entities under common control (NEC Networks & System Integration Corporation)
The Company has adopted the accounting methods for consolidated financial statements prescribed in (2) Transactions with minority shareholders, 4. Accounting for transactions under common control in Accounting Standards for Business Combinations III. NEC NETSI has minority shareholders. Thus, the Company has accounts for the difference, which is gain on change of equity in special gain, between the decrease in the Company’s share in NEC Telenetworx and the amount with which the business of NEC Telenetworx has presumably been transferred. The Company has also booked as goodwill the difference between the amount that the Company has presumably made as additional investment in NEC NETSI and the additional equity acquired.
1. Summary of transaction, including names of combining companies or businesses, description of business, legal framework of business combination, and purposes of transaction
57
Ⅱ. Stock-for-stock exchange transactions between entities under common control (NEC Infrontia Corporation)
(1) Combining companies:The Company (NEC Corporation) and NEC Infrontia Corporation (hereinafter "NEC Infrontia"), a consolidated subsidiary of the Company. The name of the subsidiary has remained unchanged after the business combination.
(2) Description of business:Development, manufacturing, and marketing of information and telecommunications systems and operation terminals, and system solution business(3) Summary of transaction, including legal framework of business combination and purposes of transaction The business combination aims to reinforce the IP telephony business within the NEC group. To this end, on May 1, 2006 a stock-for-stock exchange was conducted in which the Company made NEC Infrontia a wholly-owned subsidiary of the Company. Specifically, through this stock-for-stock exchange, the Company acquired 34.29% of the shares of NEC Infrontia and NEC Infrontia became the wholly-owned subsidiary of the Company.
2. Summary of accounting methods implementedThe Company has adopted the accounting methods for consolidated financial statements prescribed in (2)Transactions with minority shareholders, 4. Accounting for transactions under common control in AccountingStandards for Business Combinations III.The difference between the amount that the Company has presumably made as additional investmentsin NEC Infrontia and the additional equity acquired is accounted for as goodwill.
3. Matters related to additional acquisition of shares of subsidiaries(1) Cost of acquisition of business: 24,405 million yen Details: Shares of the Company: 24,382 million yen
Direct cost for acquisition: 23 million yen(2) Stock conversion ratio
(Common stock) The Company: 0.774 shares; NEC Infrontia: 1 share
(3) Method for calculating the stock conversion ratioBoth companies conducted the stock-for-stock exchange by referring to the ratio calculated by a third partyinstitution.
(4) Number and appraisal value of shares delivered: 33,630,520 shares 24,382 million yen.(5) Amount of goodwill, acrual cause, and amortization method and period:
Amount of goodwill: 12,916 million yenAccrual cause: The market value at the time of the business combination exceeded the acquisition cost.Amortization method and period: Straight-line method over 15 years
1.Summary of transaction, including the names of the combination companies or businesses, description of business, legal framework of business combination, and purposes of the transaction
58
Ⅲ. Business divestiture transactions (Sony NEC Optiarc Inc.)
(1)Name of company divested: Sony NEC Optiarc Inc. (hereinafter "Sony NEC Optiarc")(2)Description of business divested:Development, design, manufacturing, marketing and sale of optical disk drives(3)Main cause for business divesture:
(4)Summary of business divesture, including business divesture date and legal framework
2. Summary of accounting methods implemented
3. Name of business segment in which divested business is included IT/NW solution segment
No rough estimate is reported because such gain or loss is minor.
Ⅳ. Formation of jointly controlled company (Adcore-Tech Co., Ltd.)
(1) Name of jointly controlled company Adcore-Tech Co., Ltd. (hereinafter "Adcore-Tech")(2) Description of business
(3) Legal framework of business combination Formation of a jointly controlled company
(4) Summary of transaction including purposes of transaction
2. Summary of accounting methods implemented The shareholders of Adcore-Tech consist of three groups, namely the Company and NEC Electronics;Matsushita Electric and Panasonic Mobile; and Texas Instruments. The total number of shares held by the Company and NEC Electronics is the same as the total number held by Matsushita Electric and Panasonic Mobile (and both these groups hold more shares than the other group). Thus, concerning jointly controlled companies, the Company has adopted the accounting methods for consolidated financial statements prescribed in (7) Formation of joint venture, 3. Accounting for combining of interests, Accounting Standard for Business Combinations III. Adcore-Tech is accounted for by the equity method.
The Company has adopted accounting methods for consolidated financial statements prescribed in the Accounting for the Divesting Entity in Accounting Standard for Business Divestures. Since the percentage of the Company’s ownership in Sony NEC Optiarc is 45%, Sony NEC Optiarc is accounted for by the equity method. The gain from the change in the business divesture is minor.
4. Rough estimate of gain and loss from the business divested, which is accounted for in the current consolidated statement of operations
1. Summary of transaction, including name of jointly controlled company, description of business, legal framework of business combination, and purposes of transaction
Development, designing and technical licensing of a "communication platform" that plays the key role in communication technologies of mobile phone systems of third generation mobile phones and onwards
The business divesture aims to reinforce the optical disk drive business of the Company by consolidating it with the optical disk drive business of Sony Corporation (hereinafter "Sony").
On the business divesture date of April 1, 2006, the Company and Sony divested their optical disk drive business from the companies and set up a new company called "Sony NEC Optiarc Inc." which succeeds the business. As a result of this business divesture, the percentage of the Company’s ownership in Sony NEC Optiarc is 45%. The Company and Sony had decided the ownership ratio by referring to the result of cash flows, estimated by a third party institution, which will be produced by the business in the future.
The Company (NEC Corporation), NEC Electronics Corporation (hereinafter "NEC Electronics"), which is a consolidated subsidiary of the Company, Matsushita Electric Industrial Co., Ltd. (hereinafter "Matsushita Electric"), Panasonic Mobile Communications Co., Ltd. (hereinafter "Panasonic Mobile"), and Texas Instruments Incorporated (hereinafter "Texas Instruments") have jointly established a corporation that engages in the development of mobile phone systems. The joint company aims to lead the development of a communication platform that will play the key role in the current advanced 3.5G mobile phone system, in anticipation of developing a 3.9G mobile phone system in the future. The results of development efforts will be licensed worldwide, contributing to the development of the mobile phone industry worldwide. The Company and NEC Electronics invested 2,650 million yen in establishment of this joint development company.
1. Summary of business divesture, including the name of company divested(successor entity), description of business divested, major cause of business divesture, and legal framework
59

(Per share information)(In Yen)
Fiscal year ended March 31, 2007 2006
Net assets per share 512.99 516.62
Net income (loss) per share for the period 4.43 (5.26)
Diluted net income per share for the period 4.23 -
Fiscal year ended March 31, 2007 2006
Net income(loss) per share for the period(In millions of yen)
Net income(loss) for the period 9,128 (10,062)
Amounts not attributable to common shareholders 181 342
<of those, directors' bonus by profit appropriation> <―> <200>
<of those, redeemable shares with dividends> <181> <142>
Net income(loss) on common stock for the period 8,947 (10,404)
Average number of common shares for the period(In thousands of shares)
2,020,369 1,977,778
Net income per share for the period, diluted(In millions of yen) Adjustment made on net income ― ― Increase in the number of shares of common stock(In thousands of shares)
92,429 ―
<of those, convertible bonds (In thousands of shares)> <92,426> ― <of those, share subscription rights (In thousands ofshares)>
<3> ―
(1) Convertible bonds (1) Convertible bonds
10th unsecured yen convertibledebentures (face value 100,000 millionyen)
10th unsecured yen convertibledebentures (face value 100,000 millionyen)11th unsecured yen convertibledebentures (face value 100,000 millionyen)Unsecured euro-yen convertibledebentures due 2010 (face value100,000 million yen)
(2) Convertible bonds with sharesubscription rights issued by subsidiaries
(2) Convertible bonds with sharesubscription rights issued by subsidiaries
Unsecured euro-yen convertibledebentures with share subscriptionrights under certain conditions issued byNEC Electronics Corporation due 2011(face value 110,000 million yen)
Unsecured euro-yen convertibledebentures with share subscriptionrights under certain conditions issued byNEC Electronics Corporation due 2011(face value 110,000 million yen)
Unsecured euro-yen convertibledebentures with share subscriptionrights issued by NEC TOKIN Corporationdue 2010 (face value 15,000 million yen)
Unsecured euro-yen convertibledebentures with share subscriptionrights issued by NEC TOKIN Corporationdue 2010 (face value 15,000 million yen)
(3) Share subscription rights (3) Share subscription rights
4 types of share subscription rights(numbers of share subscription rights:923) and treasury stock for stock optionaccording to the provisions of Article210-2 of Commercial Code(Pre Revision)(numbers of common shares: 62,000)
4 types of share subscription rights(numbers of share subscription rights:1,104) and treasury stock for stockoption according to the provisions ofArticle 210-2 of Commercial Code(PreRevision) (numbers of common shares:
2 types of share subscription right issuedby NEC Electronics Corporation(numbers of subscription rights: 3,070)
1 type of share subscription right issuedby NEC Electronics Corporation(numbers of share subscription rights:2,915)
Fiscal year ended March 31, 2007 2006Net assets per share Total of net assets(In millions of yen) 1,240,123 1,242,650 Amounts subtracted from total of net assets 201,315 213,043 <of those, share subscription rights> <81> <―> <of those, minority interest> <201,234> <212,843> <of those, income appropriation> <―> <200> Net assets for common shares at end of period
1,038,808 1,029,607
Number of common shares at end of period used for calculating the amount of net assets per share(In thousands of shares)
2,025,009 1,992,949
2.The basis for calculating net assets per share is as follows:
1.The basis for calculating net income(loss) per share (basic and diluted) is as follows:
Items of potential shares of common stock that are excludedfrom the calculation of net income per share of common stock,diluted, due to a lack of dilution effects
60

(Omission of disclosure)
Disclosure of items such as related-party transactions, derivatives, and stock options are not included
as they are considered to be of less material importance.
61
CAUTIONARY STATEMENTS: This material contains forward-looking statements pertaining to strategies, financial targets, technology, products and services, and business performance of NEC Corporation and its consolidated subsidiaries (collectively "NEC"). Written forward-looking statements may appear in other documents that NEC files with stock exchanges or regulatory authorities, such as the U.S. Securities and Exchange Commission, and in reports to shareholders and other communications. The U.S. Private Securities Litigation Reform Act of 1995 contains, and other applicable laws may contain, a safe-harbor for forward-looking statements, on which NEC relies in making these disclosures. Some of the forward-looking statements can be identified by the use of forward-looking words such as "believes," "expects," "may," "will," "should," "seeks," "intends," "plans," "estimates," “targets,” "aims," or "anticipates," or the negative of those words, or other comparable words or phrases. You can also identify forward-looking statements by discussions of strategy, beliefs, plans, targets, or intentions. Forward-looking statements necessarily depend on currently available assumptions, data, or methods that may be incorrect or imprecise and NEC may not be able to realize the results expected by them. You should not place undue reliance on forward-looking statements, which reflect NEC's analysis and expectations only. Forward-looking statements are not guarantees of future performance and involve inherent risks and uncertainties. A number of important factors could cause actual results to differ materially from those in the forward-looking statements. Among the factors that could cause actual results to differ materially from such statements include (i) global economic conditions and general economic conditions in NEC's markets, (ii) fluctuating demand for, and competitive pricing pressure on, NEC's products and services, (iii) NEC's ability to continue to win acceptance of NEC's products and services in highly competitive markets, (iv) NEC's ability to expand into foreign markets, such as China, (v) regulatory change and uncertainty and potential legal liability relating to NEC's business and operations, (vi) NEC's ability to restructure, or otherwise adjust, its operations to reflect changing market conditions, and (vii) movement of currency exchange rates, particularly the rate between the yen and the U.S. dollar. Any forward-looking statements speak only as of the date on which they are made. New risks and uncertainties come up from time to time, and it is impossible for NEC to predict these events or how they may affect NEC. NEC does
62
not undertake any obligation to update or revise any of the forward-looking statements, whether as a result of new information, future events, or otherwise. The management targets included in this material are not projections, and do not represent management's current estimates of future performance. Rather, they represent targets that management will strive to achieve through the successful implementation of NEC's business strategies. Finally, NEC cautions you that the statements made in this material are not an offer of securities for sale. The securities may not be offered or sold in any jurisdiction in which registration is required absent registration or an exemption from registration under the applicable securities laws. For example, any public offering of securities to be made in the United States must be registered under the U.S. Securities Act of 1933 and made by means of an English language prospectus that contains detailed information about NEC and management, as well as NEC's financial statements.
***
63