
Full Year Consolidated Financial Results for the Fiscal ... · PDF file1. Consolidated...
56
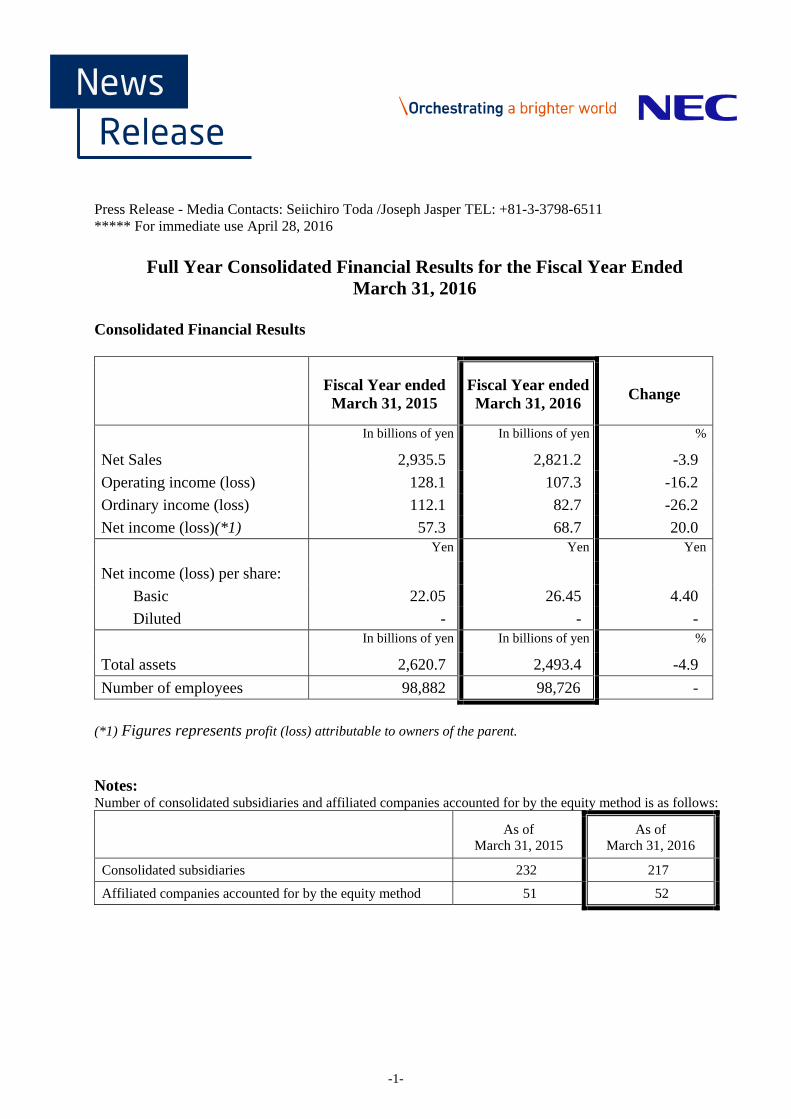
Press Release - Media Contacts: Seiichiro Toda /Joseph Jasper TEL: +81-3-3798-6511 ***** For immediate use April 28, 2016 Full Year Consolidated Financial Results for the Fiscal Year Ended March 31, 2016 Consolidated Financial Results Fiscal Year ended March 31, 2015 Fiscal Year ended March 31, 2016 Change In billions of yen In billions of yen % Net Sales 2,935.5 2,821.2 -3.9 Operating income (loss) 128.1 107.3 -16.2 Ordinary income (loss) 112.1 82.7 -26.2 Net income (loss)(*1) 57.3 68.7 20.0 Yen Yen Yen Net income (loss) per share: Basic 22.05 26.45 4.40 Diluted - - - In billions of yen In billions of yen % Total assets 2,620.7 2,493.4 -4.9 Number of employees 98,882 98,726 - (*1) Figures represents profit (loss) attributable to owners of the parent. Notes: Number of consolidated subsidiaries and affiliated companies accounted for by the equity method is as follows: As of March 31, 2015 As of March 31, 2016 Consolidated subsidiaries 232 217 Affiliated companies accounted for by the equity method 51 52 -1-
Transcript of Full Year Consolidated Financial Results for the Fiscal ... · PDF file1. Consolidated...
Press Release - Media Contacts: Seiichiro Toda /Joseph Jasper TEL: +81-3-3798-6511 ***** For immediate use April 28, 2016
Full Year Consolidated Financial Results for the Fiscal Year Ended March 31, 2016
Consolidated Financial Results
Fiscal Year ended March 31, 2015
Fiscal Year ended March 31, 2016
Change
In billions of yen In billions of yen %
Net Sales 2,935.5 2,821.2 -3.9
Operating income (loss) 128.1 107.3 -16.2
Ordinary income (loss) 112.1 82.7 -26.2
Net income (loss)(*1) 57.3 68.7 20.0Yen Yen Yen
Net income (loss) per share:
Basic 22.05 26.45 4.40
Diluted - - - In billions of yen In billions of yen %
Total assets 2,620.7 2,493.4 -4.9
Number of employees 98,882 98,726 -
(*1) Figures represents profit (loss) attributable to owners of the parent.
Notes: Number of consolidated subsidiaries and affiliated companies accounted for by the equity method is as follows:
As of March 31, 2015
As of March 31, 2016
Consolidated subsidiaries 232 217
Affiliated companies accounted for by the equity method 51 52
-1-
1. Consolidated Business Results
(1) Overview of the fiscal year ended March 31, 2016 and outlook for the fiscal year ending March 31, 2017
The overall pace of growth for the worldwide economy slowed during the fiscal year ended March 31, 2016, as stable economic performance in advanced countries, such as the United States and Europe, was offset by a significant slowdown in the growth of emerging countries due to influences from a global decline in demand for resources and unstable financial markets.
As for the Japanese economy, although the corporate sector performed well, a decline in consumer spending and public investment, as well as a downturn in exports, led to sluggish economic growth.
Under this business environment, the NEC Group accelerated efforts towards the establishment of a globally deployable Social Solutions business in the final year of its "Mid-term Management Plan 2015" for transforming the NEC Group into a "Social Value Innovator," based on three management policies consisting of a "Focus on Solutions for Society," a "Focus on Asia, Promotion of Locally-led Business" and the goal to "Stabilize Our Financial Foundation."
In terms of the "Focus on Solutions for Society," NEC's efforts for expanding business included investment in core areas such as Software-Defined Networking (SDN) as a next generation networking technology, the cloud, big data, safety and security. In terms of SDN, NEC promoted activities for its commercialization among domestic and foreign telecommunications carriers, including the delivery of communications software, such as virtualized Evolved Packet Core (vEPC) for the newly launched commercial networks from NTT DOCOMO, INC. that feature Network Functions Virtualization (NFV) technologies. Moreover, NEC has steadily increased the number of active systems utilizing its SDN, including systems for hospitals, transportation authorities, local governments and data centers, thereby contributing to the efficient construction and operations of customer networks. Regarding cloud development, NEC strengthened its cloud platform business through the "NEC Cloud IaaS" service model and the "NEC Cloud System" ownership model, as well as its hybrid cloud linking these two models, thereby helping customers to operate their businesses safely and supporting the advancement of information and telecommunications infrastructure. As for big data, NEC delivered a system for financial institutions that can gather and automatically analyze a massive amount of customer feedback received daily (the "customer testimonials”") along with a system that provides a variety of operational support, and strengthened efforts related to the Internet of Things (IoT) and artificial intelligence (AI). Regarding the safety and security sector, NEC expanded its support for the introduction, development and operation of systems related to the "My Number," social security and tax number system for governments, local public authorities and private businesses. NEC also received orders to provide face recognition systems for use by local governments throughout Japan in order to confirm the identity of citizens when their My Number cards are issued, thereby strengthening security and contributing to the safe operation of the My Number system.
Regarding the "Focus on Asia, Promotion of Locally-led Business," NEC engaged in efforts to promote growing businesses and establish new business models focused on the safety sector. Specifically, NEC received orders for an automated fingerprint identification system for the Philippine National Police, a face recognition solution for the Northern Territory Police Force in Australia, a face recognition system for customs operation at 14 leading international airports in Brazil, and a security system for the Buenos Aires subway in Argentina. Moreover, in order to protect the information assets of customers and strengthen the world's security surveillance networks, NEC established a new "Cyber Security Factory" in Singapore, following the one in
-2-
Japan that supports the development and operation of measures against cyberattacks. Furthermore, NEC's latest efforts to contribute to the safety and security of society include joint demonstration tests with the Central Weather Bureau of Taiwan for the early detection of earthquakes.
Lastly, regarding the goal to "Stabilize Our Financial Foundation," NEC secured net income and reduced interest-bearing debt as part of improving its debt-equity ratio and creating a sound balance sheet. Additionally, NEC worked on an operational reform promotion project centering on NEC Management Partner, Ltd. that carried out the transfer of staff functions and common IT assets from NEC to NEC Management Partner, Ltd.
The NEC Group recorded consolidated net sales of 2,821.2 billion yen for the fiscal year ended March 31, 2016, a decrease of 114.3 billion yen (-3.9%) year-on-year. This decrease was mainly due to decreased sales in the Public business and Telecom Carrier business as well as decreased sales from logistics services in Others no longer being consolidated, despite increased sales from the Enterprise business.
Regarding profitability, consolidated operating income (loss) worsened by 20.8 billion yen year-on-year, to an operating income of 107.3 billion yen, mainly due to decreased sales and worsening gross profit, despite reduced selling, general and administrative expenses.
In terms of consolidated ordinary income (loss), the NEC Group recorded a profit of 82.7 billion yen, worsening by 29.4 billion yen year-on-year, mainly due to the worsening of operating income (loss) in addition to the worsening of foreign exchange gain (loss).
Consolidated income (loss) before income taxes was a profit of 77.9 billion yen, a year-on-year worsening of 18.8 billion yen. This was primarily due to the worsening of ordinary income (loss), despite decreased business structure improvement expenses.
Profit (loss) attributable to owners of the parent for the fiscal year ended March 31, 2016 was a profit of 68.7 billion yen, a year-on-year improvement of 11.4 billion yen, mainly due to a tax expense decrease from the debt waiver for NEC Mobile Communications, Ltd., despite worsening of income (loss) before income taxes and the acquisition of non-controlling interests from making NEC Fielding, Ltd. a wholly-owned subsidiary in the previous fiscal year.
The NEC Group made the decision to voluntarily adopt International Financial Reporting Standards (IFRS) starting with the fiscal year ending March 31, 2017. As a result, the NEC Group's financial forecasts for the fiscal year ending March 31, 2017 are calculated based on IFRS. The NEC Group anticipates consolidated net sales of 2,880.0 billion yen, mainly due to the NEC Group experiencing growth from its focus on Solutions for Society and the expansion of global business. Moreover, the NEC Group anticipates consolidated operating income of 100.0 billion yen for the fiscal year ending March 31, 2017. The NEC Group also expects 50.0 billion yen of net income attributable to owner of the parent for the same period.
-3-
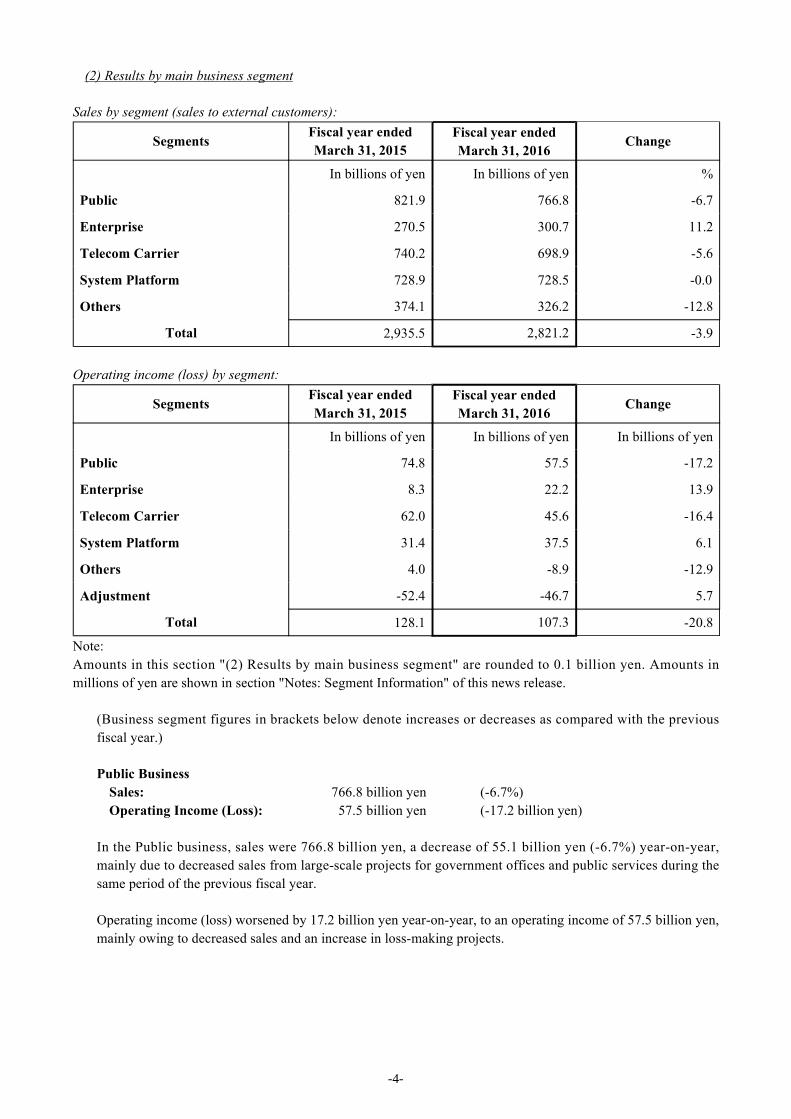
(2) Results by main business segment
Sales by segment (sales to external customers):
Segments Fiscal year ended March 31, 2015
Fiscal year ended March 31, 2016
Change
In billions of yen In billions of yen %
Public 821.9 766.8 -6.7
Enterprise 270.5 300.7 11.2
Telecom Carrier 740.2 698.9 -5.6
System Platform 728.9 728.5 -0.0
Others 374.1 326.2 -12.8
Total 2,935.5 2,821.2 -3.9
Operating income (loss) by segment:
Segments Fiscal year ended March 31, 2015
Fiscal year ended March 31, 2016
Change
In billions of yen In billions of yen In billions of yen
Public 74.8 57.5 -17.2
Enterprise 8.3 22.2 13.9
Telecom Carrier 62.0 45.6 -16.4
System Platform 31.4 37.5 6.1
Others 4.0 -8.9 -12.9
Adjustment -52.4 -46.7 5.7
Total 128.1 107.3 -20.8
Note: Amounts in this section "(2) Results by main business segment" are rounded to 0.1 billion yen. Amounts in millions of yen are shown in section "Notes: Segment Information" of this news release.
(Business segment figures in brackets below denote increases or decreases as compared with the previous fiscal year.)
Public Business Sales: 766.8 billion yen (-6.7%) Operating Income (Loss): 57.5 billion yen (-17.2 billion yen)
In the Public business, sales were 766.8 billion yen, a decrease of 55.1 billion yen (-6.7%) year-on-year, mainly due to decreased sales from large-scale projects for government offices and public services during the same period of the previous fiscal year.
Operating income (loss) worsened by 17.2 billion yen year-on-year, to an operating income of 57.5 billion yen, mainly owing to decreased sales and an increase in loss-making projects.
-4-
Enterprise BusinessSales: 300.7 billion yen (11.2%)Operating Income (Loss): 22.2 billion yen (13.9 billion yen)
In the Enterprise business, sales were 300.7 billion yen, an increase of 30.2 billion yen (11.2%) year-on-year, mainly due to increased sales from large-scale projects for the retail/services sector and manufacturing industries.
Operating income (loss) improved by 13.9 billion yen year-on-year, to an operating income of 22.2 billion yen, mainly owing to increased sales and the improved profitability of system construction services.
Telecom Carrier BusinessSales: 698.9 billion yen (-5.6%)Operating Income (Loss): 45.6 billion yen (-16.4 billion yen)
In the Telecom Carrier business, sales were 698.9 billion yen, a decrease of 41.2 billion yen (-5.6%) year-on-year, mainly due to decreased domestic sales, despite increased international sales of submarine cable systems and Telecom Operations and Management Solutions (TOMS).
Operating income (loss) worsened by 16.4 billion yen year-on-year, to an operating income of 45.6 billion yen, mainly due to decreased sales and loss-making international projects.
System Platform BusinessSales: 728.5 billion yen (-0.0%)Operating Income (Loss): 37.5 billion yen (6.1 billion yen)
In the System Platform business, sales were 728.5 billion yen, almost remaining flat year-on-year, mainly due to decreased maintenance service sales, despite increased sales in hardware.
Operating income (loss) improved by 6.1 billion yen year-on-year, to an operating income of 37.5 billion yen, mainly due to improved profitability in hardware.
OthersSales: 326.2 billion yen (-12.8%)Operating Income (Loss): -8.9 billion yen (-12.9 billion yen)
In Others, sales were 326.2 billion yen, a decrease of 47.9 billion yen (-12.8%) year-on-year, mainly due to decreased Smart Energy business, a decline in mobile phone shipments and the logistics services business no longer being consolidated.
Operating income (loss) worsened by 12.9 billion yen year-on-year, to an operating loss of 8.9 billion yen, mainly owing to decreased sales.
-5-
2. Consolidated Financial Condition
(1) Analysis of the condition of assets, liabilities, net assets, and cash flows
Total assets were 2,493.4 billion yen as of March 31, 2016, a decrease of 127.2 billion yen as compared with the end of the previous fiscal year. Current assets as of March 31, 2016 decreased by 49.5 billion yen compared with the end of the previous fiscal year to 1,527.3 billion yen, mainly due to the collection of accounts receivable-trade. Noncurrent assets as of March 31, 2016 decreased by 77.7 billion yen compared with the end of the previous fiscal year to 966.2 billion yen, mainly due to decreased net defined benefit assets and goodwill.
Total liabilities as of March 31, 2016 decreased by 95.5 billion yen compared with the end of the previous fiscal year, to 1,640.9 billion yen. This was mainly due to a decrease in notes and accounts payable-trade and interest-bearing debt. The balance of interest-bearing debt amounted to 481.0 billion yen, a decrease of 39.8 billion yen as compared with the end of the previous fiscal year. The debt-equity ratio as of March 31, 2016 was 0.61 (an improvement of 0.02 points as compared with the end of the previous fiscal year). The balance of net interest-bearing debt as of March 31, 2016, calculated by offsetting the balance of interest-bearing debt with the balance of cash and cash equivalents, amounted to 288.7 billion yen, a decrease of 51.0 billion yen as compared with the end of the previous fiscal year. The net debt-equity ratio as of March 31, 2016 was 0.36 (an improvement of 0.05 points as compared with the end of the previous fiscal year).
Total net assets were 852.5 billion yen as of March 31, 2016, a decrease of 31.7 billion yen as compared with the end of the previous fiscal year, mainly due to decreased accumulated adjustment for employee retirement benefits and foreign currency translation adjustments, despite the recording of profit attributable to the owners of the parent.
As a result, the owner's equity as of March 31, 2016 was 792.1 billion yen and owner's equity ratio was 31.8% (an improvement of 0.4 points as compared with the end of the previous fiscal year).
Net cash inflows from operating activities for the fiscal year ended March 31, 2016 were 97.8 billion yen, an improvement of 9.9 billion yen as compared with the previous fiscal year, mainly due to improved working capital.
Net cash outflows from investing activities for the fiscal year ended March 31, 2016 were 32.2 billion yen, a decrease of 15.3 billion yen as compared with the previous fiscal year. This was mainly due to decreased outflows for business acquisitions.
As a result, free cash flows (the sum of cash flows from operating activities and investing activities) for the fiscal year ended March 31, 2016 totaled a cash inflow of 65.6 billion yen, an improvement of 25.2 billion yen year-on-year.
Net cash flows from financing activities for the fiscal year ended March 31, 2016 totaled a cash outflow of 50.1 billion yen, mainly due to outflow for the redemption of bonds and payment of dividends, despite the procurement of capital from the issuance of bonds.
As a result, cash and cash equivalents as of March 31, 2016 amounted to 192.3 billion yen, an increase of 11.2 billion yen as compared with the end of the previous fiscal year.
-6-
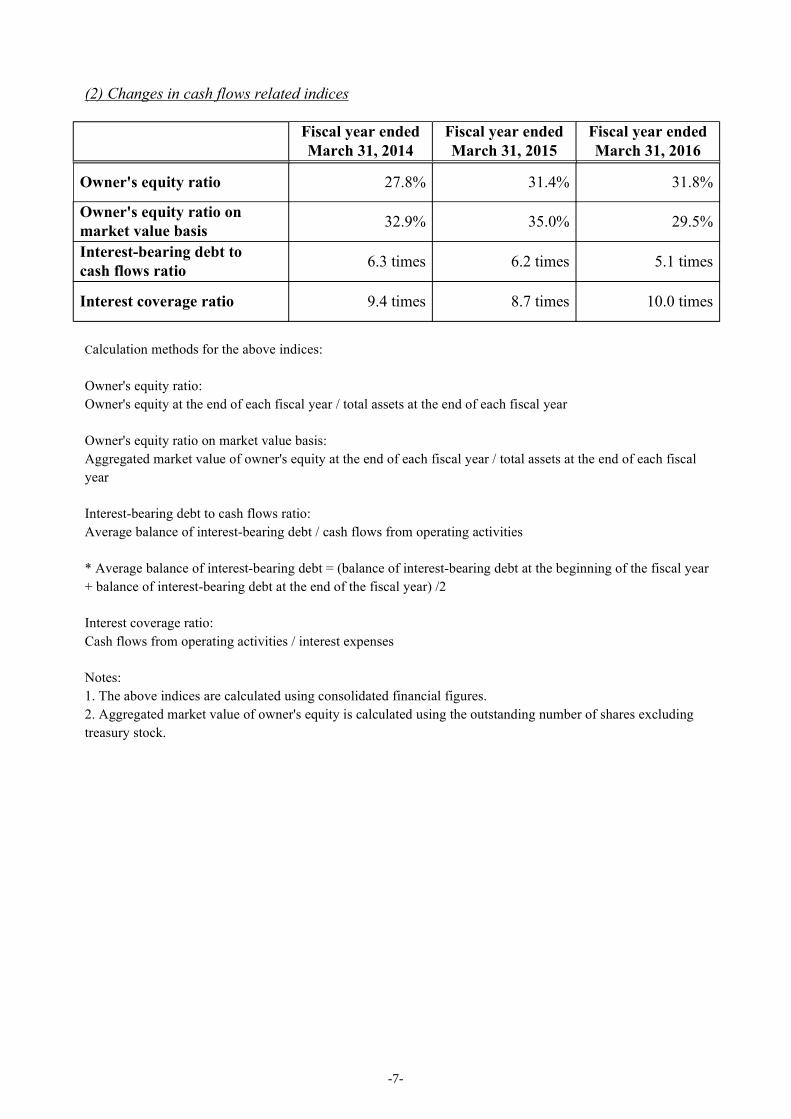
(2) Changes in cash flows related indices
Fiscal year ended
March 31, 2014 Fiscal year ended
March 31, 2015 Fiscal year ended
March 31, 2016
Owner's equity ratio 27.8% 31.4% 31.8%
Owner's equity ratio on market value basis 32.9% 35.0% 29.5%
Interest-bearing debt to cash flows ratio 6.3 times 6.2 times 5.1 times
Interest coverage ratio 9.4 times 8.7 times 10.0 times
Calculation methods for the above indices:
Owner's equity ratio: Owner's equity at the end of each fiscal year / total assets at the end of each fiscal year
Owner's equity ratio on market value basis: Aggregated market value of owner's equity at the end of each fiscal year / total assets at the end of each fiscal year
Interest-bearing debt to cash flows ratio: Average balance of interest-bearing debt / cash flows from operating activities
* Average balance of interest-bearing debt = (balance of interest-bearing debt at the beginning of the fiscal year + balance of interest-bearing debt at the end of the fiscal year) /2
Interest coverage ratio: Cash flows from operating activities / interest expenses
Notes: 1. The above indices are calculated using consolidated financial figures. 2. Aggregated market value of owner's equity is calculated using the outstanding number of shares excluding treasury stock.
-7-
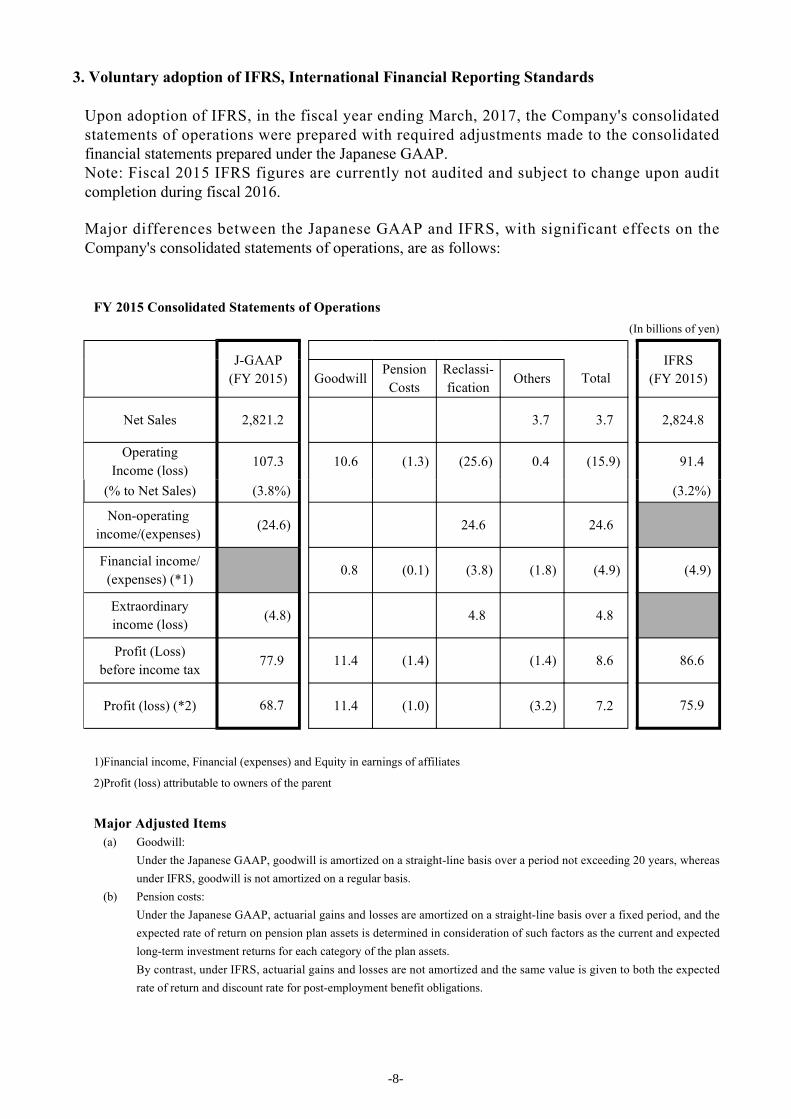
3. Voluntary adoption of IFRS, International Financial Reporting Standards
Upon adoption of IFRS, in the fiscal year ending March, 2017, the Company's consolidated statements of operations were prepared with required adjustments made to the consolidated financial statements prepared under the Japanese GAAP. Note: Fiscal 2015 IFRS figures are currently not audited and subject to change upon audit completion during fiscal 2016.
Major differences between the Japanese GAAP and IFRS, with significant effects on the Company's consolidated statements of operations, are as follows:
FY 2015 Consolidated Statements of Operations (In billions of yen)
J-GAAP
(FY 2015)
IFRS
(FY 2015)
Goodwill Pension Costs
Reclassi- fication
Others Total
Net Sales 2,821.2 3.7 3.7 2,824.8
Operating Income (loss)
107.3 10.6 (1.3) (25.6) 0.4 (15.9) 91.4
(% to Net Sales) (3.8%) (3.2%)
Non-operating income/(expenses)
(24.6) 24.6 24.6
Financial income/ (expenses) (*1)
0.8 (0.1) (3.8) (1.8) (4.9) (4.9)
Extraordinary income (loss)
(4.8) 4.8 4.8
Profit (Loss) before income tax
77.9 11.4 (1.4) (1.4) 8.6 86.6
Profit (loss) (*2) 68.7 11.4 (1.0) (3.2) 7.2 75.9
1)Financial income, Financial (expenses) and Equity in earnings of affiliates
2)Profit (loss) attributable to owners of the parent
Major Adjusted Items (a) Goodwill:
Under the Japanese GAAP, goodwill is amortized on a straight-line basis over a period not exceeding 20 years, whereas under IFRS, goodwill is not amortized on a regular basis.
(b) Pension costs: Under the Japanese GAAP, actuarial gains and losses are amortized on a straight-line basis over a fixed period, and the expected rate of return on pension plan assets is determined in consideration of such factors as the current and expected long-term investment returns for each category of the plan assets. By contrast, under IFRS, actuarial gains and losses are not amortized and the same value is given to both the expected rate of return and discount rate for post-employment benefit obligations.
-8-
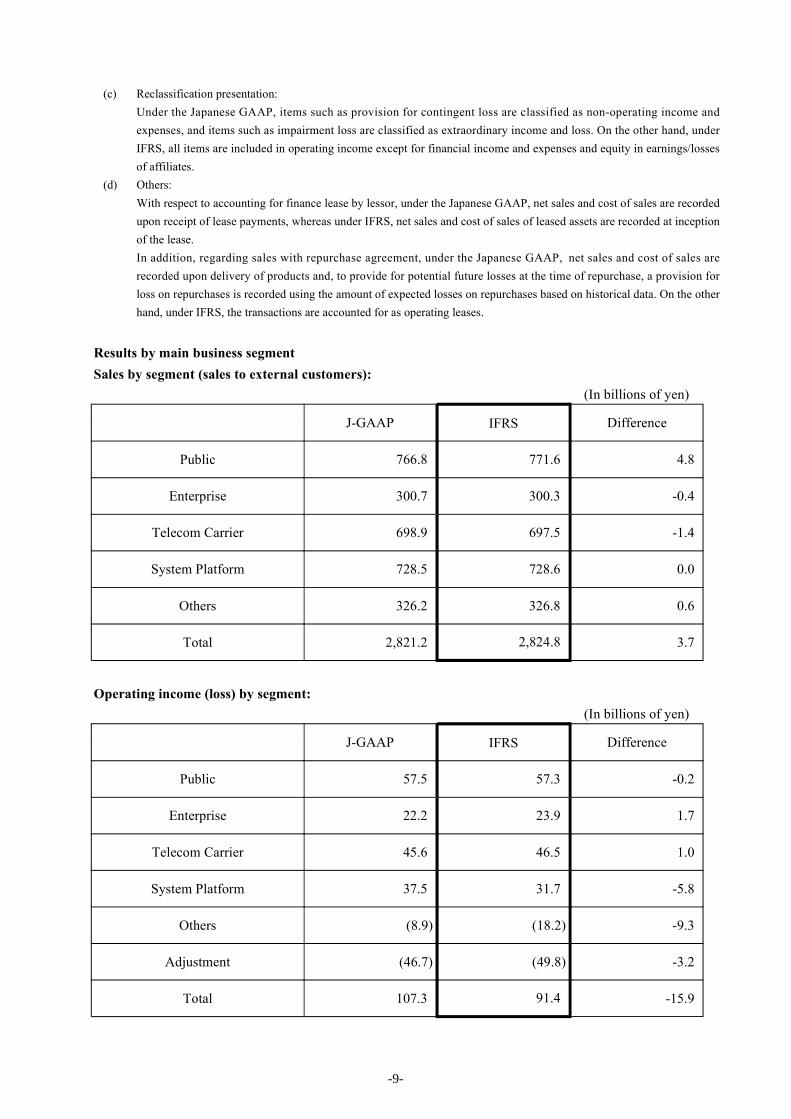
(c) Reclassification presentation: Under the Japanese GAAP, items such as provision for contingent loss are classified as non-operating income and expenses, and items such as impairment loss are classified as extraordinary income and loss. On the other hand, under IFRS, all items are included in operating income except for financial income and expenses and equity in earnings/losses of affiliates.
(d) Others: With respect to accounting for finance lease by lessor, under the Japanese GAAP, net sales and cost of sales are recorded upon receipt of lease payments, whereas under IFRS, net sales and cost of sales of leased assets are recorded at inception of the lease. In addition, regarding sales with repurchase agreement, under the Japanese GAAP, net sales and cost of sales are recorded upon delivery of products and, to provide for potential future losses at the time of repurchase, a provision for loss on repurchases is recorded using the amount of expected losses on repurchases based on historical data. On the other hand, under IFRS, the transactions are accounted for as operating leases.
Results by main business segment Sales by segment (sales to external customers): (In billions of yen)
J-GAAP IFRS Difference
Public 766.8 771.6 4.8
Enterprise 300.7 300.3 -0.4
Telecom Carrier 698.9 697.5 -1.4
System Platform 728.5 728.6 0.0
Others 326.2 326.8 0.6
Total 2,821.2 2,824.8 3.7
Operating income (loss) by segment: (In billions of yen)
J-GAAP IFRS Difference
Public 57.5 57.3 -0.2
Enterprise 22.2 23.9 1.7
Telecom Carrier 45.6 46.5 1.0
System Platform 37.5 31.7 -5.8
Others (8.9) (18.2) -9.3
Adjustment (46.7) (49.8) -3.2
Total 107.3 91.4 -15.9
-9-
4. Fundamental Policy on Distribution of Earnings and Dividends for the Fiscal Year EndedMarch 31, 2016 and the Fiscal Year Ending March 31, 2017
NEC's commitment to shareholder returns includes comprehensive consideration for the profitstatus of each period in addition to future capital requirements and the execution of businessoperations with an emphasis on capital efficiency, while regarding investment in growth areas andthe enhancement of its financial base as being tied to the creation of long-term corporate value.
Since profit (loss) attributable to owners of the parent for the fiscal year ended March 31, 2016was in line with expectations, NEC declared an annual dividend of 6 yen per share of commonstock, the same value as announced at the beginning of the fiscal year.
For the fiscal year ending March 31, 2017, NEC plans for an annual dividend of 6 yen per share ofcommon stock, while no interim dividend will be paid.
In addition, NEC stipulates in its Articles of Incorporation that it may determine distribution ofsurplus dividends flexibly through resolutions of the Board of Directors, and that record dates ofdistribution of surplus dividends shall be March 31 and September 30.
-10-
5. Risk Factors
The NEC Group's business is subject to various risks. The principal risks affecting the NECGroup's business are described briefly below.
(1) Risks related to economic conditions and financial markets
<1> Influence of economic conditionsThe NEC Group's business is dependent, to a significant extent, on the Japanese market. The NEC Group's consolidated net sales to customers in Japan accounted for 78.6% of its total net sales in the fiscal year ended March 31, 2016. The deterioration of economic conditions in Japan in the future could have a material adverse effect on the results of operations and the financial position of the NEC Group.
Moreover, the NEC Group's business is also influenced by the economic conditions of countries and regions including Asia, Europe and the United States in which the NEC Group operates its business.
Uncertainties in the economy make it difficult to forecast future levels of economic activity. Because the components of the NEC Group's planning and forecasting depend upon estimates of economic activity in the markets that the NEC Group serves, the prevailing economic uncertainty makes it more difficult than usual to estimate its future income and required expenditures. If the NEC Group is mistaken in its planning and forecasting, there is a possibility that the NEC Group will not be able to appropriately respond to the changing market conditions.
<2> Volatile nature of marketsMarkets for some of the NEC Group's products are volatile. Downturns have been characterized by diminished demand, obsolete products, excess inventories, accelerated erosion of prices, and periodic overproduction. The volatile nature of the relevant markets may lead to future recurrences of downturns with similar or more adverse effects on the NEC Group's results of operations.
<3> Fluctuations in foreign currency exchange and interest rateThe NEC Group is exposed to risks of foreign currency exchange rate fluctuations. The NEC Group's consolidated financial statements, which are presented in Japanese yen, are affected by fluctuations in foreign exchange rates. Changes in exchange rates affect the yen value of the NEC Group's equity investments and monetary assets and liabilities arising from business transactions in foreign currencies. They also affect the costs and sales proceeds of products or services that are denominated in foreign currencies. Despite measures undertaken by the NEC Group to reduce, or hedge against, foreign currency exchange risks, foreign exchange rate fluctuations may hurt the NEC Group's business, results of operations and financial condition. Depending on the movements of particular foreign exchange rates, the NEC Group may be adversely affected at a time when the same currency movements are benefiting some of its competitors.
The NEC Group is also exposed to risks of interest rate fluctuations, which may affect its overall operational costs and the value of its financial assets and liabilities, in particular, long-term debt. Despite measures undertaken by the NEC Group to hedge a portion of its exposure against interest rate fluctuations, such fluctuations may increase the NEC Group's operational costs, reduce the value of its financial assets, or increase the value of its liabilities.
-11-
(2) Risks related to the NEC Group's Management Policy
<1> Finance and profit fluctuations The NEC Group's results of operations for any quarter or year are not necessarily indicative of results to be expected in future periods. The NEC Group's results of operations have historically been, and will continue to be, subject to quarterly and yearly fluctuations as a result of a number of factors, including:
● the introduction and market acceptance of new technologies, products, and services; ● variations in product costs, and the mix of products sold;
● the size and timing of customer orders, which in turn will often depend upon the success
of customers' businesses or specific products or services; ● the impact of acquired businesses and technologies; ● manufacturing capacity and lead times; and ● fixed costs.
There are other trends and factors beyond the NEC Group's control which may affect its results of operations, and make it difficult to predict results of operations for a particular period. These include:
● adverse changes in the market conditions for the products and services that the NEC
Group offers;
● governmental decisions regarding the development and deployment of IT and communications infrastructure, including the size and timing of governmental expenditures in these areas;
● the size and timing of capital expenditures by its customers; ● inventory practices of its customers;
● general conditions for IT and communication markets, and for the domestic and global
economies;
● changes in governmental regulations or policies affecting the IT and communications
industries;
● adverse changes in the public and private equity and debt markets, and the ability of its
customers and suppliers to obtain financing or to fund capital expenditures; and ● adverse changes in the credit conditions of its customers and suppliers.
These trends and factors could have a material adverse effect on the NEC Group's business, results of operations and financial condition.
<2> Acquisitions and other business combinations and reorganizations The NEC Group has completed and continues to seek appropriate opportunities for acquisitions and other business combinations and reorganizations in order to expand its business and strengthen its competitiveness. The NEC Group faces risks arising from acquisitions, business combinations and reorganizations, which could adversely affect its ability to achieve its strategic goals. For example,
● The NEC Group may be unable to realize the growth opportunities, improvement of its financial position, investment effect and other expected benefits by these acquisitions, business combinations and reorganizations in the expected time period or at all;
● The planned transactions may not be completed as scheduled or at all due to legal or regulatory requirements or contractual and other conditions to which such transactions are subject;
● Unanticipated problems could also arise in the integration process, including unanticipated restructuring or integration expenses and liabilities, as well as delays or other difficulties in coordinating, consolidating and integrating personnel, information and management systems, and customer products and services;
-12-
● The combined or reorganized entities may not be able to retain existing customers and strategic partners to the extent that they wish to diversify their suppliers for cost and risk management and other purposes;
● The combined or reorganized entities may require additional financial support from the
NEC Group;
● The diversion of management and key employees' attention may detract from the NEC
Group's ability to increase revenues and minimize costs;
● The goodwill and other intangible assets arising from the acquisitions and business
reorganizations are subject to amortization and impairment charges;
● NEC Group's investments in the combined or reorganized entities are subject to valuation
and other losses; and ● The transactions may result in other unanticipated adverse consequences.
Any of the foregoing and other risks may adversely affect the NEC Group's business, results of operations, financial condition and stock price.
<3> Alliance with strategic partners The NEC Group has entered into a number of long-term strategic alliances with leading industry participants, both to develop new technologies and products and to manufacture existing and new products. If the NEC Group's strategic partners encounter financial or other business difficulties, if their strategic objectives change or if they no longer perceive the NEC Group to be an attractive alliance partner, they may no longer desire or be able to participate in the NEC Group's alliances. The NEC Group's business could be hurt if the NEC Group is unable to continue one or more of its alliances. The NEC Group participates in large projects where the NEC Group and various other companies provide services and products that are integrated into systems to meet customer requirements. If any of the services or products that any other company provides have any defects or problems causing the integrated systems to malfunction or otherwise fail to meet customer requirements, the NEC Group's reputation and business could be harmed.
<4> Expansion of global business The NEC Group's strategies include expanding its business in markets outside Japan. In many of these markets, the NEC Group faces entry barriers such as the existence of long-standing relationships between its potential customers and their local suppliers, and protective regulations. In addition, pursuing international growth opportunities may require the NEC Group to make significant investments long before it realizes returns on the investments, if any. Increased investments may result in expenses growing at a faster rate than revenues. The NEC Group's overseas projects and investments, particularly in China, could be adversely affected by:
● exchange controls; ● restrictions on foreign investment or the repatriation of income or invested capital; ● nationalization of local industries; ● changes in export or import restrictions; ● changes in the tax system or rate of taxation in the countries; and ● economic, social, and political risks.
In addition, difficulties in foreign financial markets and economies, particularly in emerging markets, could adversely affect demand from customers in the affected countries. Because of these factors, the NEC Group may not succeed in expanding its business in international markets. This could hurt its business growth prospects and results of operations.
-13-
(3) Risks related to the NEC Group's business and operations
<1> Technological advances and response to customer needs The markets for the products and services that the NEC Group offers are characterized by rapidly changing technology, evolving technical standards, changes in customer preferences, and the frequent introduction of new products and services. The development and commercialization of new technologies and the introduction of new products and services will often make existing products and services obsolete or unmarketable. The NEC Group's competitiveness in the future will depend at least in part on its ability to:
● keep pace with rapid technological developments and maintain technological leadership; ● enhance existing products and services; ● develop and manufacture innovative products in a timely and cost-effective manner; ● utilize or adjust to new products, services, and technologies; ● attract and retain highly capable technical and engineering personnel;
● accurately assess the demand for, and perceived market acceptance of, new products and
services that the NEC Group develops; ● avoid delays in developing or shipping new products; ● address increasingly sophisticated customer requirements; and ● have the NEC Group's products integrated into its customers' products and systems.
The NEC Group may not be successful in identifying and marketing product and service enhancements, or offering and supporting new products and services, in response to rapid changes in technologies and customer preferences. If the NEC Group fails to keep up with these changes, its business, results of operations and financial condition will be significantly harmed. In addition, the NEC Group may encounter difficulties in incorporating its technologies into its products in accordance with its customers' expectations, which may adversely affect its relationships with its customers, its reputation and revenues.
The NEC Group seeks to form and enhance alliances and partnerships with other companies to develop and commercialize technologies that will become industry standards for the products that it currently sells and plans to sell in the future. The NEC Group spends significant financial, human and other resources on developing and commercializing such technologies. The NEC Group may not, however, succeed in developing or commercializing such standard-setting technologies if its competitors' technologies are accepted as industry standards. In such a case, the NEC Group's competitive position, reputation and results of operations could be adversely affected.
The process of developing new products entails many risks. The development process can be lengthy and costly, and requires the NEC Group to commit a significant amount of resources well in advance of sales. Technology and standards may change while the NEC Group is in the development stage, rendering its products obsolete or uncompetitive before their introduction. The NEC Group's newly developed products may contain undetected errors that may be discovered after their introduction and shipment. These undetected errors could make the NEC Group liable for damages incurred by its customers.
<2> Production process The markets in which the NEC Group operates are characterized by the introduction of products with short life cycles in a rapidly changing technological environment. Production processes of electronics products are highly complex, require advanced and costly manufacturing facilities, and must continuously be modified to improve efficiency and performance. Production difficulties or inefficiencies might affect profitability or interrupt production, and the NEC Group may not be able to deliver products on time in a cost-effective
-14-
and competitive manner. If production is interrupted, the NEC Group may not be able to shift production to other facilities quickly, and customers may purchase products from other suppliers. The resulting shortage of manufacturing capacity for some products could adversely affect the NEC Group's ability to compete. The resulting reductions in revenues could be significant.
Legal and practical restrictions on the termination of employees, union agreements, and other factors limit the NEC Group's ability during industry downturns to reduce its production capacity and costs in order to adjust to reduced levels of demand. Conversely, during periods of increasing demand, the NEC Group may not have sufficient capacity to meet customer orders. As a result, the NEC Group may lose sales as customers turn to competitors who may be able to satisfy their increased demand.
<3> Defects in products and services The NEC Group faces risks arising from defects in its products and services. Many of its products and services are used in "mission critical" situations where the adverse consequences of failure may be severe, exposing it to even greater risk. Product and service defects could make the NEC Group liable for damages incurred by its customers. Negative publicity concerning these problems could also make it more difficult to convince customers to buy the NEC Group's products and services.
In order to prevent the defects of products and services or unprofitable projects, the NEC Group takes thorough measures to control risks in projects such as system development projects from the beginning of business negotiation, through understanding of customer's confirmed system requirements or technical difficulties, and quality control measures on hardware and software of which systems consist. However, it is difficult to prevent them completely. The defects of its products or services or unprofitable projects could hurt the NEC Group's business, results of operations and financial condition.
<4> Material procurement The NEC Group's manufacturing operations depend on obtaining deliveries of raw materials, components, equipment, and other supplies in a timely manner. In some cases, the NEC Group purchases on a just-in-time basis. Because the products that the NEC Group purchases are often complex or specialized, it may be difficult for the NEC Group to substitute one supplier for another or one product for another. Some products are available only from a limited number of suppliers or a single supplier. Although the NEC Group believes that supplies of the raw materials, components, equipment, and other supplies that the NEC Group uses are currently adequate, shortages in critical materials could occur due to an interruption in supply or an increase in industry demand. In addition, a financial market disruption could pose liquidity or solvency risks for the NEC Group's suppliers, which could reduce its sources of supply or disrupt its supply chain. The NEC Group's results of operations would be hurt if it could not obtain adequate delivery of these supplies in a timely manner, or if it had to pay significantly more for them. Reliance on suppliers and industry supply conditions generally involve several risks, including:
● insolvency of, or other liquidity constraints affecting, key suppliers;
● the possibility of defective raw materials, components, equipment or other supplies,
which can adversely affect the reliability and reputation of the NEC Group's products;
● a shortage of raw materials, components, equipment or other supplies, and reduced control over delivery schedules, which can adversely affect the NEC Group's manufacturing capacity and efficiencies; and
● an increase in the cost of raw materials, components, equipment and other supplies,
which can adversely affect the NEC Group's profitability.
-15-
<5> Intellectual property rights The NEC Group depends on its proprietary technology, and its ability to obtain patents and other intellectual property rights covering its products, services, business models, and design and manufacturing processes. The applications for patents and the maintenance of registered patents can be a time and cost consuming process. The NEC Group's patents could be challenged, invalidated, or circumvented. The fact that the NEC Group holds many patents or other intellectual property rights does not ensure that the rights granted under them will provide competitive advantages to the NEC Group. For example, the protection afforded by the NEC Group's intellectual property rights may be undermined by rapid changes in technologies in the industries in which the NEC Group operates. Similarly, there can be no assurance that claims allowed on any future patents will be broad enough to protect the NEC Group's technology. Effective patent, copyright, and trade secret protection may be unavailable or limited in some countries, and the NEC Group's trade secrets may be vulnerable to disclosure or misappropriation by employees, contractors, and other persons. Further, pirated products of inferior quality infringing the NEC Group's intellectual property rights may damage its brand and adversely affect sales of its products. Litigation, which could consume financial and management resources, may be necessary to enforce the NEC Group's patents or other intellectual property rights.
<6> Intellectual property licenses owned by third parties Many of the NEC Group's products are designed to include software or other intellectual property licenses from third parties. While it may be necessary in the future to seek or renew licenses relating to various aspects of the NEC Group's products, the NEC Group believes that, based upon experience and industry's standard practices, these licenses can be obtained on commercially reasonable terms in principle. There can be no assurance that the NEC Group will be able to obtain, on commercially reasonable terms or at all, from third parties the licenses that the NEC Group will need.
<7> Intense competition Competition creates an unfavorable pricing environment for the NEC Group in many of the markets in which it operates. Competition places significant pressure on the NEC Group's ability to maintain gross margins and is particularly acute during market slowdowns. The entry of additional competitors into the markets in which the NEC Group operates increases the risk that its products and services will become subject to intense price competition. Some of the NEC Group's competitors mainly in Asian countries may have an advantage of lower production cost than the NEC Group does and may be able to compete for customers more effectively than it can in terms of price. In recent years, the time between the introduction of a new product developed by the NEC Group and the production of the same or a comparable product by its competitors has become shorter. This has increased the risk that the products the NEC Group offers will become subject to intense price competition sooner than in the past.
The NEC Group has many competitors in Japan and other countries, ranging from large multinational corporations to a number of relatively small, rapidly growing, and highly specialized companies. Unlike many of the NEC Group's competitors, however, it operates in many businesses and competes with companies that specialize in one or more of its product or service lines. As a result, the NEC Group may not be able to fund or invest in some of its businesses as much as its competitors can, and it may not be able to change or take advantage of market opportunities as quickly or as well as they can.
The NEC Group sells products and services to some of its current and potential competitors. For example, the NEC Group receives orders from, and provides solutions to, competitors that
-16-
further integrate or otherwise use its solutions for large projects for which such competitors are engaged as the primary solutions provider. If these competitors cease to use the NEC Group's solutions for such large projects for competitive or other reasons, the NEC Group's business could be harmed.
<8> Dependence on certain key customers The NEC Group's business, results of operations and financial condition may be adversely affected if certain key customers such as the NTT group, reduce their level of capital expenditures or current procurement or shift their investment focus as a result of such factors as significant business or financial problems.
<9> Risks related to customers' financial difficulties The NEC Group sometimes provides vendor financing to its customers or offer customers extended payment terms or other forms of financing to assist their purchase of the NEC Group's products and services. If the NEC Group is unable to provide or facilitate such payment arrangements or other forms of financing to its customers on terms acceptable to them or at all, due to financial difficulties or otherwise, the NEC Group's results of operations could be adversely affected. In addition, many of the NEC Group's customers purchase products and services from the NEC Group on payment terms that provide for deferred payment. If the NEC Group's customers for whom it has extended payment terms or provided other financing terms, or from whom it has substantial accounts receivable, encounter financial difficulties or inability to access credit from others, and are unable to make payments on time, the NEC Group's business, results of operations and financial condition could be adversely affected.
<10> Retention of personnel The NEC Group must compete for talented employees to develop its products, services and solutions. As a result, the NEC Group's human resources organization focuses significant efforts on attracting and retaining individuals in key technology positions. If the NEC Group experiences a substantial loss of, or an inability to attract, talented personnel, it may experience difficulty in meeting its business objectives.
<11> Financing The NEC Group's primary sources of funds are cash flows from operations, borrowings from banks and other institutional lenders, and funding from the capital markets, such as offerings of commercial paper and other debt securities. A downgrade in the NEC Group's credit ratings could result in increases in its interest expenses and could have an adverse impact on its ability to access the commercial paper market or other debt markets, which could have an adverse effect on the NEC Group's financial position and liquidity.
A failure of one or more of the NEC Group's major lenders, a decision by one or more of them to stop lending to the NEC Group or instability in the capital markets could have an adverse impact on the NEC Group's access to funding. If the NEC Group fails to obtain external financing on terms acceptable to it, or at all, or to generate sufficient cash flows from its operations or sales of its assets, when necessary, the NEC Group will be unable to fulfill its obligations, and its business will be materially adversely affected. In addition, to the extent the NEC Group finances its activities with additional debt, the NEC Group may become subject to financial and other covenants that may restrict its ability to pursue its growth strategy.
-17-
(4) Risks related to internal control, legal proceedings, laws and governmental policies
<1> Internal controlThe NEC Group is taking action to guarantee the accuracy of its financial reporting by strengthening its internal controls with expanding documentation of the business process and implementing stronger internal auditing. However, even effective internal control systems can provide only reasonable assurance with respect to the preparation and fair presentation of financial statements. For example, the inherent limitations of internal control systems include fraud, human error, or circumvention of controls, such as through collusion among multiple employees. In addition, the systems may not be able to effectively deal with changes in the business environment unforeseen at the time that the systems were implemented or with non-routine transactions. The NEC Group's established business processes may not function effectively, and fraudulent acts, such as false financial reporting or embezzlement, or inadvertent mistakes may occur. Such events may require restatement of financial information and could adversely affect the NEC Group's financial condition or results of operations. The NEC Group's reputation in the financial markets may also be damaged as a result of these events. In addition, if any administrative or judicial sanction is issued against the NEC Group as a result of these events, it may lose business opportunities.
If the NEC Group identifies a material weakness in its internal control systems, the NEC Group may incur significant additional costs for remedying such weakness. Despite the efforts by the NEC Group to continually improve and standardize its business processes from the perspective of ensuring effective operations and enhancing efficiency, it is difficult to design and establish common business processes since the NEC Group operates in a diverse range of countries and regions, using varying business processes. Consequently, the efforts by the NEC Group to further improve and standardize its business processes may continue to occupy significant management and human resources and the NEC Group may incur considerable financial costs.
<2> Legal proceedingsFrom time to time, the NEC Group companies are involved in various lawsuits and legal proceedings, including intellectual property infringement claims. Due to the existence of a large number of intellectual property rights in the fields in which the NEC Group operates and the rapid rate of issuance of new intellectual property rights, it is difficult to completely judge in advance whether a product or any of its components may infringe upon the intellectual property rights of others. Whether or not intellectual property infringement claims against the NEC Group companies have merit, significant financial and management resources may be required to defend the NEC Group from such claims. If an intellectual property infringement claim by a third party is successful and the NEC Group could not obtain a license of technology which is subject of the infringement claim or any substitution thereof, it could have a material adverse effect on the NEC Group's business, results of operations and financial condition.
The NEC Group may also from time to time be involved in various lawsuits and legal proceedings concerning such laws as business laws, antitrust laws, product liability laws, and environmental laws other than intellectual property infringement actions.
It is difficult to foresee the results of legal actions and proceedings currently involving the NEC Group or of those which may arise in the future, and an adverse result in these matters could have a significant negative effect on the NEC Group's business, results of operations and financial condition. In addition, any legal or administrative proceedings which the NEC Group
-18-
is subject to could require the significant involvement of senior management of the NEC Group, and may divert management attention from the NEC Group's business and operations.
<3> Laws and governmental policies In many of the countries in which the NEC Group operates, its business is subject to various risks associated with unexpected regulatory changes, uncertainty in the application of laws and governmental policies and uncertainty relating to legal liabilities. Substantial changes in the regulatory or legal environments, including the economic, tax, defense, labor, spending and other policies of the governments of Japan and other jurisdictions in which the NEC Group operates could adversely affect its business, results of operations and financial condition.
Changes in Japanese and international telecommunications regulations and tariffs, including those pertaining to Internet-related businesses and technologies, could affect the sales of the NEC Group's products or services, and this could adversely affect its business, results of operations and financial condition.
<4> Environmental laws and regulations The NEC Group's operations are subject to many environmental laws and regulations governing, among other things, air emissions, wastewater discharges, the use and handling of hazardous substances, waste disposal, chemical substances in products, product recycling, soil and ground water contamination and global warming. The NEC Group faces risks of environmental liability arising from its current, historical, and future manufacturing activities. The NEC Group endeavors to comply with laws and government policies, establishing self-management norms and conducting daily inspections and environmental auditing in accordance with its internal environmental policies. However, costs associated with future additional and stricter environmental compliance or remediation obligations could adversely affect the NEC Group's business, results of operations and financial condition.
<5> Tax practice The NEC Group's effective tax rate could be adversely affected by: earnings being lower than anticipated in countries that have lower tax rates and higher than anticipated in countries that have higher tax rates; changes in the valuation of the NEC Group's deferred tax assets and liabilities; transfer pricing adjustments; tax effects of nondeductible compensation; or changes in tax laws, regulations, accounting principles or interpretation thereof in the various jurisdictions in which the NEC Group operates. Any significant increase in the NEC Group's future effective tax rates could reduce net income for future periods.
The NEC Group currently carries deferred tax assets resulting from tax loss carry forwards and deductible temporary differences, both of which will reduce its taxable income in the future. However, the deferred tax assets may only be realized against taxable income. The amount of the NEC Group's deferred tax assets that is considered realizable could be reduced from time to time if estimates of future taxable income from its operations and tax planning strategies during the carry forward period are lower than forecasted, due to further deterioration in market conditions or other circumstances. In addition, the amount of the NEC Group's deferred tax assets could be reduced due to changes in tax laws, regulations or accounting principles related to future deductions of income tax rates. Any such reduction will adversely affect the NEC Group's income for the period of the adjustment.
Furthermore, the NEC Group is subject to continuous audits and examination of its income tax returns by tax authorities of various jurisdictions. The NEC Group regularly assesses the likelihood of adverse outcomes resulting from these audits and examinations to determine the adequacy of its provisions for income taxes. There can be no assurance that the outcomes of
-19-
these audits and examinations will not have an adverse effect on the NEC Group's results of operations and financial condition.
<6> Information management The NEC Group stores a voluminous amount of personal information, including “My Number” social security and tax number information, as well as confidential information in the regular course of its business. There have been many cases where such information and records in the possession of corporations and institutions were leaked, improperly accessed or exposed by a cyberattack. If personal or confidential information in the NEC Group's possession about its customers or employees is leaked, improperly accessed or exposed by a cyberattack and subsequently misused, it may be subject to liability and regulatory action, and its reputation and brand value may be damaged.
The NEC Group is required to handle personal information in compliance with the Act on the Protection of Personal Information and other legal or regulatory requirements. The NEC Group may have to provide compensation for economic loss and emotional distress arising out of a failure to protect such information. The cost and operational consequences of implementing further data protection measures could be significant. In addition, incidents of unauthorized disclosure could create a negative public perception of the NEC Group's operations, systems or brand, which may in turn decrease customer and market confidence in the NEC Group and materially and adversely affect its business, results of operations and financial condition.
<7>Human rights and work environment In the countries and regions where the NEC Group operates, there is growing interest in how corporations respond to issues related to human rights and occupational safety and health. In the event that the NEC Group's business offices and/or supply chain is unable to appropriately respond to these issues, the NEC Group may be faced with criticism from a range of stakeholders, including local residents, clients, consumers, shareholders, investors and human rights organizations, and it may cause the reputation and brand value of the NEC Group to be damaged.
(5) Other Risks
<1> Natural and fire disasters Natural disasters, fires, abnormal weather (e.g. water shortages) due to climate change, public health issues, armed hostilities, terrorism and other incidents, whether in Japan or any other country in which the NEC Group operates, could cause damage or disruption to the NEC Group, its suppliers or customers, or could create political or economic instability, any of which could harm its business. For example, several of the NEC Group's facilities in Japan could be subject to catastrophic loss caused by earthquakes. The spread of unknown infectious diseases, such as a new type of influenza virus or a worsening of the H1N1 pandemic, could affect adversely the NEC Group's operations by rendering its employees unable to work, reducing customer demand or by disrupting its suppliers' operations. In addition, under the circumstance where network and information systems become more important to operating activities of the NEC Group, such systems are vulnerable to shutdowns caused by unforeseen events such as power outages or natural disasters or terrorism, hardware or software defects, or computer viruses and computer hacking. Although the NEC Group has various measures in place, including the earthquake-resistant reinforcement of its principal facilities in Japan, periodic training drills for employees and redundant back-up information systems, and have adopted and implemented a group-wide business continuity plan outlining countermeasures to be taken in response to these events, any of these events, over which the NEC Group has little or no control, could cause a decrease in demand for its products or services, make it difficult or
-20-
impossible for the NEC Group to deliver products or for its suppliers to deliver components, require large expenditures to repair or replace its facilities or create delays and inefficiencies in its supply chain.
<2> Accounting policies The methods, estimates and judgments that the NEC Group uses in applying in its accounting policies could have a significant impact on its results of operations. Such methods, estimates and judgments are, by their nature, subject to substantial risks, uncertainties and assumptions, and factors may arise over time that lead the NEC Group to change its methods, estimates and judgments. Changes in those methods, estimates and judgments could significantly affect the NEC Group's results of operations. Due to the volatility in the financial markets and overall economic uncertainty, the actual amounts realized in the future on the NEC Group's debt and equity investments may differ significantly from the fair values currently assigned to them. The application of new or revised accounting standards may significantly affect the NEC Group's financial condition and its results of operations.
<3> Retirement benefit obligations Changes in actuarial assumptions such as discount rates on which the calculation of projected benefit obligations are based may have an adverse effect on the NEC Group's financial condition and its results of operations. For example, there is a possibility of retirement benefit obligations and/or retirement benefit expenses increasing in the event of a future reduction in discount rates or prior service costs resulting from a change in the system.
<4> Sale of NEC's common stock in the United States As a result of the failure to file annual reports on Form 20-F with the Securities and Exchange Commission in the United States (the "SEC") for the fiscal year ended March 31, 2006 and thereafter, American depositary shares of NEC were delisted from the NASDAQ Stock Market in October 2007. In addition, NEC was subject to an informal inquiry by the SEC concerning matters including its failure to file annual reports on Form 20-F for the fiscal year ended March 31, 2006 and thereafter. In June 2008, NEC entered into a settlement agreement with the SEC, and as part of the settlement, the SEC issued an order under Section 12(j) of the U.S. Securities Exchange Act of 1934 (the “Exchange Act”). The SEC ordered that (a) NEC cease and desist from the violations of the Exchange Act because the SEC found that certain actions violated the Exchange Act, and (b) the registration under the Exchange Act of its common stock and American depositary shares be revoked. NEC did not admit or deny the findings by the SEC set forth in the order. No fine or other monetary payment was required under the order. As a result of the revocation, no broker or dealer worldwide and no member of a U.S. securities exchange may make use of the mails or any means or instrumentality of interstate commerce in the United States to effect any transaction in, or to induce the purchase or sale of, shares of common stock or American depositary shares of NEC. Accordingly, it may be difficult for shareholders of NEC to sell or purchase the shares of NEC's common stock in the United States, and this situation may continue in the future.
-21-

Management Policy
1. Fundamental Management Policy
Based on the NEC Group Corporate Philosophy, "NEC strives through "C&C" to help advancesocieties worldwide towards deeper mutual understanding and the fulfillment of human potential,"the NEC Group aims to become a global company by contributing to the development of aninformation society through "C&C," the integration of Computers (Information Technology) andCommunications (Telecommunication Technology).
To pursue this philosophy, the NEC Group jointly adopted the "NEC Group Vision," whichrepresents the NEC Group's desired image of society and group business, as well as the "NECGroup Values" of shared behavioral principles and values that are necessary to realize the NECGroup Vision.
NEC Group Vision:"To be a leading global company leveraging the power of innovation to realize an informationsociety friendly to humans and the earth"
The NEC Group aims to lead the world in realizing an information society that is friendly tohumans and the earth, where information and communication technologies help people as anintegral part of their lives, and act in harmony with the global environment through innovation thatunites the powers of intelligence, expertise and technology inside and outside of the NEC Group.
NEC Group Values:"Passion for Innovation," "Self-help," "Collaboration," "Better Products, Better Services"
The NEC Group will strive to provide satisfaction and inspiration for our customers through theefforts of self-reliant individuals, motivated by a "passion for innovation," that work as part of ateam to continuously pursue the provision of better products and services. This mentality of"Better Products, Better Services"- not settling for less than the best - has been shared amongemployees since the establishment of the NEC Group. The NEC Group aims to pursue itsCorporate Philosophy and realize the Group Vision through actions based on the Values that havebeen passed down and fostered over the more than 100-year history of the NEC Group.
Finally, the NEC Group aims for sustained growth for society and business through efforts toincrease its corporate value by practicing the "NEC Way" which systemizes the structure of theNEC Group's management activities such as Corporate Philosophy, Vision, Core Values, Charterof Corporate Behavior, Code of Conduct and its drive to bring satisfaction to all of itsstakeholders, including shareholders, customers, communities and employees alike.
2. Management Indicator Goals
The NEC Group aims to realize certain operating results as a leading global corporate group, andattaches paramount importance on ROE as a management indicator for improving profitability.The NEC Group recorded an ROE of 8.5% under Japanese standards in the fiscal year endedMarch 31, 2016, but aims for an ROE of 10% (IFRS) in the fiscal year ending March 31, 2019through its "Mid-term Management Plan 2018."
-22-
3. Middle and Long Term Management Strategy
In April 2016, the NEC Group established a "Mid-term Management Plan 2018," featuring mid-term management policies that include (1) a profit structure rebuilding plan, and (2) a return to growth. The NEC Group aims to expand business and improve profitability by transitioning to a "social value innovator" and establishing a globally competitive growth base.
4. Challenges to be Addressed by the NEC Group
The NEC Group aims to be "a leading global company leveraging the power of innovation to realize an information society friendly to humans and the earth."
In the three year "Mid-term Management Plan 2015" announced in April 2013, the NEC Group put forth a mid-term management policy consisting of (1) the Focus on Solutions for Society, (2) the Focus on Asia, Promotion of "Locally-led" Business, and (3) the goal to Stabilize Our Financial Foundation. However, in the fiscal year of 2015, with the exception of net income, the NEC Group was not able to achieve the performance targets of the Mid-term Management Plan. NEC recognizes that this is mainly due to challenges that include (1) insufficient ability to execute the start of new businesses, such as SDN and Smart Energy, (2) delays in business expansion and lack of revenues in relation to international business, and (3) falling behind in the structural improvement of earnings in response to a decline in existing business.
Based on this situation, in April 2016 the NEC Group formulated the "Mid-term Management Plan 2018" consisting of (1) an earnings structure rebuilding plan, and (2) a plan for returning to growth.
1) Earnings structure rebuilding plan The NEC Group aims to establish an earnings structure for realizing a 5% operating income. First, in order to address struggling businesses and unprofitable projects, the NEC group will restructure the Smart Energy business and reinforce project management strength as part of suppressing losses from unprofitable projects. Moreover, the NEC Group will promote the acceleration of operational reform projects through streamlining staff operations/expenses and IT expenses, as well as the optimization of the development and production of hardware and software as part of creating a management base for supporting the group's competitive strength.
2) Returning to growth The NEC Group aims to drive the globalization of its Social Solutions business. Specifically, in order to achieve business expansion, the NEC Group has defined safety business (surveillance, cyber security), global carrier network business (TOMS (Telecom Operations and Management Solutions), SDN/NFV) and the retail IT service business as its core business areas, and concentrates resources on these potentially growing areas.
The NEC Group regards compliance as one of the most important management issues and has been continuing its comprehensive observation of compliance. However, during the fiscal year of 2014 with respect to transactions for wireless digital emergency firefighting equipment, and during the fiscal year of 2015 with respect to transactions for telecommunications equipment for electric power systems with Tokyo Electric Power Company and Chubu Electric Power Co., Inc. respectively, the Japan Fair Trade Commission carried out on-site inspections on suspicions that NEC violated the Act on Prohibition of Private Monopolization and Maintenance of Fair Trade and the commission's investigation is continuing. NEC places great importance on these issues and is fully cooperating with the commission's investigation. The NEC Group makes every effort
-23-
to closely observe compliance and to continuously establish and implement its internal control system.
The NEC Group will devote its full attention to implementing these measures as part of its efforts to contribute to the safety, security, efficiency and equality of society and to accelerate its growth and transformation to a "social value innovator."
Basic Rationale for Selection of Accounting Standards
The NEC Group made the decision of the voluntary adoption of International Financial Reporting Standards (IFRS) from the fiscal year ending March 31, 2017 to enhance the international comparability of its financial information in capital markets.
-24-
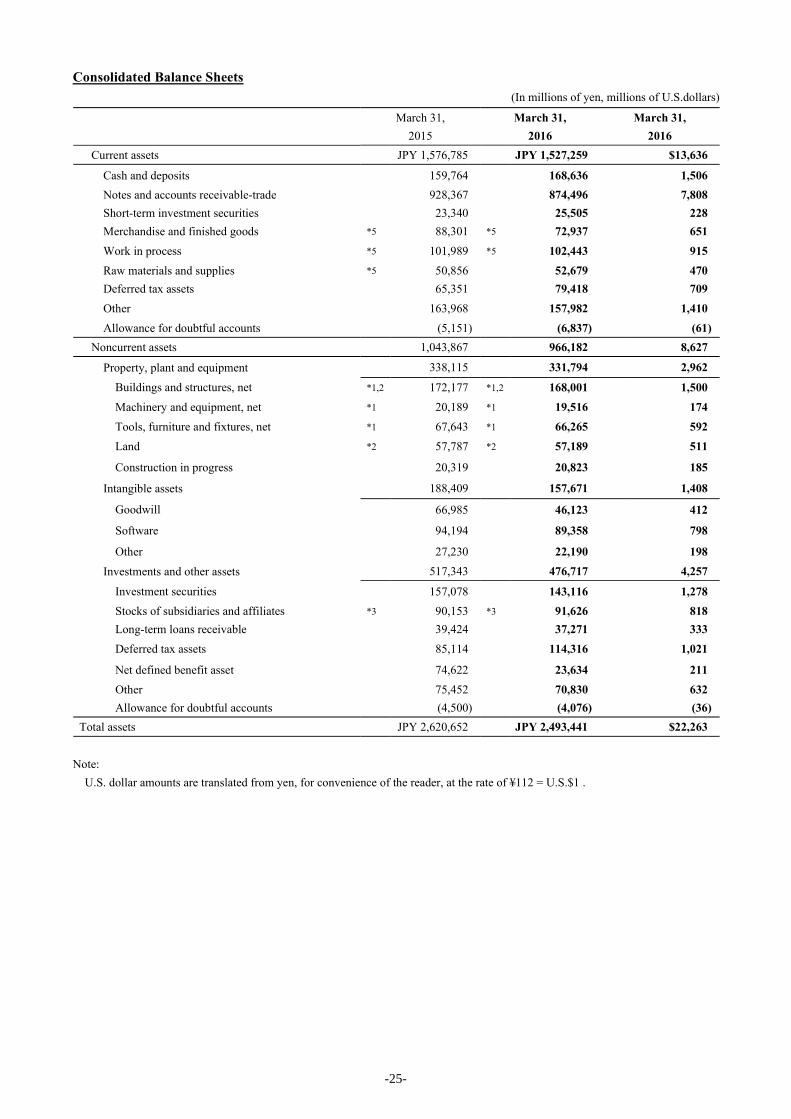
Consolidated Balance Sheets(In millions of yen, millions of U.S.dollars)
March 31,2015
March 31,2016
March 31,2016
Current assets JPY 1,576,785 JPY 1,527,259 $13,636
Cash and deposits 159,764 168,636 1,506Notes and accounts receivable-trade 928,367 874,496 7,808Short-term investment securities 23,340 25,505 228Merchandise and finished goods *5 88,301 *5 72,937 651Work in process *5 101,989 *5 102,443 915Raw materials and supplies *5 50,856 52,679 470Deferred tax assets 65,351 79,418 709Other 163,968 157,982 1,410Allowance for doubtful accounts (5,151 ) (6,837 ) (61 )
Noncurrent assets 1,043,867 966,182 8,627
Property, plant and equipment 338,115 331,794 2,962
Buildings and structures, net *1,2 172,177 *1,2 168,001 1,500Machinery and equipment, net *1 20,189 *1 19,516 174Tools, furniture and fixtures, net *1 67,643 *1 66,265 592Land *2 57,787 *2 57,189 511
Construction in progress 20,319 20,823 185
Intangible assets 188,409 157,671 1,408
Goodwill 66,985 46,123 412
Software 94,194 89,358 798
Other 27,230 22,190 198Investments and other assets 517,343 476,717 4,257
Investment securities 157,078 143,116 1,278Stocks of subsidiaries and affiliates *3 90,153 *3 91,626 818Long-term loans receivable 39,424 37,271 333Deferred tax assets 85,114 114,316 1,021
Net defined benefit asset 74,622 23,634 211Other 75,452 70,830 632Allowance for doubtful accounts (4,500 ) (4,076 ) (36 )
Total assets JPY 2,620,652 JPY 2,493,441 $22,263
Note:U.S. dollar amounts are translated from yen, for convenience of the reader, at the rate of ¥112 = U.S.$1 .
-25-
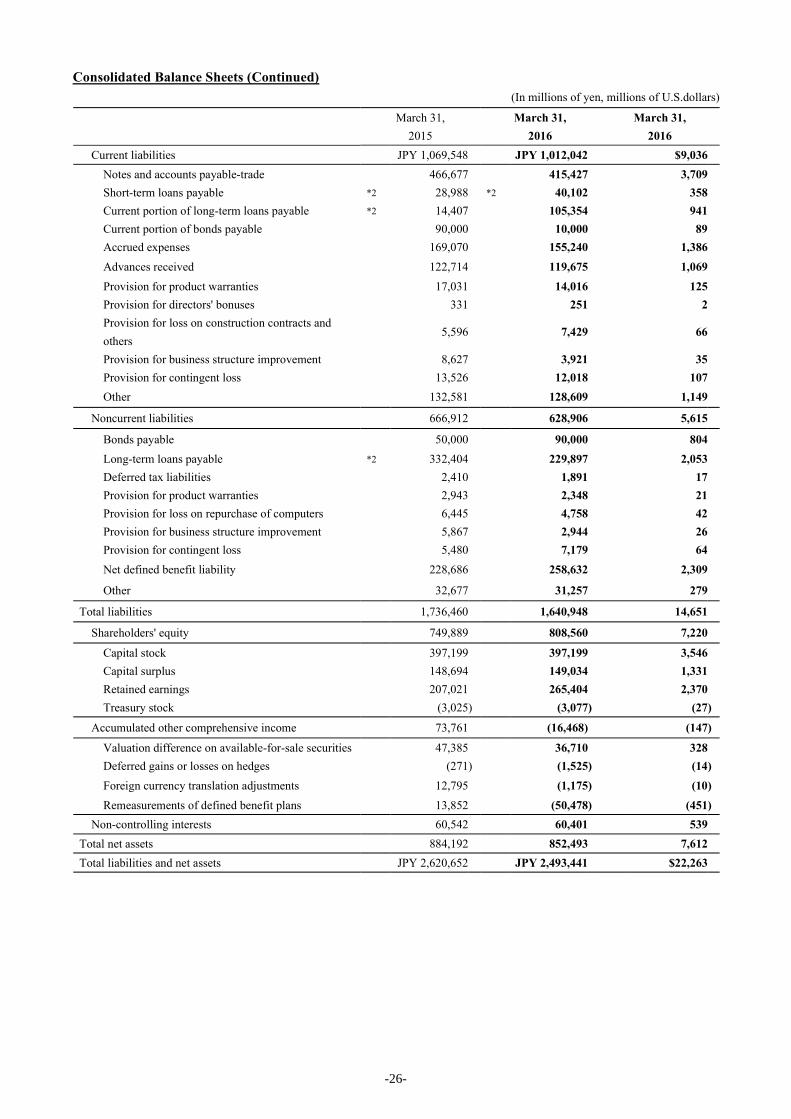
Consolidated Balance Sheets (Continued)(In millions of yen, millions of U.S.dollars)
March 31,2015
March 31,2016
March 31,2016
Current liabilities JPY 1,069,548 JPY 1,012,042 $9,036Notes and accounts payable-trade 466,677 415,427 3,709Short-term loans payable *2 28,988 *2 40,102 358Current portion of long-term loans payable *2 14,407 105,354 941Current portion of bonds payable 90,000 10,000 89Accrued expenses 169,070 155,240 1,386Advances received 122,714 119,675 1,069Provision for product warranties 17,031 14,016 125Provision for directors' bonuses 331 251 2Provision for loss on construction contracts and others
5,596 7,429 66
Provision for business structure improvement 8,627 3,921 35Provision for contingent loss 13,526 12,018 107Other 132,581 128,609 1,149
Noncurrent liabilities 666,912 628,906 5,615
Bonds payable 50,000 90,000 804Long-term loans payable *2 332,404 229,897 2,053Deferred tax liabilities 2,410 1,891 17Provision for product warranties 2,943 2,348 21Provision for loss on repurchase of computers 6,445 4,758 42Provision for business structure improvement 5,867 2,944 26Provision for contingent loss 5,480 7,179 64Net defined benefit liability 228,686 258,632 2,309
Other 32,677 31,257 279
Total liabilities 1,736,460 1,640,948 14,651
Shareholders' equity 749,889 808,560 7,220
Capital stock 397,199 397,199 3,546Capital surplus 148,694 149,034 1,331Retained earnings 207,021 265,404 2,370Treasury stock (3,025 ) (3,077 ) (27 )
Accumulated other comprehensive income 73,761 (16,468) (147 )
Valuation difference on available-for-sale securities 47,385 36,710 328Deferred gains or losses on hedges (271 ) (1,525 ) (14 )Foreign currency translation adjustments 12,795 (1,175 ) (10 )Remeasurements of defined benefit plans 13,852 (50,478 ) (451 )
Non-controlling interests 60,542 60,401 539Total net assets 884,192 852,493 7,612Total liabilities and net assets JPY 2,620,652 JPY 2,493,441 $22,263
-26-
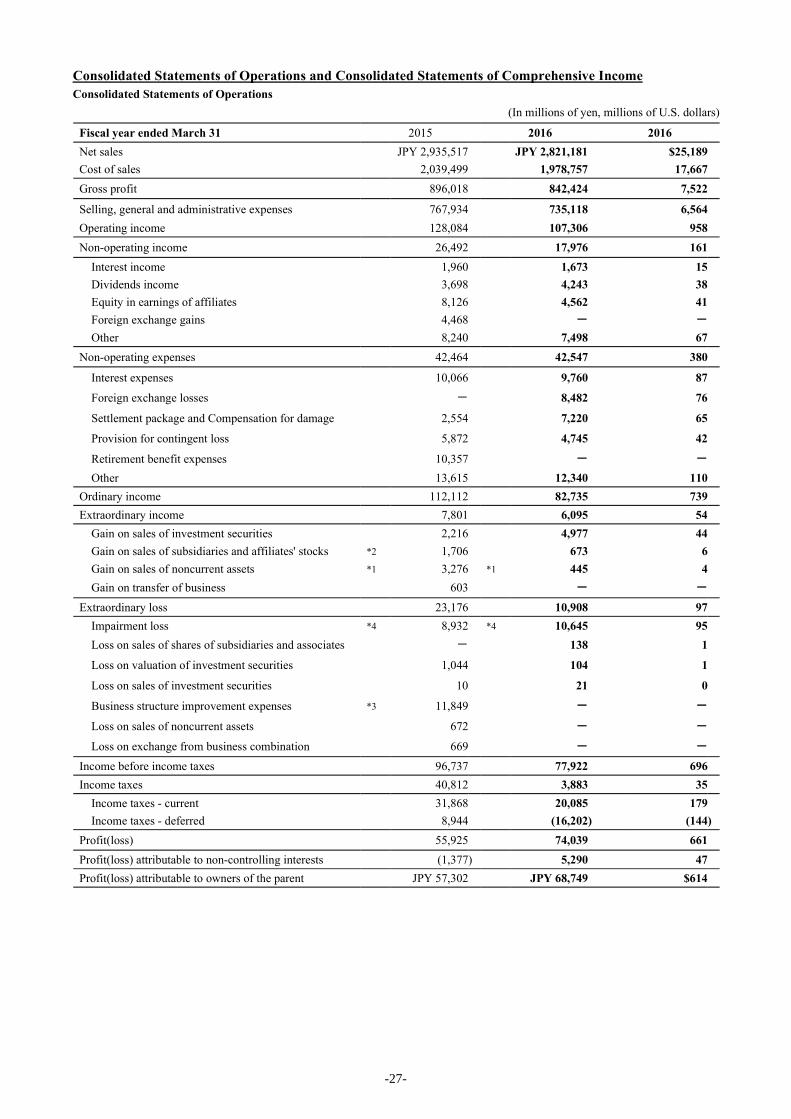
Consolidated Statements of Operations and Consolidated Statements of Comprehensive IncomeConsolidated Statements of Operations
(In millions of yen, millions of U.S. dollars)
Fiscal year ended March 31 2015 2016 2016Net sales JPY 2,935,517 JPY 2,821,181 $25,189Cost of sales 2,039,499 1,978,757 17,667Gross profit 896,018 842,424 7,522
Selling, general and administrative expenses 767,934 735,118 6,564Operating income 128,084 107,306 958Non-operating income 26,492 17,976 161
Interest income 1,960 1,673 15Dividends income 3,698 4,243 38Equity in earnings of affiliates 8,126 4,562 41Foreign exchange gains 4,468 - -
Other 8,240 7,498 67Non-operating expenses 42,464 42,547 380
Interest expenses 10,066 9,760 87
Foreign exchange losses - 8,482 76
Settlement package and Compensation for damage 2,554 7,220 65
Provision for contingent loss 5,872 4,745 42
Retirement benefit expenses 10,357 - -
Other 13,615 12,340 110Ordinary income 112,112 82,735 739Extraordinary income 7,801 6,095 54
Gain on sales of investment securities 2,216 4,977 44Gain on sales of subsidiaries and affiliates' stocks *2 1,706 673 6Gain on sales of noncurrent assets *1 3,276 *1 445 4Gain on transfer of business 603 - -
Extraordinary loss 23,176 10,908 97Impairment loss *4 8,932 *4 10,645 95Loss on sales of shares of subsidiaries and associates - 138 1
Loss on valuation of investment securities 1,044 104 1
Loss on sales of investment securities 10 21 0
Business structure improvement expenses *3 11,849 - -
Loss on sales of noncurrent assets 672 - -
Loss on exchange from business combination 669 - -
Income before income taxes 96,737 77,922 696Income taxes 40,812 3,883 35
Income taxes - current 31,868 20,085 179Income taxes - deferred 8,944 (16,202 ) (144 )
Profit(loss) 55,925 74,039 661Profit(loss) attributable to non-controlling interests (1,377 ) 5,290 47Profit(loss) attributable to owners of the parent JPY 57,302 JPY 68,749 $614
-27-
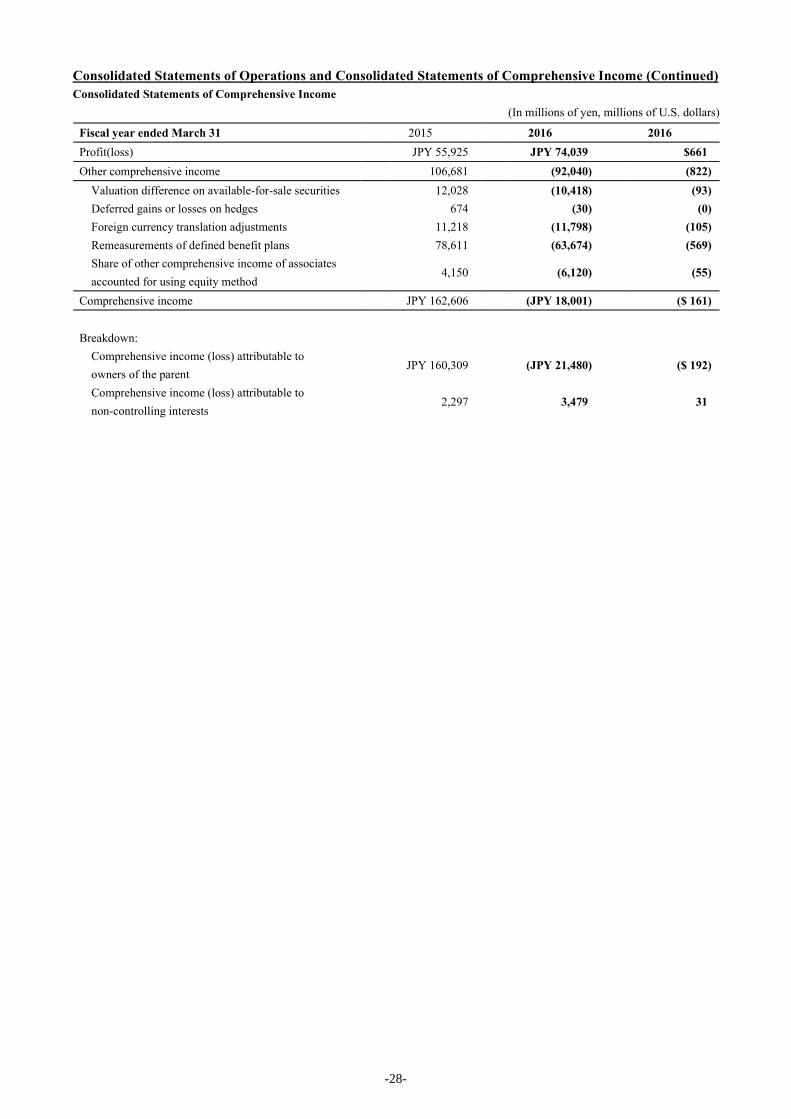
Consolidated Statements of Operations and Consolidated Statements of Comprehensive Income (Continued)Consolidated Statements of Comprehensive Income
(In millions of yen, millions of U.S. dollars)
Fiscal year ended March 31 2015 2016 2016Profit(loss) JPY 55,925 JPY 74,039 $661Other comprehensive income 106,681 (92,040 ) (822 )
Valuation difference on available-for-sale securities 12,028 (10,418 ) (93 )Deferred gains or losses on hedges 674 (30 ) (0 )Foreign currency translation adjustments 11,218 (11,798 ) (105 )Remeasurements of defined benefit plans 78,611 (63,674 ) (569 )Share of other comprehensive income of associates accounted for using equity method
4,150 (6,120 ) (55 )
Comprehensive income JPY 162,606 (JPY 18,001 ) ($ 161 )
Breakdown:Comprehensive income (loss) attributable toowners of the parent
JPY 160,309 (JPY 21,480 ) ($ 192 )
Comprehensive income (loss) attributable tonon-controlling interests
2,297 3,479 31
-28-
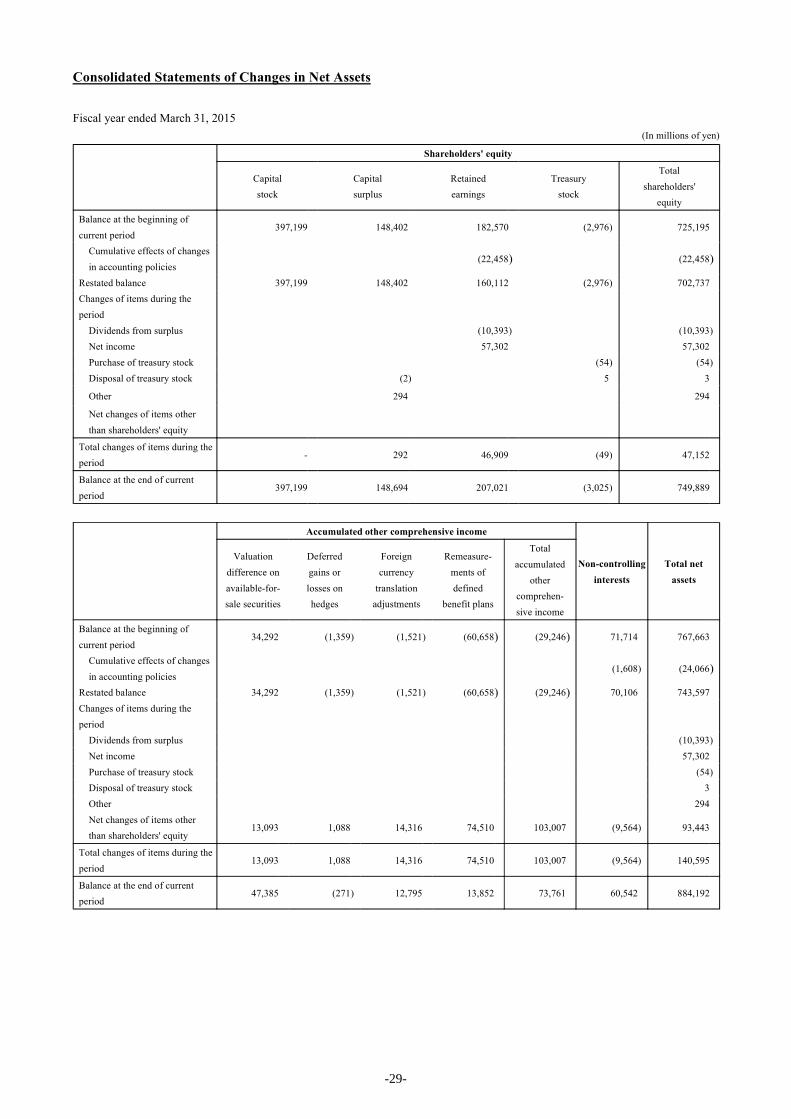
Consolidated Statements of Changes in Net Assets
Fiscal year ended March 31, 2015(In millions of yen)
Shareholders' equity
Capital stock
Capital surplus
Retained earnings
Treasury stock
Total shareholders'
equity
Balance at the beginning of current period
397,199 148,402 182,570 (2,976 ) 725,195
Cumulative effects of changes in accounting policies
(22,458 ) (22,458 )
Restated balance 397,199 148,402 160,112 (2,976 ) 702,737 Changes of items during the period
Dividends from surplus (10,393 ) (10,393 ) Net income 57,302 57,302 Purchase of treasury stock (54 ) (54 ) Disposal of treasury stock (2 ) 5 3
Other 294 294
Net changes of items other than shareholders' equity
Total changes of items during the period
- 292 46,909 (49 ) 47,152
Balance at the end of current period
397,199 148,694 207,021 (3,025 ) 749,889
Accumulated other comprehensive income
Non-controlling interests
Total net assets
Valuation difference on available-for- sale securities
Deferred gains or losses on hedges
Foreign currency
translation adjustments
Remeasure- ments of defined
benefit plans
Total accumulated
other comprehen- sive income
Balance at the beginning of current period
34,292 (1,359 ) (1,521 ) (60,658 ) (29,246 ) 71,714 767,663
Cumulative effects of changes in accounting policies
(1,608 ) (24,066 )
Restated balance 34,292 (1,359 ) (1,521 ) (60,658 ) (29,246 ) 70,106 743,597 Changes of items during the period
Dividends from surplus (10,393 ) Net income 57,302 Purchase of treasury stock (54 ) Disposal of treasury stock 3 Other 294 Net changes of items other than shareholders' equity
13,093 1,088 14,316 74,510 103,007 (9,564 ) 93,443
Total changes of items during the period
13,093 1,088 14,316 74,510 103,007 (9,564 ) 140,595
Balance at the end of current period
47,385 (271 ) 12,795 13,852 73,761 60,542 884,192
-29-
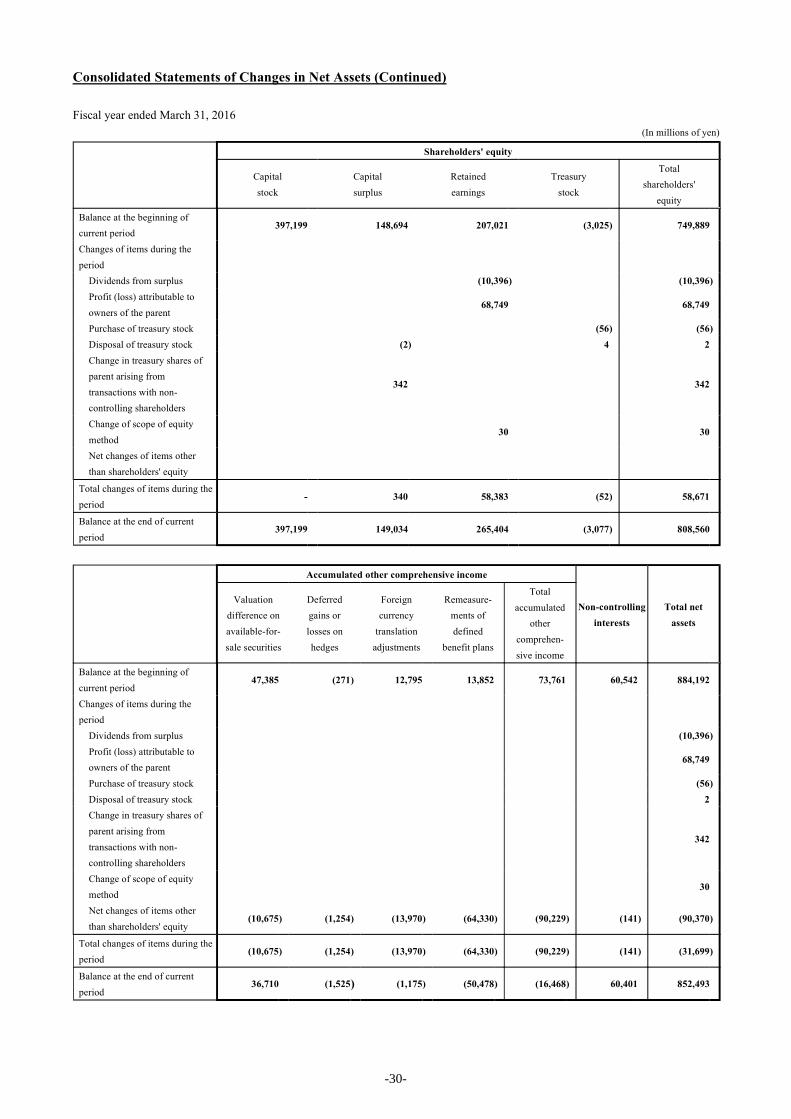
Consolidated Statements of Changes in Net Assets (Continued)
Fiscal year ended March 31, 2016(In millions of yen)
Shareholders' equity
Capital stock
Capital surplus
Retained earnings
Treasury stock
Total shareholders'
equity
Balance at the beginning of current period
397,199 148,694 207,021 (3,025 ) 749,889
Changes of items during the period
Dividends from surplus (10,396 ) (10,396 ) Profit (loss) attributable to owners of the parent
68,749 68,749
Purchase of treasury stock (56 ) (56 ) Disposal of treasury stock (2 ) 4 2 Change in treasury shares of parent arising from transactions with non-controlling shareholders
342 342
Change of scope of equity method
30 30
Net changes of items other than shareholders' equity
Total changes of items during the period
- 340 58,383 (52 ) 58,671
Balance at the end of current period
397,199 149,034 265,404 (3,077 ) 808,560
Accumulated other comprehensive income
Non-controlling interests
Total net assets
Valuation difference on available-for- sale securities
Deferred gains or losses on hedges
Foreign currency
translation adjustments
Remeasure- ments of defined
benefit plans
Total accumulated
other comprehen- sive income
Balance at the beginning of current period
47,385 (271 ) 12,795 13,852 73,761 60,542 884,192
Changes of items during the period
Dividends from surplus (10,396 ) Profit (loss) attributable to owners of the parent
68,749
Purchase of treasury stock (56 ) Disposal of treasury stock 2 Change in treasury shares of parent arising from transactions with non-controlling shareholders
342
Change of scope of equity method
30
Net changes of items other than shareholders' equity
(10,675 ) (1,254 ) (13,970 ) (64,330 ) (90,229 ) (141 ) (90,370 )
Total changes of items during the period
(10,675 ) (1,254 ) (13,970 ) (64,330 ) (90,229 ) (141 ) (31,699 )
Balance at the end of current period
36,710 (1,525 ) (1,175 ) (50,478 ) (16,468 ) 60,401 852,493
-30-
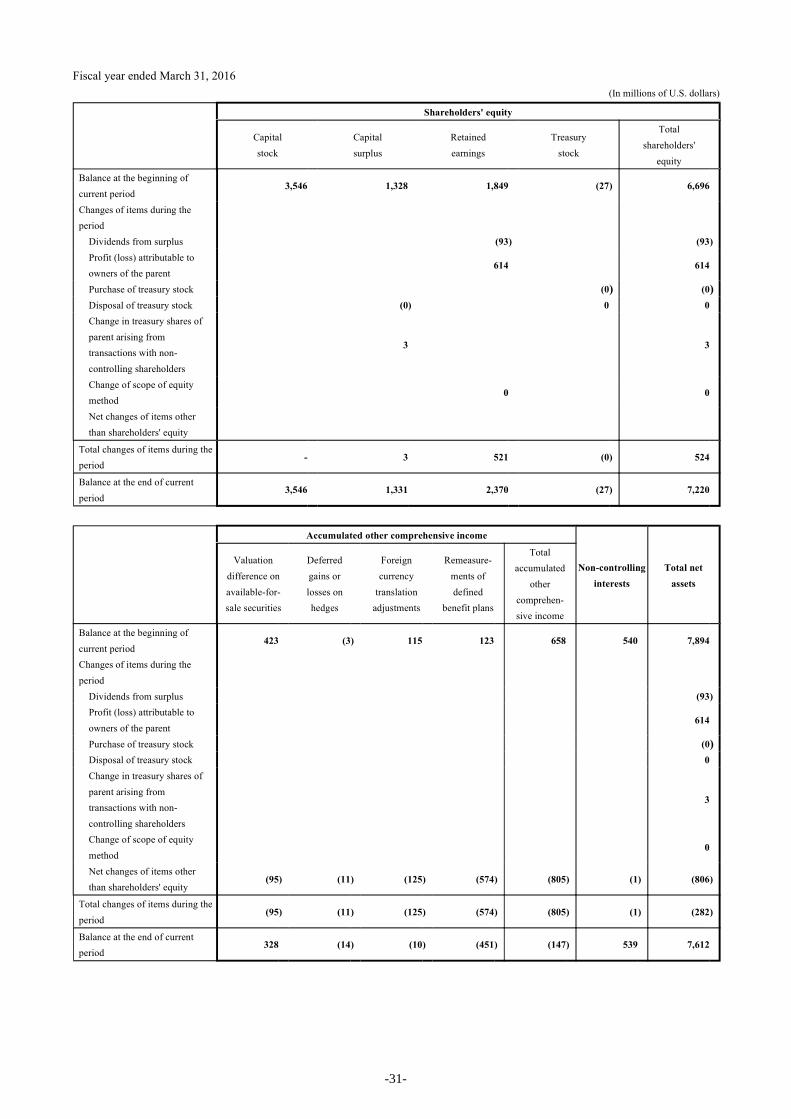
Fiscal year ended March 31, 2016 (In millions of U.S. dollars)
Shareholders' equity
Capital stock
Capital surplus
Retained earnings
Treasury stock
Total shareholders'
equity
Balance at the beginning of current period
3,546 1,328 1,849 (27 ) 6,696
Changes of items during the period
Dividends from surplus (93 ) (93 ) Profit (loss) attributable to owners of the parent
614 614
Purchase of treasury stock (0 ) (0 ) Disposal of treasury stock (0 ) 0 0 Change in treasury shares of parent arising from transactions with non-controlling shareholders
3 3
Change of scope of equity method
0 0
Net changes of items other than shareholders' equity
Total changes of items during the period
- 3 521 (0 ) 524
Balance at the end of current period
3,546 1,331 2,370 (27 ) 7,220
Accumulated other comprehensive income
Non-controlling interests
Total net assets
Valuation difference on available-for- sale securities
Deferred gains or losses on hedges
Foreign currency
translation adjustments
Remeasure- ments of defined
benefit plans
Total accumulated
other comprehen- sive income
Balance at the beginning of current period
423 (3 ) 115 123 658 540 7,894
Changes of items during the period
Dividends from surplus (93 ) Profit (loss) attributable to owners of the parent
614
Purchase of treasury stock (0 ) Disposal of treasury stock 0 Change in treasury shares of parent arising from transactions with non-controlling shareholders
3
Change of scope of equity method
0
Net changes of items other than shareholders' equity
(95 ) (11 ) (125 ) (574 ) (805 ) (1 ) (806 )
Total changes of items during the period
(95 ) (11 ) (125 ) (574 ) (805 ) (1 ) (282 )
Balance at the end of current period
328 (14 ) (10 ) (451 ) (147 ) 539 7,612
-31-
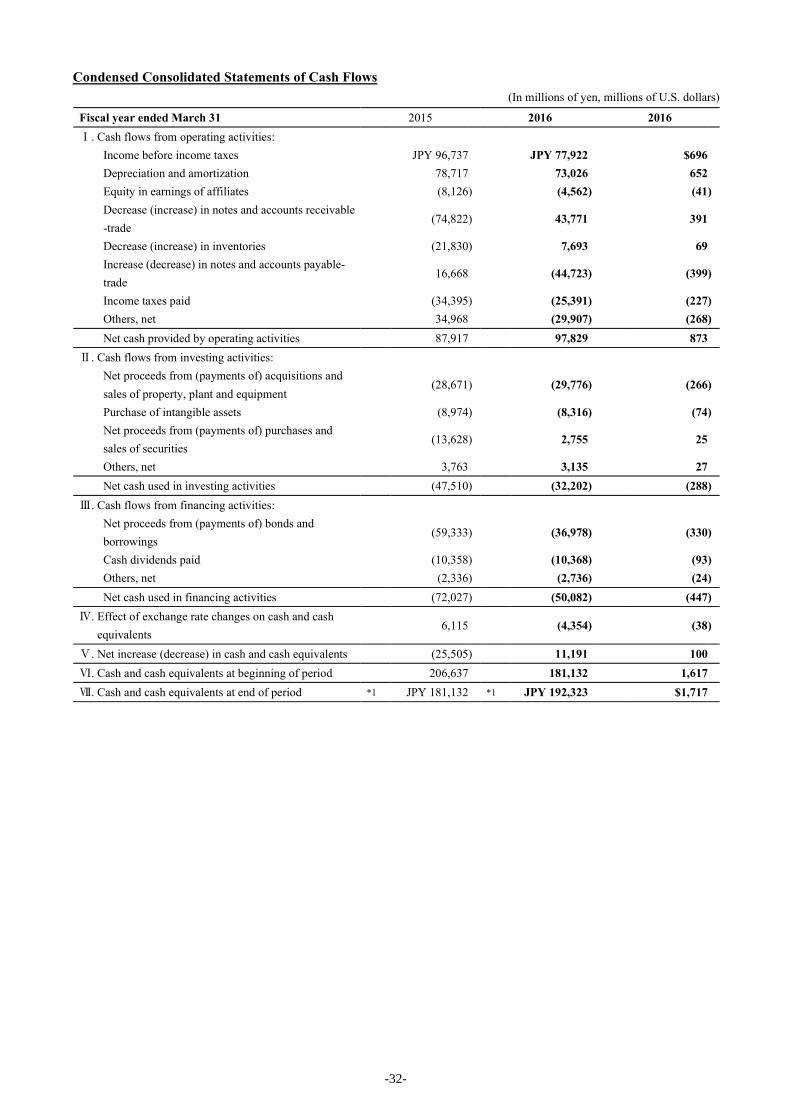
Condensed Consolidated Statements of Cash Flows(In millions of yen, millions of U.S. dollars)
Fiscal year ended March 31 2015 2016 2016Ⅰ. Cash flows from operating activities:
Income before income taxes JPY 96,737 JPY 77,922 $696Depreciation and amortization 78,717 73,026 652Equity in earnings of affiliates (8,126 ) (4,562 ) (41 )Decrease (increase) in notes and accounts receivable-trade
(74,822 ) 43,771 391
Decrease (increase) in inventories (21,830 ) 7,693 69Increase (decrease) in notes and accounts payable-trade
16,668 (44,723 ) (399 )
Income taxes paid (34,395 ) (25,391 ) (227 )Others, net 34,968 (29,907 ) (268 )Net cash provided by operating activities 87,917 97,829 873
Ⅱ. Cash flows from investing activities:Net proceeds from (payments of) acquisitions and sales of property, plant and equipment
(28,671 ) (29,776 ) (266 )
Purchase of intangible assets (8,974 ) (8,316 ) (74 )Net proceeds from (payments of) purchases and sales of securities
(13,628 ) 2,755 25
Others, net 3,763 3,135 27Net cash used in investing activities (47,510 ) (32,202 ) (288 )
Ⅲ. Cash flows from financing activities:Net proceeds from (payments of) bonds and borrowings
(59,333 ) (36,978 ) (330 )
Cash dividends paid (10,358 ) (10,368 ) (93 )Others, net (2,336 ) (2,736 ) (24 )Net cash used in financing activities (72,027 ) (50,082 ) (447 )
Ⅳ. Effect of exchange rate changes on cash and cash equivalents
6,115 (4,354 ) (38 )
Ⅴ. Net increase (decrease) in cash and cash equivalents (25,505 ) 11,191 100Ⅵ. Cash and cash equivalents at beginning of period 206,637 181,132 1,617Ⅶ. Cash and cash equivalents at end of period *1 JPY 181,132 *1 JPY 192,323 $1,717
-32-
Notes to Consolidated Financial Statements
Changes in Accounting PolicyFiscal year ended March 31, 2016 (From April 1, 2015 to March 31, 2016)
From the beginning of the fiscal year ended March 31, 2016, the NEC Group has applied the "Accounting Standard for Business Combinations" (ASBJ Statement No. 21, September 13, 2013), "Accounting Standard for Consolidated Financial Statements" (ASBJ Statement No. 22, September 13, 2013), "Accounting Standard for Business Divestitures" (ASBJ Statement No. 7, September 13, 2013), and other applicable standards. As a result, the method of recording the amount of difference caused by changes in the Company's ownership interests in subsidiaries in the case of subsidiaries under ongoing control of the Company was changed to record as capital surplus, and the method of recording acquisition-related costs has been changed to recognize as period expenses for the fiscal year in which they are incurred. Furthermore, for business combinations that are carried out on or after the beginning of the fiscal year ended March 31, 2016, the accounting method has been changed to an adjusted acquisition cost allocation updated from the tentative accounting treatment and is reflected in the consolidated financial statements for the fiscal year in which the business combination occurs.
In addition, the change in the presentation method of net income (loss) and minority interests to non-controlling interests have been applied from the fiscal year ended March 31,2016. To reflect these changes, consolidated statements of operations and consolidated balance sheets for the previous fiscal year have been reclassified.
Application of the Accounting Standard for Business Combinations and other applicable standards is in line with the transitional measures that are provided in Paragraph 58-2 (4) of the Accounting Standard for Business Combinations, Paragraph 44-5 (4) of the Accounting Standard for Consolidated Financial Statements and Paragraph 57-4 (4) of the Accounting Standard for Business Divestitures, and is effective from the beginning of the fiscal year ended March 31, 2016.
As a result, there is no significant impact on operating income (loss), ordinary income (loss), and income (loss) before income taxes for the fiscal year ended March 31, 2016, and there is no significant impact on capital surplus for the fiscal year ended March 31, 2016.
Also from this fiscal year, disbursements for acquisitions or proceeds from sales of shares of subsidiaries without change of scope of consolidation have been presented in cash flows from financing activities, and cash out flows from acquisition related costs for acquisitions of shares of subsidiaries with change of scope of consolidation and cash out flows from acquisition or sale related costs for shares of subsidiaries without change of scope of consolidation have been presented in cash flows from operating activities on consolidated statements of cash flows.
The impact on per share information is shown in the corresponding section.
-33-
Changes in Presentation MethodFiscal year ended March 31, 2016 (From April 1, 2015 to March 31, 2016)
(Consolidated Statements of Operations)1. "Subsidy income" under non-operating income, presented separately in the previous fiscal year, isincluded in “Other” under non-operating income in the current fiscal year since the amount hasbecome insignificant. The amount of “Subsidy income” included in “Other” under non-operatingincome is 737 million yen for the current fiscal year. The consolidated financial statements for theprevious fiscal year have been restated to reflect this change in method of presentation.As a result, 2,361 million yen presented as "Subsidy income" and 5,879 million yen as "Other" undernon-operating income in the consolidated statements of operations for the previous fiscal year isrestated to present 8,240 million yen as “Other”.
2. “Settlement package and Compensation for damage” included in “Other” under non-operatingexpenses in the previous fiscal year, is presented separately in the current fiscal year since theamount has become significant. The consolidated financial statements for the previous fiscal yearhave been restated to reflect this change in method of presentation.As a result, 16,169 million yen presented as "Other" under non-operating expenses in theconsolidated statements of operations for the previous fiscal year is restated to present 2,554million yen as "Settlement package and Compensation for damage" and 13,615 million yen as"Other".
-34-
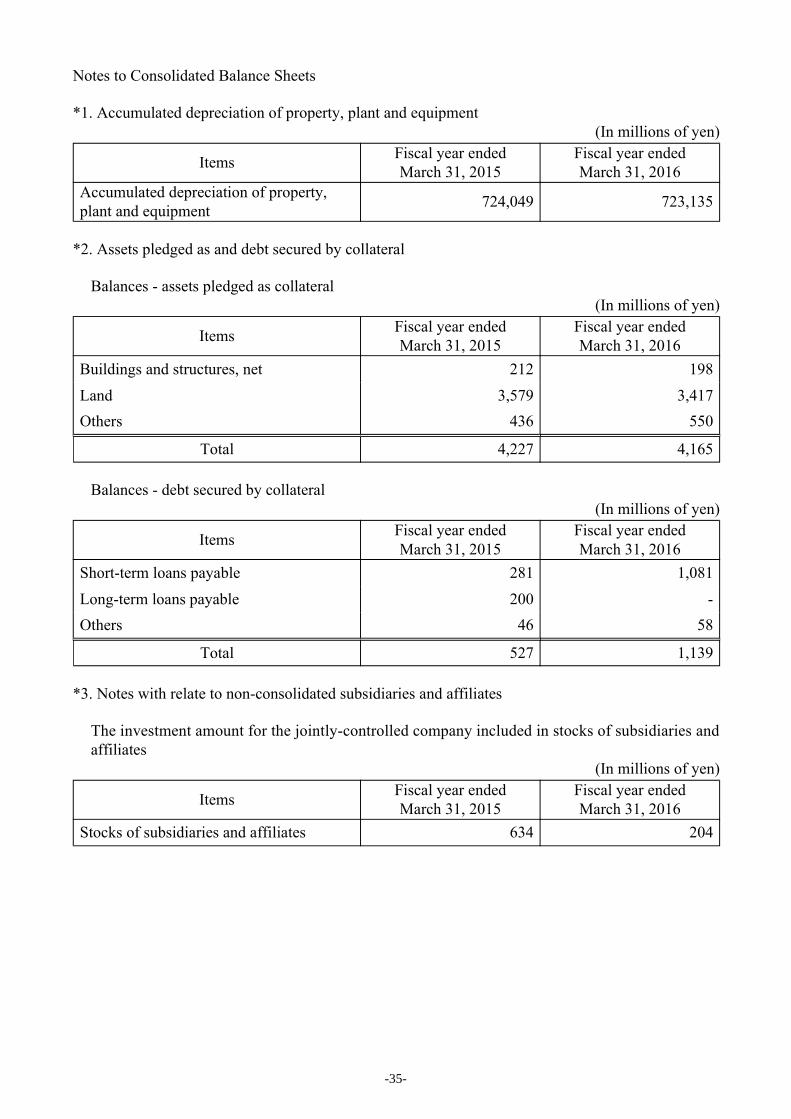
Notes to Consolidated Balance Sheets
*1. Accumulated depreciation of property, plant and equipment(In millions of yen)
Items Fiscal year endedMarch 31, 2015
Fiscal year endedMarch 31, 2016
Accumulated depreciation of property, plant and equipment 724,049 723,135
*2. Assets pledged as and debt secured by collateral
Balances - assets pledged as collateral(In millions of yen)
Items Fiscal year endedMarch 31, 2015
Fiscal year endedMarch 31, 2016
Buildings and structures, net 212 198
Land 3,579 3,417Others 436 550
Total 4,227 4,165
Balances - debt secured by collateral(In millions of yen)
Items Fiscal year endedMarch 31, 2015
Fiscal year endedMarch 31, 2016
Short-term loans payable 281 1,081
Long-term loans payable 200 -Others 46 58
Total 527 1,139
*3. Notes with relate to non-consolidated subsidiaries and affiliates
The investment amount for the jointly-controlled company included in stocks of subsidiaries andaffiliates
(In millions of yen)
Items Fiscal year endedMarch 31, 2015
Fiscal year endedMarch 31, 2016
Stocks of subsidiaries and affiliates 634 204
-35-
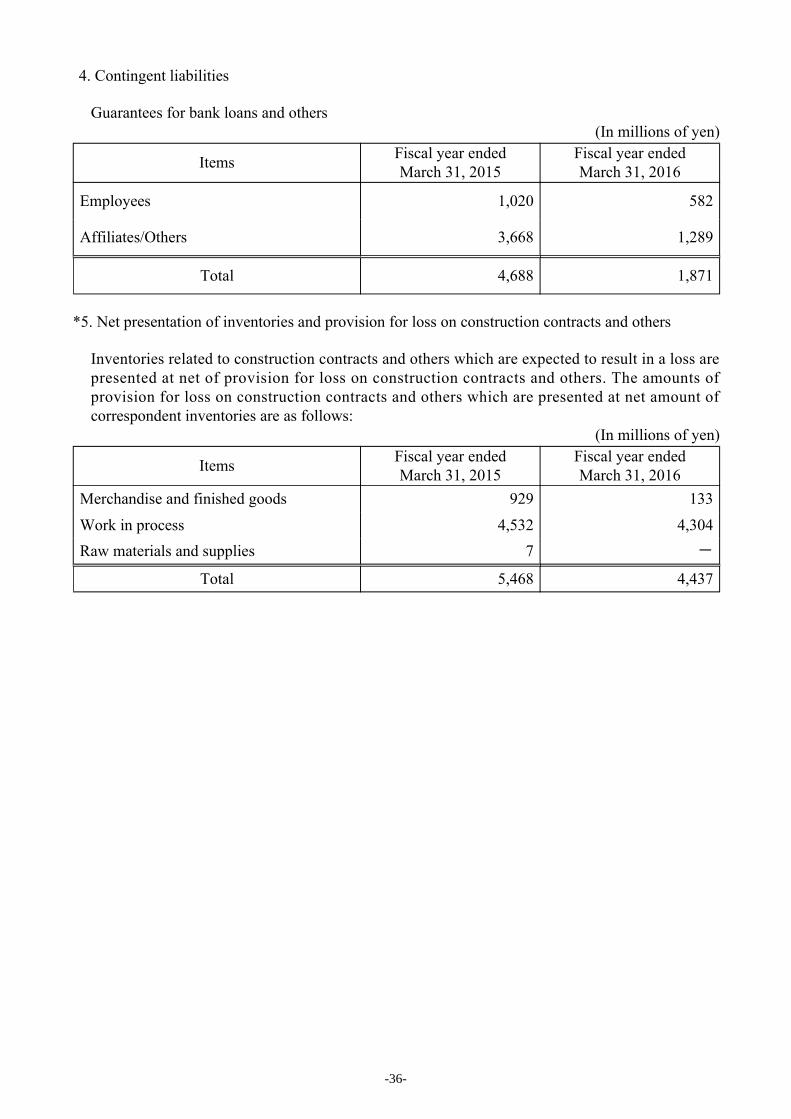
4. Contingent liabilities
Guarantees for bank loans and others(In millions of yen)
Items Fiscal year endedMarch 31, 2015
Fiscal year endedMarch 31, 2016
Employees 1,020 582
Affiliates/Others 3,668 1,289
Total 4,688 1,871
*5. Net presentation of inventories and provision for loss on construction contracts and others
Inventories related to construction contracts and others which are expected to result in a loss arepresented at net of provision for loss on construction contracts and others. The amounts of provision for loss on construction contracts and others which are presented at net amount of correspondent inventories are as follows:
(In millions of yen)
Items Fiscal year endedMarch 31, 2015
Fiscal year endedMarch 31, 2016
Merchandise and finished goods 929 133
Work in process 4,532 4,304Raw materials and supplies 7 -
Total 5,468 4,437
-36-

Notes to Consolidated Statements of Operations
*1. Gain on sales of noncurrent assetsDue to sales of buildings, land and others.
*2. Gain on sales of subsidiaries and affiliates' stocksFor the fiscal year ended March 31, 2015, mainly due to sales of stocks of Nittsu NEC Logistics,Ltd.
*3. Business structure improvement expensesFor the fiscal year ended March 31, 2015, mainly for early retirement of employees due tobusiness restructuring.
*4. Impairment loss
(1) Summary of assets or asset groups for which impairment losses were recognized
Fiscal year ended March 31, 2015 (From April 1, 2014 to March 31, 2015)Use Type Location
Assets for business use
・Tools, furniture and fixtures・Software・Investments and other assets,and others
Minato-ku, Tokyo,and others
Assets for business use・Buildings and structures・Machinery and equipment・Intangible assets, and others
China
Idle assets ・Buildings and structures・Land and others
Abiko City, Chiba Prefecture, and others
Others ・Goodwill -
Fiscal year ended March 31, 2016 (From April 1, 2015 to March 31, 2016)Use Type Location
Assets for business use
・Tools, furniture and fixtures・Software・Investments and other assets,and others
Kawasaki City, Kanagawa Prefecture, and others
Idle assets ・Land Sunto County, Shizuoka Prefecture, and others
Others ・Goodwill -
-37-
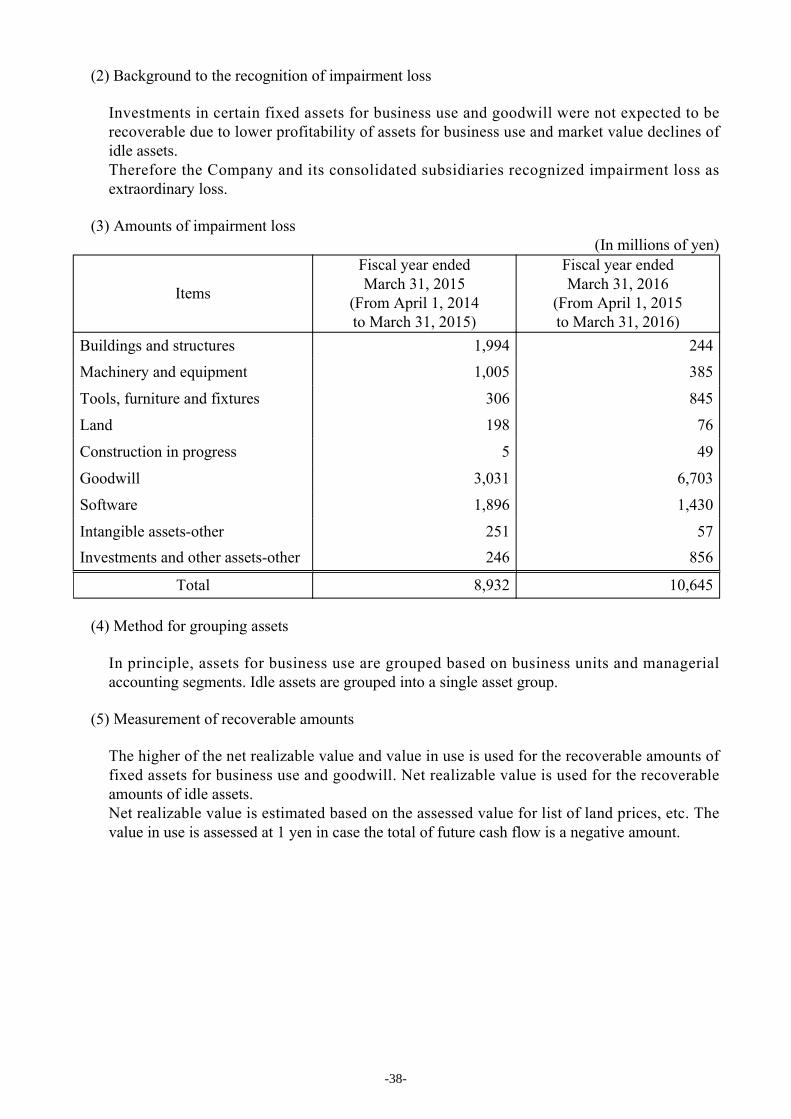
(2) Background to the recognition of impairment loss
Investments in certain fixed assets for business use and goodwill were not expected to be recoverable due to lower profitability of assets for business use and market value declines of idle assets. Therefore the Company and its consolidated subsidiaries recognized impairment loss as extraordinary loss.
(3) Amounts of impairment loss (In millions of yen)
Items
Fiscal year ended March 31, 2015
(From April 1, 2014 to March 31, 2015)
Fiscal year ended March 31, 2016
(From April 1, 2015 to March 31, 2016)
Buildings and structures 1,994 244
Machinery and equipment 1,005 385
Tools, furniture and fixtures 306 845
Land 198 76
Construction in progress 5 49
Goodwill 3,031 6,703
Software 1,896 1,430
Intangible assets-other 251 57 Investments and other assets-other 246 856
Total 8,932 10,645
(4) Method for grouping assets
In principle, assets for business use are grouped based on business units and managerial accounting segments. Idle assets are grouped into a single asset group.
(5) Measurement of recoverable amounts
The higher of the net realizable value and value in use is used for the recoverable amounts of fixed assets for business use and goodwill. Net realizable value is used for the recoverable amounts of idle assets. Net realizable value is estimated based on the assessed value for list of land prices, etc. The value in use is assessed at 1 yen in case the total of future cash flow is a negative amount.
-38-
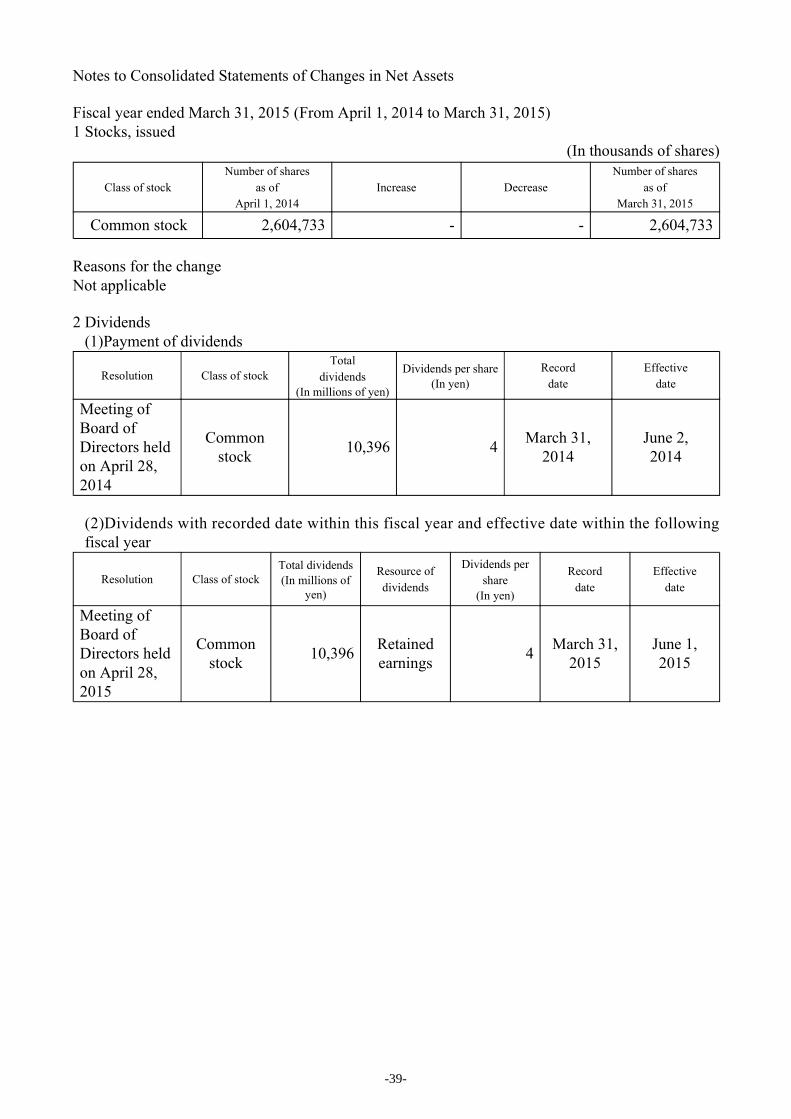
Notes to Consolidated Statements of Changes in Net Assets
Fiscal year ended March 31, 2015 (From April 1, 2014 to March 31, 2015)1 Stocks, issued
(In thousands of shares)
Class of stockNumber of shares
as of April 1, 2014
Increase DecreaseNumber of shares
as of March 31, 2015
Common stock 2,604,733 - - 2,604,733
Reasons for the changeNot applicable
2 Dividends(1)Payment of dividends
Resolution Class of stockTotal
dividends(In millions of yen)
Dividends per share(In yen)
Record date
Effective date
Meeting of Board of Directors held on April 28, 2014
Common stock 10,396 4 March 31,
2014June 2,2014
(2)Dividends with recorded date within this fiscal year and effective date within the followingfiscal year
Resolution Class of stockTotal dividends(In millions of
yen)
Resource of dividends
Dividends per share
(In yen)
Record date
Effective date
Meeting of Board of Directors held on April 28, 2015
Common stock 10,396 Retained
earnings 4 March 31, 2015
June 1, 2015
-39-

Fiscal year ended March 31, 2016 (From April 1, 2015 to March 31, 2016)1 Stocks, issued
(In thousands of shares)
Class of stockNumber of sharesas of April 1, 2015
Increase DecreaseNumber of shares
as of March 31, 2016
Common stock 2,604,733 - - 2,604,733
Reasons for the changeNot applicable
2 Dividends(1)Payment of dividends
Resolution Class of stock Total dividends(In millions of yen)
Dividends per share(In yen)
Record date
Effective date
Meeting of Board of Directors held on April 28, 2015
Common stock 10,396 4 March 31,
2015June 1, 2015
(2)Dividends with recorded date within this fiscal year and effective date within the followingfiscal year
Resolution Class of stockTotal dividends(In millions of
yen)
Resource of dividends
Dividends per share
(In yen)
Record date
Effective date
Meeting of Board of Directors held on April 28, 2016
Common stock 15,592 Retained
earnings 6 March 31, 2016
June 1, 2016
-40-

Notes to Consolidated Statements of Cash Flows
*1. Reconciliation of cash and cash equivalents from the accounts recorded in consolidated balancesheets
(In millions of yen)
ItemsFiscal year endedMarch 31, 2015
(From April 1, 2014to March 31, 2015)
Fiscal year endedMarch 31, 2016
(From April 1, 2015to March 31, 2016)
Cash and deposits 159,764 168,636
Short-term investment securities 23,340 25,505
Time deposits and Short-term investment securities with maturities of more than three months
(1,972) (1,818)
Cash and cash equivalents 181,132 192,323
-41-
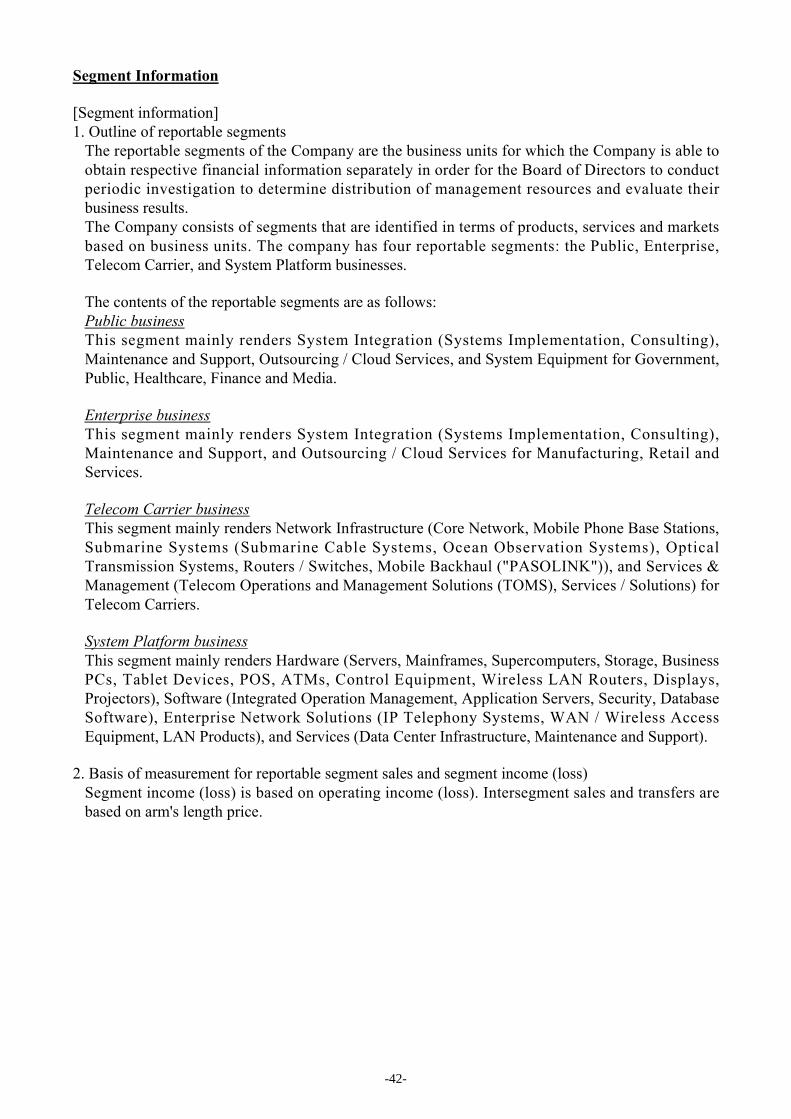
Segment Information
[Segment information]1. Outline of reportable segments
The reportable segments of the Company are the business units for which the Company is able toobtain respective financial information separately in order for the Board of Directors to conductperiodic investigation to determine distribution of management resources and evaluate theirbusiness results.The Company consists of segments that are identified in terms of products, services and marketsbased on business units. The company has four reportable segments: the Public, Enterprise,Telecom Carrier, and System Platform businesses.
The contents of the reportable segments are as follows:Public businessThis segment mainly renders System Integration (Systems Implementation, Consulting),Maintenance and Support, Outsourcing / Cloud Services, and System Equipment for Government,Public, Healthcare, Finance and Media.
Enterprise businessThis segment mainly renders System Integration (Systems Implementation, Consulting),Maintenance and Support, and Outsourcing / Cloud Services for Manufacturing, Retail andServices.
Telecom Carrier businessThis segment mainly renders Network Infrastructure (Core Network, Mobile Phone Base Stations,Submarine Systems (Submarine Cable Systems, Ocean Observation Systems), OpticalTransmission Systems, Routers / Switches, Mobile Backhaul ("PASOLINK")), and Services &Management (Telecom Operations and Management Solutions (TOMS), Services / Solutions) forTelecom Carriers.
System Platform businessThis segment mainly renders Hardware (Servers, Mainframes, Supercomputers, Storage, BusinessPCs, Tablet Devices, POS, ATMs, Control Equipment, Wireless LAN Routers, Displays,Projectors), Software (Integrated Operation Management, Application Servers, Security, DatabaseSoftware), Enterprise Network Solutions (IP Telephony Systems, WAN / Wireless AccessEquipment, LAN Products), and Services (Data Center Infrastructure, Maintenance and Support).
2. Basis of measurement for reportable segment sales and segment income (loss)Segment income (loss) is based on operating income (loss). Intersegment sales and transfers arebased on arm's length price.
-42-
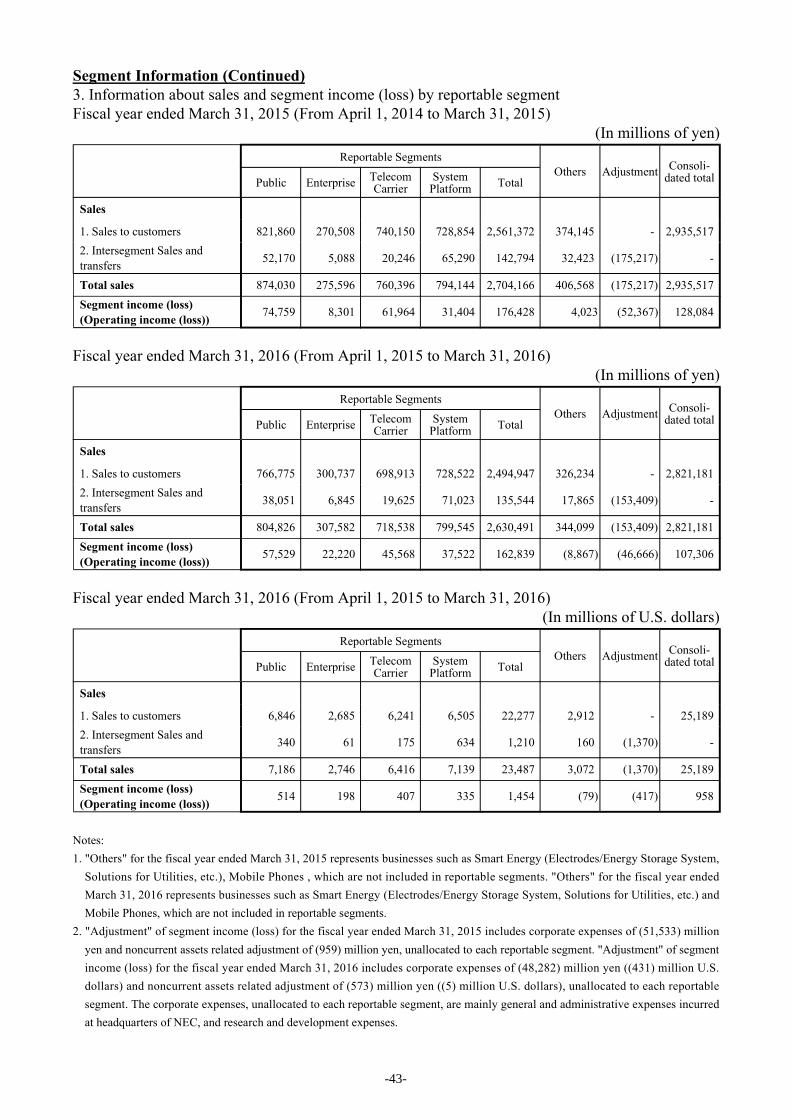
Segment Information (Continued)3. Information about sales and segment income (loss) by reportable segmentFiscal year ended March 31, 2015 (From April 1, 2014 to March 31, 2015)
(In millions of yen)Reportable Segments
Others Adjustment Consoli- dated totalPublic Enterprise Telecom
CarrierSystem
Platform Total
Sales
1. Sales to customers 821,860 270,508 740,150 728,854 2,561,372 374,145 - 2,935,5172. Intersegment Sales andtransfers 52,170 5,088 20,246 65,290 142,794 32,423 (175,217) -
Total sales 874,030 275,596 760,396 794,144 2,704,166 406,568 (175,217) 2,935,517Segment income (loss)(Operating income (loss)) 74,759 8,301 61,964 31,404 176,428 4,023 (52,367) 128,084
Fiscal year ended March 31, 2016 (From April 1, 2015 to March 31, 2016)(In millions of yen)
Reportable SegmentsOthers Adjustment Consoli-
dated totalPublic Enterprise Telecom Carrier
System Platform Total
Sales
1. Sales to customers 766,775 300,737 698,913 728,522 2,494,947 326,234 - 2,821,1812. Intersegment Sales andtransfers 38,051 6,845 19,625 71,023 135,544 17,865 (153,409) -
Total sales 804,826 307,582 718,538 799,545 2,630,491 344,099 (153,409) 2,821,181Segment income (loss)(Operating income (loss)) 57,529 22,220 45,568 37,522 162,839 (8,867) (46,666) 107,306
Fiscal year ended March 31, 2016 (From April 1, 2015 to March 31, 2016)(In millions of U.S. dollars)
Reportable SegmentsOthers Adjustment Consoli-
dated totalPublic Enterprise Telecom Carrier
System Platform Total
Sales
1. Sales to customers 6,846 2,685 6,241 6,505 22,277 2,912 - 25,1892. Intersegment Sales andtransfers 340 61 175 634 1,210 160 (1,370) -
Total sales 7,186 2,746 6,416 7,139 23,487 3,072 (1,370) 25,189Segment income (loss)(Operating income (loss)) 514 198 407 335 1,454 (79) (417) 958
Notes:1. "Others" for the fiscal year ended March 31, 2015 represents businesses such as Smart Energy (Electrodes/Energy Storage System,
Solutions for Utilities, etc.), Mobile Phones , which are not included in reportable segments. "Others" for the fiscal year endedMarch 31, 2016 represents businesses such as Smart Energy (Electrodes/Energy Storage System, Solutions for Utilities, etc.) andMobile Phones, which are not included in reportable segments.
2. "Adjustment" of segment income (loss) for the fiscal year ended March 31, 2015 includes corporate expenses of (51,533) millionyen and noncurrent assets related adjustment of (959) million yen, unallocated to each reportable segment. "Adjustment" of segmentincome (loss) for the fiscal year ended March 31, 2016 includes corporate expenses of (48,282) million yen ((431) million U.S.dollars) and noncurrent assets related adjustment of (573) million yen ((5) million U.S. dollars), unallocated to each reportablesegment. The corporate expenses, unallocated to each reportable segment, are mainly general and administrative expenses incurredat headquarters of NEC, and research and development expenses.
-43-
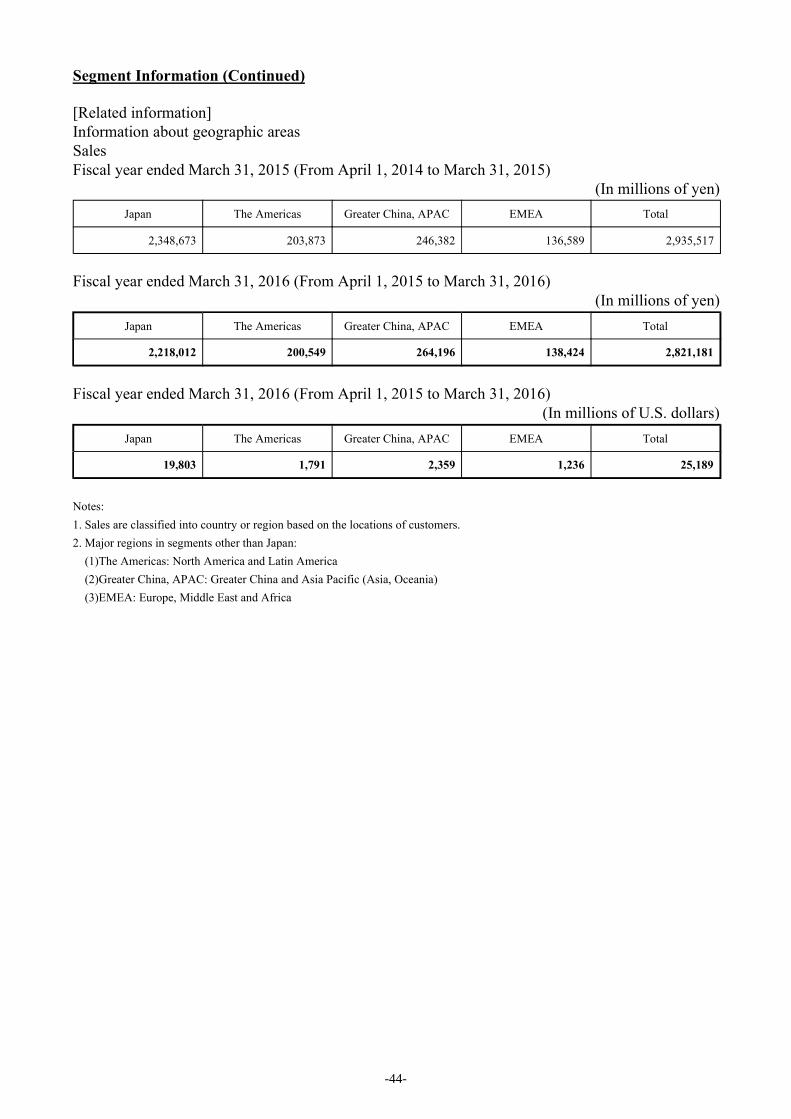
Segment Information (Continued)
[Related information]Information about geographic areasSalesFiscal year ended March 31, 2015 (From April 1, 2014 to March 31, 2015)
(In millions of yen)Japan The Americas Greater China, APAC EMEA Total
2,348,673 203,873 246,382 136,589 2,935,517
Fiscal year ended March 31, 2016 (From April 1, 2015 to March 31, 2016)(In millions of yen)
Japan The Americas Greater China, APAC EMEA Total
2,218,012 200,549 264,196 138,424 2,821,181
Fiscal year ended March 31, 2016 (From April 1, 2015 to March 31, 2016)(In millions of U.S. dollars)
Japan The Americas Greater China, APAC EMEA Total
19,803 1,791 2,359 1,236 25,189
Notes:1. Sales are classified into country or region based on the locations of customers.2. Major regions in segments other than Japan:
(1)The Americas: North America and Latin America(2)Greater China, APAC: Greater China and Asia Pacific (Asia, Oceania)(3)EMEA: Europe, Middle East and Africa
-44-
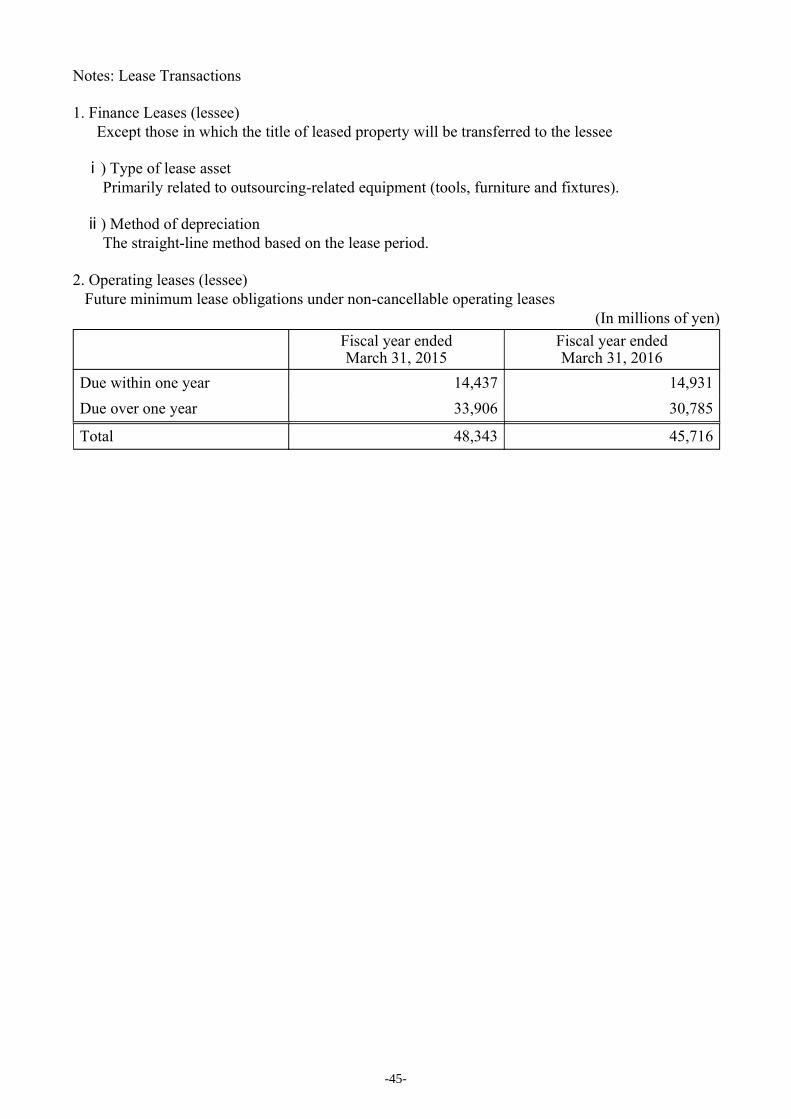
Notes: Lease Transactions
1. Finance Leases (lessee)Except those in which the title of leased property will be transferred to the lessee
ⅰ) Type of lease assetPrimarily related to outsourcing-related equipment (tools, furniture and fixtures).
ⅱ) Method of depreciationThe straight-line method based on the lease period.
2. Operating leases (lessee)Future minimum lease obligations under non-cancellable operating leases
(In millions of yen)Fiscal year endedMarch 31, 2015
Fiscal year endedMarch 31, 2016
Due within one year 14,437 14,931Due over one year 33,906 30,785
Total 48,343 45,716
-45-
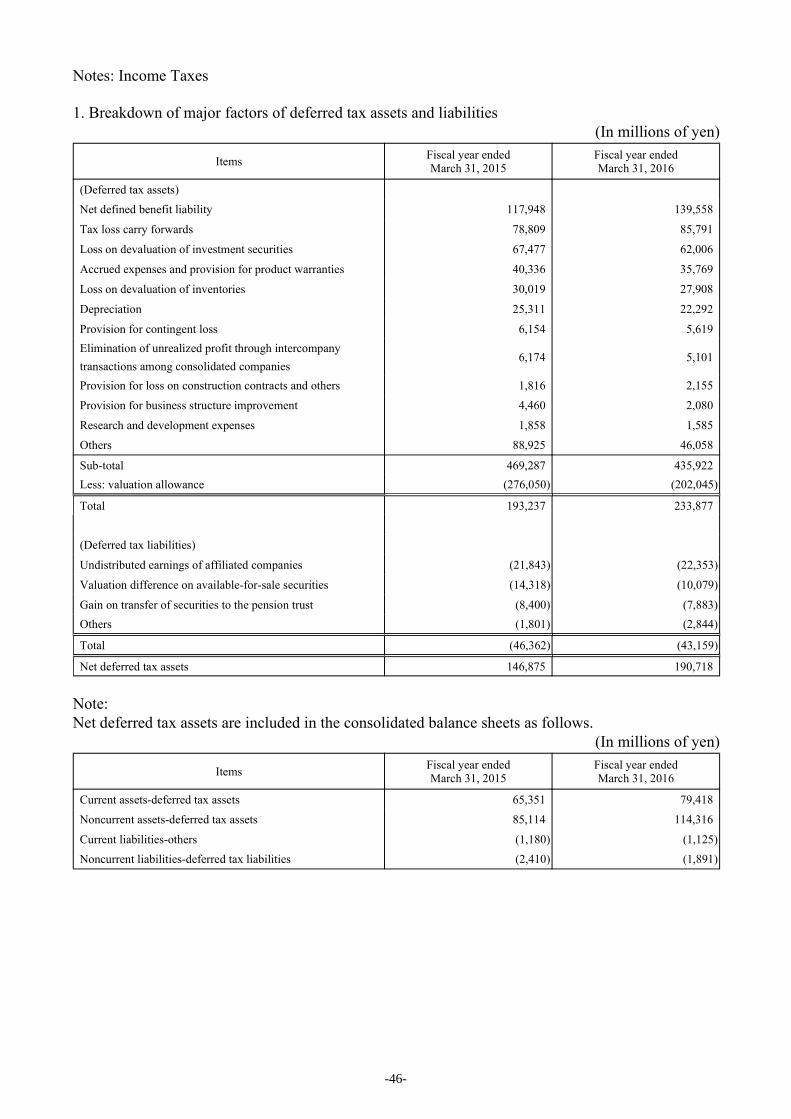
Notes: Income Taxes
1. Breakdown of major factors of deferred tax assets and liabilities(In millions of yen)
Items Fiscal year endedMarch 31, 2015
Fiscal year endedMarch 31, 2016
(Deferred tax assets)
Net defined benefit liability 117,948 139,558
Tax loss carry forwards 78,809 85,791
Loss on devaluation of investment securities 67,477 62,006
Accrued expenses and provision for product warranties 40,336 35,769
Loss on devaluation of inventories 30,019 27,908
Depreciation 25,311 22,292
Provision for contingent loss 6,154 5,619Elimination of unrealized profit through intercompany transactions among consolidated companies
6,174 5,101
Provision for loss on construction contracts and others 1,816 2,155
Provision for business structure improvement 4,460 2,080
Research and development expenses 1,858 1,585
Others 88,925 46,058
Sub-total 469,287 435,922Less: valuation allowance (276,050) (202,045)
Total 193,237 233,877
(Deferred tax liabilities)
Undistributed earnings of affiliated companies (21,843) (22,353)
Valuation difference on available-for-sale securities (14,318) (10,079)
Gain on transfer of securities to the pension trust (8,400) (7,883)Others (1,801) (2,844)
Total (46,362) (43,159)
Net deferred tax assets 146,875 190,718
Note:Net deferred tax assets are included in the consolidated balance sheets as follows.
(In millions of yen)
Items Fiscal year endedMarch 31, 2015
Fiscal year endedMarch 31, 2016
Current assets-deferred tax assets 65,351 79,418
Noncurrent assets-deferred tax assets 85,114 114,316
Current liabilities-others (1,180) (1,125)
Noncurrent liabilities-deferred tax liabilities (2,410) (1,891)
-46-
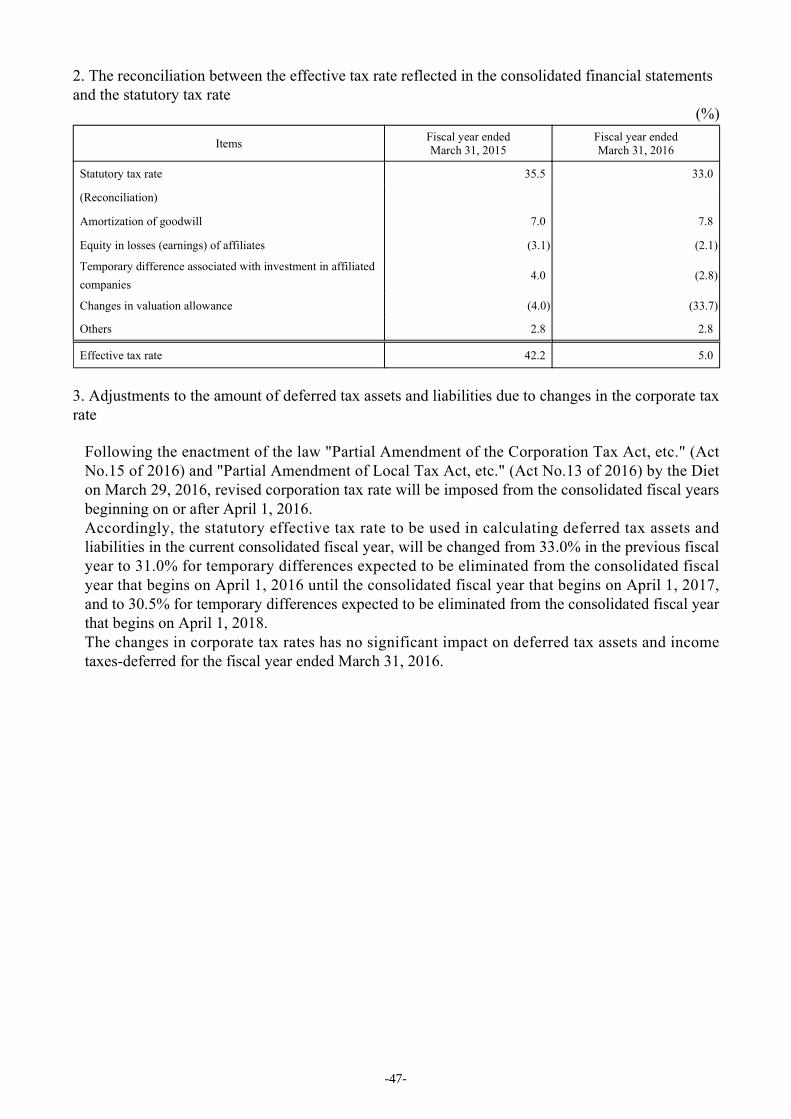
2. The reconciliation between the effective tax rate reflected in the consolidated financial statementsand the statutory tax rate
(%)
Items Fiscal year endedMarch 31, 2015
Fiscal year endedMarch 31, 2016
Statutory tax rate 35.5 33.0
(Reconciliation)
Amortization of goodwill 7.0 7.8
Equity in losses (earnings) of affiliates (3.1) (2.1)
Temporary difference associated with investment in affiliated companies
4.0 (2.8)
Changes in valuation allowance (4.0) (33.7)
Others 2.8 2.8
Effective tax rate 42.2 5.0
3. Adjustments to the amount of deferred tax assets and liabilities due to changes in the corporate taxrate
Following the enactment of the law "Partial Amendment of the Corporation Tax Act, etc." (Act No.15 of 2016) and "Partial Amendment of Local Tax Act, etc." (Act No.13 of 2016) by the Diet on March 29, 2016, revised corporation tax rate will be imposed from the consolidated fiscal years beginning on or after April 1, 2016.Accordingly, the statutory effective tax rate to be used in calculating deferred tax assets and liabilities in the current consolidated fiscal year, will be changed from 33.0% in the previous fiscal year to 31.0% for temporary differences expected to be eliminated from the consolidated fiscal year that begins on April 1, 2016 until the consolidated fiscal year that begins on April 1, 2017, and to 30.5% for temporary differences expected to be eliminated from the consolidated fiscal year that begins on April 1, 2018.The changes in corporate tax rates has no significant impact on deferred tax assets and income taxes-deferred for the fiscal year ended March 31, 2016.
-47-
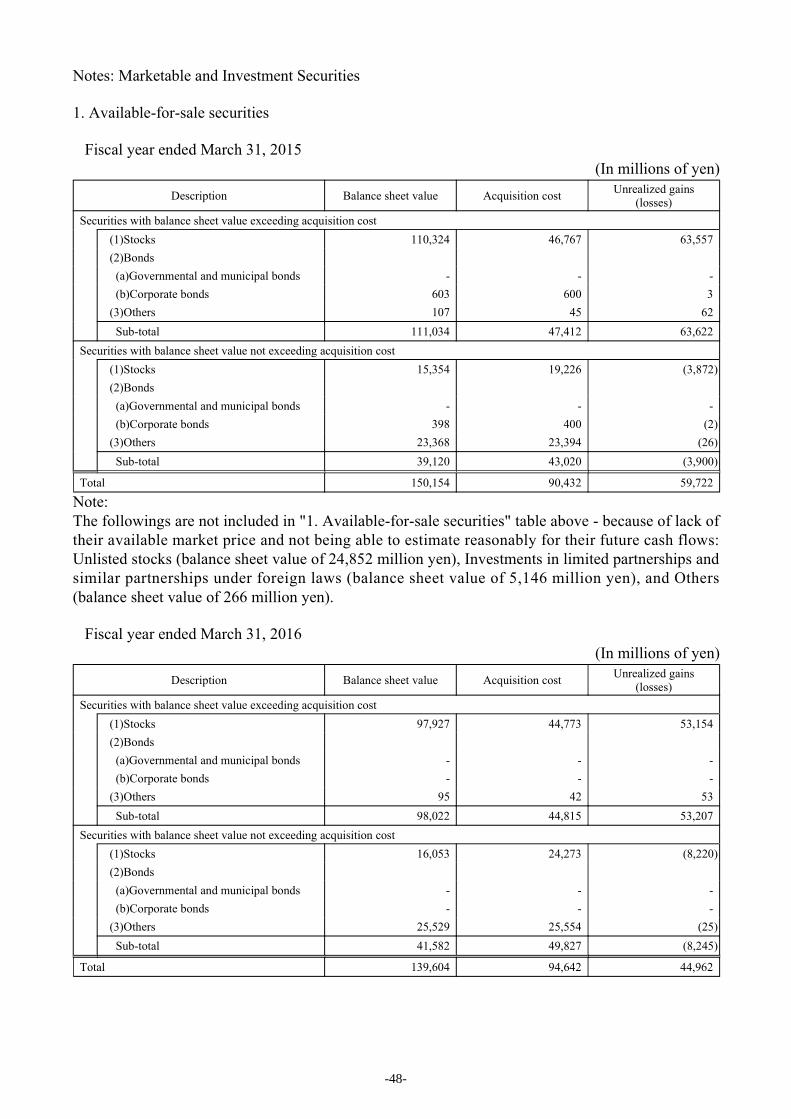
Notes: Marketable and Investment Securities
1. Available-for-sale securities
Fiscal year ended March 31, 2015(In millions of yen)
Description Balance sheet value Acquisition cost Unrealized gains(losses)
Securities with balance sheet value exceeding acquisition cost(1)Stocks 110,324 46,767 63,557(2)Bonds
(a)Governmental and municipal bonds - - -(b)Corporate bonds 603 600 3
(3)Others 107 45 62Sub-total 111,034 47,412 63,622
Securities with balance sheet value not exceeding acquisition cost(1)Stocks 15,354 19,226 (3,872)(2)Bonds
(a)Governmental and municipal bonds - - -(b)Corporate bonds 398 400 (2)
(3)Others 23,368 23,394 (26)Sub-total 39,120 43,020 (3,900)
Total 150,154 90,432 59,722
Note:The followings are not included in "1. Available-for-sale securities" table above - because of lack of their available market price and not being able to estimate reasonably for their future cash flows: Unlisted stocks (balance sheet value of 24,852 million yen), Investments in limited partnerships and similar partnerships under foreign laws (balance sheet value of 5,146 million yen), and Others (balance sheet value of 266 million yen).
Fiscal year ended March 31, 2016(In millions of yen)
Description Balance sheet value Acquisition cost Unrealized gains(losses)
Securities with balance sheet value exceeding acquisition cost(1)Stocks 97,927 44,773 53,154(2)Bonds
(a)Governmental and municipal bonds - - -(b)Corporate bonds - - -
(3)Others 95 42 53Sub-total 98,022 44,815 53,207
Securities with balance sheet value not exceeding acquisition cost(1)Stocks 16,053 24,273 (8,220)(2)Bonds
(a)Governmental and municipal bonds - - -(b)Corporate bonds - - -
(3)Others 25,529 25,554 (25)Sub-total 41,582 49,827 (8,245)
Total 139,604 94,642 44,962
-48-
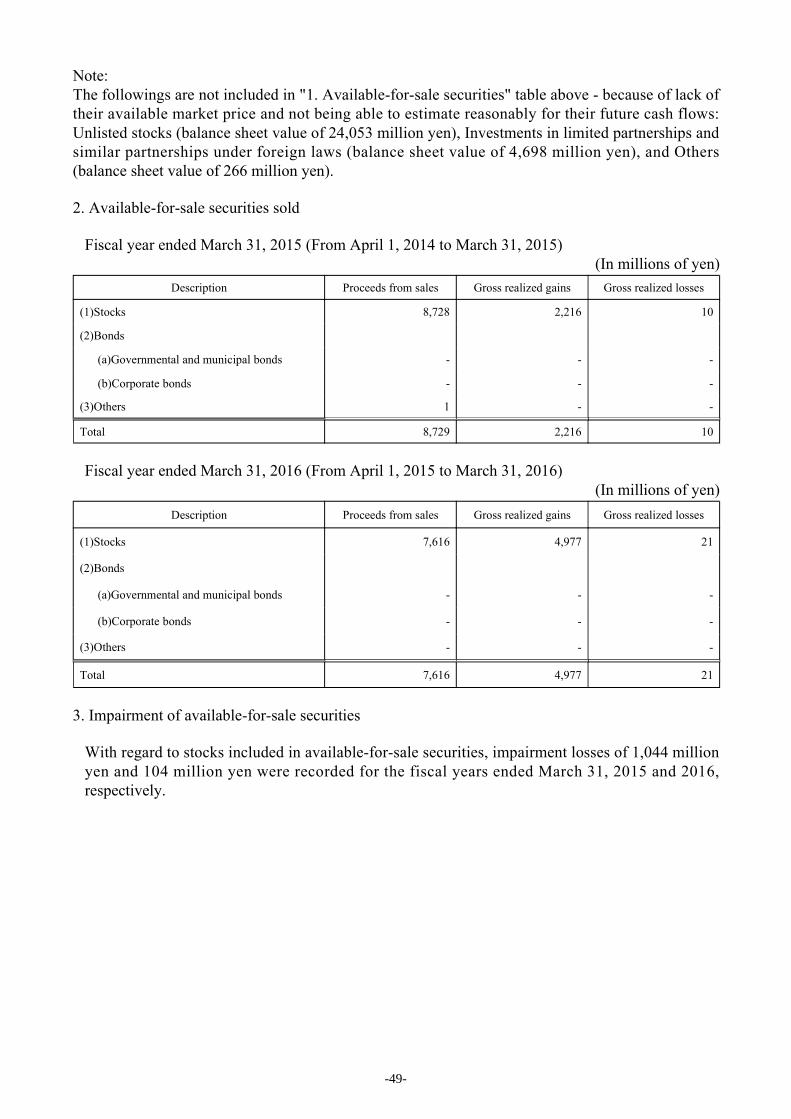
Note:The followings are not included in "1. Available-for-sale securities" table above - because of lack of their available market price and not being able to estimate reasonably for their future cash flows: Unlisted stocks (balance sheet value of 24,053 million yen), Investments in limited partnerships and similar partnerships under foreign laws (balance sheet value of 4,698 million yen), and Others (balance sheet value of 266 million yen).
2. Available-for-sale securities sold
Fiscal year ended March 31, 2015 (From April 1, 2014 to March 31, 2015)(In millions of yen)
Description Proceeds from sales Gross realized gains Gross realized losses
(1)Stocks 8,728 2,216 10
(2)Bonds
(a)Governmental and municipal bonds - - -
(b)Corporate bonds - - -
(3)Others 1 - -
Total 8,729 2,216 10
Fiscal year ended March 31, 2016 (From April 1, 2015 to March 31, 2016)(In millions of yen)
Description Proceeds from sales Gross realized gains Gross realized losses
(1)Stocks 7,616 4,977 21
(2)Bonds
(a)Governmental and municipal bonds - - -
(b)Corporate bonds - - -
(3)Others - - -
Total 7,616 4,977 21
3. Impairment of available-for-sale securities
With regard to stocks included in available-for-sale securities, impairment losses of 1,044 millionyen and 104 million yen were recorded for the fiscal years ended March 31, 2015 and 2016,respectively.
-49-
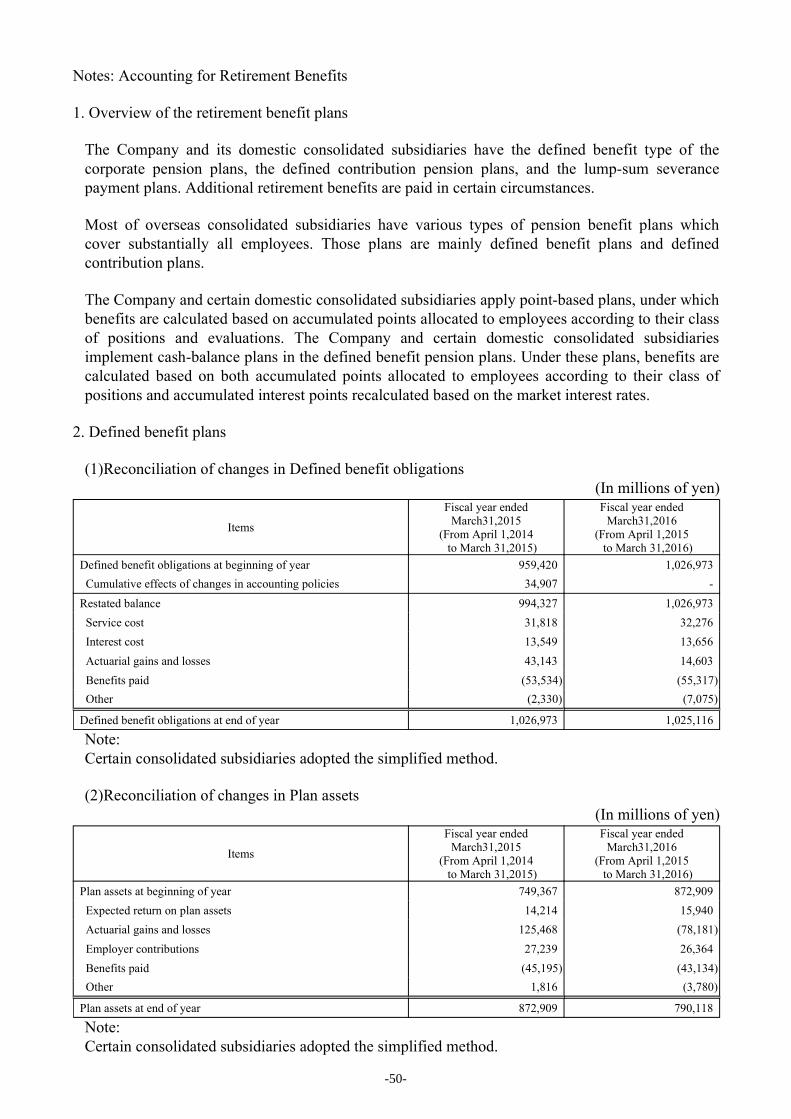
Notes: Accounting for Retirement Benefits
1. Overview of the retirement benefit plans
The Company and its domestic consolidated subsidiaries have the defined benefit type of thecorporate pension plans, the defined contribution pension plans, and the lump-sum severancepayment plans. Additional retirement benefits are paid in certain circumstances.
Most of overseas consolidated subsidiaries have various types of pension benefit plans whichcover substantially all employees. Those plans are mainly defined benefit plans and definedcontribution plans.
The Company and certain domestic consolidated subsidiaries apply point-based plans, under whichbenefits are calculated based on accumulated points allocated to employees according to their classof positions and evaluations. The Company and certain domestic consolidated subsidiariesimplement cash-balance plans in the defined benefit pension plans. Under these plans, benefits arecalculated based on both accumulated points allocated to employees according to their class ofpositions and accumulated interest points recalculated based on the market interest rates.
2. Defined benefit plans
(1)Reconciliation of changes in Defined benefit obligations(In millions of yen)
Items
Fiscal year endedMarch31,2015
(From April 1,2014to March 31,2015)
Fiscal year endedMarch31,2016
(From April 1,2015to March 31,2016)
Defined benefit obligations at beginning of year 959,420 1,026,973Cumulative effects of changes in accounting policies 34,907 -
Restated balance 994,327 1,026,973Service cost 31,818 32,276Interest cost 13,549 13,656Actuarial gains and losses 43,143 14,603Benefits paid (53,534) (55,317)Other (2,330) (7,075)
Defined benefit obligations at end of year 1,026,973 1,025,116
Note:Certain consolidated subsidiaries adopted the simplified method.
(2)Reconciliation of changes in Plan assets(In millions of yen)
Items
Fiscal year endedMarch31,2015
(From April 1,2014to March 31,2015)
Fiscal year endedMarch31,2016
(From April 1,2015to March 31,2016)
Plan assets at beginning of year 749,367 872,909Expected return on plan assets 14,214 15,940Actuarial gains and losses 125,468 (78,181)Employer contributions 27,239 26,364Benefits paid (45,195) (43,134)Other 1,816 (3,780)
Plan assets at end of year 872,909 790,118
Note:Certain consolidated subsidiaries adopted the simplified method.
-50-
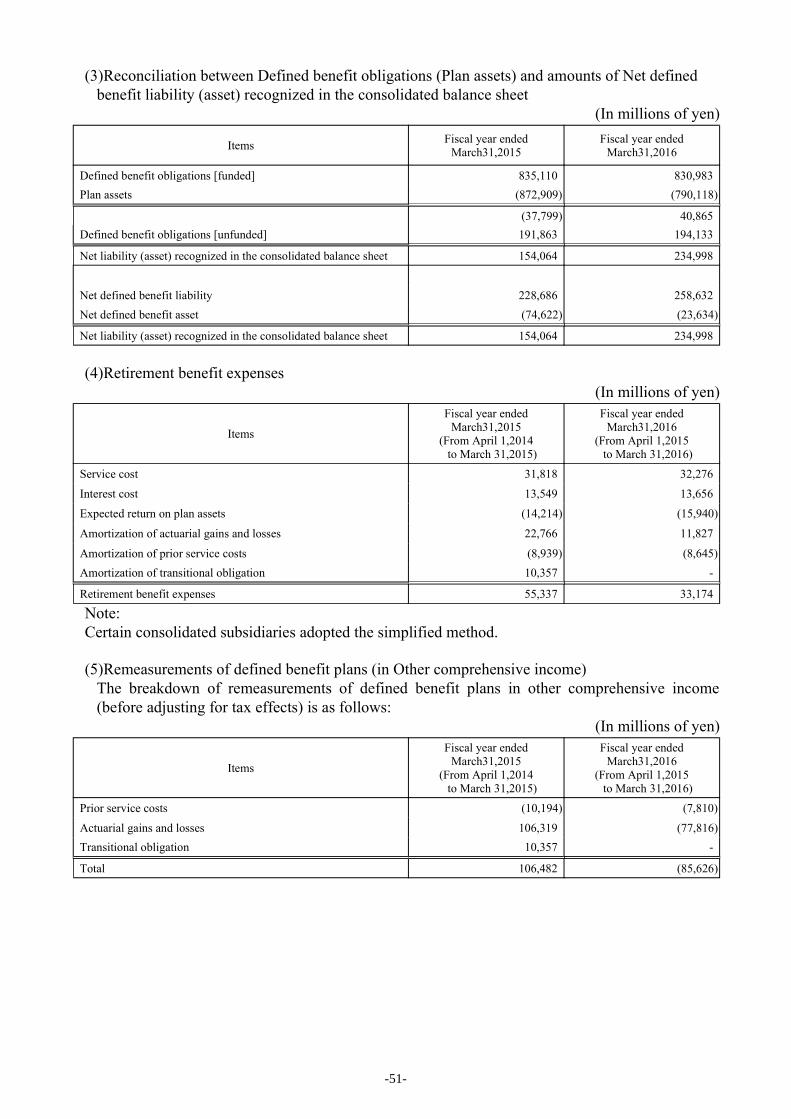
(3)Reconciliation between Defined benefit obligations (Plan assets) and amounts of Net defined benefit liability (asset) recognized in the consolidated balance sheet
(In millions of yen)
Items Fiscal year ended March31,2015
Fiscal year ended March31,2016
Defined benefit obligations [funded] 835,110 830,983 Plan assets (872,909) (790,118)
(37,799) 40,865 Defined benefit obligations [unfunded] 191,863 194,133
Net liability (asset) recognized in the consolidated balance sheet 154,064 234,998
Net defined benefit liability 228,686 258,632 Net defined benefit asset (74,622) (23,634)
Net liability (asset) recognized in the consolidated balance sheet 154,064 234,998
(4)Retirement benefit expenses (In millions of yen)
Items
Fiscal year ended March31,2015
(From April 1,2014 to March 31,2015)
Fiscal year ended March31,2016
(From April 1,2015 to March 31,2016)
Service cost 31,818 32,276
Interest cost 13,549 13,656
Expected return on plan assets (14,214) (15,940)
Amortization of actuarial gains and losses 22,766 11,827
Amortization of prior service costs (8,939) (8,645) Amortization of transitional obligation 10,357 -
Retirement benefit expenses 55,337 33,174
Note: Certain consolidated subsidiaries adopted the simplified method.
(5)Remeasurements of defined benefit plans (in Other comprehensive income) The breakdown of remeasurements of defined benefit plans in other comprehensive income (before adjusting for tax effects) is as follows:
(In millions of yen)
Items
Fiscal year ended March31,2015
(From April 1,2014 to March 31,2015)
Fiscal year ended March31,2016
(From April 1,2015 to March 31,2016)
Prior service costs (10,194) (7,810)
Actuarial gains and losses 106,319 (77,816) Transitional obligation 10,357 -
Total 106,482 (85,626)
-51-
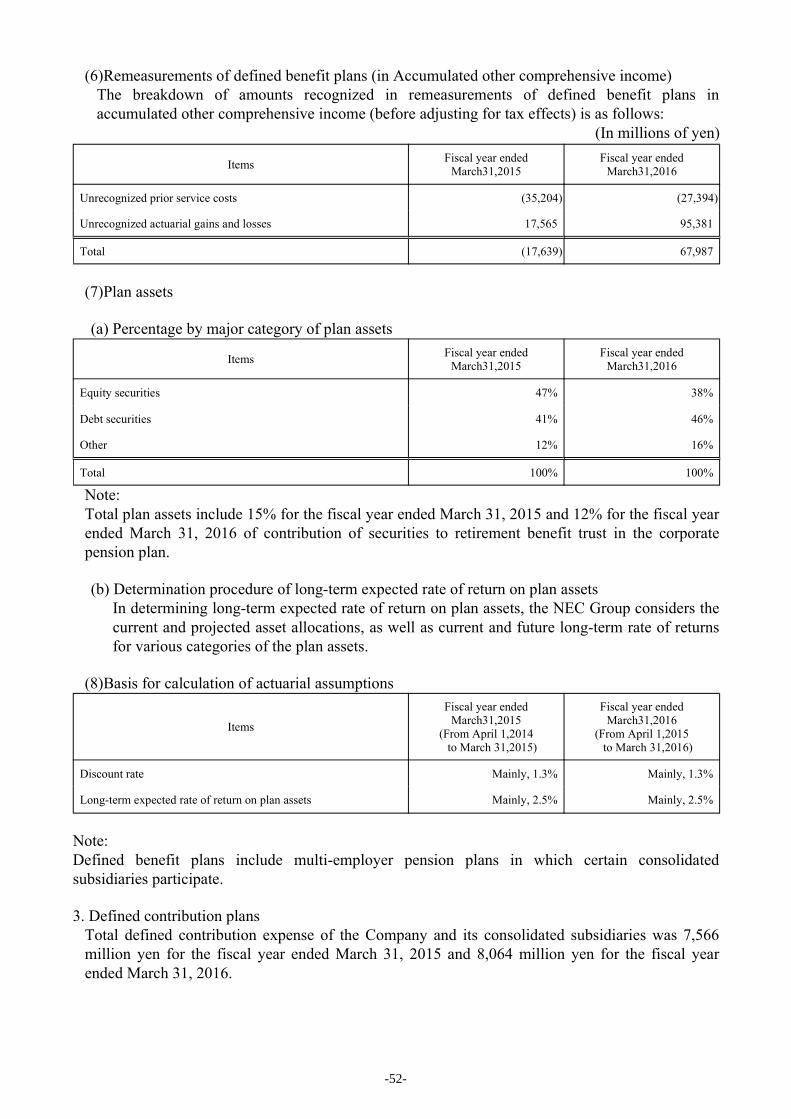
(6)Remeasurements of defined benefit plans (in Accumulated other comprehensive income)The breakdown of amounts recognized in remeasurements of defined benefit plans inaccumulated other comprehensive income (before adjusting for tax effects) is as follows:
(In millions of yen)
Items Fiscal year endedMarch31,2015
Fiscal year endedMarch31,2016
Unrecognized prior service costs (35,204) (27,394)
Unrecognized actuarial gains and losses 17,565 95,381
Total (17,639) 67,987
(7)Plan assets
(a) Percentage by major category of plan assets
Items Fiscal year endedMarch31,2015
Fiscal year endedMarch31,2016
Equity securities 47% 38%
Debt securities 41% 46%
Other 12% 16%
Total 100% 100%
Note:Total plan assets include 15% for the fiscal year ended March 31, 2015 and 12% for the fiscal year ended March 31, 2016 of contribution of securities to retirement benefit trust in the corporate pension plan.
(b) Determination procedure of long-term expected rate of return on plan assetsIn determining long-term expected rate of return on plan assets, the NEC Group considers thecurrent and projected asset allocations, as well as current and future long-term rate of returnsfor various categories of the plan assets.
(8)Basis for calculation of actuarial assumptions
Items
Fiscal year endedMarch31,2015
(From April 1,2014to March 31,2015)
Fiscal year endedMarch31,2016
(From April 1,2015to March 31,2016)
Discount rate Mainly, 1.3% Mainly, 1.3%
Long-term expected rate of return on plan assets Mainly, 2.5% Mainly, 2.5%
Note:Defined benefit plans include multi-employer pension plans in which certain consolidated subsidiaries participate.
3. Defined contribution plansTotal defined contribution expense of the Company and its consolidated subsidiaries was 7,566million yen for the fiscal year ended March 31, 2015 and 8,064 million yen for the fiscal yearended March 31, 2016.
-52-
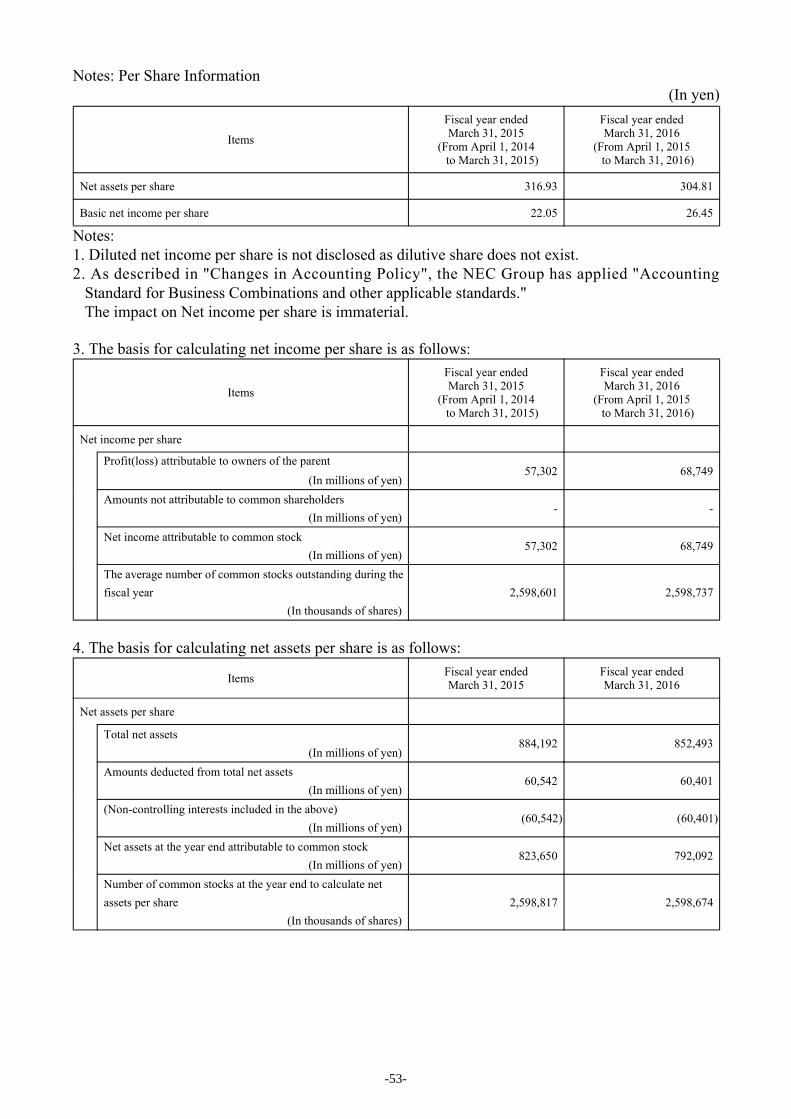
Notes: Per Share Information(In yen)
Items
Fiscal year endedMarch 31, 2015
(From April 1, 2014to March 31, 2015)
Fiscal year endedMarch 31, 2016
(From April 1, 2015to March 31, 2016)
Net assets per share 316.93 304.81
Basic net income per share 22.05 26.45
Notes:1. Diluted net income per share is not disclosed as dilutive share does not exist.2. As described in "Changes in Accounting Policy", the NEC Group has applied "Accounting
Standard for Business Combinations and other applicable standards."The impact on Net income per share is immaterial.
3. The basis for calculating net income per share is as follows:
Items
Fiscal year endedMarch 31, 2015
(From April 1, 2014to March 31, 2015)
Fiscal year endedMarch 31, 2016
(From April 1, 2015to March 31, 2016)
Net income per share
Profit(loss) attributable to owners of the parent(In millions of yen)
57,302 68,749
Amounts not attributable to common shareholders(In millions of yen)
- -
Net income attributable to common stock(In millions of yen)
57,302 68,749
The average number of common stocks outstanding during the fiscal year
(In thousands of shares)2,598,601 2,598,737
4. The basis for calculating net assets per share is as follows:
Items Fiscal year endedMarch 31, 2015
Fiscal year endedMarch 31, 2016
Net assets per share
Total net assets(In millions of yen)
884,192 852,493
Amounts deducted from total net assets(In millions of yen)
60,542 60,401
(Non-controlling interests included in the above)(In millions of yen)
(60,542) (60,401)
Net assets at the year end attributable to common stock(In millions of yen)
823,650 792,092
Number of common stocks at the year end to calculate net assets per share
(In thousands of shares)2,598,817 2,598,674
-53-
Notes: Subsequent Events
Not applicable
Notes: Others
NEC Latin America S.A., a consolidated subsidiary of NEC, received an order from the Brazilian Tax Authorities imposing an additional withholding tax on loan receivables for previous years in the amount of approximately 367 million Brazilian Real.
Following the dismissal of the petition of objection to the order, the company brought an action to court on April 14, 2016 for revocation of the order.
-54-
Cautionary Statement with Respect to Forward-Looking Statements
This material contains forward-looking statements regarding estimations, forecasts, targets and plans in relation to the results of operations, financial conditions and other overall management of the NEC Group (the "forward-looking statements"). The forward-looking statements are made based on information currently available to NEC and certain assumptions considered reasonable as of the date of this material. These determinations and assumptions are inherently subjective and uncertain. These forward-looking statements are not guarantees of future performance, and actual operating results may differ substantially due to a number of factors.
The factors that may influence the operating results include, but are not limited to, the following:・ Effects of economic conditions, volatility in the markets generally, and fluctuations in foreign
currency exchange and interest rate・ Trends and factors beyond the NEC Group's control and fluctuations in financial conditions
and profits of the NEC Group that are caused by external factors・ Risks arising from acquisitions, business combinations and reorganizations, including the
possibility that the expected benefits cannot be realized or that the transactions may result inunanticipated adverse consequences
・ Developments in the NEC Group's alliances with strategic partners・ Effects of expanding the NEC Group's global business・ Risk that the NEC Group may fail to keep pace with rapid technological developments and
changes in customer preferences・ Risk that the NEC Group may lose sales due to problems with the production process or due
to its failure to adapt to demand fluctuations・ Defects in products and services・ Shortcomings in material procurement and increases in delivery cost・ Acquisition and protection of intellectual property rights necessary for the operation of
business・ Risk that intellectual property licenses owned by third parties cannot be obtained and/or are
discontinued・ Risk that the NEC Group may be exposed to unfavorable pricing environment due to
intensified competition・ Risk that a major customer changes investment targets, reduces capital investment and/or
reduces the value of transactions with the NEC Group・ Risk that the NEC Group may be unable to provide or facilitate payment arrangements (such
as vendor financing) to its customers on terms acceptable to them or at all, or risk that theNEC Group's customers are unable to make payments on time, due to the customers' financialdifficulties or otherwise
・ Risk that the NEC Group may experience a substantial loss of, or an inability to attract,talented personnel
・ Risk that the NEC Group's ability to access the commercial paper market or other debtmarkets are adversely affected due to a downgrade in its credit rating
・ Risk that the NEC Group may incur large costs and/or liabilities in relation to internal control,legal proceedings, laws and governmental policies, environmental laws and regulations, taxpractice, information management, and human rights and working environment
・ Consequences of natural and fire disasters・ Changes in methods, estimates and judgments that the NEC Group uses in applying its
accounting policies・ Risk that the NEC Group may incur liabilities and losses in relation to its retirement benefit
obligations
-55-

The forward-looking statements contained in this material are based on information that NEC possesses as of the date hereof. New risks and uncertainties come up from time to time, and it is impossible for NEC to predict these events or how they may affect the NEC Group. NEC does not intend to update or revise any forward-looking statements, whether as a result of new information, future events or otherwise.
***
-56-


