Full Year 2019 results and 2020 outlook presentation...2019 GROUP FINANCIAL PERFORMANCE 5 NET SALES...
34
FULL YEAR 2019 RESULTS AND 2020 OUTLOOK PRESENTATION February 12, 2020 1
Transcript of Full Year 2019 results and 2020 outlook presentation...2019 GROUP FINANCIAL PERFORMANCE 5 NET SALES...

FULL YEAR 2019 RESULTS AND
2020 OUTLOOK PRESENTATIONFebruary 12, 2020
1

FULL YEAR 2019 RESULTS
Gonzalve BICH
Jim DIPIETRO

BIC IN 2019 – KEY TAKEAWAYS
3
BIC 2022 InventThe Future
Transformation Plan on track
Proposed Dividend per
share of 3.45 euros for
2019
ContinuedInvestments in Brand Support and SelectedAcquisitions
ChallengingTrading
Environment

PROGRESS ON BIC 2022-INVENT THE FUTURE PLAN
4
New centralized procurement organization
Implementation of End-to-End planning and integrated Sales & Operating Planning processes
Global Customer Relationship Management platform implemented, with ~1 million consumers already engaged
New Global Market and Consumer Insights Team created
Stationery and Shavers Design and Engineering teams merged to accelerate pipeline and time-to-market
BIC BodyMark Tattoo marker, and “Made For YOU” Direct-to-consumer online Shaver Brand launched in the U.S.
New e-commerce Leadership and team on board
E-commerce Net Sales up 13% in 2019
Effectiveness Omnichannel DistributionInnovation Consumer-centric Brands

2019 GROUP FINANCIAL PERFORMANCE
5
NET SALESChange on a
comparative basis %
NORMALIZED IFO NIFO Margin %
NET CASH POSITION
1,949.4 M€-1.9%
146.9M€-9.0%
3.91€ (+2.9%)
331.8 M€17.0%
5.47€ (-6.8%)
EPS
NORMALIZED EPS
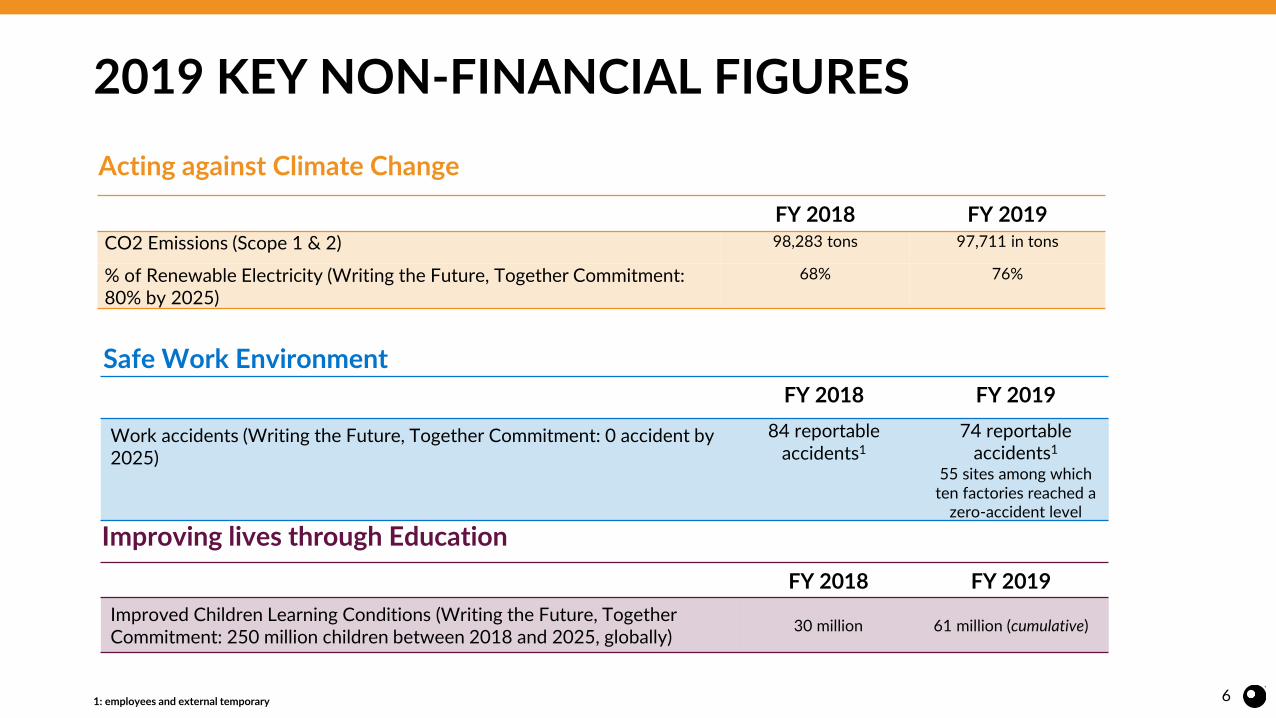
2019 KEY NON-FINANCIAL FIGURES
6
Acting against Climate Change
Improving lives through Education
Safe Work Environment
FY 2018 FY 2019
CO2 Emissions (Scope 1 & 2) 98,283 tons 97,711 in tons
% of Renewable Electricity (Writing the Future, Together Commitment: 80% by 2025)
68% 76%
FY 2018 FY 2019
Work accidents (Writing the Future, Together Commitment: 0 accident by 2025)
84 reportable accidents1
74 reportable accidents1
55 sites among which ten factories reached a
zero-accident level
FY 2018 FY 2019
Improved Children Learning Conditions (Writing the Future, Together Commitment: 250 million children between 2018 and 2025, globally)
30 million 61 million (cumulative)
1: employees and external temporary
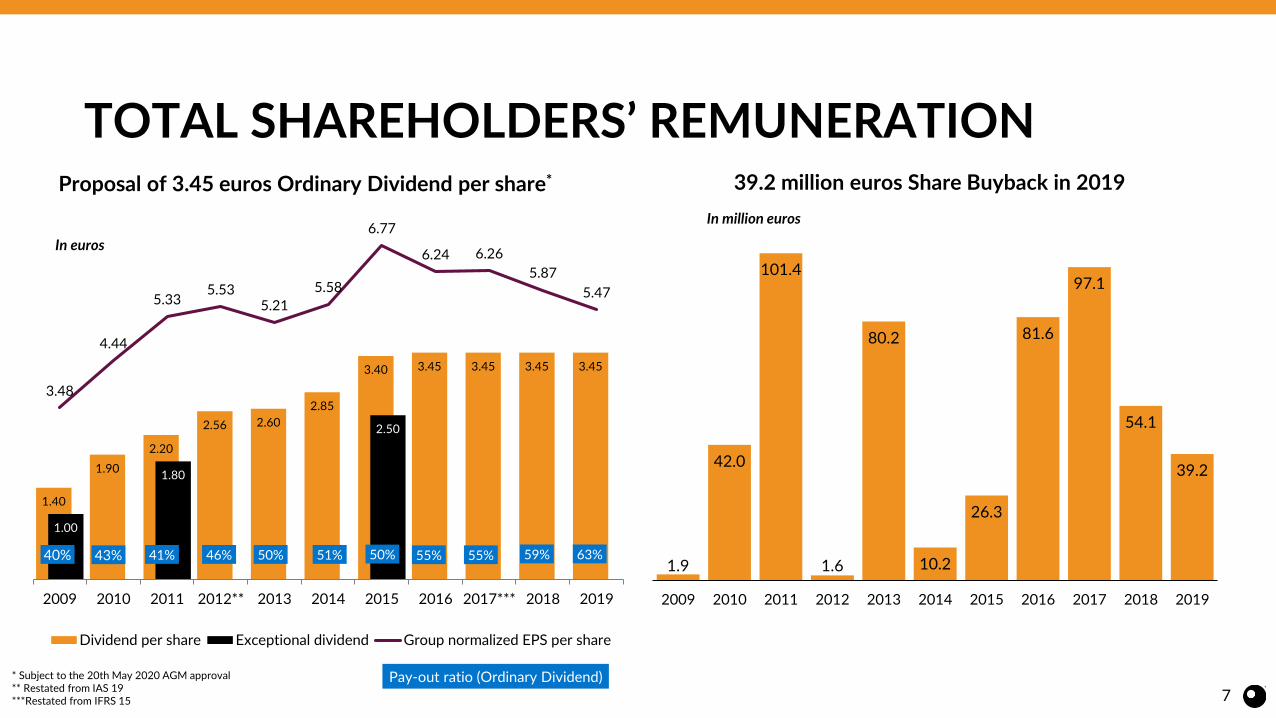
TOTAL SHAREHOLDERS’ REMUNERATION
1.40
1.90
2.20
2.56 2.60
2.85
3.40 3.45 3.45 3.45 3.45
1.00
1.80
2.50
3.48
4.44
5.335.53
5.21
5.58
6.77
6.24 6.26
5.87
5.47
2009 2010 2011 2012** 2013 2014 2015 2016 2017*** 2018 2019
Dividend per share Exceptional dividend Group normalized EPS per share
7
40% 43% 41% 46% 50% 51%
In euros
Pay-out ratio (Ordinary Dividend)* Subject to the 20th May 2020 AGM approval** Restated from IAS 19***Restated from IFRS 15
Proposal of 3.45 euros Ordinary Dividend per share*
1.9
42.0
101.4
1.6
80.2
10.2
26.3
81.6
97.1
54.1
39.2
2009 2010 2011 2012 2013 2014 2015 2016 2017 2018 2019
39.2 million euros Share Buyback in 2019
In million euros
50% 55% 59%55% 63%

8
2019 HIGHLIGHTS ON STATIONERY
-4.8 %*169.3 M€
-3.4 %*774.4 M€
Q4
FY
Net Sales
-0.5 %-0.9 M€
6.2 %47.8 M€
Q4
FY
NIFO Margin
(*) On a comparative basis(**) Change in value.
Source: GFK December 2019 data for Europe, NPD December 2019 95% coverage for U.S
• Soft Back-to-School seasons in both U.S. and Mexico.
• Solid e-commerce growth in both Europe and North America
• Robust performance in value-added segments
-0.8%
0.0%
2018 déc-19
BIC market share
-0.1 pts
EUROPE** U.S.**
MARKET & BIC PERFORMANCE
6.9 bn unitsFY
Volumes sold
-5.9%
0.3%
0.5%
2018 déc-19
BIC market share
+0.3 pts
9
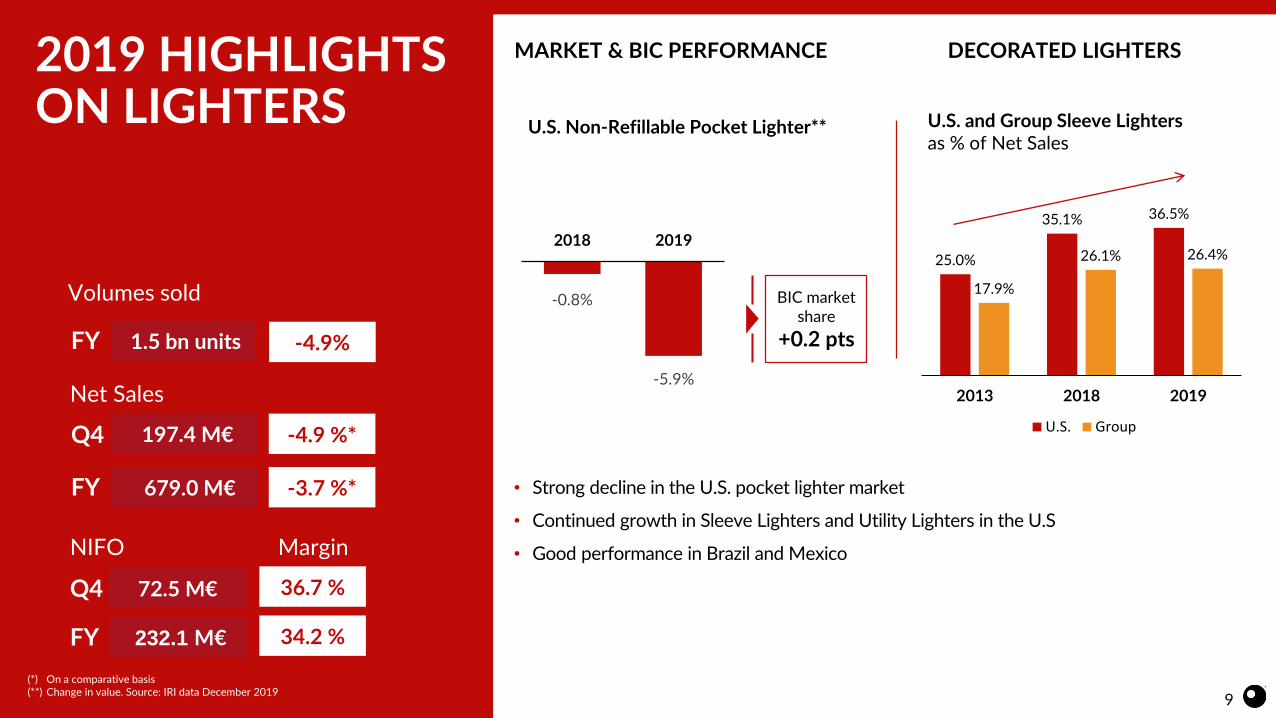
2019 HIGHLIGHTS ON LIGHTERS
Volumes sold
1.5 bn unitsFY
36.7 %72.5 M€
34.2 %232.1 M€
Q4
FY
MarginNIFO
-0.8%
-5.9%
2018 2019
BIC market share
+0.2 pts
• Strong decline in the U.S. pocket lighter market
• Continued growth in Sleeve Lighters and Utility Lighters in the U.S
• Good performance in Brazil and Mexico
(*) On a comparative basis(**) Change in value. Source: IRI data December 2019
MARKET & BIC PERFORMANCE DECORATED LIGHTERS
U.S. Non-Refillable Pocket Lighter** U.S. and Group Sleeve Lighters as % of Net Sales
Net Sales
-4.9 %*197.4 M€
-3.7 %*679.0 M€
Q4
FY
-4.9%
25.0%
35.1% 36.5%
17.9%
26.1% 26.4%
2013 2018 2019
U.S. Group

-5.0%
-8.2%
-2.9% -2.3%
-6.3%
-11.7%
-2.2%-4.2%-4.1% -3.1% -3.8%
0.9%
2016 2017 2018 2019
Total
One Piece
refillable
10
2019 HIGHLIGHTS ON SHAVERS
Net Sales
- 1.6 %*123.5 M€
+0.1 %
+ 3.2 %*463.0 M€
Q4
FY
NIFO
15.6 %19.3 M€
12.1 %56.2 M€
Q4
FY
Margin
(*) On a comparative basis(**) Source: IRI total market Year-to-date ending 31-DEC-2019
• Distribution gains and success of value-added and new products in Europe
• Strong performance in US one-piece market, driven by the female segment
• Successful product premiumization towards the three-blade in both Brazil and Mexico
Volumes sold
2.6 bn unitsFY
1.4
-1.3
-0.5
1.9
-0.5 -0.5
0.7
1.7
-3.0
-2.0
-1.0
0.0
1.0
2.0
3.0
2016 2017 2018 2019
BIC Market Share change - YTD BIC Market Share change - 13 weeks
BIC’s US MARKET SHARE / One Piece segment**In value (in pts)
US MARKET PERFORMANCE**
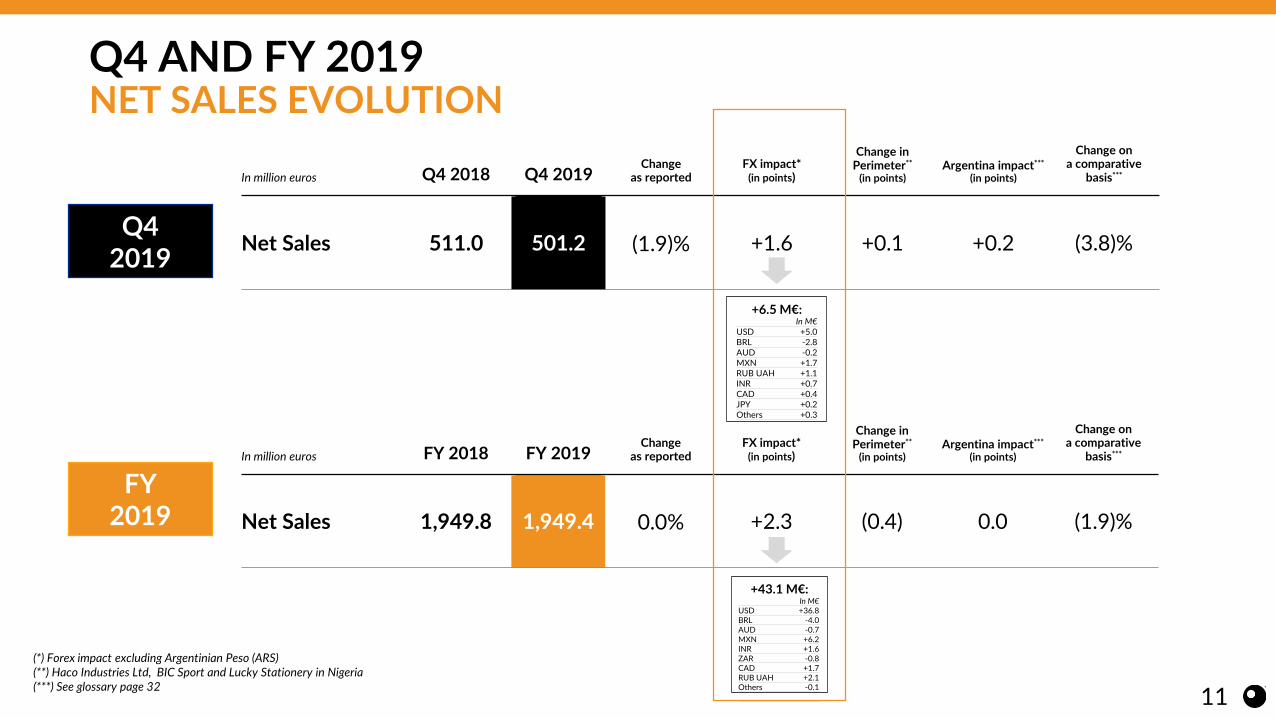
In million euros FY 2018 FY 2019Change
as reportedFX impact*
(in points)
Change in Perimeter**
(in points)Argentina impact***
(in points)
Change on a comparative
basis***
Net Sales 1,949.8 1,949.4 0.0% +2.3 (0.4) 0.0 (1.9)%
In million euros Q4 2018 Q4 2019Change
as reportedFX impact*
(in points)
Change in Perimeter**
(in points)Argentina impact***
(in points)
Change on a comparative
basis***
Net Sales 511.0 501.2 (1.9)% +1.6 +0.1 +0.2 (3.8)%
(*) Forex impact excluding Argentinian Peso (ARS) (**) Haco Industries Ltd, BIC Sport and Lucky Stationery in Nigeria(***) See glossary page 32
+6.5 M€:In M€
USD +5.0BRL -2.8AUD -0.2MXN +1.7RUB UAH +1.1INR +0.7CAD +0.4JPY +0.2Others +0.3
Q4 2019
FY2019
In M€USD +36.8BRL -4.0AUD -0.7MXN +6.2INR +1.6ZAR -0.8CAD +1.7RUB UAH +2.1Others -0.1
+43.1 M€:
Q4 AND FY 2019NET SALES EVOLUTION
11

FY 2019 FROM NET SALES TO IFO
BIC GroupIn million euros
FY 18 FY 19Change as reported
Change on a constant
currency basis*
Change on a comparative
basis*
Net Sales 1,949.8 1,949.4 0.0% (1.4)% (1.9)%
Gross Profit 1,014.3 977.3 (3.6%)
Normalized Income from Operations
352.4 331.8 (5.8%)
Income from Operations
258.8 252.7 (2.3%)
12
(*) See glossary page 32

13
Q4 AND FY 2019KEY COMPONENTS OF NORMALIZED* INCOME FROM OPERATIONS MARGIN
17.0%18.1%
-1.4%
-0.1%
+2.6%
Q4 2018 Normalized* IFOmargin
Change in cost of production** Total brand support*** OPEX and other expenses Q4 2019 Normalized* IFOmargin
Q4 2019
(*) See glossary (this excludes impact of 2018 Argentina hyperinflation)(**) Gross Profit margin excluding promotions and investments related to consumer and business development support(***) Total Brand Support: consumer and business development Support + advertising, consumer and trade support
18.1% 17.0%
-1.9%
-0.4% +1.2%
FY 2018 Normalized* IFOmargin
Change in cost of production** Total brand support*** OPEX and other expenses FY 2019 Normalized* IFOmargin
FY 2019
+0.6 pts from lower incentive
plan costs vs prior year
+1.8 points from lower incentive
plan costs versus prior year
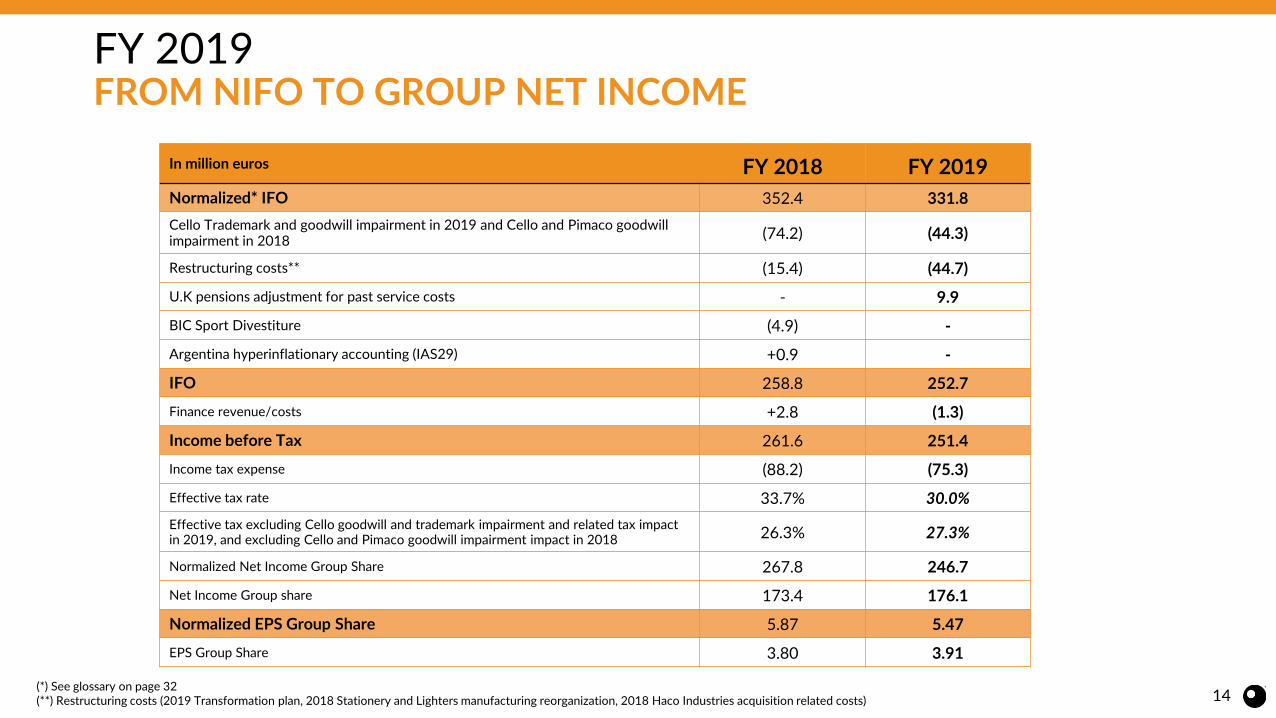
FY 2019FROM NIFO TO GROUP NET INCOME
14(*) See glossary on page 32(**) Restructuring costs (2019 Transformation plan, 2018 Stationery and Lighters manufacturing reorganization, 2018 Haco Industries acquisition related costs)
In million euros FY 2018 FY 2019
Normalized* IFO 352.4 331.8
Cello Trademark and goodwill impairment in 2019 and Cello and Pimaco goodwill impairment in 2018 (74.2) (44.3)
Restructuring costs** (15.4) (44.7)
U.K pensions adjustment for past service costs - 9.9
BIC Sport Divestiture (4.9) -
Argentina hyperinflationary accounting (IAS29) +0.9 -
IFO 258.8 252.7
Finance revenue/costs +2.8 (1.3)
Income before Tax 261.6 251.4
Income tax expense (88.2) (75.3)
Effective tax rate 33.7% 30.0%
Effective tax excluding Cello goodwill and trademark impairment and related tax impact in 2019, and excluding Cello and Pimaco goodwill impairment impact in 2018 26.3% 27.3%
Normalized Net Income Group Share 267.8 246.7
Net Income Group share 173.4 176.1
Normalized EPS Group Share 5.87 5.47
EPS Group Share 3.80 3.91

2019CAPEX – DEPRECIATION & AMORTIZATION
15
5363
89
125
107112
121
181186
123.8113.6
75 7771 72 75
8190 94 93 93
101.4
2009 2010 2011 2012 2013 2014 2015 2016 2017 2018 2019
CAPEX Depreciation and Amortization
Shavers
Stationery
Lighters
Others
113.6 M€
33%
36%21%
10%
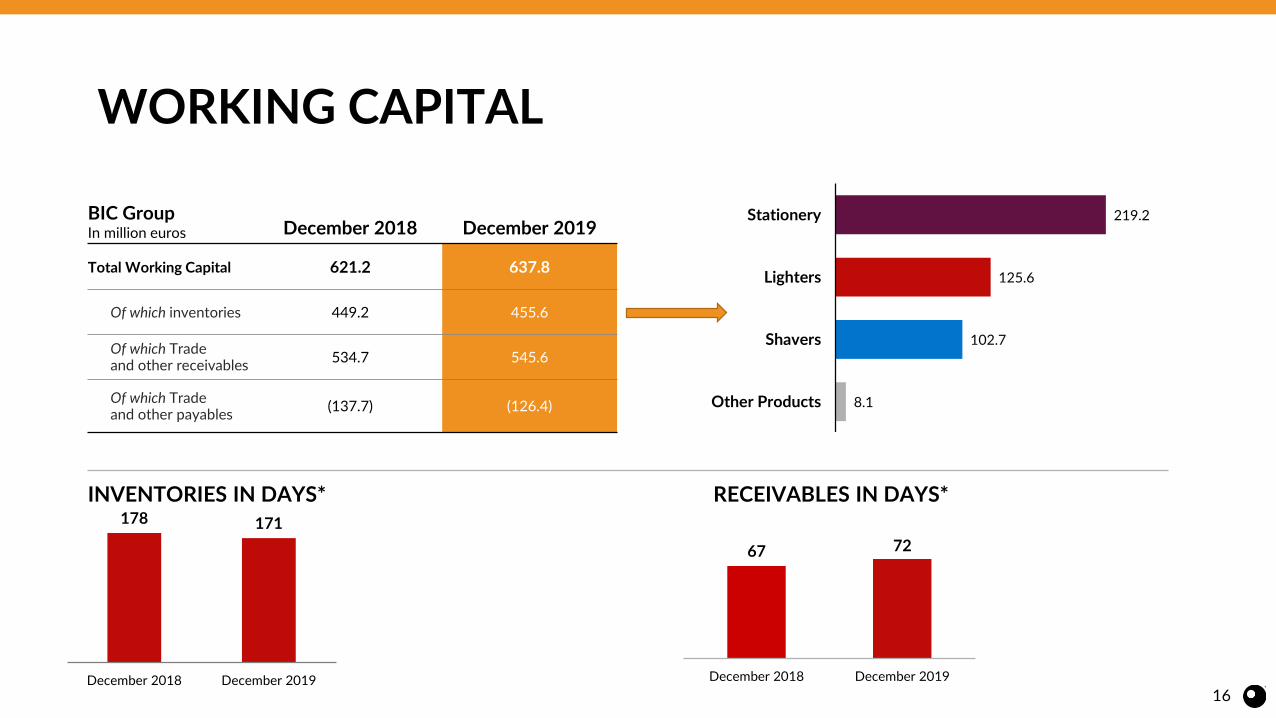
WORKING CAPITAL
16
BIC GroupIn million euros December 2018 December 2019
Total Working Capital 621.2 637.8
Of which inventories 449.2 455.6
Of which Trade and other receivables
534.7 545.6
Of which Trade and other payables
(137.7) (126.4) 8.1
102.7
125.6
219.2
Other Products
Shavers
Lighters
Stationery
178 171
December 2018 December 2019
INVENTORIES IN DAYS*
67 72
December 2018 December 2019
RECEIVABLES IN DAYS*

161.5 146.9
334.5 -16.3 -113.6
-155.2
-40.0-16.2
- 7.8
December 2018Net Cash Position
Operating cash flow Change in workingcapital and others
CAPEX Dividend payment Share buyback,exercise of stock
options and liquiditycontract
Acquisitions* Others December 2019
NET CASH POSITION
17
Operations
Net Cash From Operating activities
+318.2 M€
(*) Haco Industries and Lucky Stationery in Nigeria acquisitions
In million euros

2020 OUTLOOKGonzalve BICH

2020MARKET ASSUMPTIONS*
Flat to slight decline for the three categories, in value
• Flat to slight increase in U.S. Stationery market, in value
• -4.0% to -5.0% decrease in total U.S. pocket Lighters market, in value
• -4.0% to -5.0% decrease in total U.S. one-piece Shavers market, in value
low-single digit increase for the three categories, in value
19
Europe
Latin America
North America
*: BIC internal estimates based on Market panels (IRI, Nielsen) and Euromonitor – in value

2020Main Net Sales and Normalized IFO margin Drivers
20
Line Extensions & New Products
Distribution Gains & Enhanced Route-to-Market
Commercial Excellence
Net Sales
NIFO Margin
Stable Gross Margin
Increase in Brand Support
efficiency
Unfavorable Fixed Costs Absorption
Decrease in Raw Materials costs & Positive Price impacts
Higher incentive plan costs compared to 2019
New Organization implementation
Higher OPEX
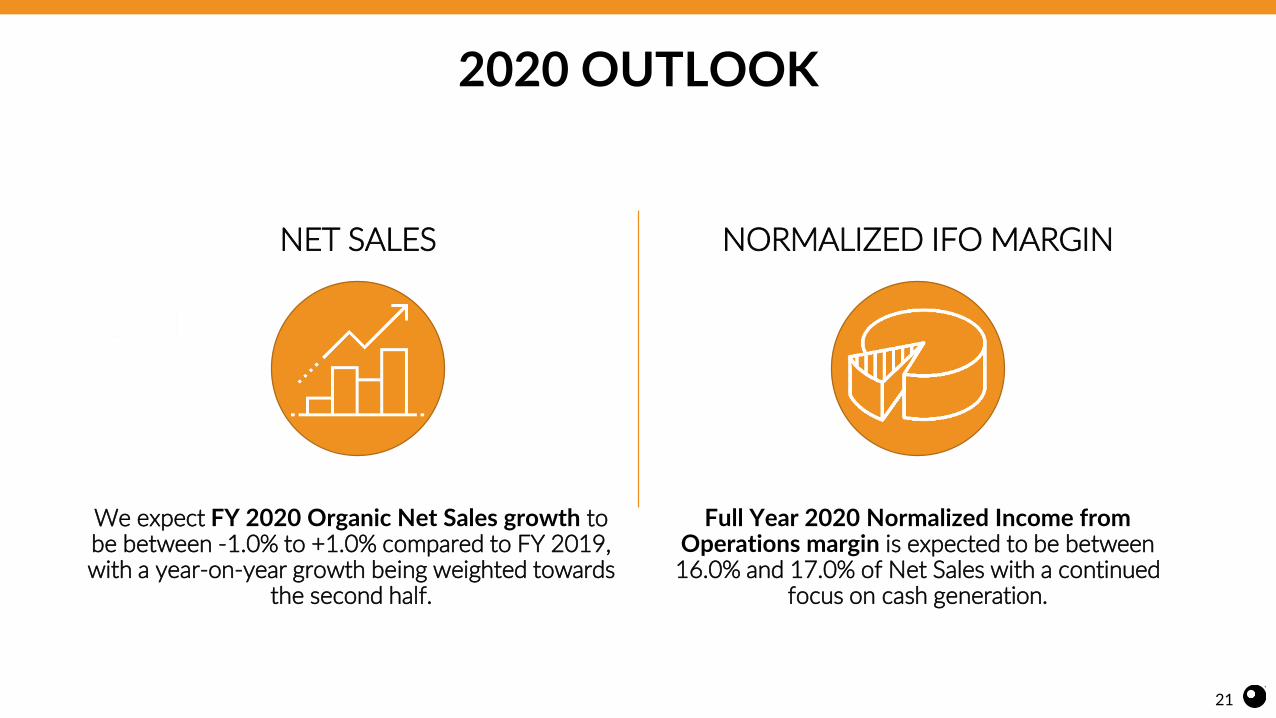
NET SALES NORMALIZED IFO MARGIN
21
2020 OUTLOOK
We expect FY 2020 Organic Net Sales growth to be between -1.0% to +1.0% compared to FY 2019, with a year-on-year growth being weighted towards
the second half.
Full Year 2020 Normalized Income from Operations margin is expected to be between 16.0% and 17.0% of Net Sales with a continued
focus on cash generation.

APPENDIX

Q4 AND FY2019 NET SALES BY GEOGRAPHY
23
-3.8% on a comparative basis
EUROPE
NORTH AMERICA
DEVELOPING MARKETS
Q4 Net Sales
-3.8%
-8.3%
3.2%
FY19 Net Sales
-1.9% on a comparative basis
-3.1%
-4.1%
2.3%EUROPE
NORTH AMERICA
DEVELOPING MARKETS
(*) 2017 figures restated from IFRS15

24
FY 2019 NET SALES BREAKDOWN
Stationery40%
Lighters35%
Shavers24%
Other products1%
BY CATEGORY
Europe29%
North America39%
Developing markets
32%
BY GEOGRAPHY

GROUP QUARTERLY FIGURES
25
Restated for IFRS 15Restated for IAS
29
In million euros FY 17 Q1 17 Q2 17 Q3 17 Q4 17 FY 17 Q1 18 Q2 18 Q3 18 Q4 18 FY 18 Q1 19 Q2 19 Q3 19 Q4 19 FY 19
Net Sales 2 020.3 473.2 599.0 471.7 497.4 2 041.4 415.4 543.9 479.5 511.0 1 949.8 415.4 544.8 488.0 501.2 1 949.4
YoY actual changes -0.3% -12.2% -9.2% +1.6% +2.7% -4.5% 0.0% +0.2% +1.8% -1.9% 0.0%
YoY changes on a constant currencies basis*
+0.5% -3.0% -3.1% +5.1% +5.4% +0.9% -1.1% -1.5% -0.5% -2.3% -1.4%
YoY changes on a comparative basis*
+1.4% -1.5% -2.3% +5.2% +5.4% +1.5% -2.0% -1.3% -0.5% -3.8% -1.9%
IFO 376.2 74.1 119.6 83.1 98.1 374.9 69.6 50.0 76.8 62.5 258.8 54.6 71.4 83.1 43.6 252.7
Normalized IFO* 400.9 81.1 137.1 83.2 98.1 399.6 69.6 118.7 77.0 87.1 352.4 54.6 98.5 88.0 90.7 331.8
IFO margin 18.6% 15.7% 20.0% 17.6% 19.7% 18.4% 16.7% 9.2% 16.0% 12.2% 13.3% 13.1% 13.1% 17.0% 8.7% 13.0%
Normalized IFO margin* 19.8% 17.1% 22.9% 17.6% 19.7% 19.6% 16.7% 21.8% 16.1% 17.0% 18.1% 13.1% 18.1% 18.0% 18.1% 17.0%
Net Income Group Share 288.3 49.5 79.2 57.6 101.1 287.3 48.6 22.2 52.7 49.8 173.4 39.3 50.3 63.0 23.5 176.1
EPS Group Share 6.20 1.06 1.70 1.23 2.17 6.18 1.06 0.49 1.15 1.09 3.80 0.87 1.11 1.40 0.52 3.91
* see glossary

GROUP QUARTERLY FIGURES BY GEOGRAPHY
26
Restated for IFRS 15Restated for IAS 29
In million euros FY 17 Q1 17 Q2 17 Q3 17 Q4 17 FY 17 Q1 18 Q2 18 Q3 18 Q4 18 FY 18 Q1 19 Q2 19 Q3 19 Q4 19 FY 19
Europe 559.3 131.5 181.2 137.7 119.6 570.0 124.3 176.1 138.0 121.4 559.7 122.8 167.9 143.5 124.7 558.9
Net Sales
YoY actual changes +2.7% -5.5% -2.8% +0.2% +1.5% -1.8% -1.2% -4.6% +4.0% +2.7% -0.1%
YoY changes on a comparative basis*
+4.9% -0.4% +1.7% +2.9% +2.9% +1.8% +2.4% -1.3% +6.2% +3.2% +2.3%
North America 783.5 178.5 241.9 184.9 181.3 786.7 154.9 224.9 196.3 189.4 765.6 161.8 227.5 196.9 178.3 764.4
Net Sales
YoY actual changes -3.5% -13.2% -7.0% +6.2% +4.5% -2.7% +4.4% +1.1% +0.3% -5.9% -0.2%
YoY changes on a comparative basis*
-1.7% -0.1% -0.7% +5.5% +1.4% +1.4% -2.2% -2.4% -3.4% -8.3% -4.1%
Developing markets677.4 163.2 175.9 149.1 196.5 684.7 136.2 142.9 145.2 200.2 624.5 130.8 149.4 147.6 198.3 626.1
Net Sales
YoY actual changes +1.3% -16.5% -18.7% -2.6% +1.9% -8.8% -4.0% +4.6% +1.7% -1.0% +0.3%
YoY changes on a comparative basis*
+2.2% -3.8% -8.5% +7.1% +10.7% +1.5% -5.8% +0.3% -2.9% -3.8% -3.1%
* see glossary

STATIONERY
27
Restated for IFRS 15Restated for IAS 29
In million euros FY 17 Q1 17 Q2 17 Q3 17 Q4 17 FY 17 Q1 18 Q2 18 Q3 18 Q4 18 FY 18 Q1 19 Q2 19 Q3 19 Q4 FY 19
Net Sales 791.8 165.5 267.8 194.6 176.3 804.2 151.8 249.5 200.2 170.4 771.9 148.3 252.5 204.3 169.3 774.4
YoY actual changes +1.5% -8.3% -6.8% +2.9% -3.3% -4.0% -2.3% +1.2% +2.0% -0.6% +0.3%
YoY changes on a constant currencies basis*
+2.3% 0.0% -1.7% +6.7% +0.6% +1.2% -1.8% -0.6% +0.1% +0.1% -0.5%
YoY changes on a comparative basis*
+3.4% +2.0% -1.4% +6.8% +0.6% +1.7% -5.8% -2.3% -1.7% -4.8% -3.4%
IFO 54.9 0.6 35.4 6.7 12.0 54.7 9.6 -31.3 10.3 -2.6 -14.1 1.8 21.9 12.6 -43.1 -6.7
Normalized IFO* 66.5 6.0 41.6 6.7 12.0 66.3 9.6 37.4 10.4 5.4 62.8 1.8 32.3 14.5 -0.9 47.8
IFO margin 6.9% 0.3% 13.2% 3.4% 6.8% 6.8% 6.3% -12.6% 5.1% -1.5% -1.8% 1.2% 8.7% 6.2% -25.4% -0.9%
Normalized IFO margin* 8.4% 3.6% 15.5% 3.5% 6.8% 8.3% 6.3% 15.0% 5.2% 3.2% 8.1% 1.2% 12.8% 7.1% -0.5% 6.2%
* see glossary

LIGHTERS
28
Restated for IFRS 15Restated for IAS
29
In million euros FY 17 Q1 17 Q2 17 Q3 17 Q4 17 FY 17 Q1 18 Q2 18 Q3 18 Q4 18 FY 18 Q1 19 Q2 19 Q3 19 Q4 FY 19
Net Sales 703.9 172.2 186.4 159.2 189.6 707.4 152.7 165.0 163.8 204.3 685.8 149.7 169.9 161.9 197.4 679.0
YoY actual changes +1.1% -11.3% -11.5% +2.8% +7.7% -3.1% -2.0% +3.0% -1.1% -3.4% -1.0%
YoY changes on a constant currency basis*
+2.0% -0.7% -4.5% +5.8% +9.0% +2.4% -4.7% +0.7% -3.9% -4.5% -3.1%
YoY changes on a comparative basis*
+2.2% -0.5% -4.5% +5.8% +9.0% +2.4% -5.5% -0.1% -4.2% -4.9% -3.7%
IFO 278.0 63.8 77.0 64.7 71.8 277.3 54.5 63.3 58.3 66.5 242.5 46.6 49.3 52.6 69.2 217.7
Normalized IFO* 278.3 64.0 77.0 64.7 71.8 277.6 54.5 63.3 58.3 70.9 247.0 46.6 58.7 54.3 72.5 232.1
IFO margin 39.5% 37.0% 41.3% 40.6% 37.9% 39.2% 35.7% 38.4% 35.6% 32.5% 35.4% 31.1% 29.0% 32.5% 35.1% 32.1%
Normalized IFO margin* 39.5% 37.2% 41.3% 40.7% 37.9% 39.2% 35.7% 38.4% 35.6% 34.7% 36.0% 31.1% 34.5% 33.5% 36.7% 34.2%
* see glossary

SHAVERS
29* see glossary
Restated for IFRS 15
Restated for IAS 29
In million euros FY 17 Q1 17 Q2 17 Q3 17 Q4 17 FY 17 Q1 18 Q2 18 Q3 18 Q4 18 FY 18 Q1 19 Q2 19 Q3 19 Q4 FY 19
Net Sales 454.4 115.3 123.4 104.2 116.5 459.4 97.0 113.5 104.4 123.1 438.0 109.0 115.5 114.9 123.5 463.0
YoY actual changes -2.7% -15.9% -8.0% +0.2% +5.7% -4.7% +12.4% +1.8% +10.1% +0.4% +5.7%
YoY change on a constant currency basis*
-2.2% -6.0% -0.3% +4.1% +9.2% +1.7% +11.3% +0.8% +7.4% -0.2% +4.4%
YoY change on a comparable basis*
-2.2% -6.0% -0.3% +4.1% +9.2% +1.7% +10.0% -0.7% +7.0% -1.6% +3.2%
IFO 60.4 14.0 17.2 13.9 14.7 59.8 7.7 16.9 10.4 8.8 43.7 7.7 1.6 19.6 18.3 47.2
Normalized IFO* 60.6 14.1 17.2 14.0 14.7 60.0 7.7 16.9 10.5 10.3 45.4 7.7 8.4 20.8 19.3 56.2
IFO margin 13.3% 12.2% 13.9% 13.3% 12.6% 13.0% 7.9% 14.9% 9.9% 7.1% 10.0% 7.1% 1.4% 17.0% 14.8% 10.2%
Normalized IFO margin* 13.3% 12.3% 14.0% 13.4% 12.6% 13.1% 7.9% 14.9% 10.1% 8.4% 10.4% 7.1% 7.3% 18.1% 15.6% 12.1%

OTHER PRODUCTS
30
Restated for IFRS 15
In million euros FY 17 Q1 17 Q2 17 Q3 17 Q4 17 FY 17 Q1 18 Q2 18 Q3 18 Q4 18 FY 18 Q1 19 Q2 19 Q3 19 Q4 FY 19
Net Sales 70.2 20.2 21.5 13.7 15.0 70.4 13.8 15.9 11.1 13.2 54.0 8.3 7.0 6.9 10.9 33.1
YoY actual changes -14.5% -31.4% -25.8% -19.2% -12.3% -23.3% -40.0% -56.3% -37.8% -16.9% -38.7%
YoY changes on a constant currency basis*
-14.6% -29.5% -24.2% -18.5% -11.8% -22.0% -39.8% -56.2% -37.8% -16.7% -38.6%
YoY changes on a comparative basis*
-5.5% -14.0% -6.9% -14.7% -11.8% -11.6% -5.4% -4.3% +11.4% +4.5% +1.2%
IFO* -17.0 -4.3 -10.1 -2.2 -0.4 -17.0 -2.2 1.2 -2.2 -10.2 -13.4 -1.6 -1.3 -1.7 -0.9 -5.5
Normalized IFO* -4.4 -3.0 1.2 -2.2 -0.4 -4.4 -2.2 1.2 -2.2 0.4 -2.8 -1.6 -0.9 -1.6 -0.2 -4.3

FY 2019 NET SALES MAIN EXCHANGE RATE EVOLUTION VS. EURO
31
% of sales
Average rates
% of changeFY 2018 FY 2019
US Dollar 38% 1.18 1.12 5.48%
Brazilian Real 8% 4.31 4.41 -2.30%
Mexican Peso 6% 22.73 21.55 5.47%
Argentina Peso 1% 33.08 53.81 -38.52%
Canadian dollar 3% 1.53 1.49 3.03%
Australian dollar 2% 1.58 1.61 -1.91%
South African Zar 2% 15.60 16.16 -3.46%
Indian Rupee 3% 80.71 78.83 2.39%
Non Euro European countries 8%
Sweden 10.26 10.59 -3.11%
Russia 74.02 72.42 2.21%
Poland 4.26 4.30 -0.80%
British Pound 0.88 0.88 0.87%
% of sales
Average rates
% of changeQ4 2018 Q4 2019
US Dollar 35% 1.14 1.11 3.06%
Brazilian Real 12% 4.35 4.56 -4.70%
Mexican Peso 5% 22.66 21.33 6.25%
Argentina Peso 2% 42.38 65.59 -35.39%
Canadian dollar 3% 1.51 1.46 3.13%
Australian dollar 2% 1.59 1.62 -1.95%
South African Zar 3% 16.26 16.29 -0.18%
Indian Rupee 4% 82.15 78.86 4.18%
Non Euro European countries 7%
Sweden 10.31 10.64 -3.07%
Russia 75.95 70.54 7.67%
Poland 4.30 4.29 0.26%
British Pound 0.89 0.86 3.16%
CAPITAL AND VOTING RIGHTS
32
As of December 31, 2019, the total number of issued shares of SOCIÉTÉ BIC was 45,532,240 shares, representing:
67,035,094 voting rights,66,494,526 voting rights excluding shares without voting rights.
Total number of treasury shares held at the end of December 2019: 540,568.

GLOSSARY
33
Constant currency basis Constant currency figures are calculated by translating the current year figures at prior year monthly average exchange rates.
Organic growth At constant currencies and constant perimeter. Figures at constant perimeter exclude or Comparative basis the impacts of acquisitions and/or disposals that occurred during the current year
and/or during the previous year, until their anniversary date. All Net Sales category comments are made on a comparative basis. Organic change excludes Argentina Net Sales for both 2018 and 2019.
Gross profit Is the margin that the Group realizes after deducting its manufacturing costs.
Normalized IFO Normalized means excluding non-recurring items as detailed on page 3.
Normalized IFO margin Normalized IFO as a percentage of Net Sales.
Net cash from operating activities Principal revenue-generating activities of the entity and other activities that are not investing or financing activities.
Net cash position = Cash and cash equivalents + Other current financial assets - Current borrowings - Non-current borrowings (except financial liabilities following IFRS 16 implementation).

DISCLAIMER
34
This document contains forward-looking statements. Although BIC believes its estimates are based on reasonable assumptions, these statements are subject to numerous risks and uncertainties.
A description of the risks borne by BIC appears in section “Risks” of BIC “Registration Document” filed with the French financial markets authority (AMF) on March 20, 2019.