Full year 2018 and q4 2018 results
17
1 12 MARCH 2019 FULL YEAR 2018 RESULTS TELECONFERENCE
Transcript of Full year 2018 and q4 2018 results

1
1 2 M A R C H 2 0 1 9
FULL YEAR 2018 RESULTS
TELECONFERENCE

2
SAFE HARBOR STATEMENT
Matters discussed in this release may constitute forward-looking statements. Forward-looking
statements reflect our current views with respect to future events and financial performance and
may include statements concerning plans, objectives, goals, strategies, future events or
performance, and underlying assumptions and statements other than statements of historical
facts. The words “believe,” “anticipate,” “intend,” “estimate,” “forecast,” “project,” “plan,”
“potential,” “may,” “should,” “expect,” “pending” and similar expressions generally identify
forward-looking statements.
The forward-looking statements in this release are based upon various assumptions, many of
which are based, in turn, upon further assumptions, including without limitation, management’s
examination of historical operating trends, data contained in our records and other data
available from third parties. Although the Company believes that these assumptions were
reasonable when made, because these assumptions are inherently subject to significant
uncertainties and contingencies that are difficult or impossible to predict and are beyond our
control, the Company cannot guarantee that it will achieve or accomplish these expectations,
beliefs or projections.
Important factors that, in our view, could cause actual results to differ materially from those
discussed in the forward- looking statements include the strength of the world economy and
currencies, changes in charter hire rates and vessel values, changes in demand for “ton miles”
of oil carried by oil tankers, the effect of changes in OPEC’s petroleum production levels and
worldwide oil consumption and storage, changes in demand that may affect attitudes of time
charterers to scheduled and unscheduled dry-docking, changes in TORM’s operating expenses,
including bunker prices, dry-docking and insurance costs, changes in the regulation of shipping
operations, including requirements for double hull tankers or actions taken by regulatory
authorities, potential liability from pending or future litigation, domestic and international political
conditions, potential disruption of shipping routes due to accidents, political events or acts by
terrorists.
In light of these risks and uncertainties, you should not place undue reliance on forward-looking
statements contained in this release because they are statements about events that are not
certain to occur as described or at all. These forward-looking statements are not guarantees of
our future performance, and actual results and future developments may vary materially from
those projected in the forward-looking statements.
Except to the extent required by applicable law or regulation, the Company undertakes no
obligation to release publicly any revisions to these forward-looking statements to reflect events
or circumstances after the date of this release or to reflect the occurrence of unanticipated
events.

3
Jacob Meldgaard
▪ Executive Director in TORM plc
▪ CEO of TORM A/S since April 2010
▪ Board member of Danish Ship Finance
▪ Previously Executive Vice President of the Danish shipping company NORDEN
▪ Prior to that he held various positions with J. Lauritzen and A.P. Møller-Mærsk
▪ More than 25 years of shipping experience
TODAY’S PRESENTERS
Christian Søgaard-Christensen
▪ CFO of TORM A/S
▪ Prior to that with McKinsey & Co
▪ 10+ years in transportation

4
Product tanker
market
Sales &
Purchase
• Sale of four older vessels, two MR and two Handysize vessels for a total consideration of USD 27m
• TORM has taken delivery of four LR2 newbuildings during 2018
• During 2018, TORM executed three newbuilding options for three MR vessels, and the remaining newbuilding program covers two
LR1 and seven MR vessels
• USD +300m of funding secured in 2018 through a combination of debt and equity supporting fleet growth and renewal
Results
FULL-YEAR 2018 HIGHLIGHTS
• EBITDA for 2018 was USD 121m and the result before tax a loss of USD 33m
• RoIC for the period was 0.1% and loss per share was 48 US cents
• Net Asset Value estimated at USD 856m as of 30 December 2018, corresponding to a NAV/share of USD 11.6 or DKK 76
• Net Loan-to-Value of 53% and available liquidity of USD 406m as of 31 December 2018
• TORM’s fleet including vessels on order had a market value of USD 1,675m as of 31 December 2018
• Freight rates worsened throughout the first three quarters of 2018, but the year ended with a significant market recovery
• TORM obtained average TCE freight rates of USD/day 12,982 in 2018
• As of 5 March 2019, 85% of the total earning days were covered at USD/day 18,522 for first the quarter of 2019, and 24% of the
total earning days in 2019 were covered at USD/day 18,193
Scrubber
update
• TORM established the JV, ME Production China, with ME Production and GSI
• TORM has committed to 21 scrubbers and signed a letter of intent for an additional 18 scrubbers
• One newbuilding delivered with scrubber and one retrofit installation conducted to gain operational experience in advance of the
2020 deadline

5
TORM HAS ENTERED INTO A SCRUBBER JV TO PRODUCE AND SELL SCRUBBERS
• One of the largest risks with scrubber installations is the potential delay due
to lack of quality and experienced manufacturers
• Yard and production capacity is slowly being tied up due to significant order
surge in scrubbers in recent months
• Retrofit capacity is beginning to become a bottleneck which increases the
risk of extended installation time
Part of one of the largest shipyards groups
Ownership share: 27.5%
Leading scrubber manufacturer
• Secure scrubber production slots with ME Production and the
possibility to add additional scrubber retrofit vessels later to the
production list
• Secure capacity and closer relationship with a long-standing partner
• Local production in China in cooperation with a Chinese state-owned
company will improve access to repair yards that will carry out the
retrofit installations
• Potential economic benefit from participating in JV
MEProduction
China
Risks to ship owners JV rationale

6Source: Clarksons. Spot earnings: LR2: TC1 Ras Tanura-> Chiba, MR: average basket of Rotterdam->NY, Bombay->Chiba, Mina Al Ahmadi->Rotterdam, Amsterdam->Lome, Houston->Rio de Janeiro, Singapore->Sydney.
STRONG MARKET RECOVERY IN Q4 2018 FOLLOWING TOUGH HEADWINDS
Solid trade volumes but shorter trading distances and
cannibalization from crude newbuildings on maiden
voyages in the Eastern markets
Consistent inventory draws reduce transported volumes
Higher oil prices and weaker currencies in
emerging market economies negatively
impact oil demand and trading volumes
Crude cannibalization continues
~12% of clean trading LR2s
moving to the dirty market
Limited crude cannibalization
Opening-up of all most important
clean arbitrage windows
USD/day
Arbitrage windows remain
open and generally healthy
trade patterns
Commencement of refinery
maintenance period in
Europe/US and Middle East
Increased cannibalization from
newbuilt crude tankers
2018 2019

7Note: Includes countries for which November 2018 data is available. These account for approximately 86% of global visible CPP (naphtha, gasoline, jet/kero, diesel/gasoil) stocks.Source: JODI, TORM.
PRODUCT INVENTORIES BACK TO NORMAL LEVELS
Billion bbl
Aggregated global CPP inventories*
• Global CPP inventories are back to 5-year average levels
• Before a seasonal build-up in Q3, global CPP stocks drew during 1H 2018 by a volume equivalent to a loss of potential trade of
~4% each month
• Diesel inventories in main import areas continue to be below historical average levels, indicating a potential future inventory build-
up
• Abundant gasoline inventories in main import areas potentially limiting trade

8Source: WoodMackenzie, TORM.
MIDDLE EAST REFINERY CAPACITY ADDITIONS CONTINUE AND INCREASE TO LEVELS COMPARABLE TO 2015
Middle East refinery capacity net additions (M b/d)
0.120.12
2016 2020F2017 2019F2018
-0.03
0.58
0.70
0.82
2015
Forecasted Realized
• As oil product demand increases, the ton-mile demand is positively impacted by increasing geographic dislocations between the
demand for and supply of clean petroleum products (CPP)
• Middle East refinery capacity additions are expected to accelerate in 2019 and 2020, placing a renewed pressure on less
competitive refineries in e.g. Europe and subsequently leading to increased CPP movements across regions

9* Compliant fuels include distillates (MGO), 0.5% sulfur fuel oil blends, desulfurized residual fuel oil, blended VGO streams for ULSFO production.Source: TORM.
IMO 2020 SULFUR CAP WILL POTENTIALLY LEAD TO ~5% INCREMENTAL GROWTH IN THE PRODUCT TANKER TRADE
Global consumption of marine bunkers*
M b/d
Potential new trade for
clean product tankers
2
3
0
1
5
4
6
2017 2020
Distillates (CPP) ULSFO (DPP)
Compliant fuels* (CPP, DPP) HSFO (DPP)
Potential new trade for
clean product tankers
• From 1 January 2020, up to 2 mb/d of HSFO potentially shifting to MGO or other 0.5% sulfur fuels, leading to increased inter- and
intra-regional product tanker trade
• TORM expects the IMO 2020 regulation to lead to around 5% incremental growth in the product tanker trade, subject to a
downside in case of higher availability of low sulfur fuel oils from the refinery sector
• The effects are likely to start emerging already in 2H 2019
• Temporary capacity reduction expected due to increased off-hire time in connection with preparations for the IMO 2020, estimated
at around 0.6% of total fleet capacity

10Note: These calculations are based on the known order book and TORM’s estimates for additional ordering and scrapping in line with historical average activity.Source: TORM.
PRODUCT TANKER ORDER BOOK CONTINUES TO SHRINK
Product tanker order book as percentage of the fleet
M dwt
• Product tanker order book to fleet ratio at a historical low level of 8.5% (11% for MRs, 4% for LR1s and 10% for LR2s)
• In 2018, the product tanker fleet grew by 2.4% (vs. 4.5% in 2017 and 6.5% in 2016)
• TORM conservatively estimates that the product tanker fleet will grow by an average of ~3.3% p.a. in the period 2019-2021,
excluding any potential acceleration of scrapping in advance of new regulations*

11
Note: Peer group is based on Ardmore, d’Amico (composite of LR1, MR and Handy), Frontline 2012, Hafnia Tankers, NORDEN, Maersk Tankers, Teekay Tankers, Scorpio and International Seaways.For Q4 2018, the peer group only consists of Scorpio Tankers, Ardmore and NORDEN. Earning releases from other peers are pending.* TORM premium calculation is based on a TORM MR fleet of 50 vessels earning TORM’s TCE rate compared to the peer average.
TORM COMMERCIALLY OUTPERFORMS PEERS IN ITS KEY MR SEGMENT
Q4 2018 performance:
• TORM: USD/day 13,933
• Peer average: USD/day 13,344
FY 2015: USD 28m FY 2016: USD 14m FY 2017: USD 35m FY 2018: USD 18m
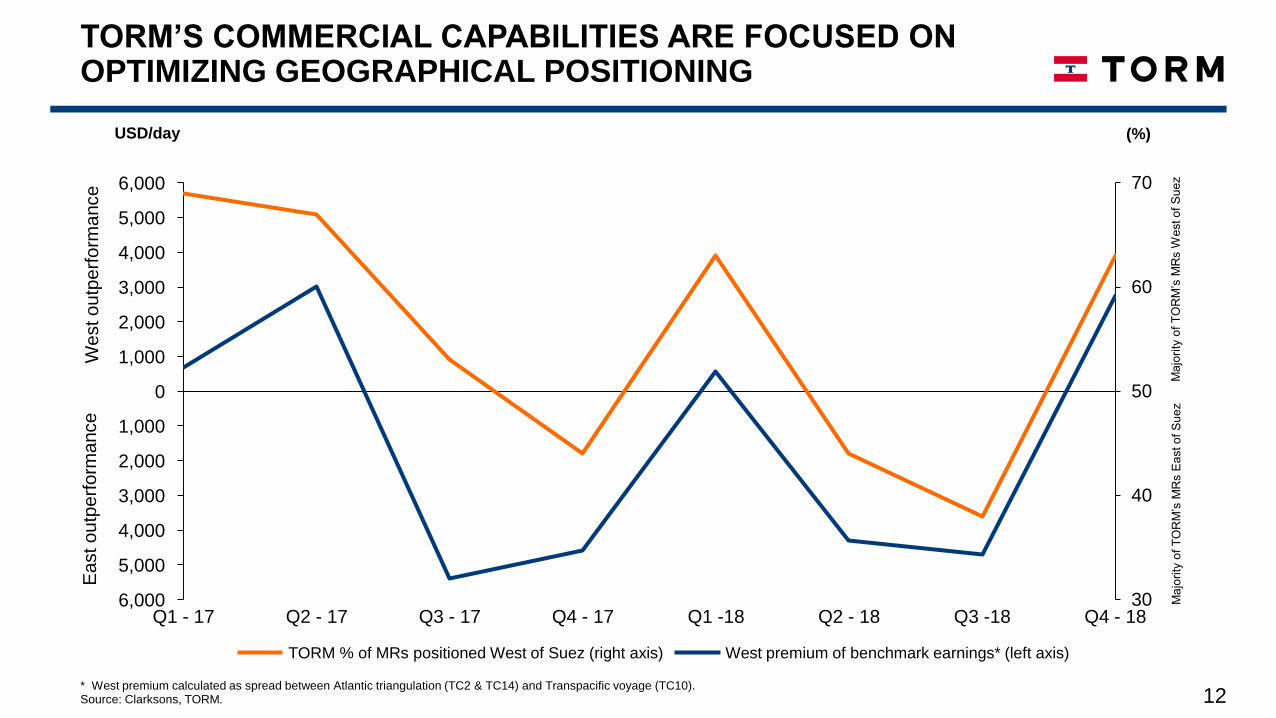
12* West premium calculated as spread between Atlantic triangulation (TC2 & TC14) and Transpacific voyage (TC10).Source: Clarksons, TORM.
TORM’S COMMERCIAL CAPABILITIES ARE FOCUSED ON OPTIMIZING GEOGRAPHICAL POSITIONING
We
st o
utp
erf
orm
ance
East outp
erf
orm
ance
30
40
50
60
70
0
6,000
4,000
3,000
1,000
2,000
5,000
1,000
2,000
3,000
4,000
5,000
6,000
Q1 -18Q1 - 17 Q2 - 17 Q3 - 17 Q4 - 17 Q2 - 18 Q3 -18 Q4 - 18
TORM % of MRs positioned West of Suez (right axis) West premium of benchmark earnings* (left axis)
USD/day (%)
Ma
jori
ty o
f T
OR
M’s
MR
s W
est o
f S
ue
zM
ajo
rity
of
TO
RM
’s M
Rs E
ast o
f S
ue
z

13
SPOT ORIENTATION PROVIDES SIGNIFICANT OPERATING LEVERAGE
3,036
3,592
2019
2,359
17,462
1,696 1,815
20,147
3,242
1,795
2020
4,24224,553 (90%)3,271
20,403
2021
28,776 (98%) 29,731 (100%)
Illustrative change in cash flow generation potential for the TORM fleet
Change in average TCE/day 2019 2020 2021
+/- USD 1,000 24.6 28.8 29.7
+/- USD 2,500 61.4 71.9 74.3
+/- USD 5,000 122.8 143.9 148.7
Unfixed days
# of days as of 31 December 2018(% of total days)
LR2 HandyLR1 MR
• As of 31 December 2018, 10% of the total earning days in 2019 were covered at USD/day 17,306.
• As of 5 March 2019, 85% of the total earning days were covered at USD/day 18,522 for the first quarter of 2019. 24% of the total
earning days in 2019 were covered at USD/day 18,193.

14* Pro forma figures for 2015 presented as though the Restructuring occurred as of 1 January 2015 and include the combined TORM and Njord fleet.
FULLY INTEGRATED BUSINESS MODEL WITH COMPETITIVE COST STRUCTURE
0 2 4 6 8 10 12 14 16 18 20 22 24
2008
2013
2011
2009
2018
2010
2012
2014
*2015
2016
2017
-47%
• TORM’s operational platform handles commercial and technical operations in-house
• The integrated One TORM business model provides TORM with the highest possible trading flexibility and
earning power
• Outsourced technical and commercial management would affect other line items of the P&L
Admin. expenses (quarterly avg. in USDm)
2014 20162015* 2017
6,771
2018
6,389
7,6557,193
6,673
-17%
OPEX per day (yearly, weighted avg. in USD/day)
Significant reduction in OPEX TORM has trimmed administration expenses
TORM operates a fully integrated commercial and technical platform
TORM has reduced
the cost base of
approx. USD 40m
per annum since
2014 with an OPEX
per day reduction of
USD/day 1,266
while at the same
time reducing Admin
by USD 4m
15
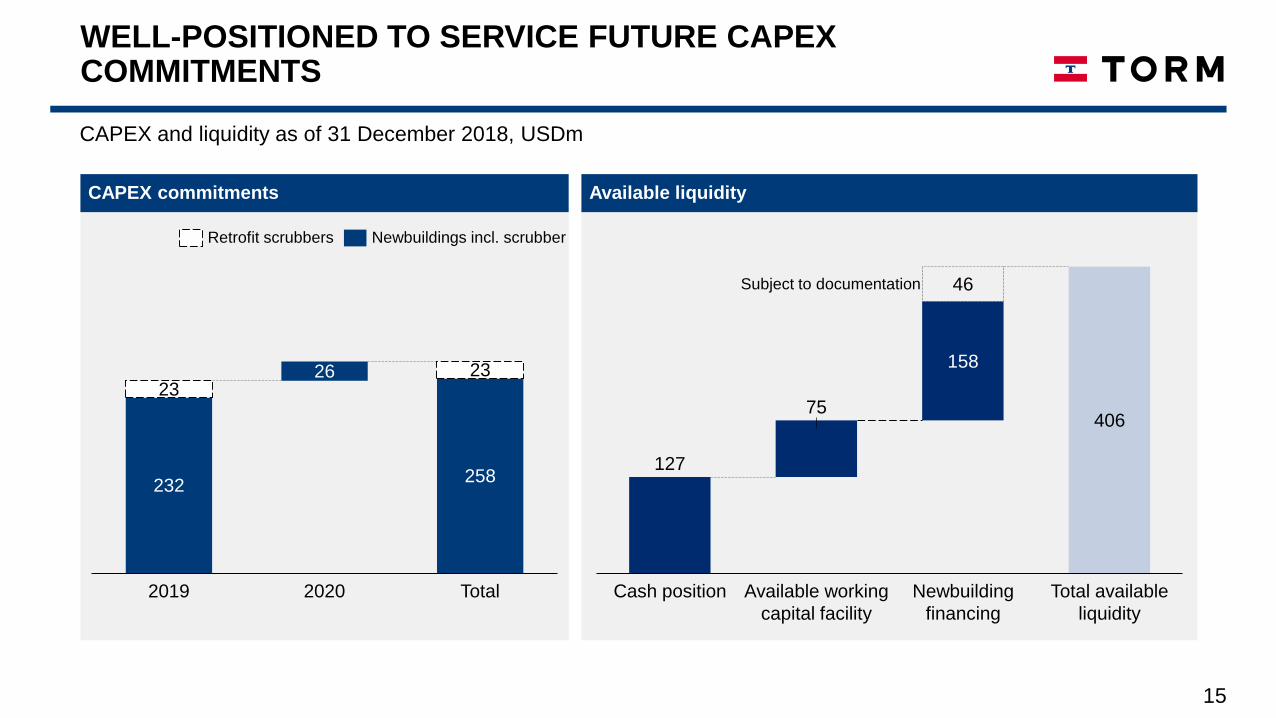
WELL-POSITIONED TO SERVICE FUTURE CAPEX COMMITMENTS
CAPEX commitments Available liquidity
232258
2326 23
2019 2020 Total
127
40675
158
46
Cash position Available working
capital facility
Total available
liquidity
Newbuilding
financing
Retrofit scrubbers Newbuildings incl. scrubber
CAPEX and liquidity as of 31 December 2018, USDm
Subject to documentation

16** Other includes Other plant and operating equipment and total financial assets** Calculated based on 74,218,846 shares and USD/DKK FX rate of 6.31
NET ASSET VALUE ESTIMATED AT USD 856M
Net LTV of 53%
856
755
258127
63
Value of vessels (incl. newbuildings)
Outstanding debt Committed CAPEX
3
Cash Working Capital Other*
1,675
Net Asset Value
31 December 2018 figures, USDm
• Net Loan-to-Value was 53% ensuring a strong capital structure
• Net Asset Value (NAV) was estimated at USD 856m (USD 11.6/DKK 75.5 per share)
• Market cap as of 31 December 2018 was USD 516m, or DKK 43.85 per share**

17