Full wwPDB X-ray Structure Validation Report iftp.wwpdb.org/.../ww/2ww8/2ww8_full_validation.pdf ·...
17
Full wwPDB X-ray Structure Validation Report i ○ Mar 13, 2018 – 01:38 pm GMT PDB ID : 2WW8 Title : Structure of the pilus adhesin (RrgA) from Streptococcus pneumoniae Authors : Izore, T.; Contreras-Martel, C.; El-Mortaji, L.; Manzano, C.; Terrasse, R.; Vernet, T.; Di-Guilmi, A.M.; Dessen, A. Deposited on : 2009-10-22 Resolution : 1.90 Å(reported) This is a Full wwPDB X-ray Structure Validation Report for a publicly released PDB entry. We welcome your comments at [email protected] A user guide is available at https://www.wwpdb.org/validation/2017/XrayValidationReportHelp with specific help available everywhere you see the i ○ symbol. The following versions of software and data (see references i ○) were used in the production of this report: MolProbity : 4.02b-467 Mogul : 1.7.3 (157068), CSD as539be (2018) Xtriage (Phenix) : 1.13 EDS : trunk31020 Percentile statistics : 20171227.v01 (using entries in the PDB archive December 27th 2017) Refmac : 5.8.0158 CCP4 : 7.0 (Gargrove) Ideal geometry (proteins) : Engh & Huber (2001) Ideal geometry (DNA, RNA) : Parkinson et al. (1996) Validation Pipeline (wwPDB-VP) : trunk31020
Transcript of Full wwPDB X-ray Structure Validation Report iftp.wwpdb.org/.../ww/2ww8/2ww8_full_validation.pdf ·...

Full wwPDB X-ray Structure Validation Report i○
Mar 13, 2018 – 01:38 pm GMT
PDB ID : 2WW8Title : Structure of the pilus adhesin (RrgA) from Streptococcus pneumoniae
Authors : Izore, T.; Contreras-Martel, C.; El-Mortaji, L.; Manzano, C.; Terrasse, R.;Vernet, T.; Di-Guilmi, A.M.; Dessen, A.
Deposited on : 2009-10-22Resolution : 1.90 Å(reported)
This is a Full wwPDB X-ray Structure Validation Report for a publicly released PDB entry.
We welcome your comments at [email protected] user guide is available at
https://www.wwpdb.org/validation/2017/XrayValidationReportHelpwith specific help available everywhere you see the i○ symbol.
The following versions of software and data (see references i○) were used in the production of this report:
MolProbity : 4.02b-467Mogul : 1.7.3 (157068), CSD as539be (2018)
Xtriage (Phenix) : 1.13EDS : trunk31020
Percentile statistics : 20171227.v01 (using entries in the PDB archive December 27th 2017)Refmac : 5.8.0158CCP4 : 7.0 (Gargrove)
Ideal geometry (proteins) : Engh & Huber (2001)Ideal geometry (DNA, RNA) : Parkinson et al. (1996)
Validation Pipeline (wwPDB-VP) : trunk31020
Page 2 Full wwPDB X-ray Structure Validation Report 2WW8
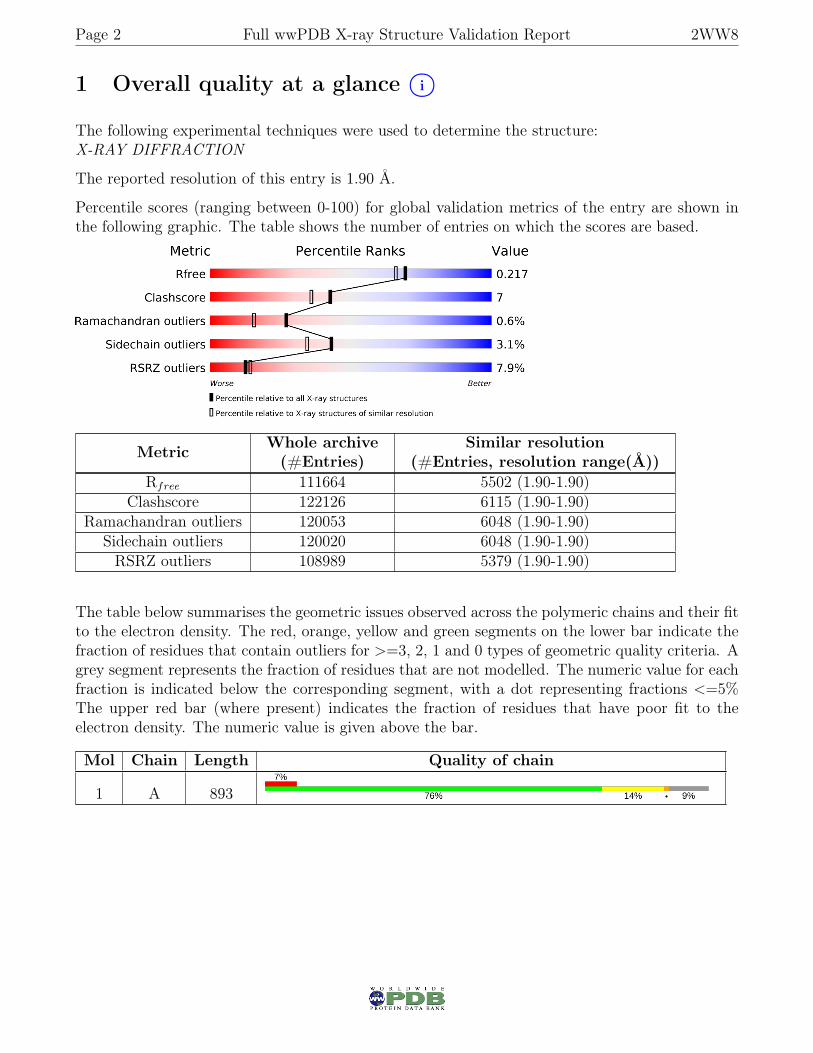
1 Overall quality at a glance i○
The following experimental techniques were used to determine the structure:X-RAY DIFFRACTION
The reported resolution of this entry is 1.90 Å.
Percentile scores (ranging between 0-100) for global validation metrics of the entry are shown inthe following graphic. The table shows the number of entries on which the scores are based.
Metric Whole archive(#Entries)
Similar resolution(#Entries, resolution range(Å))
Rfree 111664 5502 (1.90-1.90)Clashscore 122126 6115 (1.90-1.90)
Ramachandran outliers 120053 6048 (1.90-1.90)Sidechain outliers 120020 6048 (1.90-1.90)RSRZ outliers 108989 5379 (1.90-1.90)
The table below summarises the geometric issues observed across the polymeric chains and their fitto the electron density. The red, orange, yellow and green segments on the lower bar indicate thefraction of residues that contain outliers for >=3, 2, 1 and 0 types of geometric quality criteria. Agrey segment represents the fraction of residues that are not modelled. The numeric value for eachfraction is indicated below the corresponding segment, with a dot representing fractions <=5%The upper red bar (where present) indicates the fraction of residues that have poor fit to theelectron density. The numeric value is given above the bar.
Mol Chain Length Quality of chain
1 A 893
Page 3 Full wwPDB X-ray Structure Validation Report 2WW8
2 Entry composition i○
There are 5 unique types of molecules in this entry. The entry contains 7294 atoms, of which 0are hydrogens and 0 are deuteriums.
In the tables below, the ZeroOcc column contains the number of atoms modelled with zero occu-pancy, the AltConf column contains the number of residues with at least one atom in alternateconformation and the Trace column contains the number of residues modelled with at most 2atoms.
• Molecule 1 is a protein called CELL WALL SURFACE ANCHOR FAMILY PROTEIN.
Mol Chain Residues Atoms ZeroOcc AltConf Trace
1 A 815 Total C N O S6453 4052 1094 1298 9 0 7 0
• Molecule 2 is MAGNESIUM ION (three-letter code: MG) (formula: Mg).
Mol Chain Residues Atoms ZeroOcc AltConf
2 A 1 Total Mg1 1 0 0
• Molecule 3 is CALCIUM ION (three-letter code: CA) (formula: Ca).
Mol Chain Residues Atoms ZeroOcc AltConf
3 A 2 Total Ca2 2 0 0
• Molecule 4 is 4-(2-HYDROXYETHYL)-1-PIPERAZINE ETHANESULFONIC ACID(three-letter code: EPE) (formula: C8H18N2O4S).

Page 4 Full wwPDB X-ray Structure Validation Report 2WW8
Mol Chain Residues Atoms ZeroOcc AltConf
4 A 1 Total C N O S15 8 2 4 1 0 0
4 A 1 Total C N O S15 8 2 4 1 0 0
• Molecule 5 is water.
Mol Chain Residues Atoms ZeroOcc AltConf
5 A 808 Total O808 808 0 0
Page 5 Full wwPDB X-ray Structure Validation Report 2WW8
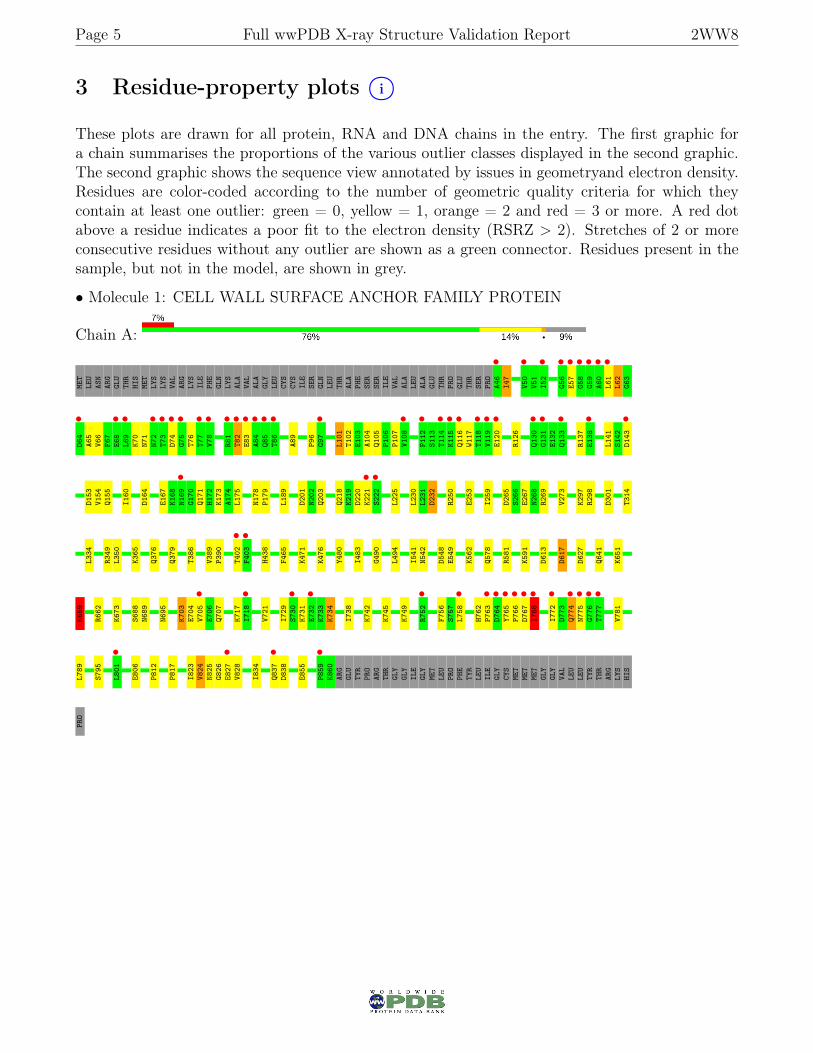
3 Residue-property plots i○
These plots are drawn for all protein, RNA and DNA chains in the entry. The first graphic fora chain summarises the proportions of the various outlier classes displayed in the second graphic.The second graphic shows the sequence view annotated by issues in geometryand electron density.Residues are color-coded according to the number of geometric quality criteria for which theycontain at least one outlier: green = 0, yellow = 1, orange = 2 and red = 3 or more. A red dotabove a residue indicates a poor fit to the electron density (RSRZ > 2). Stretches of 2 or moreconsecutive residues without any outlier are shown as a green connector. Residues present in thesample, but not in the model, are shown in grey.
• Molecule 1: CELL WALL SURFACE ANCHOR FAMILY PROTEIN
Chain A:
MET
LEU
ASN
ARG
GLU
THR
HIS
MET
LYS
LYS
VAL
ARG
LYS
ILE
PHE
GLN
LYS
ALA
VAL
ALA
GLY
LEU
CYS
CYS
ILE
SER
GLN
LEU
THR
ALA
PHE
SER
SER
ILE
VAL
ALA
LEU
ALA
GLU
THR
PRO
GLU
THR
SER
PRO
A46•
I47
V50•
V51
I52•
G56•
E57•
G58•
G59•
A60•
L61•
L62
G63
D64•
A65
V66
F67
E68•
L69•
K70
N71
N72•
T73•
D74•
G75•
T76
T77•
V78•
R81•
T82•
E83•
A84•
Q85•
T86•
A89
P96
G97•
L101
T102
E103
A104
Q105
P106
P107
V108•
P112•
S113
T114•
K115•
Q116•
W117
T118•
V119•
E120•
R126
Q130•
G131•
E132
Q133•
R137
E138•
L141
S142
D143•
D153
V154
Q155
I160
D164
E167
K168
N169•
G170
Q171
H172
K173
A174
L175
N178
P179
L189
D201
N202
Q203
Q218
K219
D220
K221•
S222•
L225
L230
L231
D232
R250
E253
I259
D265
S266
E267
N268
R269
V273
K297
R298
D301
T314
L334
R349
L350
K365
Q376
Q379
T386
V389
P390
T402•
F403•
H438
F465
K471
K476
Y480
I483
G490
L494
I541
N542
D548
E549
K562
Q578
R581
K591
D613
D617
D627
Q641
K651
K659
R662
K673
S688
N689
N695
K703
E704
V705•
E706
Q707
K717
I718•
V721
I729
S730•
K731
E732•
K733
K734
I738
K742
K745
K749
R752•
F756
S757
L758•
H762
P763•
D764•
Y765•
P766•
D767•
I768•
I772•
D773
Q774•
N775•
G776•
T777•
V781
L789
S795
L801•
E806
P812
P817
I823
V824
N825
G826
E827•
V828
I834
Q837•
D838
E855
P859•
K860
ARG
GLU
TYR
PRO
ARG
THR
GLY
GLY
ILE
GLY
MET
LEU
PRO
PHE
TYR
LEU
ILE
GLY
CYS
MET
MET
MET
GLY
GLY
VAL
LEU
LEU
TYR
THR
ARG
LYS
HIS
PRO
Page 6 Full wwPDB X-ray Structure Validation Report 2WW8
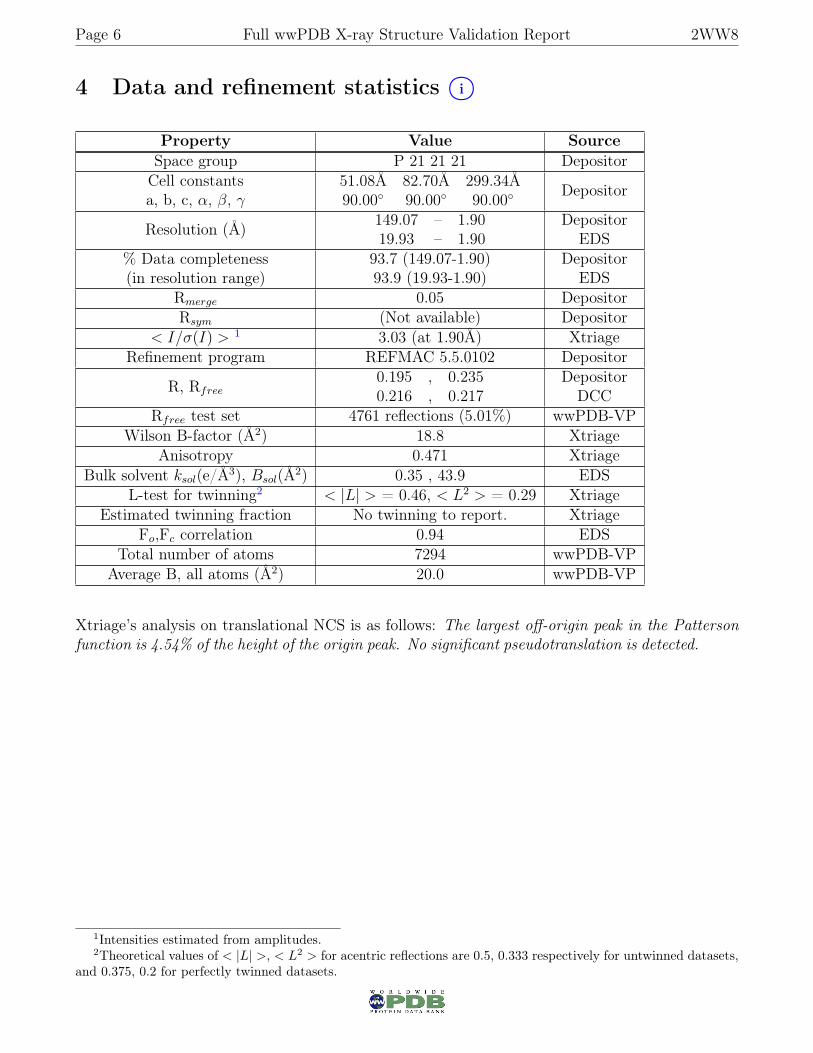
4 Data and refinement statistics i○
Property Value SourceSpace group P 21 21 21 DepositorCell constantsa, b, c, α, β, γ
51.08Å 82.70Å 299.34Å90.00◦ 90.00◦ 90.00◦ Depositor
Resolution (Å) 149.07 – 1.9019.93 – 1.90
DepositorEDS
% Data completeness(in resolution range)
93.7 (149.07-1.90)93.9 (19.93-1.90)
DepositorEDS
Rmerge 0.05 DepositorRsym (Not available) Depositor
< I/σ(I) > 1 3.03 (at 1.90Å) XtriageRefinement program REFMAC 5.5.0102 Depositor
R, Rfree0.195 , 0.2350.216 , 0.217
DepositorDCC
Rfree test set 4761 reflections (5.01%) wwPDB-VPWilson B-factor (Å2) 18.8 Xtriage
Anisotropy 0.471 XtriageBulk solvent ksol(e/Å3), Bsol(Å2) 0.35 , 43.9 EDS
L-test for twinning2 < |L| > = 0.46, < L2 > = 0.29 XtriageEstimated twinning fraction No twinning to report. Xtriage
Fo,Fc correlation 0.94 EDSTotal number of atoms 7294 wwPDB-VP
Average B, all atoms (Å2) 20.0 wwPDB-VP
Xtriage’s analysis on translational NCS is as follows: The largest off-origin peak in the Pattersonfunction is 4.54% of the height of the origin peak. No significant pseudotranslation is detected.
1Intensities estimated from amplitudes.2Theoretical values of < |L| >, < L2 > for acentric reflections are 0.5, 0.333 respectively for untwinned datasets,
and 0.375, 0.2 for perfectly twinned datasets.
Page 7 Full wwPDB X-ray Structure Validation Report 2WW8
5 Model quality i○
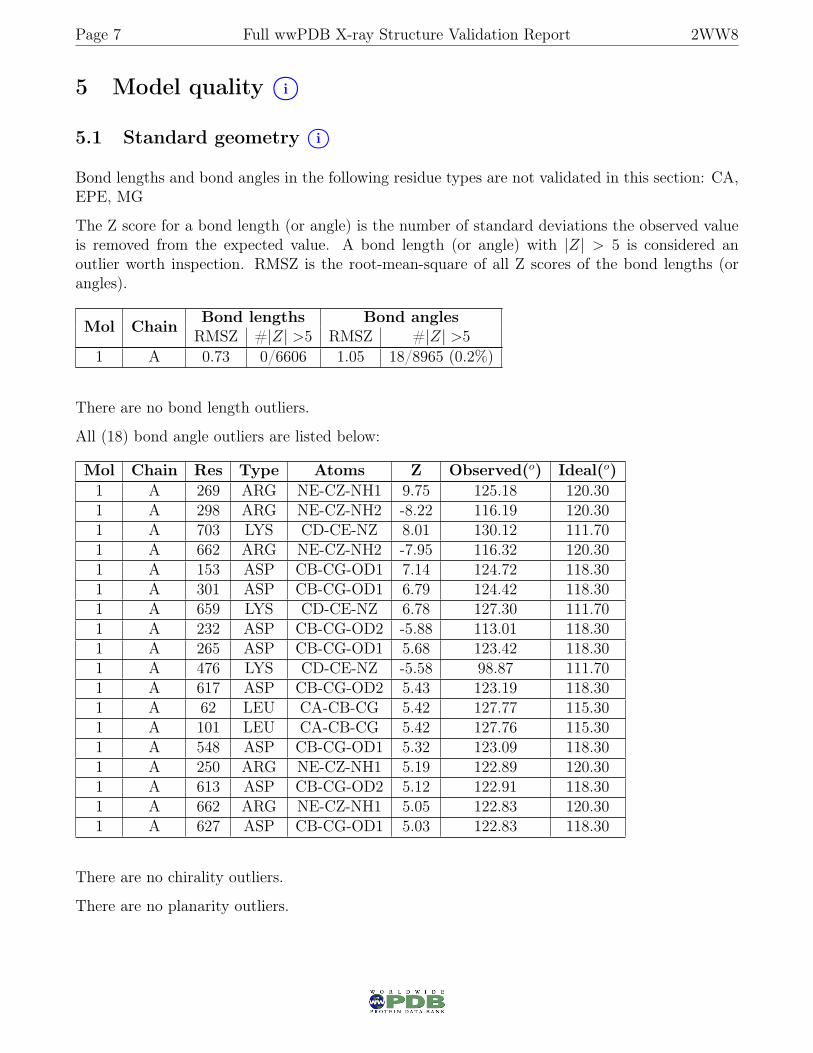
5.1 Standard geometry i○
Bond lengths and bond angles in the following residue types are not validated in this section: CA,EPE, MG
The Z score for a bond length (or angle) is the number of standard deviations the observed valueis removed from the expected value. A bond length (or angle) with |Z| > 5 is considered anoutlier worth inspection. RMSZ is the root-mean-square of all Z scores of the bond lengths (orangles).
Mol Chain Bond lengths Bond anglesRMSZ #|Z| >5 RMSZ #|Z| >5
1 A 0.73 0/6606 1.05 18/8965 (0.2%)
There are no bond length outliers.
All (18) bond angle outliers are listed below:
Mol Chain Res Type Atoms Z Observed(o) Ideal(o)1 A 269 ARG NE-CZ-NH1 9.75 125.18 120.301 A 298 ARG NE-CZ-NH2 -8.22 116.19 120.301 A 703 LYS CD-CE-NZ 8.01 130.12 111.701 A 662 ARG NE-CZ-NH2 -7.95 116.32 120.301 A 153 ASP CB-CG-OD1 7.14 124.72 118.301 A 301 ASP CB-CG-OD1 6.79 124.42 118.301 A 659 LYS CD-CE-NZ 6.78 127.30 111.701 A 232 ASP CB-CG-OD2 -5.88 113.01 118.301 A 265 ASP CB-CG-OD1 5.68 123.42 118.301 A 476 LYS CD-CE-NZ -5.58 98.87 111.701 A 617 ASP CB-CG-OD2 5.43 123.19 118.301 A 62 LEU CA-CB-CG 5.42 127.77 115.301 A 101 LEU CA-CB-CG 5.42 127.76 115.301 A 548 ASP CB-CG-OD1 5.32 123.09 118.301 A 250 ARG NE-CZ-NH1 5.19 122.89 120.301 A 613 ASP CB-CG-OD2 5.12 122.91 118.301 A 662 ARG NE-CZ-NH1 5.05 122.83 120.301 A 627 ASP CB-CG-OD1 5.03 122.83 118.30
There are no chirality outliers.
There are no planarity outliers.

Page 8 Full wwPDB X-ray Structure Validation Report 2WW8
5.2 Too-close contacts i○
In the following table, the Non-H and H(model) columns list the number of non-hydrogen atomsand hydrogen atoms in the chain respectively. The H(added) column lists the number of hydrogenatoms added and optimized by MolProbity. The Clashes column lists the number of clashes withinthe asymmetric unit, whereas Symm-Clashes lists symmetry related clashes.
Mol Chain Non-H H(model) H(added) Clashes Symm-Clashes1 A 6453 0 6301 94 12 A 1 0 0 0 03 A 2 0 0 0 04 A 30 0 36 5 05 A 808 0 0 18 0All All 7294 0 6337 95 1
The all-atom clashscore is defined as the number of clashes found per 1000 atoms (includinghydrogen atoms). The all-atom clashscore for this structure is 7.
All (95) close contacts within the same asymmetric unit are listed below, sorted by their clashmagnitude.
Atom-1 Atom-2 Interatomicdistance (Å)
Clashoverlap (Å)
1:A:765:TYR:HB2 1:A:768:ILE:HG21 1.48 0.961:A:704:GLU:HG2 5:A:2595:HOH:O 1.69 0.921:A:71:ASN:HB3 1:A:74:ASP:OD1 1.75 0.871:A:143:ASP:HA 1:A:171:GLN:NE2 1.89 0.871:A:758:LEU:O 1:A:772:ILE:HD11 1.81 0.801:A:562:LYS:HE2 5:A:2554:HOH:O 1.86 0.751:A:738:ILE:HD12 1:A:828:VAL:HG11 1.68 0.741:A:673:LYS:HE3 5:A:2687:HOH:O 1.90 0.711:A:651:LYS:HE3 5:A:2662:HOH:O 1.90 0.711:A:102:THR:HG22 1:A:116:GLN:HG2 1.73 0.701:A:762:HIS:CD2 1:A:763:PRO:HD2 2.27 0.701:A:402:THR:HA 4:A:1100:EPE:C8 2.23 0.691:A:745:LYS:HD2 1:A:855:GLU:HG2 1.75 0.681:A:542:ASN:HA 1:A:549:GLU:OE1 1.92 0.681:A:102:THR:CG2 1:A:116:GLN:HE21 2.07 0.681:A:772:ILE:H 1:A:772:ILE:HD12 1.58 0.68
1:A:765:TYR:HB2 1:A:768:ILE:CG2 2.23 0.651:A:66:VAL:HG12 1:A:104:ALA:HB3 1.79 0.651:A:659:LYS:HE2 5:A:2192:HOH:O 1.96 0.641:A:66:VAL:HB 1:A:105:GLN:HG2 1.80 0.63
1:A:707:GLN:HG3 1:A:707:GLN:O 2.00 0.621:A:102:THR:HG21 1:A:116:GLN:HE21 1.65 0.61
Continued on next page...

Page 9 Full wwPDB X-ray Structure Validation Report 2WW8
Continued from previous page...
Atom-1 Atom-2 Interatomicdistance (Å)
Clashoverlap (Å)
1:A:402:THR:HA 4:A:1100:EPE:H82 1.84 0.601:A:267:GLU:HG3 5:A:2218:HOH:O 2.02 0.601:A:772:ILE:N 1:A:772:ILE:HD12 2.16 0.59
1:A:465:PHE:HB2 1:A:494:LEU:HD21 1.84 0.591:A:765:TYR:CB 1:A:768:ILE:HG21 2.30 0.581:A:578:GLN:HE22 1:A:581:ARG:HE 1.51 0.571:A:143:ASP:HA 1:A:171:GLN:HE21 1.67 0.571:A:774:GLN:H 1:A:774:GLN:HE21 1.53 0.571:A:143:ASP:HA 1:A:171:GLN:HE22 1.68 0.571:A:749:LYS:HB3 5:A:2743:HOH:O 2.05 0.561:A:201:ASP:OD2 1:A:203:GLN:NE2 2.31 0.551:A:65:ALA:HB3 1:A:82:THR:CG2 2.38 0.541:A:62:LEU:HD23 1:A:107:PRO:HG2 1.89 0.541:A:734:LYS:NZ 1:A:734:LYS:HB2 2.22 0.541:A:734:LYS:HZ2 1:A:734:LYS:HB2 1.73 0.531:A:651:LYS:CE 5:A:2662:HOH:O 2.55 0.521:A:221:LYS:CD 5:A:2145:HOH:O 2.58 0.521:A:82:THR:HG22 1:A:89:ALA:HB2 1.91 0.511:A:591:LYS:NZ 5:A:2585:HOH:O 2.39 0.511:A:758:LEU:O 1:A:772:ILE:CD1 2.58 0.51
1:A:774:GLN:HE21 1:A:774:GLN:N 2.08 0.511:A:141:LEU:HD11 1:A:173:LYS:HG3 1.93 0.501:A:734:LYS:HD3 1:A:826:GLY:HA3 1.92 0.501:A:578:GLN:NE2 1:A:581:ARG:HE 2.11 0.491:A:164:ASP:HB3 5:A:2059:HOH:O 2.12 0.491:A:47:ILE:HG12 1:A:47:ILE:O 2.12 0.481:A:220:ASP:OD1 1:A:220:ASP:C 2.50 0.481:A:230:LEU:HD23 1:A:273:VAL:HB 1.95 0.471:A:734:LYS:HD2 1:A:825:ASN:O 2.14 0.471:A:402:THR:HG22 4:A:1100:EPE:O8 2.13 0.471:A:65:ALA:HB3 1:A:82:THR:HG23 1.97 0.461:A:349:ARG:NE 5:A:2323:HOH:O 2.40 0.461:A:781:VAL:HG23 1:A:789:LEU:CD2 2.46 0.461:A:334:LEU:HD23 1:A:334:LEU:C 2.36 0.461:A:221:LYS:HD3 5:A:2145:HOH:O 2.15 0.451:A:117:TRP:CZ2 1:A:729:ILE:HD11 2.52 0.454:A:1101:EPE:H31 4:A:1101:EPE:O8 2.16 0.451:A:259:ILE:HD13 1:A:334:LEU:CD2 2.47 0.451:A:232:ASP:HB3 1:A:386:THR:HA 1.99 0.451:A:742:LYS:HD3 1:A:756:PHE:CZ 2.51 0.451:A:823:ILE:HA 1:A:827:GLU:O 2.17 0.45
Continued on next page...
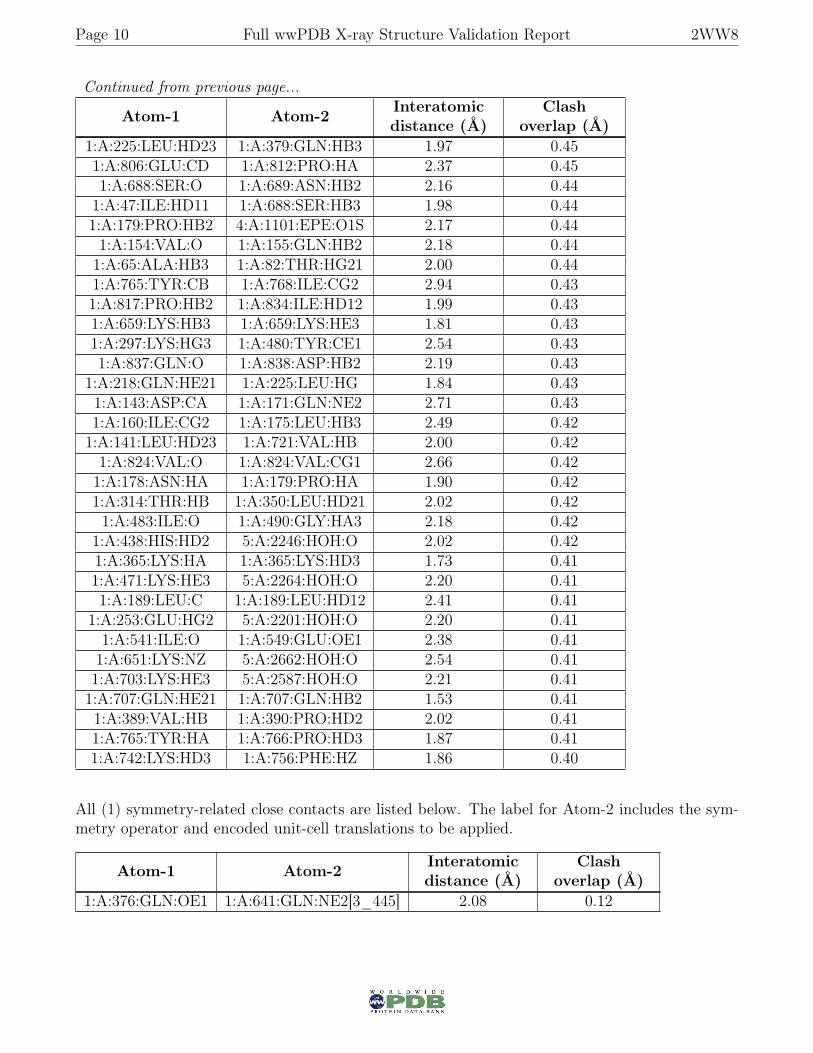
Page 10 Full wwPDB X-ray Structure Validation Report 2WW8
Continued from previous page...
Atom-1 Atom-2 Interatomicdistance (Å)
Clashoverlap (Å)
1:A:225:LEU:HD23 1:A:379:GLN:HB3 1.97 0.451:A:806:GLU:CD 1:A:812:PRO:HA 2.37 0.451:A:688:SER:O 1:A:689:ASN:HB2 2.16 0.441:A:47:ILE:HD11 1:A:688:SER:HB3 1.98 0.441:A:179:PRO:HB2 4:A:1101:EPE:O1S 2.17 0.441:A:154:VAL:O 1:A:155:GLN:HB2 2.18 0.441:A:65:ALA:HB3 1:A:82:THR:HG21 2.00 0.441:A:765:TYR:CB 1:A:768:ILE:CG2 2.94 0.431:A:817:PRO:HB2 1:A:834:ILE:HD12 1.99 0.431:A:659:LYS:HB3 1:A:659:LYS:HE3 1.81 0.431:A:297:LYS:HG3 1:A:480:TYR:CE1 2.54 0.431:A:837:GLN:O 1:A:838:ASP:HB2 2.19 0.43
1:A:218:GLN:HE21 1:A:225:LEU:HG 1.84 0.431:A:143:ASP:CA 1:A:171:GLN:NE2 2.71 0.431:A:160:ILE:CG2 1:A:175:LEU:HB3 2.49 0.421:A:141:LEU:HD23 1:A:721:VAL:HB 2.00 0.421:A:824:VAL:O 1:A:824:VAL:CG1 2.66 0.421:A:178:ASN:HA 1:A:179:PRO:HA 1.90 0.421:A:314:THR:HB 1:A:350:LEU:HD21 2.02 0.421:A:483:ILE:O 1:A:490:GLY:HA3 2.18 0.42
1:A:438:HIS:HD2 5:A:2246:HOH:O 2.02 0.421:A:365:LYS:HA 1:A:365:LYS:HD3 1.73 0.411:A:471:LYS:HE3 5:A:2264:HOH:O 2.20 0.411:A:189:LEU:C 1:A:189:LEU:HD12 2.41 0.41
1:A:253:GLU:HG2 5:A:2201:HOH:O 2.20 0.411:A:541:ILE:O 1:A:549:GLU:OE1 2.38 0.411:A:651:LYS:NZ 5:A:2662:HOH:O 2.54 0.411:A:703:LYS:HE3 5:A:2587:HOH:O 2.21 0.411:A:707:GLN:HE21 1:A:707:GLN:HB2 1.53 0.411:A:389:VAL:HB 1:A:390:PRO:HD2 2.02 0.411:A:765:TYR:HA 1:A:766:PRO:HD3 1.87 0.411:A:742:LYS:HD3 1:A:756:PHE:HZ 1.86 0.40
All (1) symmetry-related close contacts are listed below. The label for Atom-2 includes the sym-metry operator and encoded unit-cell translations to be applied.
Atom-1 Atom-2 Interatomicdistance (Å)
Clashoverlap (Å)
1:A:376:GLN:OE1 1:A:641:GLN:NE2[3_445] 2.08 0.12

Page 11 Full wwPDB X-ray Structure Validation Report 2WW8
5.3 Torsion angles i○
5.3.1 Protein backbone i○
In the following table, the Percentiles column shows the percent Ramachandran outliers of thechain as a percentile score with respect to all X-ray entries followed by that with respect to entriesof similar resolution.
The Analysed column shows the number of residues for which the backbone conformation wasanalysed, and the total number of residues.
Mol Chain Analysed Favoured Allowed Outliers Percentiles
1 A 820/893 (92%) 788 (96%) 27 (3%) 5 (1%) 27 15
All (5) Ramachandran outliers are listed below:
Mol Chain Res Type1 A 57 GLU1 A 768 ILE1 A 76 THR1 A 775 ASN1 A 96 PRO
5.3.2 Protein sidechains i○
In the following table, the Percentiles column shows the percent sidechain outliers of the chain as apercentile score with respect to all X-ray entries followed by that with respect to entries of similarresolution.
The Analysed column shows the number of residues for which the sidechain conformation wasanalysed, and the total number of residues.
Mol Chain Analysed Rotameric Outliers Percentiles
1 A 715/774 (92%) 693 (97%) 22 (3%) 43 34
All (22) residues with a non-rotameric sidechain are listed below:
Mol Chain Res Type1 A 47 ILE1 A 61 LEU1 A 70 LYS1 A 82 THR1 A 83 GLU1 A 101 LEU
Continued on next page...

Page 12 Full wwPDB X-ray Structure Validation Report 2WW8
Continued from previous page...Mol Chain Res Type1 A 120 GLU1 A 126 ARG1 A 137 ARG1 A 167 GLU1 A 617 ASP1 A 659 LYS1 A 695 ASN1 A 705 VAL1 A 717 LYS1 A 731 LYS1 A 734 LYS1 A 767 ASP1 A 768 ILE1 A 774 GLN1 A 795 SER1 A 824 VAL
Some sidechains can be flipped to improve hydrogen bonding and reduce clashes. All (7) suchsidechains are listed below:
Mol Chain Res Type1 A 116 GLN1 A 171 GLN1 A 438 HIS1 A 707 GLN1 A 708 ASN1 A 762 HIS1 A 774 GLN
5.3.3 RNA i○
There are no RNA molecules in this entry.
5.4 Non-standard residues in protein, DNA, RNA chains i○
There are no non-standard protein/DNA/RNA residues in this entry.
5.5 Carbohydrates i○
There are no carbohydrates in this entry.
Page 13 Full wwPDB X-ray Structure Validation Report 2WW8
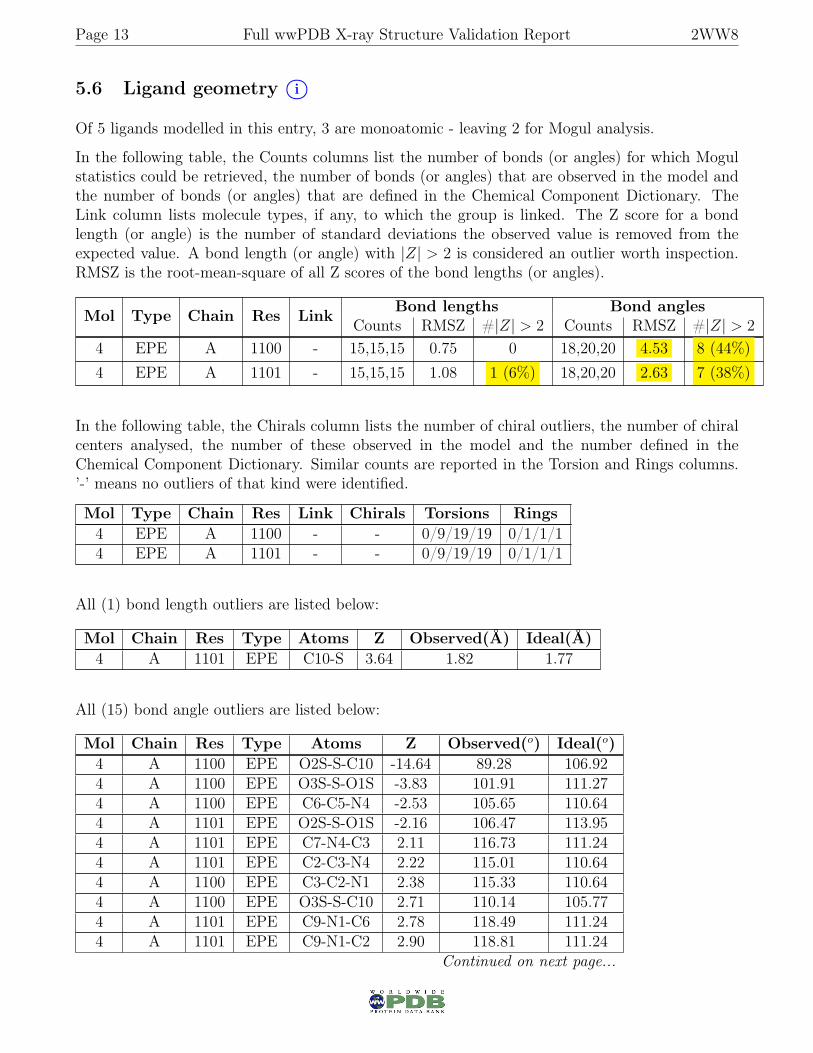
5.6 Ligand geometry i○
Of 5 ligands modelled in this entry, 3 are monoatomic - leaving 2 for Mogul analysis.
In the following table, the Counts columns list the number of bonds (or angles) for which Mogulstatistics could be retrieved, the number of bonds (or angles) that are observed in the model andthe number of bonds (or angles) that are defined in the Chemical Component Dictionary. TheLink column lists molecule types, if any, to which the group is linked. The Z score for a bondlength (or angle) is the number of standard deviations the observed value is removed from theexpected value. A bond length (or angle) with |Z| > 2 is considered an outlier worth inspection.RMSZ is the root-mean-square of all Z scores of the bond lengths (or angles).
Mol Type Chain Res Link Bond lengths Bond anglesCounts RMSZ #|Z| > 2 Counts RMSZ #|Z| > 2
4 EPE A 1100 - 15,15,15 0.75 0 18,20,20 4.53 8 (44%)4 EPE A 1101 - 15,15,15 1.08 1 (6%) 18,20,20 2.63 7 (38%)
In the following table, the Chirals column lists the number of chiral outliers, the number of chiralcenters analysed, the number of these observed in the model and the number defined in theChemical Component Dictionary. Similar counts are reported in the Torsion and Rings columns.’-’ means no outliers of that kind were identified.
Mol Type Chain Res Link Chirals Torsions Rings4 EPE A 1100 - - 0/9/19/19 0/1/1/14 EPE A 1101 - - 0/9/19/19 0/1/1/1
All (1) bond length outliers are listed below:
Mol Chain Res Type Atoms Z Observed(Å) Ideal(Å)4 A 1101 EPE C10-S 3.64 1.82 1.77
All (15) bond angle outliers are listed below:
Mol Chain Res Type Atoms Z Observed(o) Ideal(o)4 A 1100 EPE O2S-S-C10 -14.64 89.28 106.924 A 1100 EPE O3S-S-O1S -3.83 101.91 111.274 A 1100 EPE C6-C5-N4 -2.53 105.65 110.644 A 1101 EPE O2S-S-O1S -2.16 106.47 113.954 A 1101 EPE C7-N4-C3 2.11 116.73 111.244 A 1101 EPE C2-C3-N4 2.22 115.01 110.644 A 1100 EPE C3-C2-N1 2.38 115.33 110.644 A 1100 EPE O3S-S-C10 2.71 110.14 105.774 A 1101 EPE C9-N1-C6 2.78 118.49 111.244 A 1101 EPE C9-N1-C2 2.90 118.81 111.24
Continued on next page...
Page 14 Full wwPDB X-ray Structure Validation Report 2WW8
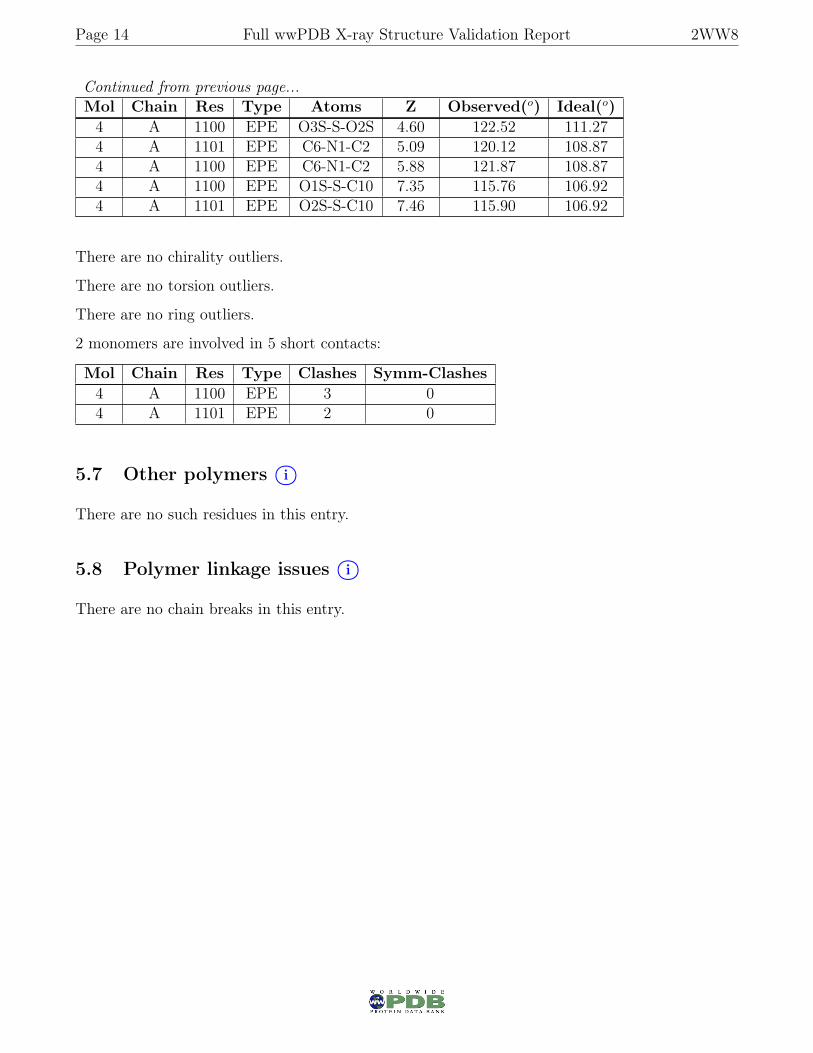
Continued from previous page...Mol Chain Res Type Atoms Z Observed(o) Ideal(o)4 A 1100 EPE O3S-S-O2S 4.60 122.52 111.274 A 1101 EPE C6-N1-C2 5.09 120.12 108.874 A 1100 EPE C6-N1-C2 5.88 121.87 108.874 A 1100 EPE O1S-S-C10 7.35 115.76 106.924 A 1101 EPE O2S-S-C10 7.46 115.90 106.92
There are no chirality outliers.
There are no torsion outliers.
There are no ring outliers.
2 monomers are involved in 5 short contacts:
Mol Chain Res Type Clashes Symm-Clashes4 A 1100 EPE 3 04 A 1101 EPE 2 0
5.7 Other polymers i○
There are no such residues in this entry.
5.8 Polymer linkage issues i○
There are no chain breaks in this entry.

Page 15 Full wwPDB X-ray Structure Validation Report 2WW8
6 Fit of model and data i○
6.1 Protein, DNA and RNA chains i○
In the following table, the column labelled ‘#RSRZ> 2’ contains the number (and percentage)of RSRZ outliers, followed by percent RSRZ outliers for the chain as percentile scores relative toall X-ray entries and entries of similar resolution. The OWAB column contains the minimum,median, 95th percentile and maximum values of the occupancy-weighted average B-factor perresidue. The column labelled ‘Q< 0.9’ lists the number of (and percentage) of residues with anaverage occupancy less than 0.9.
Mol Chain Analysed <RSRZ> #RSRZ>2 OWAB(Å2) Q<0.9
1 A 815/893 (91%) 0.33 64 (7%) 12 14 7, 17, 33, 50 0
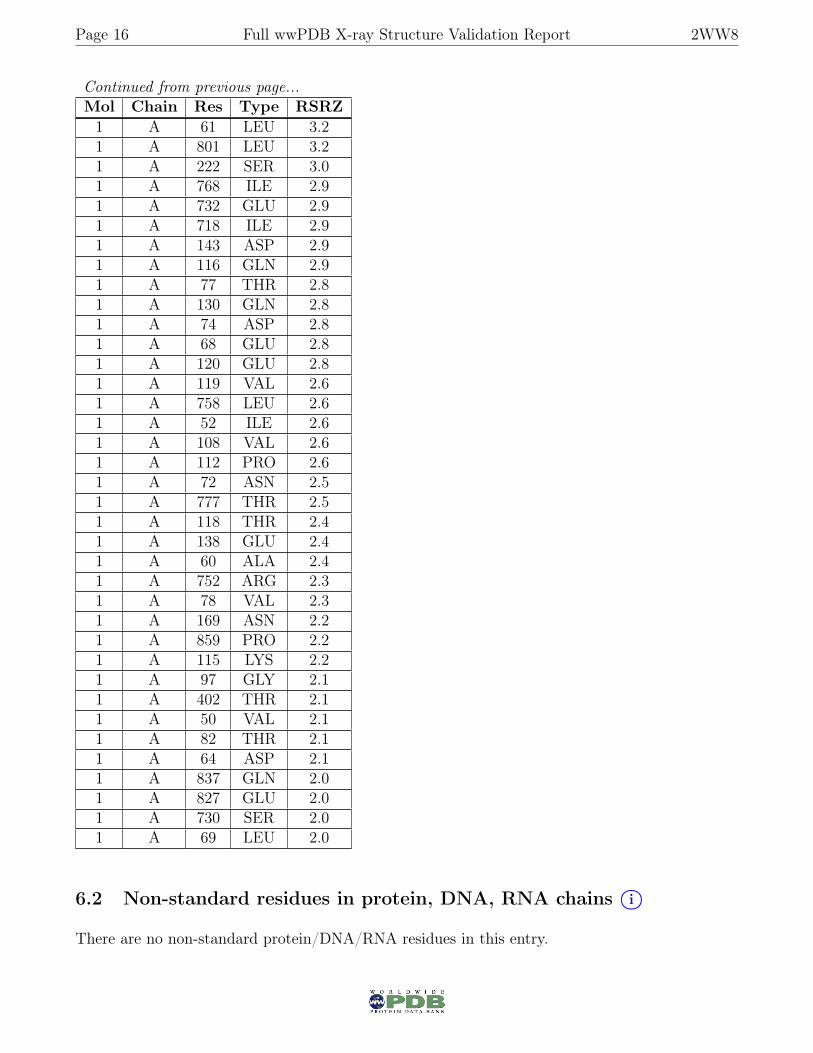
All (64) RSRZ outliers are listed below:
Mol Chain Res Type RSRZ1 A 85 GLN 7.91 A 765 TYR 7.61 A 58 GLY 7.21 A 46 ALA 6.11 A 73 THR 5.81 A 57 GLU 5.71 A 775 ASN 5.51 A 114 THR 5.31 A 84 ALA 5.11 A 56 GLY 4.81 A 86 THR 4.81 A 75 GLY 4.61 A 403 PHE 4.51 A 59 GLY 4.51 A 774 GLN 4.41 A 133 GLN 4.31 A 766 PRO 3.91 A 705 VAL 3.81 A 772 ILE 3.81 A 767 ASP 3.81 A 221 LYS 3.81 A 776 GLY 3.71 A 81 ARG 3.71 A 83 GLU 3.71 A 763 PRO 3.61 A 764 ASP 3.51 A 131 GLY 3.2
Continued on next page...
Page 16 Full wwPDB X-ray Structure Validation Report 2WW8
Continued from previous page...Mol Chain Res Type RSRZ1 A 61 LEU 3.21 A 801 LEU 3.21 A 222 SER 3.01 A 768 ILE 2.91 A 732 GLU 2.91 A 718 ILE 2.91 A 143 ASP 2.91 A 116 GLN 2.91 A 77 THR 2.81 A 130 GLN 2.81 A 74 ASP 2.81 A 68 GLU 2.81 A 120 GLU 2.81 A 119 VAL 2.61 A 758 LEU 2.61 A 52 ILE 2.61 A 108 VAL 2.61 A 112 PRO 2.61 A 72 ASN 2.51 A 777 THR 2.51 A 118 THR 2.41 A 138 GLU 2.41 A 60 ALA 2.41 A 752 ARG 2.31 A 78 VAL 2.31 A 169 ASN 2.21 A 859 PRO 2.21 A 115 LYS 2.21 A 97 GLY 2.11 A 402 THR 2.11 A 50 VAL 2.11 A 82 THR 2.11 A 64 ASP 2.11 A 837 GLN 2.01 A 827 GLU 2.01 A 730 SER 2.01 A 69 LEU 2.0
6.2 Non-standard residues in protein, DNA, RNA chains i○
There are no non-standard protein/DNA/RNA residues in this entry.
Page 17 Full wwPDB X-ray Structure Validation Report 2WW8
6.3 Carbohydrates i○
There are no carbohydrates in this entry.
6.4 Ligands i○
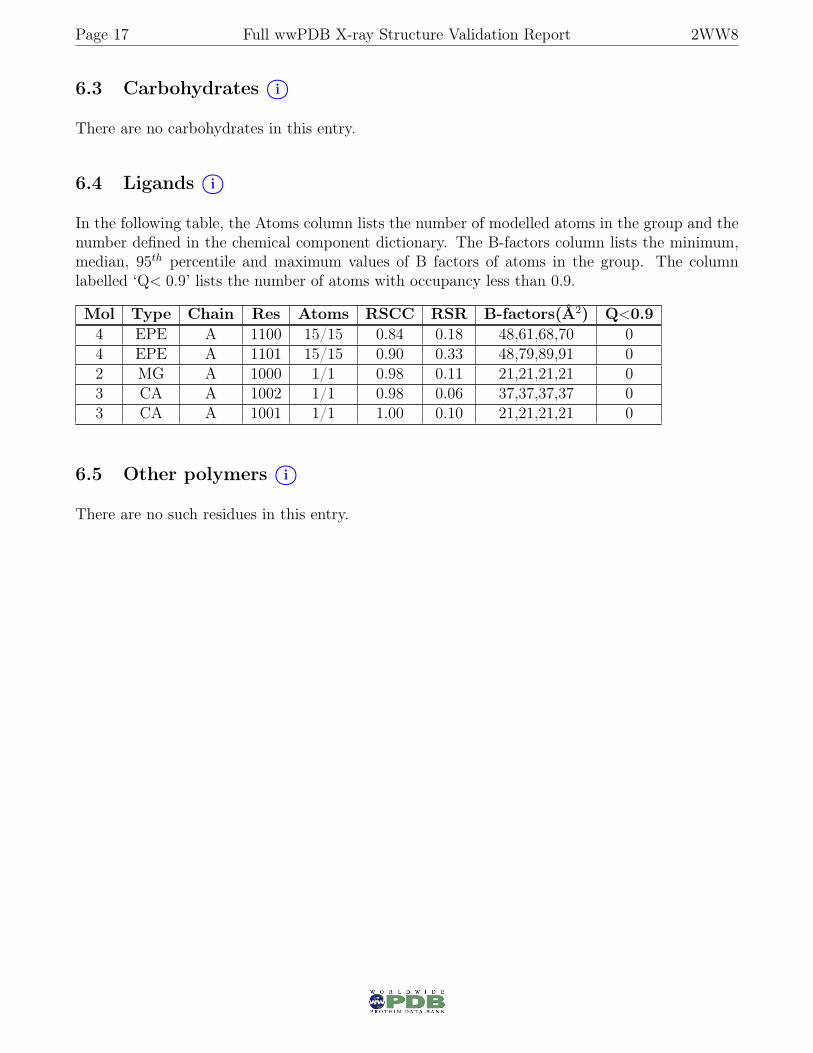
In the following table, the Atoms column lists the number of modelled atoms in the group and thenumber defined in the chemical component dictionary. The B-factors column lists the minimum,median, 95th percentile and maximum values of B factors of atoms in the group. The columnlabelled ‘Q< 0.9’ lists the number of atoms with occupancy less than 0.9.
Mol Type Chain Res Atoms RSCC RSR B-factors(Å2) Q<0.94 EPE A 1100 15/15 0.84 0.18 48,61,68,70 04 EPE A 1101 15/15 0.90 0.33 48,79,89,91 02 MG A 1000 1/1 0.98 0.11 21,21,21,21 03 CA A 1002 1/1 0.98 0.06 37,37,37,37 03 CA A 1001 1/1 1.00 0.10 21,21,21,21 0
6.5 Other polymers i○
There are no such residues in this entry.