full text - Delfstoffen Online
9
379 Netherlands Journal of Geosciences — Geologie en Mijnbouw | 84 – 4 | 2005 Introduction Aggregates, i.e. granular mineral materials, are used in construction and by the building-materials industry. Dutch production amounts to about 75 Mt/a and includes about 50 Mt/a of fine sand, 20 Mt/a of coarse sand and 5 Mt/a of gravel (Van der Meulen et al., in press). The Netherlands are not self-supporting for aggregates; the ever-growing net- import level is currently between 30 and 40 Mt/a. An important reason for this is restricted access to resources. The Dutch population density (481 inhabitants per km 2 in 2004) ranks among the highest in the world, and more than 85% of the Dutch land surface is developed. Land-based aggregates extraction, which usually transforms land into a water body, is therefore prone to raise land-use conflicts and seems to be more controversial than in other countries (Van der Meulen et al., 2003; in press). The Dutch Ministry of Spatial Planning, Housing and the Environment has recently designed a so-called building raw materials assessment (‘bouwgrondstoffentoets’; Anonymous, 2004), in order to arrange for a certain level of access to surface mineral resources. Spatial plans have to be evaluated (i) in terms of the effects on mineral supplies, (ii) for the accessibility of resources of scarce minerals to future generations, and (iii) for the possibilities to embed mineral extraction into projects which have other primary goals (e.g. Aggregate resources in the Netherlands M.J. van der Meulen * , S.F. van Gessel & J.G. Veldkamp TNO Built Environment and Geosciences – Geological Survey of the Netherlands, P.O. Box 80015, 3508 TA Utrecht, the Netherlands. * Corresponding author. Email: [email protected] Manuscript received: April 2005; accepted: August 2005 Abstract We have built a 3D lithological model of the Netherlands, for the purpose of mapping on-land aggregate resources down to 50 m below the surface. The model consists of voxel cells (1000 · 1000 · 1 m), with lithological composition and aggregate content estimates as primary attributes. These attributes were derived from ~350,000 borehole descriptions. Overburdens and intercalations of cohesive or otherwise non-dredgeable materials were taken into account to define geologically exploitable aggregates within the total stock. We arrive at about 520 · 10 9 m 3 of aggregates occurring in the depth range investigated. Some 50% of this amount is considered geologically exploitable and about 25% would in principle (but largely not in reality) be accessible. Most aggregates resources (~98%) are coarse sand, which is processed for use in concrete, masonry mortars, drains, filters, etc. The total exploitable stock of coarse sand in the depth range investigated amounts to roughly 7500 times the current annual consumption level, and is virtually indepletable. The gravel stock, estimated at some 12 · 10 9 m 3 , is small by comparison, and impels a dependency on imports. Exploitable aggregates occur in all but the coastal provinces. In accordance with current policy changes, the future may show a shift from concentrated production along the upstream Dutch Rhine and Meuse rivers towards a more even distribution of small-sized operations over the country. Fairly large aggregate stocks, that have not yet been exploited to significant extent, are available in the northern extent of the aggregates occurrences. Keywords: Netherlands, sand, gravel, aggregates, resource assessment Netherlands Journal of Geosciences — Geologie en Mijnbouw | 84 – 3 | 379 - 387 | 2005
Transcript of full text - Delfstoffen Online

379Netherlands Journal of Geosciences — Geologie en Mijnbouw | 84 – 4 | 2005
Introduction
Aggregates, i.e. granular mineral materials, are used inconstruction and by the building-materials industry. Dutchproduction amounts to about 75 Mt/a and includes about 50 Mt/a of fine sand, 20 Mt/a of coarse sand and 5 Mt/a ofgravel (Van der Meulen et al., in press). The Netherlands arenot self-supporting for aggregates; the ever-growing net-import level is currently between 30 and 40 Mt/a. Animportant reason for this is restricted access to resources. TheDutch population density (481 inhabitants per km2 in 2004)ranks among the highest in the world, and more than 85% ofthe Dutch land surface is developed. Land-based aggregates
extraction, which usually transforms land into a water body,is therefore prone to raise land-use conflicts and seems to bemore controversial than in other countries (Van der Meulen etal., 2003; in press).
The Dutch Ministry of Spatial Planning, Housing and theEnvironment has recently designed a so-called building rawmaterials assessment (‘bouwgrondstoffentoets’; Anonymous,2004), in order to arrange for a certain level of access tosurface mineral resources. Spatial plans have to be evaluated(i) in terms of the effects on mineral supplies, (ii) for theaccessibility of resources of scarce minerals to futuregenerations, and (iii) for the possibilities to embed mineralextraction into projects which have other primary goals (e.g.
Aggregate resources in the Netherlands
M.J. van der Meulen*, S.F. van Gessel & J.G. Veldkamp
TNO Built Environment and Geosciences – Geological Survey of the Netherlands, P.O. Box 80015, 3508 TA Utrecht, the Netherlands.
* Corresponding author. Email: [email protected]
Manuscript received: April 2005; accepted: August 2005
Abstract
We have built a 3D lithological model of the Netherlands, for the purpose of mapping on-land aggregate resources down to 50 m below the surface.
The model consists of voxel cells (1000 · 1000 · 1 m), with lithological composition and aggregate content estimates as primary attributes. These
attributes were derived from ~350,000 borehole descriptions. Overburdens and intercalations of cohesive or otherwise non-dredgeable materials
were taken into account to define geologically exploitable aggregates within the total stock. We arrive at about 520 · 109 m3 of aggregates
occurring in the depth range investigated. Some 50% of this amount is considered geologically exploitable and about 25% would in principle
(but largely not in reality) be accessible. Most aggregates resources (~98%) are coarse sand, which is processed for use in concrete, masonry
mortars, drains, filters, etc. The total exploitable stock of coarse sand in the depth range investigated amounts to roughly 7500 times the current
annual consumption level, and is virtually indepletable. The gravel stock, estimated at some 12 · 109 m3, is small by comparison, and impels a
dependency on imports.
Exploitable aggregates occur in all but the coastal provinces. In accordance with current policy changes, the future may show a shift from
concentrated production along the upstream Dutch Rhine and Meuse rivers towards a more even distribution of small-sized operations over the
country. Fairly large aggregate stocks, that have not yet been exploited to significant extent, are available in the northern extent of the
aggregates occurrences.
Keywords: Netherlands, sand, gravel, aggregates, resource assessment
Netherlands Journal of Geosciences — Geologie en Mijnbouw | 84 – 3 | 379 - 387 | 2005
hydraulic engineering, nature development). Note that theNetherlands has very few mineral resources: only aggregates,clay, peat, silica sand and carbonate rocks are quarryable. Theassessment defines ‘scarce minerals’ within this group ofminerals, and refers to each of them except for peat, which isnot quarried at present, and fine sand. The other minerals caneither be geologically scarce (e.g. high quality silica sand), orscarce on the market, mainly because of a restrictive policy forissuing extraction permits (e.g. coarse sand).
The building materials assessment is currently in theprocess of being adopted by the mineral planning and permit-issuing authorities, i.e. the Ministry of Transport, Public Worksand Water Management where state waters (‘rijkswateren’) areconcerned, and the provincial administrations in all other cases.Irrespective of the shape the building raw materials assess-ment will take, it will somehow have to rely on geologicalinformation. We present new maps of aggregate resources inthe Netherlands, and estimates of the sizes of its stocks downto 50 m below the surface. Scale and resolution are adapted toa representation on a national scale. The approach taken canhowever be applied on regional and local scales and, hence, tofuture building raw materials assessments.
Geological setting
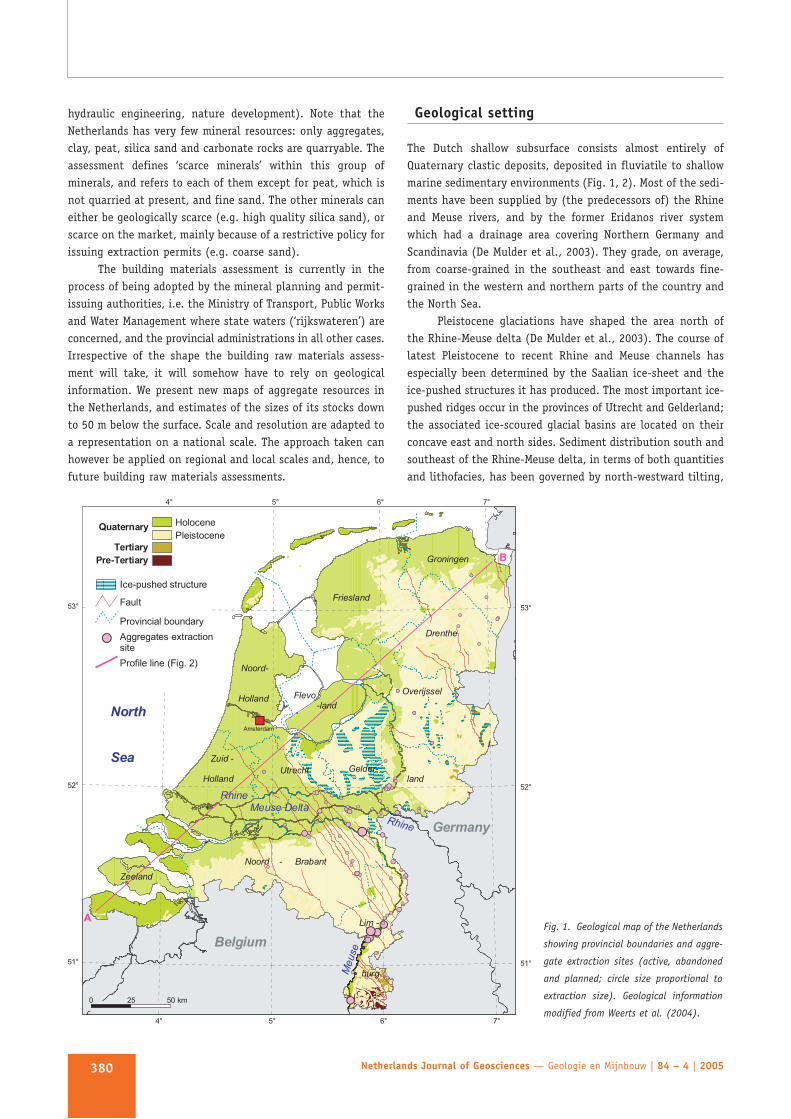
The Dutch shallow subsurface consists almost entirely ofQuaternary clastic deposits, deposited in fluviatile to shallowmarine sedimentary environments (Fig. 1, 2). Most of the sedi-ments have been supplied by (the predecessors of) the Rhineand Meuse rivers, and by the former Eridanos river systemwhich had a drainage area covering Northern Germany andScandinavia (De Mulder et al., 2003). They grade, on average,from coarse-grained in the southeast and east towards fine-grained in the western and northern parts of the country andthe North Sea.
Pleistocene glaciations have shaped the area north ofthe Rhine-Meuse delta (De Mulder et al., 2003). The course oflatest Pleistocene to recent Rhine and Meuse channels hasespecially been determined by the Saalian ice-sheet and theice-pushed structures it has produced. The most important ice-pushed ridges occur in the provinces of Utrecht and Gelderland;the associated ice-scoured glacial basins are located on theirconcave east and north sides. Sediment distribution south andsoutheast of the Rhine-Meuse delta, in terms of both quantitiesand lithofacies, has been governed by north-westward tilting,
Netherlands Journal of Geosciences — Geologie en Mijnbouw | 84 – 4 | 2005380
Fig. 1. Geological map of the Netherlands
showing provincial boundaries and aggre-
gate extraction sites (active, abandoned
and planned; circle size proportional to
extraction size). Geological information
modified from Weerts et al. (2004).

associated with uplift of the London-Brabant massif, and byNW-SE trending horst-graben structures.
Aggregate commodities: geological data vs. industrial specifications
The grain size parameter in available data
Aggregates, except for filling materials, are primarily definedby their grain size distributions. Our aggregates mapping isbased on borehole data in DINO, a digital archive of subsurfacedata developed and maintained by TNO Built Environment andGeosciences – Geological Survey of the Netherlands (for databasespecifications see Kooijman, 2003; Peersmann, 2005). Sanddescriptions usually include estimated or measured mediangrain sizes, either as a class (extremely fine, very fine, etc.) ora discrete value (M63, i.e. the median grain size of the sandfraction). Gravel occurrences or admixtures are described insimilar ways, although quantifications or classifications occursomewhat less frequently. Only a negligible share of the approx.380,000 standardized borehole descriptions in DINO includesfull grain size distributions, so the sizes of national aggregatestocks can only be approximated.
Aggregate yield calculations
In order to calculate aggregate yields from lithological data,we have had to use median grain size data pragmatically.Assessments of the application possibilities of sands firstrequires a distinction between fine and coarse categories (Vander Meulen et al., in press). Fine sand is used as filling material.
As fine sand can be found virtually anywhere in the country andfilling sands supplies have never imposed problems, we do notfurther elaborate on its stocks. In fact, common aggregate defi-nitions usually exclude landfilling materials. Coarse sand is usedas an aggregate for more advanced purposes, i.e. for the pro-duction of concrete and masonry mortars, in drains, filters etc.
In the Netherlands, coarse sand commodities are usuallyjointly referred to as ‘concrete and mortar sand’ (‘beton- enmetselzand’; NEN, 1991; 1999). A fairly common first orderestimator for reserves of concrete and mortar sand is theamount of so-called sand 30/92 that can be produced at a site,i.e. a sand with 30 and 92 cumulative mass percents retainingon the 1 mm and 250 µm sieve, respectively. In approximateaccordance with this, we do not consider extremely fine, veryfine and moderately fine sands to be concrete and mortar sandresources (Table 1). Secondly, we assume that 50% ofmoderately coarse and very coarse sands, i.e. the coarse halfof their grain size populations, can be used in concrete andmortar sand. Finally, we assume a 100% grade for extremelycoarse sands, as indeed most concrete and mortar sands wouldgeologically be classified as such. We expect that any type ofgravel can be entirely used as or processed into an aggregate:fine gravel as an admixture in concrete and mortar sand,coarse gravel as such. We feel that more sophisticated ways tocalculate aggregate yields from lithological descriptions arenot relevant on national scale assessments.
Distinguishing between gravel and sand commodities
A subdivision of aggregates into gravel and sand commoditiesis hampered by the differences in their industrial and geological
381Netherlands Journal of Geosciences — Geologie en Mijnbouw | 84 – 4 | 2005
Peelo Fm (Elsterian, subglacial)
Drente Fm (Saalian, periglacial deposits and till)
Ice pushed structure (Saalian)
Middle to upper Pleistocene (peri)glacialdeposits and structures
Boxtel Fm (Middle-upper Pleistocene, mainlyperiglacial)
Breda Fm (shallow marine, Miocene to lower Pliocene)
Oosterhout Fm (shallow marine to coastal, Pliocene)
Maassluis Fm (shallow marine to coastal, Pliocene to lower Pleistocene)
Peize, Waalre (fluviatile, lower Pleistocene) and Stamproy Fms (fluviatile and aeolian, lower Pleistocene)
Eocene to lower Pleistocene
Appelscha Fm (middle Pleist.)
Sterksel Fm (middle Pleist.)
Urk Fm (middle Pleist.)
Kreftenheye Fm (upper Pleist.)
Middle to upper Pleistocene fluviatile and marine deposits
Holocene: Echteld Fm (fluviatile), Nieuwkoop Fm (coastal and local swamp peats) and Naaldwijk Fm (coastal andshallow marine clastic deposits)
Rupel and Tongeren Fms (shallow marine, Eo-Oligocene)
Dep
th b
elo
wo
rdn
ance
leve
l (m
)
Eem Fm (Eemian,marine)
(fluviatile, importantaggregate resources)
0
25
50
75
A B
0 50 km
Fig. 2. Geological cross section from Zeeland to Groningen (see Fig. 1 for section line). It has been constructed by intersecting depth grids of formation
boundaries (1 : 250,000), which have been obtained in the 3D geological mapping program carried out by TNO Built Environment and Geosciences –
Geological Survey of the Netherlands. All formations referred to are cf. De Mulder et al. (2003).

definitions. The Dutch sediment and soil classification system(Anonymous, 1989; 1990) is based on a set of three ternarydiagrams. Sediments are classified according to gravel content(diagram 1), organic matter content (diagram 2), and the relativecontents of the sand, silt and clay fractions (diagram 3). Inthis system, gravel is a granular material with >30% of gravelparticles, i.e. particles with a diameter of >2 mm. The morestraightforward industrial definition of gravel is a naturalgranular material with application-dependent lower (generally4 to 8 mm) and upper limits (generally 16 to 32 mm) to itsgrain size distribution. Sand is defined similarly, with a lowerlimit of 63 to 125 µm and an upper limit of 4 to 8 mm.Because of these differences we can not accurately distinguishbetween gravel and sand commodities on lithological criteriaalone. We primarily assess aggregate resources, in whichcoarse sand and gravel are lumped, and give an indication ofgravel resources as a subcategory by applying a geographicalsearch criterion.
Modeling approach
Model setup and data selection
As a first step in the resource assessment we have built a 3D-lithological model of the Netherlands (excluding the NorthSea) down to a depth of 50 m below the surface. This depthrange comprises aggregate resources that are currently exploited:most aggregates pits are between 25 and 40 m deep. The modelis based on a so-called voxel grid which divides the modelspace into equal-sized rectangular cells. The model volumecovered by a cell is characterized by a number of lithologicalcell attribute values, which have been either obtained orderived from borehole descriptions in DINO. We used cells witha surface area of 1000 · 1000 m and a thickness of 1 m, whichresulted in a model of 50 layers of 40,769 cells.
Available borehole descriptions – in principle all of the~380,000 in our archives – show a wide range in quality,
depending on the drilling method, the original purpose ofdrilling, drilling personnel qualifications, whether descrip-tions have been made in the field or in the laboratory, etc. Thenumber of drillings precludes a manual assessment of thesefactors, so we have used the average thickness of lithologicaldescription intervals as a quality proxy. We consider an averagethickness >3 m to be indicative of insufficient quality for ourpurposes; such data are discarded from the model data set.The 3 m limit is a value of experience: from earlier work it isknown to exclude the most unreliable cases, such as third-party field descriptions of water drillings.
The application of the quality criterion resulted in theselection of 351,161 drillings (Fig. 3). The average number ofdrillings per km2 (i.e. per cell) decreases from 8.6 for the uppermodel layer to 0.2 for the lower layer. The average data-qualityalso decreases with depth: the deeper a drilling, the greaterthe chance that (cheap) suction or airlift drilling methods wereused. As these methods tend to underestimate the shares ofthe fine fractions, aggregate yields may tend to be increasinglyoverestimated with depth.
Model characteristics
The primary model cell attributes are its shares of gravel,sand, clay/loam, peat/gyttja and ‘other’ material (e.g. thechalk occurring in the southernmost part of the country),calculated from borehole data. The shares of the lithologiesthat we distinguish were interpolated over cells lacking drillingdata, using linear kriging (Fig. 4; e.g. Deutsch & Journel,1998). As a next step, aggregate yields for each cell werecalculated using the criteria given in Table 1. Aggregate yieldswere then interpolated over cells which lack grain sizeinformation or drilling data altogether, and multiplied withinterpolated shares of sand and gravel lithologies in order toobtain absolute values.
The above approach accounts for the grade of aggregateresources. Their exploitability also depends on the thickness
Netherlands Journal of Geosciences — Geologie en Mijnbouw | 84 – 4 | 2005382
Table 1. The application of natural sand and gravel as aggregates according to their M63 value. Category and class definitions are cf. Anonymous (1989;
1990); CMZ = concrete and mortar sand. See text for further explanation.
Category Class Median grain size Aggregate yield
(;) (<)
Fine sand Extremely fine 63 – 105 µm 0%
Very fine 105 – 150 µm 0%
Moderately fine 150 – 210 µm
Coarse sand Moderately coarse 210 – 300 µm 50% (CMZ)
Very coarse 300 – 420 µm
Extremely coarse 420 – 2000 µm 100% (CMZ)
Gravel Fine 2 – 5.6 mm 100% (CMZ, gravel)
Moderately coarse 5.6 – 16 mm 100% (gravel)
Very Coarse 16 – 63 mm

of the overburden that would have to be removed, and ofintercalations of fine grained material which may hamper theextraction process (generally some dredging technique). Inorder to address these factors, routines were used which analyzevertical cell stacks. An overburden routine discards aggregateyields if covered by more than 5 m of clay, loam, peat or gyttja,i.e. the shares of these materials times the thickness of thecell stack above the first aggregate occurrence. An intercalationcriterion, acting from 5 m below the surface downwards, addsup the amount of these materials present and discards aggregateyields below intercalations with a cumulative thickness of 2 mor over.
Results
General
Fig. 5 (left 3 panels) shows cumulative aggregates thicknessesdown to 10, 30 and 50 m below the surface (see Fig. 6 for anappraisal of the underlying model). The results clearly fit theaforementioned general geological trends (Fig. 1, 2). In theirnorthern extent, aggregates predominantly occur in ice-pushed structures, and are scarcer, absent or covered in theassociated glacial basins which generally have fine-grainedinfillings. In the Rhine-Meuse delta, aggregates occurrencesare mainly upper Pleistocene river sands. The east-to-west
decrease of aggregate volumes is a clear reflection of bothdownstream fining and a westward-thickening overburden. Inthe south, aggregates occurrences are arranged in the NW-SEtrending horst-graben structures.
The total aggregate volume down to 50 m below the surfaceis estimated at ~520 · 109 m3 (Fig. 7, 8). Some 240 · 109 m3
of this amount is considered exploitable according to theabove geological criteria. Fig. 5 shows that especially theaggregates occurrences in Zuid-Holland are not consideredexploitable, due to their overburden. In fact, the westernmostDutch extraction of concrete and mortar sand occurs just eastof the Utrecht – Zuid-Holland boundary, at the westernmostextent of the central Dutch aggregate resources according toour exploitability criteria (middle and lower right panels ofFig. 5). About 80% of the exploitable aggregate resources occurin 5 out of 12 provinces (i.e., Limburg, Drente, Noord-Brabant,Overijssel and Gelderland; Fig. 9), and about half are situatedbelow built-up areas or nature reserves, and are therefore inprinciple inaccessible. Note that a 50% accessibility is probablygreatly overestimated. First, we have not taken into accountthe access limitations presented by scattered buildings andinfrastructure in open country. More importantly, variousplanning restrictions may apply to aggregates extraction,even outside protected nature or landscapes.
Gravel resources
Most of the Dutch aggregate resources consist of coarse sand,with gravel as an admixture or intercalation. Shading in Fig. 5corresponds with the occurrence of coarse gravel, which havebeen mapped for national mineral planning purposes (i.e. forAnonymous, 1994; 2002; note that national mineral planninghas been abandoned in 2003; Van der Meulen, 2005). The areaencompasses the most important Dutch gravel productionsites, that are mainly situated along the upstream Meuse river.The aggregate content of this area down to 50 m below thesurface is about 12 · 109 m3, which amounts to about 25% ofthe aggregate resources in Limburg and to about 2% of theDutch total. Again, about half of this amount is consideredgeologically exploitable (Fig. 10).
383Netherlands Journal of Geosciences — Geologie en Mijnbouw | 84 – 4 | 2005
End depth class (m)
100,000
200,000
300,000
400,000
Nr.ofdrillings
0-1
3-4
6-7
9-10
12-1
3
15-1
6
18-1
9
21-2
2
24-2
5
27-2
8
30-3
1
33-3
4
36-3
7
39-4
0
42-4
3
45-4
6
48-4
9
>50
1 km1 km
1 m a b c
Fig. 3. Red bars: histogram of the end depth of the
drilling data used in our study. Blue bars: the total
number of drillings available to a model layer in the depth
range indicated. A total of 351,161 standardized borehole
descriptions were selected from a total of ~380,000, using
a quality proxy explained in the text.
Fig. 4. Model setup, illustrated by three hypothetical cells from the upper
model layer. For cell a, the shares of distinguished lithologies are
obtained by averaging the layer properties in the appropriate depth range
of three available drillings. The properties of cell c correspond to those of
the one available drilling. The attributes of cell b (i.e. lithology and
aggregate yield) are obtained by linear kriging between cell a and c. The
zero-level in the model space corresponds to land surface.

Netherlands Journal of Geosciences — Geologie en Mijnbouw | 84 – 4 | 2005384
Fig. 5. Aggregate
resources down to 10,
30 and 50 m below the
surface. The left panels
show all resources,
right panels show
exploitable resources,
calculated according to
criteria explained in
the text. Grey shading
in southern Limburg
indicates the occurrence
of coarse gravel (see
text for further expla-
nation). Section line
(c - d) in the upper left
hand panel refers to
Fig. 6.
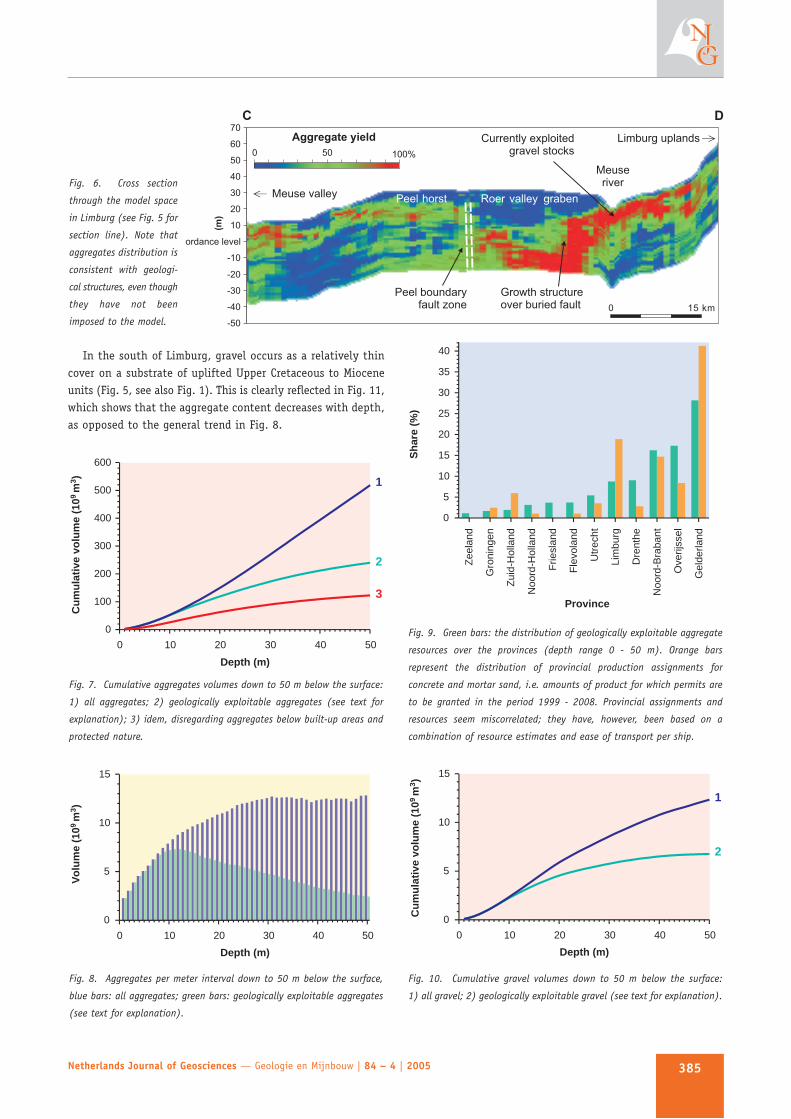
In the south of Limburg, gravel occurs as a relatively thincover on a substrate of uplifted Upper Cretaceous to Mioceneunits (Fig. 5, see also Fig. 1). This is clearly reflected in Fig. 11,which shows that the aggregate content decreases with depth,as opposed to the general trend in Fig. 8.
385Netherlands Journal of Geosciences — Geologie en Mijnbouw | 84 – 4 | 2005
20
ordance level
-30
-50
-40
-20
-10
10
30
40
50
60
70
0 15 km
0 100%50
Aggregate
(m)
yield
C D
Meuseriver
Limburg uplandsCurrently exploitedgravel stocks
Growth structureover buried fault
Peel boundaryfault zone
Roer valley grabenPeel horstMeuse valleyFig. 6. Cross section
through the model space
in Limburg (see Fig. 5 for
section line). Note that
aggregates distribution is
consistent with geologi-
cal structures, even though
they have not been
imposed to the model.
0 10 20 30 40 50
Depth (m)
0
100
200
300
400
500
600
1
2
3
93
Cu
mu
lati
vevo
lum
e(1
0m
)
Fig. 7. Cumulative aggregates volumes down to 50 m below the surface:
1) all aggregates; 2) geologically exploitable aggregates (see text for
explanation); 3) idem, disregarding aggregates below built-up areas and
protected nature.
Sh
are
(%)
0
5
10
15
20
25
30
35
40
Province
Zee
land
Gro
ning
en
Zui
d-H
olla
nd
Noo
rd-H
olla
nd
Frie
slan
d
Fle
vola
nd
Utr
echt
Lim
burg
Dre
nthe
Noo
rd-B
raba
nt
Ove
rijss
el
Gel
derla
nd
Fig. 9. Green bars: the distribution of geologically exploitable aggregate
resources over the provinces (depth range 0 - 50 m). Orange bars
represent the distribution of provincial production assignments for
concrete and mortar sand, i.e. amounts of product for which permits are
to be granted in the period 1999 - 2008. Provincial assignments and
resources seem miscorrelated; they have, however, been based on a
combination of resource estimates and ease of transport per ship.
0 10 20 30 40 50
0
5
10
15
1
2
Depth (m)
93
Cu
mu
lati
vevo
lum
e(1
0m
)
Fig. 10. Cumulative gravel volumes down to 50 m below the surface:
1) all gravel; 2) geologically exploitable gravel (see text for explanation).
0 10 20 30 40 50
0
5
10
15
Depth (m)
93
Vo
lum
e(1
0m
)
Fig. 8. Aggregates per meter interval down to 50 m below the surface,
blue bars: all aggregates; green bars: geologically exploitable aggregates
(see text for explanation).

Concluding remarks
General
Aggregates occur abundantly in the eastern and southern partsof the Netherlands. Some 98% of the aggregates is coarse sand,the size of the geologically exploitable resources correspondsto roughly 7500 times the current annual consumption ofconcrete and mortar sand. The geologically exploitable gravelresources in southern Limburg amount to some 150 annualconsumption equivalents, of which probably only a couple oftens are accessible. Hence, for coarse aggregates, some level ofdependency on imports seems inevitable.
Home production
Mineral planning until the year 2003 has resulted in a concen-tration of large-scale aggregates extraction sites along the Rhineand Meuse in the provinces of Noord-Brabant, Limburg andGelderland. These sites were developed for national supplies,i.e. in order to provide provinces lacking resources with aggre-gates. Under the current policy regime, such large-scale siteswill probably not be permitted anymore. The embedding ofextraction in projects with other goals, which is both stimulatedby the aforementioned building raw materials assessment andenvisaged as the future modus operandi by the extractiveindustry, will most likely also result in a downsizing ofindividual operations. Altogether, the future home productionof aggregates will probably come down to a larger number ofsmaller projects, that will be more evenly distributed over thecountry. A part of the production may well shift to Overijsseland southern Drenthe, where fairly large aggregate stocks arepresent which have not yet been exploited to significant extent.
Future supplies
As it is for the first time in two decades that production hasstopped being regulated, the effects of the recent Dutch policychanges cannot not be predicted. Production figures showthat the production of sand aggregates in 2003 was 25% below
the average level of 1996 - 2000. Unpublished provisional datasuggest that this unprecedented drop has continued to date,seemingly with no real supply problems. In the coming years,production will probably stabilize at some unknown lowerlevel. Available forecasts suggest that consumption will remainstable or increase slightly (e.g. Van der Meulen et al., in press),so eventually the net imports required may well exceed theproduction possibilities in the countries that currently exportto the Netherlands, especially in the German federal state ofNorth Rhine-Westphalia. All the alternative supply options,e.g., production from lower grade marine resources, deep(er)extraction, or imports from more remote areas, will probablybe significantly more expensive.
The question is how much more the Dutch building industryand its commissioners are ultimately prepared to pay for rawmaterials, knowing that vast resources are in principle availablein the country. Large transport distances for low-cost bulkcommodities such as sand may also raise some concerns as tothe sustainability of the path chosen by Dutch policy makers.Dutch aggregates resources will therefore probably keep beingexploited. The embedding concept in the building raw materialsassessment was designed for more acceptable forms ofexploitation; our study basically addresses the localizationaspects of such exploitation.
Application possibilities
Even though the approach taken has been pragmatic ratherthan sophisticated, our study has significantly improved ourappraisal of Dutch aggregate resources. Most limitations of ourmodeling methods and yield calculations can be addressedwhen working on regional scales, handling less data. Examplesof this include the quality proxy for borehole descriptions,and the overburden and intercalation criteria, which can bothbe tuned to regional geological characteristics such as thesedimentary setting and the tectonic history. The approach isintended to be used interactively, allowing aggregate resourcesand their geological exploitability to be defined by end-users.
Disclaimer and acknowledgements
Although the authors adhere to its basic principles, this studydoes not formally comply with the Code for Reporting of MineralExploration Results, Mineral Resources and Mineral Reserves(Anonymous, 2001). In the terms of this code, our study wouldclassify as a reconnaissance mineral resource, apt for mineralor spatial planning purposes by the government. Note that ourresults are not to be used for the purpose of (a) informinginvestors or potential investors and their advisers or (b) satis-fying regulatory requirements. The authors wish to thank theircolleague Wim Dubelaar (TNO, Utrecht, NL), and Mike Petterson(BGS, Keyworth, UK) and an anonymous reviewer for helpfulsuggestions.
Netherlands Journal of Geosciences — Geologie en Mijnbouw | 84 – 4 | 2005386
0 10 20 30 40 50
0.0
0.2
0.4
Depth (m)
93
Vo
lum
e(1
0m
)
Fig. 11. Gravel per meter interval down to 50 m below the surface: blue
bars all aggregates; green bars geologically exploitable aggregates (see
text for explanation).

References
Anonymous, 1989. NEN 5104:1989, Geotechnics; Classification of unconsolidated
soil samples. Netherlands Normalization Institute (NEN; Delft, NL): 24 pp.
Anonymous, 1990. NEN 5104:1989/C1, Geotechnics; Classification of unconsoli-
dated soil samples (amended). Netherlands Normalization Institute (NEN;
Delft, NL): 1 pp.
Anonymous, 1994. Structuurschema Oppervlaktedelfstoffen, Deel 1, Ontwerp
Planologische kernbeslissing (in Dutch). Ministry of Transport, Water
Management and Public Works (The Hague, NL): 243 pp.
Anonymous, 2001. Code for reporting of mineral exploration results, mineral
resources and mineral reserves (the reporting code). Institution of Mining
and Metallurgy (London, UK), European Federation of Geologists (Brussels, B),
Geological Society of London, Institute of Geologists of Ireland (Dublin, IE):
34 pp.
Anonymous, 2002. 2e Structuurschema Oppervlaktedelfstoffen, Deel 1, Ontwerp
Planologische kernbeslissing (in Dutch). Ministry of Transport, Water
Management and Public Works (The Hague, NL): 279 pp.
Anonymous, 2004. Nota Ruimte. Ministry of Spatial Planning, Housing and the
Environment (The Hague, NL): 50 pp.
Braakhekke, W., Litjens, G. & Winden, A., 2003. Over Winnen – Zandwinning
als hefboom (in Dutch). IZGP (Dutch association of sand and gravel producers;
Beuningen, NL): 42 pp.
Deutsch, C.V. & Journel, A.G., 1998. GSLIB Geostatistical software library and
user’s guide (2nd edition). Oxford University Press (Oxford, UK): 369 pp.
De Mulder, E.F.J., Geluk, M.C., Ritsema, I., Westerhoff, W.E. & Wong, Th.E.,
2003. De ondergrond van Nederland. Wolters Noordhof (Groningen, NL): 379 pp.
Kooijman, J., 2003. Haalbaarheidsstudie Authentieke Registratie DINO –
Eindrapportage (in Dutch). Netherlands Institute of Applied Geoscience TNO
(Utrecht, NL): 42 pp.
NEN, 1991. NEN 3835:1991 NL, Mortels voor metselwerk van stenen, blokken of
elementen van baksteen, kalkzandsteen, beton en gasbeton (in Dutch).
Dutch Normalization Institute (NNI/NEN; Delft, NL): 16 pp.
NEN, 1999. NEN 5905:1997/A1:1999 NL, Toeslagmaterialen voor beton –
Materialen met een volumieke massa van ten minste 2000 kg/m2 (in Dutch).
Dutch Normalization Institute (NNI/NEN; Delft, NL): 1 pp.
Peersmann, M.R.H.E., 2005. Geo-Informatieprogramma 2005 (in Dutch).
Netherlands Institute of Applied Geoscience TNO (Utrecht, NL): 200 pp.
Van der Meulen, M.J., 2005. Sustainable mineral development: possibilities and
pitfalls illustrated by the rise and fall of Dutch mineral planning guidance.
In: Petterson, M., McEvoy, F. & Marker, B.R. (eds): Sustainable minerals
operations in the developing world. The Geological Society of London,
Special Publications 250: 225-232.
Van der Meulen, M.J., Broers, J.W., Hakstege, A.L., Van Heijst, M.W.I.M.,
Koopmans, T.P.F. & Pietersen, H.S., in press. Surface Mineral Resources. In:
Wong, Th.E., Batjes, D.A.J. & De Jager, J. (eds): The Geology and geological
resources of the Netherlands. Netherlands Institute of Applied Geoscience
TNO (Utrecht, NL).
Van der Meulen, M.J., Koopmans, T.P.F. & Pietersen, H.S., 2003. Construction
raw materials policy and supply practices in Northwestern Europe. In: Elsen,
J. & Degryse, P. (eds): Industrial Minerals – Resources, Characteristics and
Applications. Aardkundige Mededelingen 13: 19-30.
Weerts, H.J.T., Schokker, J., Rijsdijk, K.F. & Laban, C., 2004. Geologische
overzichtskaart van Nederland / Geological map of the Netherlands.
Netherlands Institute of Applied Geoscience TNO (Utrecht, NL).
387Netherlands Journal of Geosciences — Geologie en Mijnbouw | 84 – 4 | 2005