Full Resolution Simulation for Evaluation of Critical Care ...
10
Full Resolution Simulation for Evaluation of Critical Care Imaging Interpretation; Part 1: Fixed Effects Identify Influences of Exam, Specialty, Fatigue, and Training on Resident Performance Chris L. Sistrom, MD, MPH, PhD, Roberta M. Slater, MD, Dhanashree A. Rajderkar, MD, Joseph R. Grajo, MD, John H. Rees, MD, Anthony A. Mancuso, MD Rationale and Objectives: To describe our full-resolution simulation of critical care imaging coupled with posthoc grading of resident’s interpretations and present results from the fixed effects terms in a comprehensive mixed regression model of the resulting scores. Materials and Methods: The system delivered full resolution DICOM studies via clinical-grade viewing software integrated with a custom built web-based workflow and reporting system. The interpretations submitted by participating residents from 47 different programs were graded (scores of 010) on a case by case basis by a cadre of faculty members from our department. The data from 5 yearly (20142018) cycles consisting of 992 separate 65 case, 8 hour simulation sessions were collated from the transaction records. We used a mixed (hierarchi- cal) statistical model with nine fixed and four random independent variables. In this paper, we present the results from the nine fixed effects. Results: There were 19,916/63,839 (27.0%, CI 26.7%27.4%) scores in the 02 range (i.e., clinically significant miss). Neurological cases were more difficult with adjusted scores 2.3 (CI 1.93.2) lower than body/musculoskeletal cases. There was a small (0.3, CI 0.200.38 points) but highly significant (p<0.0001) decrease in score for the final 13/65 cases (fifth quintile) as evidence of fatigue during the last hour of an 8 hour shift. By comparing adjusted scores from mid-R1 (quarter 3) to late-R3 (quarter 12) we estimate the training effect as an increase of 2.2 (CI 1.902.50) points. Conclusion: Full resolution simulation based evaluation of critical care radiology interpretation is being conducted remotely and efficiently at large scale. Analysis of the resulting scores yields multiple insights into the interpretative process. Key Words: Radiology education; Critical care imaging; Simulation; Competency milestones; Entrustable professional activities; Certification. © 2020 The Association of University Radiologists. Published by Elsevier Inc. This is an open access article under the CC BY-NC-ND license. (http://creativecommons.org/licenses/by-nc-nd/4.0/) INTRODUCTION T he Accreditation Council for Graduate Medical Edu- cation (ACGME)in its “envelope of expect- ations” indicates that a trainee in Diagnostic Radiology should reach the level of “competent” late in the second to beginning of the third year of training (1). At a level of “competent,” the resident is theoretically prepared to engage in the entrustable professional activity (EPA) of distance (out of institution) supervision of image interpreta- tion with preliminary reporting and consultation (15). This generally occurs in the setting of after-hours coverage with faculty directly available for backup consultation from home. Such an independent experience is essential and required, as called for in section VI.A.2 of the ACGME Common Pro- gram Requirements document for radiology residency pro- grams (1). Anticipating the importance of this transition point in training, the ACGME has asked for objective documentation, within the Milestones Project (1), that residents are prepared for this EPA, which provides for advancement in graded authority and responsibility. Based on current milestone pro- jections, such an objective assessment methodology of this preparedness was to be in place by 2018. In order to fulfill this mandate, our group developed a Critical Care Radiology Simulation (CCRS) which involved interpreting full sets of Acad Radiol 2020; &:1–10 From the Department of Radiology, University of Florida Health Center, P.O. Box 100374, JHMHC, 1600 SW Archer Road, Gainesville, FL 32610-0374. Received August 31, 2019; revised November 1, 2019; accepted November 1, 2019. Address correspondence to: C.L.S. e-mail: [email protected]fl.edu © 2020 The Association of University Radiologists. Published by Elsevier Inc. This is an open access article under the CC BY-NC-ND license. (http://creativecommons.org/licenses/by-nc-nd/4.0/) https://doi.org/10.1016/j.acra.2019.11.023 1 ARTICLE IN PRESS
Transcript of Full Resolution Simulation for Evaluation of Critical Care ...

ARTICLE IN PRESS
Full Resolution Simulation forEvaluation of Critical Care ImagingInterpretation; Part 1: Fixed Effects
Identify Influences of Exam, Specialty,Fatigue, and Training on Resident
Performance
Chris L. Sistrom, MD, MPH, PhD, Roberta M. Slater, MD, Dhanashree A. Rajderkar, MD,Joseph R. Grajo, MD, John H. Rees, MD, Anthony A. Mancuso, MD
A
FrBR20
©Th(hht
Rationale and Objectives: To describe our full-resolution simulation of critical care imaging coupled with posthoc grading of resident’sinterpretations and present results from the fixed effects terms in a comprehensive mixed regression model of the resulting scores.
Materials and Methods: The system delivered full resolution DICOM studies via clinical-grade viewing software integrated with a custombuilt web-based workflow and reporting system. The interpretations submitted by participating residents from 47 different programs weregraded (scores of 0�10) on a case by case basis by a cadre of faculty members from our department. The data from 5 yearly (2014�2018)cycles consisting of 992 separate 65 case, 8 hour simulation sessions were collated from the transaction records. We used a mixed (hierarchi-cal) statistical model with nine fixed and four random independent variables. In this paper, we present the results from the nine fixed effects.
Results: There were 19,916/63,839 (27.0%, CI 26.7%�27.4%) scores in the 0�2 range (i.e., clinically significant miss). Neurological caseswere more difficult with adjusted scores 2.3 (CI 1.9�3.2) lower than body/musculoskeletal cases. There was a small (0.3, CI 0.20�0.38points) but highly significant (p<0.0001) decrease in score for the final 13/65 cases (fifth quintile) as evidence of fatigue during the lasthour of an 8 hour shift. By comparing adjusted scores from mid-R1 (quarter 3) to late-R3 (quarter 12) we estimate the training effect as anincrease of 2.2 (CI 1.90�2.50) points.
Conclusion: Full resolution simulation based evaluation of critical care radiology interpretation is being conducted remotely and efficientlyat large scale. Analysis of the resulting scores yields multiple insights into the interpretative process.
Key Words: Radiology education; Critical care imaging; Simulation; Competency milestones; Entrustable professional activities; Certification.
© 2020 The Association of University Radiologists. Published by Elsevier Inc. This is an open access article under the CC BY-NC-NDlicense. (http://creativecommons.org/licenses/by-nc-nd/4.0/)
INTRODUCTION
T he Accreditation Council for Graduate Medical Edu-cation (ACGME)�in its “envelope of expect-ations”� indicates that a trainee in Diagnostic
Radiology should reach the level of “competent” late in thesecond to beginning of the third year of training (1). At alevel of “competent,” the resident is theoretically prepared toengage in the entrustable professional activity (EPA) of
cad Radiol 2020;&:1–10
om the Department of Radiology, University of Florida Health Center, P.O.ox 100374, JHMHC, 1600 SW Archer Road, Gainesville, FL 32610-0374.eceived August 31, 2019; revised November 1, 2019; accepted November 1,19. Address correspondence to: C.L.S. e-mail: [email protected]
2020 The Association of University Radiologists. Published by Elsevier Inc.is is an open access article under the CC BY-NC-ND license.ttp://creativecommons.org/licenses/by-nc-nd/4.0/)tps://doi.org/10.1016/j.acra.2019.11.023
distance (out of institution) supervision of image interpreta-tion with preliminary reporting and consultation (1�5). Thisgenerally occurs in the setting of after-hours coverage withfaculty directly available for backup consultation from home.Such an independent experience is essential and required, ascalled for in section VI.A.2 of the ACGME Common Pro-gram Requirements document for radiology residency pro-grams (1).
Anticipating the importance of this transition point intraining, the ACGME has asked for objective documentation,within the Milestones Project (1), that residents are preparedfor this EPA, which provides for advancement in gradedauthority and responsibility. Based on current milestone pro-jections, such an objective assessment methodology of thispreparedness was to be in place by 2018. In order to fulfillthis mandate, our group developed a Critical Care RadiologySimulation (CCRS) which involved interpreting full sets of
1

ARTICLE IN PRESSSISTROM ET AL Academic Radiology, Vol&, No&&,&& 2020
DICOM images in the domain of critical care radiology.Sixty-five cases across all radiology subspecialties, with a plau-sible range of difficulty including normal studies constitutethis 8 hour simulation experience.
Simulation has a historic yet evolving role in graduate medi-cal education. Introduced as a means for teaching manual dex-terity and hand-eye coordination for interventional procedures,simulation has become a tool for delivering educational con-tent, facilitating systems-based practice, and training for stan-dardized examinations (6,7). Simulation-based training inradiology is in its infancy but offers immense potential forobjective evaluation of interpretative competence (8,9). Othershave begun to realize the potential of simulation for assessingmilestones and executing the EPA of managing acute radiologicemergencies (10,11). In order to test our residents for readinessof graded responsibility and authority, we developed theCCRS to evaluate competency in managing critical care radiol-ogy cases in a high fidelity environment.
The CCRS has now been delivered 8 times over the last8 years. The results of five most recent iterations(2014�2018) of the CCRS, after a testing and maturationperiod of 3 years, are the subject of this two-part report. Thispaper (Part 1) will lay out our analytic framework in a mixedmodel and quantify the fixed effects of 9 factors (e.g., examtype, clinical scenario, level of training, and etc.) on residentperformance. Part 2 will report on four identifying variables(case, resident, program, and grader) estimated jointly asuncorrelated random effects in the same mixed model.
MATERIALS ANDMETHODS
Ethics
This research was approved by our Institutional ReviewBoard and certified as being compliant with the Health Insur-ance Portability and Accountability Act). Additionally, theidentities of residents being evaluated, their respective resi-dency programs, and the radiologist graders were blinded(with an ‘honest broker’ mechanism) for analysis and will bepresented only as unlabeled scatterplot points for Part 2.
Case Creation and Curation
The case material used for testing residents consisted of origi-nal full DICOM image sets obtained on patients being seenin our emergency department and/or during a hospitaladmission. Gender specific patient names were assigned froma random name generator. Unique random numbers wereused to represent medical record number and accession num-ber for each patient and exam. Patient age at the time of orig-inal presentation was recorded and used to calculate an offsetfrom the simulation date to form a dynamic date of birth.
In addition to the full DICOM image sets and demo-graphics, we constructed a clinical scenario from the elec-tronic medical record using the originally recorded“Indications for Exam” free text, ICD10 codes associated in
2
the order composer, and clinician notes. These elementswere abstracted into separate “Exam Indications” and “Addi-tional History” properties for display in the case presenterinterface. For each case we assigned an “acuity” level byinvestigator consensus in keeping with the ACR ActionableFindings Initiative (13). Finally, a structured answer key wasconstructed as a guide for scoring a narrative report about thecase on a 0�10 scale. This consisted of a list of observationaland/or diagnostic findings, each having a full or partial creditpoint value. These values were weighted by relative clinicalimportance such that they summed to 10 in aggregate.
Test Case Administration
The American College of Radiology (ACR) maintains aweb-based, multi-purpose and customizable educational soft-ware stack called Radiology Content Management System(RCMS, a.k.a. Cortex). Full DICOM image sets are de-iden-tified and uploaded by contributors with the ACR-TRIADsystem (12). Using the basic case material as substrate, RCMSprovides a flexible and dynamic authoring system for didacticinstruction about imaging interpretation and reporting withbuilt in self-testing as well as support for summative evalua-tion. In support of our project, ACR customized, accordingto our unique specifications, a function set of the RCMSenabling us to remotely administer a full resolution radiologysimulation, collect interpretative responses, record scoresassigned by graders, and download raw instance data. Weused those results to make customized reports to individualresidents and their program directors. Figure 1 depicts thesimulation work queue, case detail, and response captureform. Each resident was given 8 hours to complete 65 casesassigned to them in the simulation work queue. The order ofcases was randomized for each resident session. This allowedus to test the effect of cognitive fatigue on performance(score) in our statistical analysis.
For each of the 65 cases in a simulation session, once aninterpretation had been entered and submitted, the casemoved over to a completed queue and remained visible. Res-idents could bring any of the completed cases back, reviewthe images, and submit revised or additional findings and/oracuity assertions. These were recorded, marked as “Adden-dum” and shown to graders along with the first submission.
Grading of Responses
Simulation case responses were collected as they were sub-mitted and placed into a web-based grading queue for subse-quent scoring. Graders score responses within their generalsubspecialty area (i.e., body, neuro, musculoskeletal, pediat-ric) by selecting from a worklist to score them. The list wasorganized so that graders work through all unscored submis-sions for each case. The scoring form showed responsesentered by the trainee alongside structured key findings forthe case including true/false assertions and weights for scor-ing. Figure 2 shows examples of the grading workflow.

Figure 1. Screen shot of worklist, case presentation, and interpretation submission screen as seen by residents taking the simulation. Notethat the patient names were randomly generated.
ARTICLE IN PRESSAcademic Radiology, Vol&, No&&,&& 2020 FULL RESOLUTION SIMULATION FOR EVALUATION
Measurement Paradigm
Our framework starts with a simulation case consisting of a spe-cific clinical scenario and a diagnostic imaging examination,both involving the same real patient. We stipulate a “gold stan-dard” set of findings accurately described and characterized in an“ideal” interpretative report agreed upon by consensus of expert,sub-specialty trained radiologists. The clinical scenario and find-ings are typical in that they did occur in actual clinical experi-ence and represent cases that practicing radiologists will see andwould be expected to correctly interpret.An experimental unit is instantiated when a simulation
subject is given the clinical scenario, asked to review the fullset of images on a diagnostic workstation, and create an inter-pretation by dictating and/or typing. The outcome is createdwhen a grader reviews the subject’s interpretation, refers tothe findings key, and records a 0�10 score. The score for aresident’s report quantifies the grader’s assessment of the clini-cal relevance and correctness of that response.Graders were trained to consider their scores in the context of a
clinical “read-out” of the simulation cases, conducted by them-selves, immediately following an unsupervised “work shift” bythe resident trainee. The scores are considered to be absolute suchthat the response is scored at face value regardless of the trainingor experience of the subject being evaluated. In real life situations,a score <3 would often prompt a call to the ordering service toremediate a clinically significant error; note that this error could
be either a miss or an overcall. Score >7 would mean that thetrainee’s response (i.e., their preliminary reading) was essentiallycorrect and subsequent report completion and finalizing work-flow could proceed routinely. Scores between 3 and 7 represent asomewhat broader middle ground. Here, the interpretation inquestion requires editing to correct problematic assertions and/orrectify substantive omissions prior to being finalized and distrib-uted. In our hypothetical situation, the supervising radiologistwould seek to remediate the trainee in question.
Statistical Analysis
We consider the scores as discrete measurements taken from anunderlying continuous distribution. Each score represents the inter-play between three elements: case (n=321), resident (n=773),and grader (n=16). At the time they participated, each subject wasenrolled in one of 47 residency programs, representing a fourth.We estimated these traits as four independent random effects in amulti-level (hierarchical) model with fixed effects including factorssuch as exam modality, sub-specialty, care setting, clinical acuity,resident training level, order of the case within the simulation ses-sion, patient gender, and age group. The model is written as:
RSijk ¼ dXi þ uYj þ λZk þ B00 þ B0c þ B0r þ B0p
þ B0g þ eijk ð1Þ
3

Figure 2. Screen shots of worklist, resident responses, answer key, and score entry form as seen by the graders. Examples of two relativelysimple cases (A) and a rather more complex one (B) are shown.
ARTICLE IN PRESSSISTROM ET AL Academic Radiology, Vol&, No&&,&& 2020
Table 1 lists and defines all the symbols, including theindex subscripts (i, j, k) fixed (X, Y, Z) and random (c, r, p,g) effects. We used PROC MIXED in SAS (Version 9.4,Cary, NC) to estimate the model and Tableau (Version2019.1, Seattle, WA) for tabulation and graphs. It is impor-tant to note that including the four random effects (case,resident, program, and grader) in the model ensures that
4
the calculation of coefficients, adjusted mean scores, andp-values for the fixed effects would be unbiased. That isbecause when random effects are included in a mixedmodel specification for PROC MIXED, the repeated mea-surement across them is fully accounted for which insuresaccurate (i.e., not inflated) calculation of all the standarderrors.

TABLE 1. Key to Terms in Hierarchical Statistical Model (Equation 1)
Symbol Meaning Details
RSijk response score Assigned by grader to response for each of 65 cases submitted by aresident during a simulation session.
I the ith item n = 63,839dXi Item level fixed effect coeffi-
cients & variablescase order during simulation session (quintiles: 1�5)had addendum (yes, no)
J the jth case n = 321uYj Case level fixed effect coeffi-
cients & variablesspecialty (neuro, mks, body)modality (XR, CR, MR, NUC, US)patient age group (adult, pediatric)patient gender (male, female)patient setting (emergency, inpatient)acuity (routine/negative, priority, urgent, emergent)
K the kth simulation session n = 992lZk Session level fixed coefficients
and variablesresident training (quarters: 2�16)
eijk error term (residual) centered on 0, normal distributionB00 Intercept grand mean of all scoresB0C Case random intercept score offsets (n = 321)B0R Resident random intercept score offsets (n = 773)B0P Program random intercept score offsets (n = 47)B0G Grader random intercept score offsets (n = 16)
ARTICLE IN PRESSAcademic Radiology, Vol&, No&&,&& 2020 FULL RESOLUTION SIMULATION FOR EVALUATION
RESULTS
The program (and our analytic sample) grew steadily over thefive years of study (2014�2018). Table 2 lists the unadjustedmean scores (with 95% confidence interval) for each fixedeffect variable and cycle year. Figure 3A is a stacked histo-gram, colored by year, with score frequency and percentage.The scores have a bimodal distribution and in Figure 3B, wehave binned them into three groups. These reflect the clinicallogic we asked graders to use as described previously. Overall,46.4% (CI 46.0�46.8%) of the resident interpretations were
Figure 3. Histogram of individual (A) and grouped (B) scores. Cumulatifive simulation cycles from 2014 through 2018.
correct (score=8�10) while 27.0% (CI 26.7�27.4%) were inthe significant miss range (score = 0�2).
Table 3 lists the jointly estimated omnibus (Type 3) tests ofsignificance for the nine fixed effect variables in the mixedmodel. Six of nine variables had significant influence on thescore. These included case order within the simulation session(p<0.0001), whether or not the resident made an addendumto their interpretation after initial submission (p=0.0018), thespecialty (neurologic, body, musculoskeletal) of the case(p<0.0001), our consensus case acuity (p<0.0001), and
ve counts (left vertical axis) and percentages (right vertical axis) over
5

TABLE 2. Unadjusted Score Statistics and Counts of Sessions, Cases, Residents, Programs, and Graders, Stratified by Nine FixedEffects Variables and Year of Study
Scores Number Of Unique
Variable Level Mean (95% CI) n Sessions Cases Residents Programs Graders
Case Order (quintile) 1 6.13 (6.07�6.20) 12,818 992 291 773 47 162 6.09 (6.02�6.15) 12,872 992 304 773 47 163 6.19 (6.13�6.26) 12,869 992 311 773 47 164 5.83 (5.76�5.90) 12,837 991 310 773 47 165 5.52 (5.45�5.59) 12,443 985 311 771 47 16
Had Addendum no 5.95 (5.92�5.98) 61,754 992 321 773 47 16yes 6.04 (5.89�6.20) 2,085 681 314 573 45 15
Case Specialty neuro 4.56 (4.50�4.63) 13,165 992 69 773 47 10body 6.29 (6.25�6.33) 39,847 992 196 773 47 15msk 6.41 (6.34�6.49) 10,827 992 56 773 47 10
ExamModality xr 6.11 (6.04�6.17) 17,803 992 92 773 47 14ct 5.87 (5.83�5.91) 30,310 992 154 773 47 16mr 5.37 (5.27�5.46) 6,081 988 31 770 47 10nu 7.47 (7.26�7.69) 1,301 986 6 770 47 9us 6.15 (6.06�6.24) 8,344 992 38 773 47 14
Patient Age Group adult 6.07 (6.04�6.11) 48,292 992 241 773 47 16ped 5.59 (5.53�5.66) 15,547 992 80 773 47 16
Gender Male 6.05 (6.01�6.09) 31,891 992 166 773 47 16Female 5.86 (5.82�5.90) 31,948 992 155 773 47 16
Patient Setting Emergency 5.98 (5.95�6.01) 58,075 992 291 773 47 16Inpatient 5.74 (5.63�5.84) 5,764 992 30 773 47 14
Case Acuity 1-routine 7.33 (7.23�7.42) 8,148 992 43 773 47 142-priority 6.12 (6.06�6.19) 14,153 670 83 538 34 153-urgent 5.70 (5.66�5.74) 32,214 992 150 773 47 164-emergent 5.39 (5.32�5.46) 9,324 992 45 773 47 16
Resident Training(quarters)
3 5.49 (5.36�5.61) 3,929 61 321 61 3 104 5.66 (5.62�5.70) 40,472 631 321 587 45 165 6.43 (6.04�6.82) 388 6 255 6 4 37 6.91 (6.77�7.05) 2,466 38 258 38 2 88 6.55 (6.49�6.62) 11,590 179 321 178 18 169 6.38 (6.16�6.60) 1,224 19 258 19 4 411 6.58 (6.27�6.90) 390 6 65 6 1 412 6.97 (6.80�7.14) 1,820 28 193 28 3 1115 6.72 (6.33�7.10) 260 4 65 4 1 416 7.15 (6.96�7.34) 1,300 20 258 20 2 11
Year 2014 6.39 (6.29�6.48) 6,674 103 65 103 9 42015 6.17 (6.09�6.26) 8,202 127 65 127 16 22016 6.15 (6.08�6.22) 12,671 197 65 197 25 112017 5.73 (5.67�5.80) 15,623 243 65 243 29 102018 5.78 (5.73�5.83) 20,669 322 65 322 41 5
Grand Total 5.955 (5.95�5.96) 63,839 992 321 773 47 16
msk, musculoskeletal, ped, pediatric.
ARTICLE IN PRESSSISTROM ET AL Academic Radiology, Vol&, No&&,&& 2020
resident length of training (p<0.0001) as measured by howmany quarters had elapsed between starting residency andwhen they took the simulation. Variables with no significanteffect on score were exam modality and care setting as well aspatient age group and gender. Figure 4 is a Forest plot ofadjusted mean scores (with 95% confidence intervals) foreach level of the fixed effects variables. Figure 5 shows themodel coefficients (with 95% confidence intervals) from thesame fixed effect variables and levels as in Figure 2. Thesecoefficients have the same scale as the analyzed scores. Thus,
6
they can be interpreted as “score offsets” for a given variablelevel compared to reference offset of zero (uppermost levelswith no bar on Figure 5).
This paper is the first of two, and, in Part 2, we will fullyreport results for each of the random effect variables, indi-cating how they contribute to score variation. The mixedmodel estimates a score offset for each case, resident, pro-gram, and grader. This allows us to reliably quantify casedifficulty, resident competence, program effectiveness, andgrader influence.

TABLE 3. Fixed Effects Joint Significance (Type 3)
Variable name Levels F Value p Value
Case order (quintile) 5 15.34 <0.0001**Had addendaYes, no
2 9.72 0.0018**
SpecialtyNeuro, msk, body
3 22.11 <0.0001**
Exam modalityxr, ct, mr, nuc, us
5 2.33 0.0532
Patient age groupAdult, pediatric
2 0.06 0.8069
Patient genderMale, female
2 0.04 0.844
Patient settingEmergency, inpatient
2 0.57 0.4497
Case acuity (consensusdefinition)
4 7.25 <0.0001**
Resident training2�17 quarters
10 76.04 <0.0001**
** Statistically significant.
ARTICLE IN PRESSAcademic Radiology, Vol&, No&&,&& 2020 FULL RESOLUTION SIMULATION FOR EVALUATION
DISCUSSION
Case Order and Fatigue
There was a decrease in reader performance throughout aneight hour shift reaching significance (p<0.037) around
6 hours (4th quintile). By the last hour (5th quintile) scoreswere 0.3 (95% CI 0.20�0.38) points lower (p<0.0001) thanat start of shift (1st quintile). We attribute this to cognitivefatigue and believe that there is a temporal dose effect, reach-ing significance between 6 and 7 hours. This has been studiedby others who suggest a tipping point for degraded interpre-tive accuracy around 10 hours (13�15). Our results are con-sistent with theirs perhaps with more power to detect smallincremental declines earlier.
Report Addendums
When residents did go back to review a case and made anaddendum during the same simulated shift (n= 2085/63,839,3.3%), they scored significantly higher (p = 0.002). The effectsize was rather small: 0.22 (95% CI 0.08�0.36) points. The useof addenda was widespread across sessions, cases, and residents.For example, at least one addendum was made during 68%(681/992) of sessions and for 98% (314/321) of cases. Likewise,74% (573/773) of residents made at least one addendum.
Case Characteristics
Neuroradiology cases were the most difficult to interpret cor-rectly (p<0.0001) with effect size of 2.3 (95% CI 1.9�3.2)points lower than body and musculoskeletal oriented cases,
Figure 4. Adjusted mean scores (95% CI)for fixed effects variables. Dashs (�) repre-sent the reference levels and asterisks (**)indicate significance. Bars also represent95% confidence intervals. Green = refer-ence level, Red = significantly differentfrom reference level, Blue = not signifi-cantly different from reference level. “(Colorversion of figure is available online.)”
7
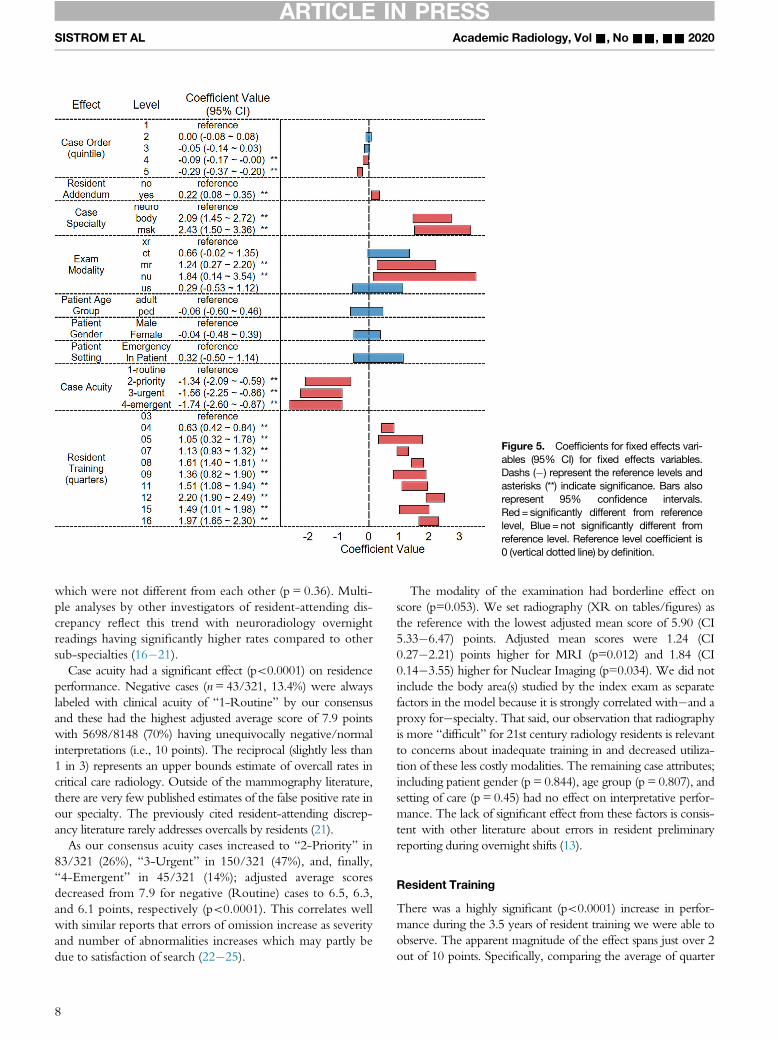
Figure 5. Coefficients for fixed effects vari-ables (95% CI) for fixed effects variables.Dashs (�) represent the reference levels andasterisks (**) indicate significance. Bars alsorepresent 95% confidence intervals.Red= significantly different from referencelevel, Blue = not significantly different fromreference level. Reference level coefficient is0 (vertical dotted line) by definition.
ARTICLE IN PRESSSISTROM ET AL Academic Radiology, Vol&, No&&,&& 2020
which were not different from each other (p = 0.36). Multi-ple analyses by other investigators of resident-attending dis-crepancy reflect this trend with neuroradiology overnightreadings having significantly higher rates compared to othersub-specialties (16�21).
Case acuity had a significant effect (p<0.0001) on residenceperformance. Negative cases (n= 43/321, 13.4%) were alwayslabeled with clinical acuity of “1-Routine” by our consensusand these had the highest adjusted average score of 7.9 pointswith 5698/8148 (70%) having unequivocally negative/normalinterpretations (i.e., 10 points). The reciprocal (slightly less than1 in 3) represents an upper bounds estimate of overcall rates incritical care radiology. Outside of the mammography literature,there are very few published estimates of the false positive rate inour specialty. The previously cited resident-attending discrep-ancy literature rarely addresses overcalls by residents (21).
As our consensus acuity cases increased to “2-Priority” in83/321 (26%), “3-Urgent” in 150/321 (47%), and, finally,“4-Emergent” in 45/321 (14%); adjusted average scoresdecreased from 7.9 for negative (Routine) cases to 6.5, 6.3,and 6.1 points, respectively (p<0.0001). This correlates wellwith similar reports that errors of omission increase as severityand number of abnormalities increases which may partly bedue to satisfaction of search (22�25).
8
The modality of the examination had borderline effect onscore (p=0.053). We set radiography (XR on tables/figures) asthe reference with the lowest adjusted mean score of 5.90 (CI5.33�6.47) points. Adjusted mean scores were 1.24 (CI0.27�2.21) points higher for MRI (p=0.012) and 1.84 (CI0.14�3.55) higher for Nuclear Imaging (p=0.034). We did notinclude the body area(s) studied by the index exam as separatefactors in the model because it is strongly correlated with�and aproxy for�specialty. That said, our observation that radiographyis more “difficult” for 21st century radiology residents is relevantto concerns about inadequate training in and decreased utiliza-tion of these less costly modalities. The remaining case attributes;including patient gender (p = 0.844), age group (p = 0.807), andsetting of care (p = 0.45) had no effect on interpretative perfor-mance. The lack of significant effect from these factors is consis-tent with other literature about errors in resident preliminaryreporting during overnight shifts (13).
Resident Training
There was a highly significant (p<0.0001) increase in perfor-mance during the 3.5 years of resident training we were able toobserve. The apparent magnitude of the effect spans just over 2out of 10 points. Specifically, comparing the average of quarter

Figure 6. Adjusted mean scores and 95%Confidence Intervals (Blue circles and bars) byresident training (3-16 quarters). Linear trend(A) solid red line from residency start (0 years/quarters) to end (4 years/16 quarters). Learningeffect is just under 0.5 points per year. Loggrowth model (B) fits the data better (R-Squared 0.81 compared to 0.68). The asymp-tote is 10, by definition. “(Color version offigure is available online.)”
ARTICLE IN PRESSAcademic Radiology, Vol&, No&&,&& 2020 FULL RESOLUTION SIMULATION FOR EVALUATION
12 (late R3) with quarter 3 (mid R1), the modeled score differ-ence is 2.2 (CI 1.90�2.50) points. The average of quarters 12and 16 (late R3/R4) is 1.74 (CI 1.41�2.47) points higher thanquarter 3 (mid R1). Visually (Figs 4�6) we might be temptedto infer a “plateau” effect in the R4 year. Quantitatively, thereis a tiny, nonsignificant (p = 0.73), decrease from quarters 12 to16 of 0.06 (CI -0.38�0.27) points.Figure 6 depicts the adjusted mean scores for each quarter
with 95% confidence intervals. The horizontal axis is set toyears for clarity. In Figure 6A, a simple linear trend with zerointercept is shown. Note that the R-Squared (0.68) is low.This is not surprising because human skill sets are described ashaving a “learning curve”. On the other hand, Figure 6B hasbeen annotated with a basic log growth trend. Not only doesthe associated R-Squared (0.81) indicate a better fit, but thecurve is more consistent with our conceptual understandingand educational theory.
Our results complement and extend those of Ganguli et.al., who conducted a 20 case simulation based assessment ofR1-R4 residents (n»56) from a single program for 5 years.Their resident’s interpretative responses were graded bysenior radiologists on a 3 level ordinal scale and reported aspercent correct in the papers. The percent correct showedaverage increase of 71% to 86% from R1�R4. Statisticallysignificant (p<0.05) temporal learning effect was demonstra-ble between the R1 cohort and the upper levels (26�28).
General Considerations
This full resolution Critical Care Radiology Simulation(CCRS) evaluation encompasses three essential componentEPAs: observational skills, interpretive skills (once properobservations are made), and professional behavior. It departs
9

ARTICLE IN PRESSSISTROM ET AL Academic Radiology, Vol&, No&&,&& 2020
from other competency evaluation rubrics in four critical ele-ments of its methodology. First, it provides the full set ofDICOM images generated in “real life” for the critical careradiology scenario, i.e., an imaging study and defined clinicalsituation at hand. Second, the participants must assert, in theirown words, whether the study is normal or abnormal bydelivering their consultation in a short written response for-mat. Third, the test set includes normal studies. These firstthree key elements eliminate the shortcomings of “pretestbias” of leading questions and artificial thought processesimposed by multiple-choice questions and selected images aswell as the “given”, in other testing methods, that the imagesin question are known to be abnormal. Fourth and finally,the CCRS embodies the professional behavioral objectives ofthe consultative process by requiring an understanding ofclinical context, production of a duly expected work productand properly communicating the acuity of the clinical sce-nario at hand, inclusive of proper advice going forward, ifrequired by scenario and study findings. All of this is requiredto get a full credit “10” score on each case.
CONCLUSION
We have shown that it is possible to simulate and evaluatecompetence in the interpretative tasks faced by radiology resi-dents working in critical care (overnight call) settings.Accounting for and measuring fixed effects (e.g., case mix,level of training, fatigue, and etc.) is necessary for unbiasedmeasurement of resident preparedness and provide manyinsights about study characteristics, work flow and process. Inthe second part of this paper, we will report on estimates ofcase difficulty and resident competence as random effects.
ACKNOWLEDGMENTS
Since 2012, the American College of Radiology (ACR) hasprovided a customized institutional “sandbox” for our pro-gram on their Radiology Content Management System(RCMS, a.k.a. “Cortex”). Further details are in Materials andMethods. Visage Imaging Inc. (San Diego, CA) donated useof their enterprise imaging platform server and web based cli-ent software (Version 7) for fully functional diagnostic qualitystudy visualization during the simulations.
REFERENCES
1. ACGME Common Program Requirements [Internet]. 2017[cited 2018Nov 20].
2. Vydareny KH, Amis ES, Becker GJ, et al. Diagnostic Radiology Mile-stones. J Grad Med Educ 2013; 5(1s1):74–78.
3. ten Cate TJO, Snell L, Carraccio C. Medical competence: the interplaybetween individual ability and the health care environment. Med Teach2010; 32(8):669–675.
10
4. ten Cate O, Scheele F. Competency-based postgraduate training: canwe bridge the gap between theory and clinical practice? Acad Med2007; 82(6):542–547.
5. ten Cate O. Entrustability of professional activities and competency-based training. Med Educ 2005; 39(12):1176–1177.
6. Willis RE, Van Sickle KR. Current Status of Simulation-Based Training inGraduate Medical Education. Surg Clin North Am 2015; 95(4):767–779.
7. Orledge J, Phillips WJ, Murray WB, et al. The use of simulation in health-care: from systems issues, to team building, to task training, to educationand high stakes examinations. Curr Opin Crit Care 2012; 18(4):326–332.
8. Chetlen AL, Mendiratta-Lala M, Probyn L, Auffermann WF, et al. Conven-tional medical education and the history of simulation in radiology. AcadRadiol 2015; 22(10):1252–1267.
9. Klein KA, Neal CH. Simulation in radiology education: thinking outsidethe phantom. Acad Radiol 2016; 23(7):908–910.
10. Sabir SH, Aran S, Abujudeh H. Simulation-based training in radiology. JAm Coll Radiol 2014; 11(5):512–517.
11. Sarwani N, Tappouni R, Flemming D. Use of a simulation laboratory totrain radiology residents in the management of acute radiologic emer-gencies. Ame J Roentgenol 2012; 199(2):244–251.
12. Giaddui T, Yu J, Manfredi D, et al. Structures’ validation profiles in Trans-mission of Imaging and Data (TRIAD) for automated National Clinical Tri-als Network (NCTN) clinical trial digital data quality assurance. Pract RadOncol 2016; 6(5):331–333.
13. Ruutiainen AT, Durand DJ, Scanlon MH, et al. Increased error rates inpreliminary reports issued by radiology residents working more than 10consecutive hours overnight. Acad Radiol 2013; 20(3):305–311.
14. Hanna TN, Lamoureux C, Krupinski EA, et al. Effect of shift, schedule,and volume on interpretive accuracy: a retrospective analysis of 2.9 mil-lion radiologic examinations. Radiology 2018; 287(1):205–212.
15. Krupinski EA, Schartz KM, Van Tassell MS, et al. Effect of fatigue onreading computed tomography examination of the multiply injuredpatient. J Med Imaging 2017; 4(03):1.
16. Miyakoshi A, Nguyen QT, Cohen WA, et al. Accuracy of preliminary inter-pretation of neurologic CT examinations by on-call radiology residentsand assessment of patient outcomes at a level I trauma center. J AmColl Rad 2009; 6(12):864–870.
17. Filippi CG, Schneider B, Burbank HN, et al. Discrepancy rates of radiol-ogy resident interpretations of on-call neuroradiology MR imaging stud-ies. Radiology 2008; 249(3):972–979.
18. Sistrom CL, Deitte L. Factors affecting attending agreement with residentearly readings of computed tomography and magnetic resonance imag-ing of the head, neck, and spine. Acad Radiol 2008; 15(7):934–941.
19. Ruchman RB, Jaeger J, Wiggins EF, et al. Preliminary radiology residentinterpretations versus final attending radiologist interpretations and theimpact on patient care in a community hospital. AJR. 2007; 189(3):523–526.
20. Ruutiainen AT, Scanlon MH, Itri JN. Identifying benchmarks for discrep-ancy rates in preliminary interpretations provided by radiology trainees atan academic institution. J Am Coll Radiol 2011; 8(9):644–648.
21. Provenzale JM, Kranz PG. Understanding errors in diagnostic radiology:proposal of a classification scheme and application to emergency radiol-ogy. Emerg Radiol 2011; 18(5):403–408.
22. Velmahos GC, Fili C, Vassiliu P, et al. Around-the-clock attending radiol-ogy coverage is essential to avoid mistakes in the care of traumapatients. Am Surg 2001; 67(12):1175–1177.
23. Schartz KM, Madsen MT, Kim J, et al. Satisfaction of search revised.2017;13(8):973�8.
24. Banaste N, Caurier B, Bratan F, et al. Whole-body CT in patients with multi-ple traumas: factors leading to missed injury. Radiology 2018:180492.
25. Novelline RA. CT in the patient with multiple trauma: risk factors formissed findings. Radiology 2018:181534. 7 nn.
26. Ganguli S, Pedrosa I, Yam C-S, et al. Part I: preparing first-year radiologyresidents and assessing their readiness for on-call responsibilities. AcadRadiol 2006; 13(6):764–769.
27. Ganguli S, Camacho M, Yam CS, et al. Preparing first-year radiology res-idents and assessing their readiness for on-call responsibilities: resultsover 5 years. Am J Roentgenol 2009; 192(2):539–544.
28. Yam C-S, Kruskal J, Pedrosa I, et al. Part II: preparing and assessingfirst-year radiology resident on-call readiness technical implementation.Acad Radiol 2006; 13(6):770–773.