Full Project Example
29
DPP EGM300 Project Brown Bin Participation and Set-out Darren Kidd Mid & East Antrim Borough Council Surveying Analysis for the Ballymena Area Monday 3 rd November 2014 – Friday 6th February 2015 To Include a Summary of Seasonal Variation in Participation Rates, Along With Other Objectives 1
-
Upload
darren-kidd -
Category
Documents
-
view
46 -
download
2
Transcript of Full Project Example

DPP EGM300 Project
Brown Bin Participation and Set-out
Darren Kidd
Mid & East Antrim Borough Council
Surveying Analysis for the Ballymena Area
Monday 3rd November 2014 – Friday 6th February 2015
To Include a Summary of Seasonal Variation in Participation Rates, Along With Other Objectives
1

ContentsIntroduction: Participation and Set-out Surveying Analysis:..........................................................3
Aim of Project, and the Objectives:..............................................................................................4
First Main Objective......................................................................................................................5
Methods of Selection - Socioeconomic Differences in Main Selected Areas:................................5
First Main Objective Continued....................................................................................................8
Winter 2014/2015 Set Out and Participation Rate Results of Analysis:.........................................8
What Have Other Councils Found?..............................................................................................16
Second Main Objective...............................................................................................................17
What Can Be Done To Improve Set-Out and Participation Rates?...............................................17
Third Main Objective...................................................................................................................17
Seasonal Comparisons...............................................................................................................17
Fourth Main Objective................................................................................................................19
Food Caddy Liners:......................................................................................................................19
Final Results and Conclusions of Main Aim, Including Recommendations for Improvements: 20
Participation Rate Results:...........................................................................................................20
Set-Out Results:...........................................................................................................................20
Recommendations according to Objective 2:..............................................................................20
References:.....................................................................................................................................23
2

Introduction: Participation and Set-out Surveying Analysis:
Generally speaking, the EU has established mandatory policies and targets in relation to achieving a sustainable method for dealing with waste, and to ameliorate waste management. In relation to policies there are quite a few, with major emphasis being put on the Waste Framework Directive, ‘Directive 2008/98/European Commission’. This sets the basis of the Waste Hierarchy which is a guidance tool used to distinguish principles of waste management and their order of importance. It ranks the mechanisms of waste management, with prevention of waste being of upmost importance, followed by preparation of re-using the waste, then recycling and recovery being the next steps. Disposal of waste is unwanted and should be avoided by following previous procedures in the hierarchy (European Commission 2015). The Waste Hierarchy must be applied by all state members of the EU. The ‘7th Environment Action Programme (EAP)’ has also been put in place to ensure that all legislation and policies are adhered to by all states within the EU (European Commission 2015). The EU have set certain targets to meet, to include a 20% reduction in GHG emissions by 2020, which can be achieved through cutting tonnages of waste to landfill and by reducing waste incineration (EU 2013). Were law is concerned, EU state members must reach a 50% recycling target by 2020, however EU parliament have proposed the possibility of reaching a target of 70% by 2030 (Waste Management World 2015).
In 2008 Ballymena Borough Council introduced the brown bin collection system, and by 2011 the scheme was fully operational. Every household had received a brown bin, kitchen caddy for food waste, biodegradable bags for the caddy, a bag replacement tag, and finally user information. This system was implemented to allow for the fortnightly collection of both garden waste and food waste, which is what the biodegradable bags and kitchen caddies are for. The user information provided highlighted clearly what the kitchen caddies were to be used for, and why it is important to contain food waste within the biodegradable bags provided.
Ballymena Borough Council, now known as Mid and East Antrim Borough Council, firmly believe in keeping a close monitoring eye on its internal performance rates, in relation to recycling rates and total tonnages of waste, both compost and refuse. However, as of yet there has been no evaluation of the performance of the brown bin collection system. The monitoring and evaluation of a specific systems performance is important, as it allows for seeing if a high performance standard is being achieved, and enables diagnostics of any problems or flaws in the system. Problems such as low participation, as well as certain areas that are home to households whom are non-participants and do not dispose of their garden or food waste in the correct fashion. As a solution, participation and set-out rates were closely monitored between the 3rd November 2014 and the 6th February 2015. This work was therefore carried out before the 1st April 2015, when Ballymena Borough Council, Carrick and Larne, merged to form the Mid and East Antrim Borough Council. Throughout this document, ‘Ballymena Borough Council’ shall still be referred to, as the work was completed on behalf of them, to gather results for the new council, formed on 1st April 2015.
The idea behind participation and set out monitoring is simple. For a household to be seen as participant it must set out it’s recycling or composting unit at least once, within the defined three surveying opportunities. The set out rate can be defined as the number of households in an area
3

who put out target containers i.e. brown bins, on one occasion during the sampling period. Participation rate however can be defined as the proportion of households that take part at least once within the sampling period.
Aim of Project, and the Objectives:There are various objectives that I will work through to allow me to achieve the aim of this project. As the time scale of data collection was so large, it allows for different principles of my aim to be gained through meeting various objectives. It is important that all of the correct steps are taken so that my aim can be fully achieved, and results can be clearly defined from the work carried out.
Firstly, the main aim that I will achieve will be to gain an exact overview of the Ballymena Borough Council Brown Bin Participation and Set-Out rate. The first main objective I will focus on will be to define the areas that I will focus my sampling on. I will do this by studying the socioeconomic deprivation levels of 6 main areas within the borough, and choosing the three with the lowest levels of deprivation and the three with the highest. I will then choose the adequate collection squads to join, ensuring they cover these areas. This shall be the first main objective. Another objective which is related to the previous, will be to construct data through nine weeks of sampling that will allow me to see the exact figures. It is a realistic objective to achieve as I have access to available resources, such as the bin lorry squads, and approval to join them as well as the mandatory health and safety training. As well as this I have all of the time needed to carry out nine weeks of intense monitoring as previously mentioned. Other miniature steps I have taken to achieving this main objective are being organised with all the necessary paper work that I personally created, in the form of Microsoft Excel Documents, planning an appropriate timeline taking into consideration a Christmas break, and by setting myself a deadline to have all the data summarised.
Another important piece of information that will allow me to draw more information from my final achieved aim will be to define what can be done to improve the Set-Out and Participation rates. This shall be achieved after the data has been collected and summarised to make final conclusive results. Objectives surpassed to meet this part of the main aim will be to research methods of improvement that other councils have used in the past, may it be by promotion of the importance of recycling, and education on this. This shall be the second main objective.
The third main objective that will allow me to achieve my overall aim will be to show consideration to the idea that seasonal changes can affect the participation rates of an area. This information will be used to show why the Participation rate is either high or low for a certain time of year. As part of this objective I will summarise previous collection dates along with the new data to give participation rates for winter 2013 and the summer months of 2014, as this will allow for comparisons, and for this part of the main aim of the project to be met.
The fourth main objective is to come to a conclusion on whether caddy liners should have a charge put on them, to lower cost to council. This can be achieved by monitoring the amount of caddy liners being given out free of charge to the public, as their brown bins are collected, as the cost of these is paid for by council. Part of this objective is to see if a cost to the liners will result in people using them properly, therefore resulting in higher rates of recycling and a higher overall participation rate.
4

First Main ObjectiveMethods of Selection - Socioeconomic Differences in Main Selected Areas:For this type of work it was important to sample from different areas to try and identify areas of low participation, in terms of brown bin set out, as these were the areas that were having a negative effect on the boroughs statistics. The most effective way of choosing the sample sites was to look at different socio-economic factors related to an area, such as deprivation, income, employment, education and crime rates. The main focus points as decided by research of the socioeconomic factors are Ballykeel, Harryville, and Ballee. As well as Galgorm, Leighinmohr and Portglenone. Three squads have been chosen, each with a different collection routes that allow for coverage of all these areas. The following information shows exactly why these areas have been selected for the project.
Note; Northern Ireland is divided into wards by area, the lower the ward rank of an area out of 582, the higher the level of deprivation.
Figure 1
Firstly, ‘Figure 1’self-contains a chart summarising the overall socioeconomic ward rankings for each of the selected areas, and shows how they differentiate greatly. It gives an overall view of all the critical factors such as income, education, crime rate and employment, which will all be individually shown later on. From this chart it is clear to see that the areas that squad 2 collect from, Ballykeel, Harryville and Ballee have a much higher level of deprivation, in comparison to Galgorm Leighinmohr and Portglenone, which are squad 3 areas. The major difference in ward rankings comes with the Galgorm and Ballee areas. Galgorm in fact has one of the lowest levels of deprivation in Northern
5

Ireland, as it is only 21 off the highest ward ranking area. Ballee however is seen as having one of the higher levels of deprivation, with a rank of only 38.
Figure 2
‘Figure 2’ above shows how the level of deprivation between the Squad 2 areas and squad 3 areas differentiates in terms of Income levels in the areas. Again, it should be noticed how Squad 3 areas have a much higher ward ranking than the areas related to squad 2. Galgorm again has the highest of the rankings, with 560, being only 22 off top spot in the country. With great difference again comes Ballee with a ward rank of 41. The deprivation in relation to income in this area is quite severe. Figure 3
‘Figure 3’ above defines the ward ranking of employment for all of the selected areas. It can be seen again that the squad 3 related areas are proving to have less socioeconomic deprivation in comparison to squad 2 areas. Leighinmohr has the highest ward ranking of all these areas, with a
6

score of 550. Ballee again has the lowest of the squad 2 rankings with a score of 57 for employment. ‘Figure 3’ Shows that the lowest ranking of a squad 3 area, (Portglenone with 273), still outranks the highest scoring squad 2 area for employment, (Harryville with 153), by a total of 120 ward ranks. This is why these two groups of areas have been highlighted and chosen for sampling in the Brown Bin Participation Survey.
Figure 4
‘Figure 4’ above gives information related to education in all of the selected areas. It can be seen clearly that Galgorm has the highest ward rank for education, 543. The lowest ranking is again Ballee with 11. This is an extortionately low score showing an extremely high level of deprivation. The reason that the socioeconomic factor of education has been recorded is to see if areas with higher levels of deprivation in this factor, are less likely to participate in the Brown Bin recycling scheme. This will allow for conclusions to be made like if the residents of the area understand the importance of using the recycling schemes provided.
7

Figure 5
Finally, ‘Figure 5’ above summarises the level of crime in each area. Again it can be seen that the squad 3 areas of Galgorm, Leighinmohr and Portglenone have a much higher ranking than the areas related to squad 2, Ballykeel, Harryville and Ballee.
To Summarise, the socioeconomic factors that have been described for the squad 2 and 3 collection run main areas, have been chosen as they may contribute as to whether or not an area has a high set out and participation rate or a low one, and may be a reason for it being consistent or not.
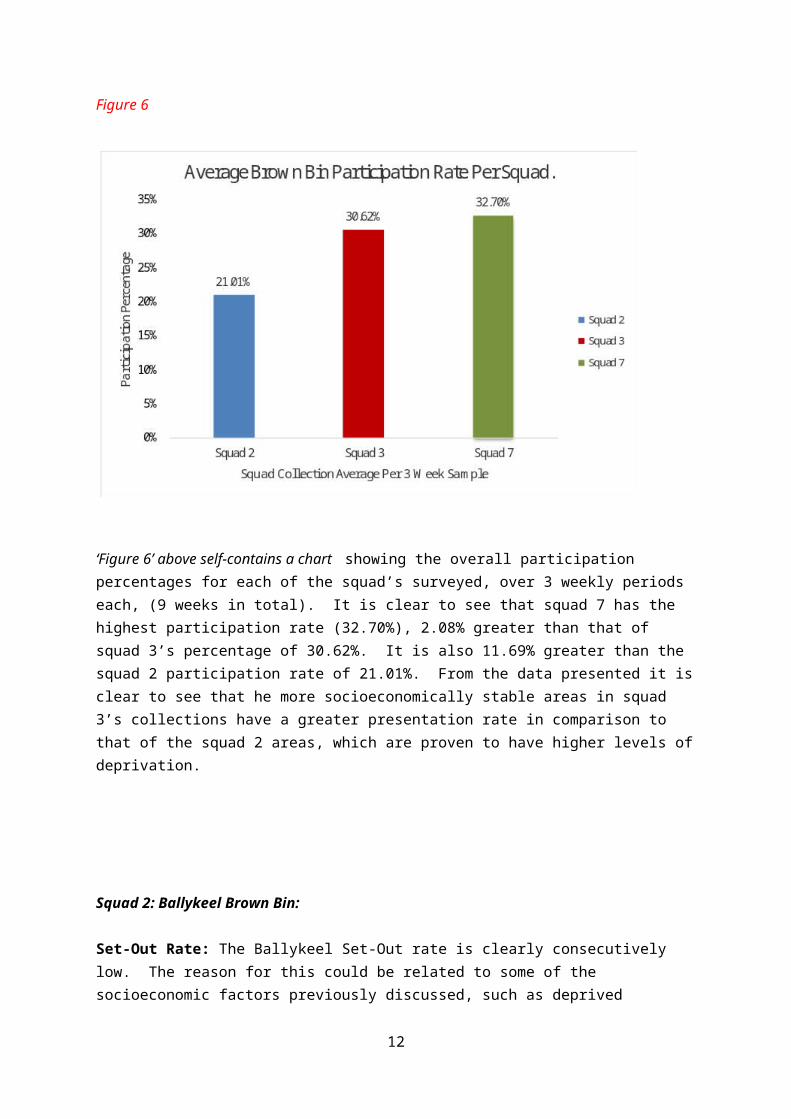
First Main Objective ContinuedWinter 2014/2015 Set Out and Participation Rate Results of Analysis:Below, ‘Table 1’ shows clearly the weekly set out averages to include all collections that squads 2, 3 and 7 carry out. It can be seen that squad 2 have majorly the lowest of all the set out rates, with their worst week, (week 3) coming in at only 18.95%. Their greatest set-out percentage was in week 1 of sampling, being 22.50%. As previously mentioned, squad two collect from what are deemed to be the more socioeconomically deprived areas. In comparison to squad 3 these set out percentages are quite poor. The highest set-out percentage recorded with the squad 3 collection was in week 1, being 39.76%. This figure is 17.26% greater than the highest set-out rate of squad 2, which is a considerable amount. The lowest of the squad 3 set-out percentages is 25.43% (week 3), which is still 2.93% greater than the highest of squad 2 results. ‘Table 1’ also includes the 3 week average participation rate based on 3 weeks of sampling. These participation percentages are displayed in ‘Figure 6’ below.
8

Table 1Weekly Set-Out Averages
3 Week Average Participation
Week 1 Week 2 Week 3
Squad 2 22.50% 21.58% 18.95% 21.01%
Squad 3 39.76% 26.68% 25.43% 30.62%
Squad 7 35.47% 33.08% 29.58% 32.70%
Figure 6
‘Figure 6’ above self-contains a chart showing the overall participation percentages for each of the squad’s surveyed, over 3 weekly periods each, (9 weeks in total). It is clear to see that squad 7 has the highest participation rate (32.70%), 2.08% greater than that of squad 3’s percentage of 30.62%. It is also 11.69% greater than the squad 2 participation rate of 21.01%. From the data presented it is clear to see that he more socioeconomically stable areas in squad 3’s collections have a greater presentation rate in comparison to that of the squad 2 areas, which are proven to have higher levels of deprivation.
Squad 2: Ballykeel Brown Bin:
9

Set-Out Rate: The Ballykeel Set-Out rate is clearly consecutively low. The reason for this could be related to some of the socioeconomic factors previously discussed, such as deprived education levels. Perhaps the residents here do not see the importance of using the recycling service provided. Other reasons may be that the majority of houses in this area, do not have gardens. The highest of the Ballykeel Set-Out percentages as shown in ‘Table 2’ was 20.37% and came on the 3rd of November. Table 2Squad 2: Ballykeel
3rd Nov 17th Nov 1st DecTotal bins set out: 212 203 183
Set out rate as a percentage 20.37% 19.50% 17.58%
Figure 7
Participation: Participation rate for the Ballykeel area was at 19.15%. This is an extortionately low figure when compared to the squad 3 and 7 collection points.
Waste Metrics: There was no data recorded in relation to bin weight for the collection of Brown Bins in the Ballykeel area.
Squad 2: Harryville Brown Bin:
10

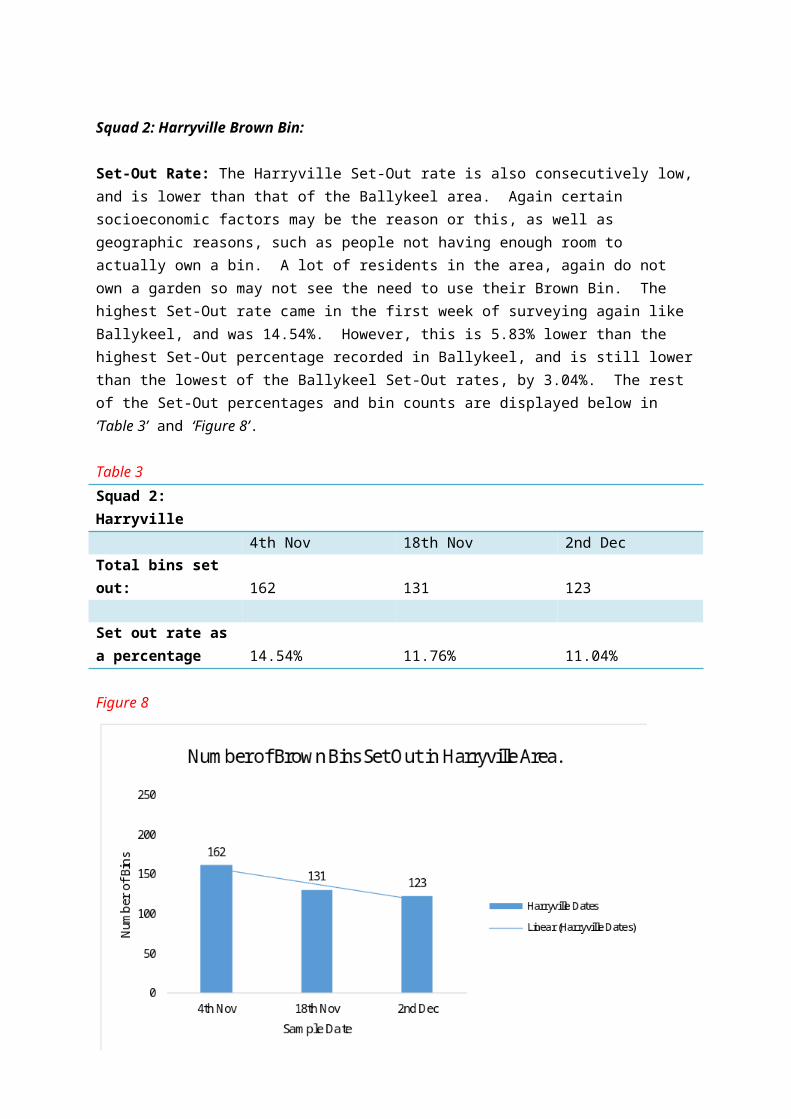
Set-Out Rate: The Harryville Set-Out rate is also consecutively low, and is lower than that of the Ballykeel area. Again certain socioeconomic factors may be the reason or this, as well as geographic reasons, such as people not having enough room to actually own a bin. A lot of residents in the area, again do not own a garden so may not see the need to use their Brown Bin. The highest Set-Out rate came in the first week of surveying again like Ballykeel, and was 14.54%. However, this is 5.83% lower than the highest Set-Out percentage recorded in Ballykeel, and is still lower than the lowest of the Ballykeel Set-Out rates, by 3.04%. The rest of the Set-Out percentages and bin counts are displayed below in ‘Table 3’ and ‘Figure 8’.
Table 3Squad 2: Harryville
4th Nov 18th Nov 2nd DecTotal bins set out: 162 131 123
Set out rate as a percentage 14.54% 11.76% 11.04%
Figure 8
Participation: The final Participation rate for the Harryville area was at a low 12.44%. Again, this figure is extremely low and is a poor representation of this area. It is 6.71% lower than the Ballykeel presentation percentage. Waste Metrics: There was no data recorded in relation to bin weight for the collection of Brown Bins in the Harryville area.Squad 2: Ballee Brown Bin:
11
Set-Out Rate: The set-out rate for the Ballee area is slightly better than that of Ballykeel and Harryville, however I is still relatively low, with the highest rate being at 25.60%, being generated from 288 bins. This Set-Out percentage is 5.23% greater than the highest score for the Ballykeel area, and 11.06% greater than the highest of the Harryville Scores.
Additional Information: Ballee, with the lowest socioeconomic ward ranking (33) out of all the squad 2 areas, actually bettered the final participation rates of Ballykeel and Harryville.
Table 4Squad 2:Ballee
6th Nov 20th Nov 4th DecTotal bins set out: 288 284 219
Set out rate as a percentage 25.60% 25.24% 19.47%
Figure 9
Participation: The final Participation rate for the Ballee area, was at 23.43%. This percentage is greater than both the Ballykeel and Harryville participation rates, but is still relatively low, when compared to that of the main squad 3 areas, Galgorm, Leighinmohr and Portglenone. Waste Metrics: There was no data recorded in relation to bin weight for the collection of Brown Bins in the Harryville area.
Squad 3: Galgorm Brown Bin:
12

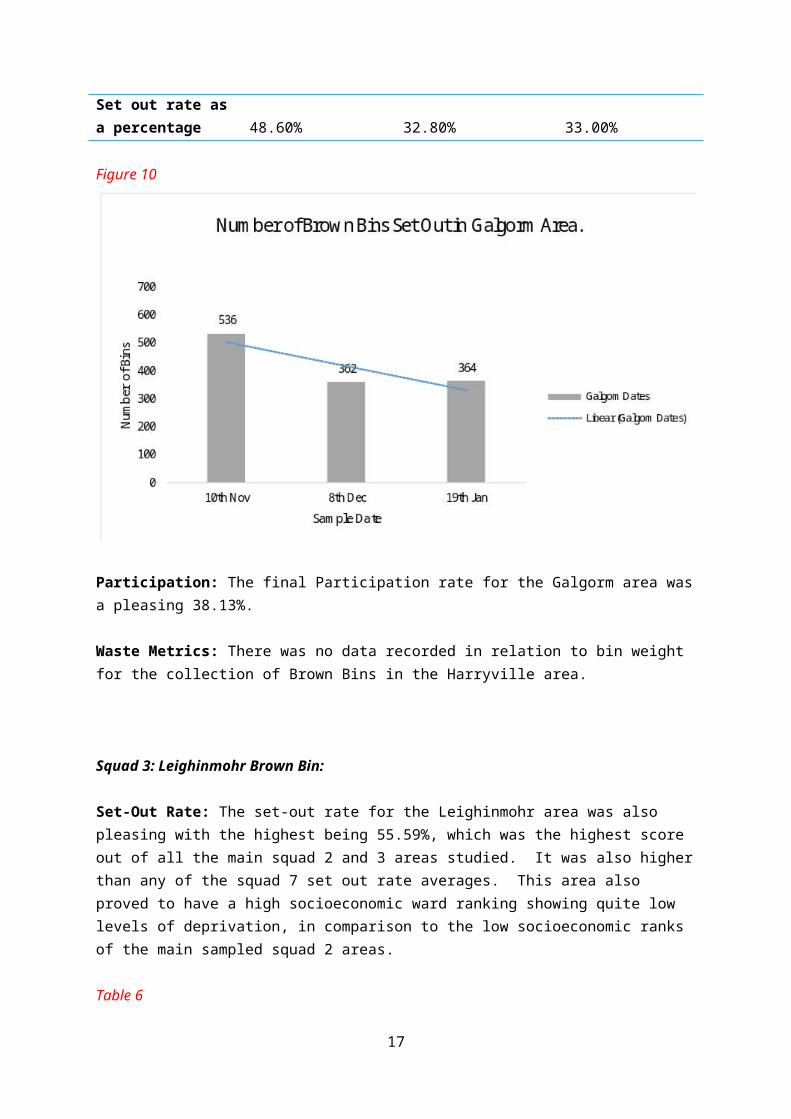
Set-Out Rate: The Set-Out rate for the Galgorm area was always consecutively higher than all of the main squad 2 areas. The highest of the Set-Out rates was 48.60% on the 10 th November, which was 23% greater than the highest set-out rate from the squad 2 data, in Ballee. The next two set-out rates recorded as shown in ‘Table 5’ below actually fell a considerable amount, however were still greater than the highest of the Squad 2 collection set-out rates. This area had a very high socioeconomic ward ranking, showing that there are only miniscule levels of deprivation, which could be the reason for such high set-out rates.
Table 5Squad 2: Galgorm
10th Nov 8th Dec 19th JanTotal bins set out: 536 362 364
Set out rate as a percentage 48.60% 32.80% 33.00%
Figure 10
Participation: The final Participation rate for the Galgorm area was a pleasing 38.13%.
Waste Metrics: There was no data recorded in relation to bin weight for the collection of Brown Bins in the Harryville area.
Squad 3: Leighinmohr Brown Bin:
13
Set-Out Rate: The set-out rate for the Leighinmohr area was also pleasing with the highest being 55.59%, which was the highest score out of all the main squad 2 and 3 areas studied. It was also higher than any of the squad 7 set out rate averages. This area also proved to have a high socioeconomic ward ranking showing quite low levels of deprivation, in comparison to the low socioeconomic ranks of the main sampled squad 2 areas.
Table 6Squad 2: Leighinmohr
11th Nov 9th Dec 20th JanTotal bins set out: 622 424 331
Set out rate as a percentage 55.59% 37.89% 29.58%
Figure 11
Participation: The final Participation rate for the Leighinmohr area was a high 41.02%. This proved to be the highest of any recorded participation rate out of all the sampled collection runs.
Waste Metrics: There was no data recorded in relation to bin weight for the collection of Brown Bins in the Harryville area.
Squad 3: Portglenone Brown Bin:
14

Set-Out Rate: The set-out rate for the Portglenone area is not as high as the set-out rates of Galgorm and Leighinmohr, in fact they are quite similar to that of the squad 2 areas. Especially the Ballee area. The highest set-out rate for the Portglenone area is 26.16% generated from 147 bins being set out. This is only 0.56% higher than the greatest of the Ballee set-out rates. It can also be seen from the data presented in ‘tables 4 and 7’, that another of the recorded set-out rates for Ballee (20th November) is actually greater than the second week recorded set-out rate (12th December) recorded for Portglenone, by 3.71%. The third sample taken from the Portglenone area (23rd December) is only 1.53% greater than the third sample taken from the Ballee area (4th December).
Additional Information: Consideration must be given to the fact that Ballee, with an overall socioeconomic ward rank of only 38 to show high levels of deprivation, bettered the set-out rates of Portglenone (ward rank 372) in two of the three sampled weeks. This means that with acceptations, certain factors in socioeconomic ranking cannot always be relied on for certain research topics.
Table 7Squad 2: Portglenone
14th Nov 12th Dec 23rd JanTotal bins set out: 147 121 118
Set out rate as a percentage 26.16% 21.53% 21.00%
Figure 12
Participation: The final Participation rate for the Portglenone area was 22.89%, the lowest of the Squad 3 areas.
15

Waste Metrics: There was no data recorded in relation to bin weight for the collection of Brown Bins in the Harryville area.
‘Figure 13’ below gives a final view of the participation rates of all the main sampled areas between squads 2 and 3, based on 3 weeks of sampling for each area. It is clear to see that the area with the greatest participation rate is Leighinmohr (41.02%). The area with the lowest participation rate is Harryville (12.45). The difference between these two areas is 28.57% showing a lot of room for improvement. Means of improvement will later be discussed in ‘Aim 2’.
Figure 13
What Have Other Councils Found?Other Councils are familiar with the Set-Out and Participation monitoring system, in particular Antrim Borough Council. They carried out a similar survey in 2010/2011 for their own use, however permission was granted to view their findings for comparison reasons. I found firstly that there was no proof that socioeconomic ward ranking of areas was used, in their selection of areas to monitor, it seemed to be randomised areas throughout their borough. Due to this comparisons between the selected areas in Ballymena Borough Council and Antrim could not be made. However I did find that their average Brown Bin Participation rate was 36.5%.
Second Main ObjectiveWhat Can Be Done To Improve Set-Out and Participation Rates?There are certain things that can be acted upon, in order to improve on the statistics found. Firstly, the idea of a communication campaign is possible, and would be used to reach out to the community in different ways, to promote the importance of recycling. Making proper use of
16
recycling systems provided, i.e. Brown Bins and Food Caddies is vital if the council are to improve on their overall recycling rate, and decrease the amount of tonnages going to landfill.
Tonnages to landfill currently lies at 30,923 tonnes for municipal household waste.
The communication campaign shall consist of different ideas. The first of these would be to promote the use of the recycling systems through educational leaflets that could be delivered to the households within the borough. The leaflets would be created with a design that makes them eye-catching and interesting to read. They would need to be simplistic in their design, as well as the information that they hold. This would hopefully educate people, of all age groups and show them the importance of participating in setting out their Brown Bins for collection. As well as this, the council’s website will be updated so that it can be used as means of promoting the importance of recycling and using the systems provided, often. The information leaflets will also be available online for anyone who loses their hard copy. It can be hard to change the attitudes of people psychologically, however with persistent reinforcement of the importance of recycling through these types of campaigns this can be achieved.
It may be necessary to provide the public with added incentive to recycle, such as a reward for increased participation. The reward/incentive would require further discussion and approval, depending on what it would be. On top of all this, an attitudes towards recycling survey shall be conducted in the areas that have been sampled and summarised through the squads 2 and 3 collection runs. The results of this will help with finding another solution and method to improve participation and set-out rates.
Third Main ObjectiveSeasonal Comparisons Spring and summer months are known to generate more garden waste, and therefore a higher level of participation, simply because homeowners need to dispose of their garden waste. The fact that this surveying was carried out in late autumn/winter months, was going to slightly decrease the participation percentages for the sampled areas.
As previously mentioned, after the recent data was collected between the 3rd November 2014 and the 6th February 2015, past seasonal data was looked at and collaborated, for winter 2013 and summer 2014. Basic bin counts were taken from the same squads, squads 2, 3 and 7 over a winter period and summer period. The dates were from week ending 03/11/13 to week ending 12/12/13 for the winter period, and from week ending 13/07/14 to week ending 22/08/14 for the summer period.
Note: Squads 2, 3 and 7 covered the same areas in their collection runs between these dates, as they do now as noted for the most recent data taken between the 3rd November 2014 and the 6th February 2015.
17
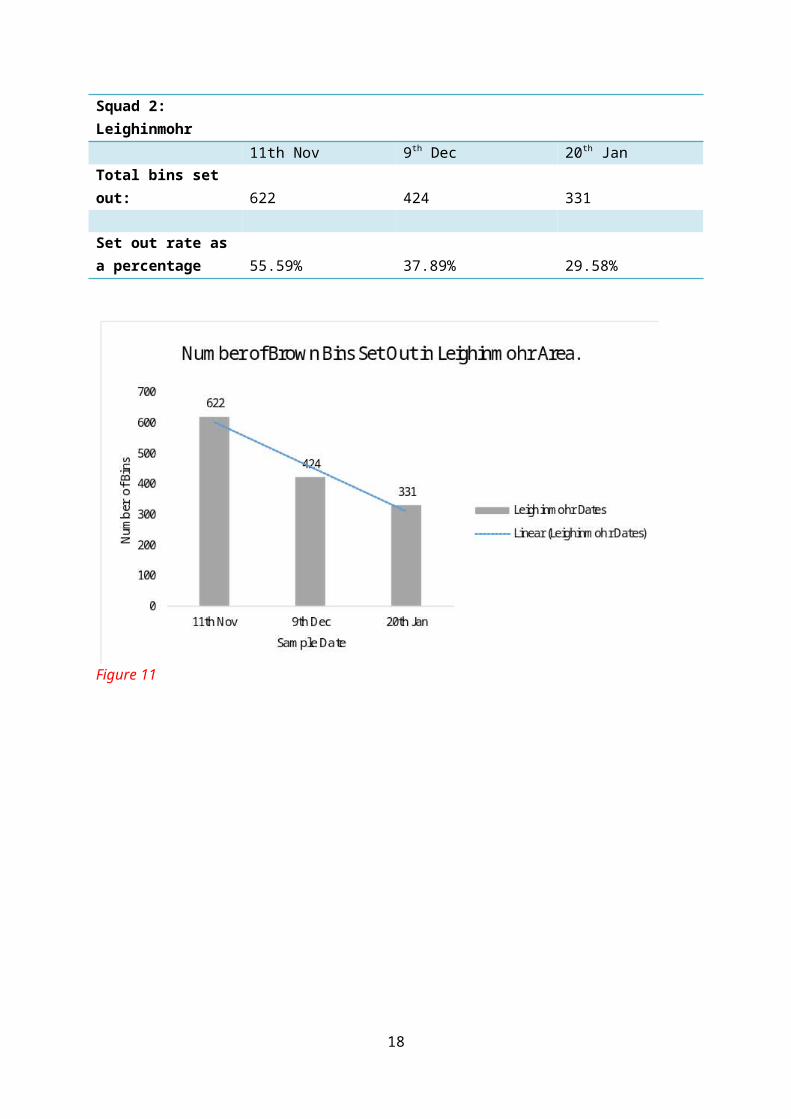
Figure 14
Figure 15
Above, ‘Figures 14 and 15’ give an overview summary of the participation rate of a 3 week collection period sample for each of the three squads, (9 weeks of data in total on each graph). This data takes into consideration the three main areas in the squad 2 collection and the three main areas in the squad 3 collection as previously talked about and compared in terms of socioeconomic ward ranking. The 3 main areas of which each squad is required to collect from, take up 3 of their 5 working days. ‘Figures 14 and 15’ above take into consideration the other two working days for both squads 2 and 3, as well as the 5 working days for squad 7, (Monday to Friday).
Firstly, in the winter collection period of 2013, squad 2 have a 3 week participation rate of 20.23%. However this figure raises by 10.18% to 30.41% in the summer collection period of 2014. This shows that participation is greater and more residents of the areas are using their brown bins in the summer period compared to the winter period. ‘Figures 14 and 15’ also show that in the winter
18

collection period, squad 3 have a participation rate of 39.60%. This figure again raises in the summer period by 12.4% to 52%. Squad 7 have a winter period participation rate of 37.05%, and this again raises by 8.71% to 45.76%. All of this data points to an obvious fact that participation and set out rates for brown bins is greater in the summer collection periods when compared to winter periods. All 9 weeks of bin collections between the three squads when collated gives an overall participation average of 32.29% for the winter and 42.72 for the summer. This leaves a difference of 10.43%. ‘Table 8’ below summarises these figures.
Table 8Winter 2013 Summer 2014 Increase/
DecreaseSquad 2 20.23% Squad 2 30.41% >10.18%Squad 3 39.60% Squad 3 52% >12.4%Squad 7 37.05% Squad 7 45.76% >8.71%Average 32.29% Average 42.72% >10.43%
Fourth Main Objective
Food Caddy Liners:During the participation study records were made of the number of caddy bags being given out (free of charge) to all of the sampled areas between squads 2, 3 and 7. Below, ‘Table 9’ shows clearly the amount of caddy liners being given out based on request by resident for each of the main areas in the squad 2 and 3 collection runs. It is clear to see that Galgorm showed most request for new caddy bags throughout the survey period, as on the 10th of November (week 1) 105 were requested. Weeks 2 and 3 were also both > 70 requests. This could be evidence that there are a higher number of residents disposing of their food waste in the correct manner using the recycling service provided. The lowest request for bags was 18, recorded on week 2 of the Harryville collections. The set out rate for this area on this date was only 11.76%.
Table 9Free Food Caddy Liners Allocated by request Per AreaSquad 2 Week 1 Week 2 Week 3Ballykeel 3rd Nov: 55 17th Nov 52 1st Dec 48Harryville 4th Nov: 31 18th Nov: 18 2nd Dec: 26Ballee 6th Nov: 46 20th Nov: 68 4th Dec: 41
Squad 3 Week 1 Week 2 Week 3Galgorm 10th Nov: 105 8th Dec: 70 19th Jan: 85Leighinmohr 11th Nov: 87 9th Dec: 72 20th Jan: 79Portglenone 14th Nov: 20 12th Dec: 25 23rd Jan: 27
Additional Information: The NIEA want to have garden and food waste separated, meaning they will be collected at different times, with different collection schemes. There is new legislation to make
19

sure these new plans are adhered to. As well as this, it is possible that in the near future, the caddy bags will no longer be free of charge for the Ballymena Borough.
Final Results and Conclusions of Main Aim, Including Recommendations for Improvements:
Participation Rate Results:To conclude, the highest participation rate was 32.70% as a result of the 3 week analysis of the squad 7 collections. The second highest was 30.62% as a result of the squad 3 collections. The lowest was then generated from the squad 2 collections, being a low 21.01%. It has been proven that the areas with a lesser socioeconomic ward rank in squad 2 collection runs are less likely to participate in the recycling schemes, compared to the squad 3 areas. The squad 3 areas have less deprivation going by their socioeconomic ward rankings, which where all considerably high.
Set-Out Results:In terms of set-out rate, the highest was recorded in week one of the squad 3 collection runs at 39.76%. It then falls in the following 2 weeks of collections from this squad, firstly by 13.08% to 26.68%, and then by another 1.25% to a set-out rate of 25.43% in the third week of surveying. When looking at the set-out rate of squad 2 it is clear to see that it is quite poor, showing three consecutive drops in the three weeks of sampling. The first week showed a set-out rate of 22.50% which the falls by 0.92% to 21.58% in the second week. The second weeks figure then falls again by 2.63% to 18.95%. There is there for a difference of 3.55% between the largest and smallest of the squad 2 set-out rates. Finally the squad 7 set-out rates remain consistently higher that all of the surveyed weeks for squad 2, and are all higher that the final two weeks sampled for squad 3. However the squad 7 set-out rates show a steady decline from the first week of surveying to the third. Overall their highest percentage of 35.47% in week 1, fell by 5.89% to 29.58% in the third week. The second week of sampling for squad 7 produced an average set-out rate of 33.08%.
Recommendations according to Objective 2:It is highly recommended that the methods of improvement previously discussed in objective 2, be implemented into the areas with the lower rates of participation. This is where improvements must be made, and were improvements will have a positive lead on effect to the overall recycling rates in the borough. The percentage of recycling shall increase with the heavily supported and consistent promotion of recycling in these areas, reducing tonnages to landfill.
It has also been shown from the data analysis that seasonal variations in set-out and participation rates of Brown Bins are common. This was previously thought to be true, however it could not be relied upon as factual. Now, through the analysis and monitoring carried out on both the winter participation rates and the summer, it can be seen as more factual than a simple statement. To summarise, the summer months tend to generate a greater participation rate (42.27%) that the winter months studied (32.29%). A difference as great as 9.98% overall in the favour of the summer collection months.
20

In relation to the food waste caddy liners scenario it has been found that the cost to council is by far too expensive, as more bags are being given out free of charge to households that do not in fact recycle their food waste using the correct system. The plan is likely to be giving out a specific number of bags 3 times per annum, to all requesting household, and then charging for the further request of additional biodegradable bags.
21

References: European Union. 2013. DECISION No 1386/2013/EU OF THE EUROPEAN PARLIAMENT AND
OF THE COUNCIL on a General Union Environment Action Programme to 2020 ‘Living well,
22

within the limits of our planet’. [ONLINE] Available at: http://eur-lex.europa.eu/legal-content/EN/TXT/?uri=CELEX:32013D1386.
European Commission. 2015. Directive 2008/98/EC on waste (Waste Framework Directive). [ONLINE] Available at: http://ec.europa.eu/environment/waste/framework/.
Waste Management World. 2015. TRASH TALK: 70% EU RECYCLING TARGET. [ONLINE] Available at:http://www.waste-management-world.com/articles/print/volume-15/issue-5/wmw-recycling-special/trash-talk-70-eu-recycling-target.html.
23