FULL-ENGAGEMENT WELFARE IN NEW YORK CITY
188
FULL-ENGAGEMENT WELFARE IN NEW YORK CITY Lessons for TANF’s Participation Requirements Prepared with assistance from the New York City Human Resources Administration, the Bodman Foundation, and the William H. Donner Foundation Douglas J. Besharov Peter Germanis August 2004
Transcript of FULL-ENGAGEMENT WELFARE IN NEW YORK CITY

FULL-ENGAGEMENT WELFARE
IN NEW YORK CITY
Lessons for TANF’s Participation Requirements
Prepared with assistance from the New York City Human Resources Administration,the Bodman Foundation, and the William H. Donner Foundation
Douglas J. BesharovPeter Germanis
August 2004


LIST OF FIGURES . . . . . . . . . . . . . . . . . . . . . . . . . . . . . . . . . . . . . . . . . . . . . . . . . . . . . . . . . iv
LIST OF TABLES . . . . . . . . . . . . . . . . . . . . . . . . . . . . . . . . . . . . . . . . . . . . . . . . . . . . . . . . . . v
ACKNOWLEDGMENTS . . . . . . . . . . . . . . . . . . . . . . . . . . . . . . . . . . . . . . . . . . . . . . . . . . . . vii
I. INTRODUCTION . . . . . . . . . . . . . . . . . . . . . . . . . . . . . . . . . . . . . . . . . . . . . . . . . . . . . . . . . 1TANF . . . . . . . . . . . . . . . . . . . . . . . . . . . . . . . . . . . . . . . . . . . . . . . . . . . . . . . . . . . . . . 2New York City as a Model . . . . . . . . . . . . . . . . . . . . . . . . . . . . . . . . . . . . . . . . . . . . . . . 5Lessons from New York City . . . . . . . . . . . . . . . . . . . . . . . . . . . . . . . . . . . . . . . . . . . . . 7
II. CASE FLOW AND CASE MANAGEMENT . . . . . . . . . . . . . . . . . . . . . . . . . . . . . . . . . . . 15Intake and Work First . . . . . . . . . . . . . . . . . . . . . . . . . . . . . . . . . . . . . . . . . . . . . . . . . 16
Application and JOS interview . . . . . . . . . . . . . . . . . . . . . . . . . . . . . . . . . . . . . 16Immediate needs . . . . . . . . . . . . . . . . . . . . . . . . . . . . . . . . . . . . . . . . . . . . . . . . 17Assessing barriers to employment and referrals for services . . . . . . . . . . . . . . . . 17Skills assessment and immediate job search . . . . . . . . . . . . . . . . . . . . . . . . . . . . 17Referrals to determine eligibility . . . . . . . . . . . . . . . . . . . . . . . . . . . . . . . . . . . . 18Skills Assessment . . . . . . . . . . . . . . . . . . . . . . . . . . . . . . . . . . . . . . . . . . . . . . . 19
Open Cases . . . . . . . . . . . . . . . . . . . . . . . . . . . . . . . . . . . . . . . . . . . . . . . . . . . . . . . . . 19Application approval. . . . . . . . . . . . . . . . . . . . . . . . . . . . . . . . . . . . . . . . . . . . 19Referrals to work-related activities . . . . . . . . . . . . . . . . . . . . . . . . . . . . . . . . . . 20Case review . . . . . . . . . . . . . . . . . . . . . . . . . . . . . . . . . . . . . . . . . . . . . . . . . . . 20Partial sanctions for noncompliance . . . . . . . . . . . . . . . . . . . . . . . . . . . . . . . . . 21
Case Closure . . . . . . . . . . . . . . . . . . . . . . . . . . . . . . . . . . . . . . . . . . . . . . . . . . . . . . . . 21Changed circumstances . . . . . . . . . . . . . . . . . . . . . . . . . . . . . . . . . . . . . . . . . . . 21Full-family sanctions or adverse case closures . . . . . . . . . . . . . . . . . . . . . . . . . . 22Transfers to Safety Net Assistance . . . . . . . . . . . . . . . . . . . . . . . . . . . . . . . . . . 22
Monitoring the Process . . . . . . . . . . . . . . . . . . . . . . . . . . . . . . . . . . . . . . . . . . . . . . . . 25JobStat . . . . . . . . . . . . . . . . . . . . . . . . . . . . . . . . . . . . . . . . . . . . . . . . . . . . . . . 28NYCWAY . . . . . . . . . . . . . . . . . . . . . . . . . . . . . . . . . . . . . . . . . . . . . . . . . . . . 28VendorStat . . . . . . . . . . . . . . . . . . . . . . . . . . . . . . . . . . . . . . . . . . . . . . . . . . . . 29
III. THE “FULL-ENGAGEMENT” MODEL . . . . . . . . . . . . . . . . . . . . . . . . . . . . . . . . . . . . . 31Unengageable Cases . . . . . . . . . . . . . . . . . . . . . . . . . . . . . . . . . . . . . . . . . . . . . . . . . . . 31
Exempt cases . . . . . . . . . . . . . . . . . . . . . . . . . . . . . . . . . . . . . . . . . . . . . . . . . . 35Child-only cases . . . . . . . . . . . . . . . . . . . . . . . . . . . . . . . . . . . . . . . . . . . . . . . . 39Active single issue cases . . . . . . . . . . . . . . . . . . . . . . . . . . . . . . . . . . . . . . . . . . 40
More Engageable Cases . . . . . . . . . . . . . . . . . . . . . . . . . . . . . . . . . . . . . . . . . . . . . . . . 41Family Assistance. . . . . . . . . . . . . . . . . . . . . . . . . . . . . . . . . . . . . . . . . . . . . . . 41Safety Net Assistance . . . . . . . . . . . . . . . . . . . . . . . . . . . . . . . . . . . . . . . . . . . . 42
Full Engagement Achieved . . . . . . . . . . . . . . . . . . . . . . . . . . . . . . . . . . . . . . . . . . . . . . 43Work-related activities . . . . . . . . . . . . . . . . . . . . . . . . . . . . . . . . . . . . . . . . . . . 46In engagement process . . . . . . . . . . . . . . . . . . . . . . . . . . . . . . . . . . . . . . . . . . . 51In sanction process. . . . . . . . . . . . . . . . . . . . . . . . . . . . . . . . . . . . . . . . . . . . . . 51

ii
IV. THE WORK EXPERIENCE PROGRAM . . . . . . . . . . . . . . . . . . . . . . . . . . . . . . . . . . . . . 53WEP’s Expansion . . . . . . . . . . . . . . . . . . . . . . . . . . . . . . . . . . . . . . . . . . . . . . . . . . . . 53
A long history in New York . . . . . . . . . . . . . . . . . . . . . . . . . . . . . . . . . . . . . . . 53Current WEP . . . . . . . . . . . . . . . . . . . . . . . . . . . . . . . . . . . . . . . . . . . . . . . . . . 55
The WEP Experience . . . . . . . . . . . . . . . . . . . . . . . . . . . . . . . . . . . . . . . . . . . . . . . . . . 61WEP sites . . . . . . . . . . . . . . . . . . . . . . . . . . . . . . . . . . . . . . . . . . . . . . . . . . . . . 61WEP activities . . . . . . . . . . . . . . . . . . . . . . . . . . . . . . . . . . . . . . . . . . . . . . . . . 64Enhanced WEP . . . . . . . . . . . . . . . . . . . . . . . . . . . . . . . . . . . . . . . . . . . . . . . . 65Criticisms . . . . . . . . . . . . . . . . . . . . . . . . . . . . . . . . . . . . . . . . . . . . . . . . . . . . . 67
V. “MEANINGFUL” WORK VERSUS DISPLACEMENT . . . . . . . . . . . . . . . . . . . . . . . . . . 71“Meaningful” Work . . . . . . . . . . . . . . . . . . . . . . . . . . . . . . . . . . . . . . . . . . . . . . . . . . . 71
Not “make-work” . . . . . . . . . . . . . . . . . . . . . . . . . . . . . . . . . . . . . . . . . . . . . . . 71Building skills . . . . . . . . . . . . . . . . . . . . . . . . . . . . . . . . . . . . . . . . . . . . . . . . . . 72Not an alternative to work . . . . . . . . . . . . . . . . . . . . . . . . . . . . . . . . . . . . . . . . 73
Displacement . . . . . . . . . . . . . . . . . . . . . . . . . . . . . . . . . . . . . . . . . . . . . . . . . . . . . . . . 74Agreements with unions . . . . . . . . . . . . . . . . . . . . . . . . . . . . . . . . . . . . . . . . . . 74Only attrition? . . . . . . . . . . . . . . . . . . . . . . . . . . . . . . . . . . . . . . . . . . . . . . . . . 76
VI. “UNSUBSIDIZED EMPLOYMENT” . . . . . . . . . . . . . . . . . . . . . . . . . . . . . . . . . . . . . . . 81Earnings Disregards . . . . . . . . . . . . . . . . . . . . . . . . . . . . . . . . . . . . . . . . . . . . . . . . . . . 81Combining Work and Welfare . . . . . . . . . . . . . . . . . . . . . . . . . . . . . . . . . . . . . . . . . . . 82
VII. EDUCATION AND TREATMENT ACTIVITIES . . . . . . . . . . . . . . . . . . . . . . . . . . . . . 85Required Participation . . . . . . . . . . . . . . . . . . . . . . . . . . . . . . . . . . . . . . . . . . . . . . . . . 86
WEP with education and treatment activities . . . . . . . . . . . . . . . . . . . . . . . . . . 86Three-plus-two . . . . . . . . . . . . . . . . . . . . . . . . . . . . . . . . . . . . . . . . . . . . . . . . . 87Education and treatment alone . . . . . . . . . . . . . . . . . . . . . . . . . . . . . . . . . . . . . 89
Education and Treatment Activities . . . . . . . . . . . . . . . . . . . . . . . . . . . . . . . . . . . . . . . 90Limited English or reading skills . . . . . . . . . . . . . . . . . . . . . . . . . . . . . . . . . . . . 90Disability . . . . . . . . . . . . . . . . . . . . . . . . . . . . . . . . . . . . . . . . . . . . . . . . . . . . . 91Pregnancy . . . . . . . . . . . . . . . . . . . . . . . . . . . . . . . . . . . . . . . . . . . . . . . . . . . . . 93Substance abuse . . . . . . . . . . . . . . . . . . . . . . . . . . . . . . . . . . . . . . . . . . . . . . . . 93HIV/AIDS . . . . . . . . . . . . . . . . . . . . . . . . . . . . . . . . . . . . . . . . . . . . . . . . . . . . 95Domestic violence . . . . . . . . . . . . . . . . . . . . . . . . . . . . . . . . . . . . . . . . . . . . . . 96Elderly . . . . . . . . . . . . . . . . . . . . . . . . . . . . . . . . . . . . . . . . . . . . . . . . . . . . . . . 96Veterans . . . . . . . . . . . . . . . . . . . . . . . . . . . . . . . . . . . . . . . . . . . . . . . . . . . . . . 96Caretaker relative cases . . . . . . . . . . . . . . . . . . . . . . . . . . . . . . . . . . . . . . . . . . 97Teen school dropouts . . . . . . . . . . . . . . . . . . . . . . . . . . . . . . . . . . . . . . . . . . . . 97Criminal justice . . . . . . . . . . . . . . . . . . . . . . . . . . . . . . . . . . . . . . . . . . . . . . . . . 97College attendance . . . . . . . . . . . . . . . . . . . . . . . . . . . . . . . . . . . . . . . . . . . . . . 97

iii
VIII. SANCTIONS . . . . . . . . . . . . . . . . . . . . . . . . . . . . . . . . . . . . . . . . . . . . . . . . . . . . . . . . . 99Predominantly Partial Sanctions . . . . . . . . . . . . . . . . . . . . . . . . . . . . . . . . . . . . . . . . . . 99
TANF rules . . . . . . . . . . . . . . . . . . . . . . . . . . . . . . . . . . . . . . . . . . . . . . . . . . . 99New York State’s rules . . . . . . . . . . . . . . . . . . . . . . . . . . . . . . . . . . . . . . . . . 101
Increased Sanctioning . . . . . . . . . . . . . . . . . . . . . . . . . . . . . . . . . . . . . . . . . . . . . . . . 103Sanctions in New York City . . . . . . . . . . . . . . . . . . . . . . . . . . . . . . . . . . . . . . 104National rates . . . . . . . . . . . . . . . . . . . . . . . . . . . . . . . . . . . . . . . . . . . . . . . . . 105
“Happily Sanctioned?” . . . . . . . . . . . . . . . . . . . . . . . . . . . . . . . . . . . . . . . . . . . . . . . . 107Bearable costs . . . . . . . . . . . . . . . . . . . . . . . . . . . . . . . . . . . . . . . . . . . . . . . . 107Less participation . . . . . . . . . . . . . . . . . . . . . . . . . . . . . . . . . . . . . . . . . . . . . . 109
IX. MONETARY COSTS VERSUS MONETARY BENEFITS . . . . . . . . . . . . . . . . . . . . . . 113Costs . . . . . . . . . . . . . . . . . . . . . . . . . . . . . . . . . . . . . . . . . . . . . . . . . . . . . . . . . . . . . 113
Administrative costs . . . . . . . . . . . . . . . . . . . . . . . . . . . . . . . . . . . . . . . . . . . . 114Support services . . . . . . . . . . . . . . . . . . . . . . . . . . . . . . . . . . . . . . . . . . . . . . . 116Education and treatment services . . . . . . . . . . . . . . . . . . . . . . . . . . . . . . . . . . 119Total costs . . . . . . . . . . . . . . . . . . . . . . . . . . . . . . . . . . . . . . . . . . . . . . . . . . . 119
Monetary Benefits . . . . . . . . . . . . . . . . . . . . . . . . . . . . . . . . . . . . . . . . . . . . . . . . . . . 120Value of services . . . . . . . . . . . . . . . . . . . . . . . . . . . . . . . . . . . . . . . . . . . . . . 120Reduced welfare payments . . . . . . . . . . . . . . . . . . . . . . . . . . . . . . . . . . . . . . . 122
A net monetary benefit? . . . . . . . . . . . . . . . . . . . . . . . . . . . . . . . . . . . . . . . . . . . . . . . 124
X. THE CASELOAD DECLINE . . . . . . . . . . . . . . . . . . . . . . . . . . . . . . . . . . . . . . . . . . . . . 127A 59 Percent Decline . . . . . . . . . . . . . . . . . . . . . . . . . . . . . . . . . . . . . . . . . . . . . . . . . 129
Decline . . . . . . . . . . . . . . . . . . . . . . . . . . . . . . . . . . . . . . . . . . . . . . . . . . . . . . 130Dynamics. . . . . . . . . . . . . . . . . . . . . . . . . . . . . . . . . . . . . . . . . . . . . . . . . . . . 134
Increased Churning and Cycling . . . . . . . . . . . . . . . . . . . . . . . . . . . . . . . . . . . . . . . . . 139
XI. ASSESSING THE IMPACT OF FULL ENGAGEMENT . . . . . . . . . . . . . . . . . . . . . . . . 143No Useful Evaluation . . . . . . . . . . . . . . . . . . . . . . . . . . . . . . . . . . . . . . . . . . . . . . . . . 143Systematic Evaluation Needed . . . . . . . . . . . . . . . . . . . . . . . . . . . . . . . . . . . . . . . . . . 146
Randomized experiments . . . . . . . . . . . . . . . . . . . . . . . . . . . . . . . . . . . . . . . . 147Testing policy options . . . . . . . . . . . . . . . . . . . . . . . . . . . . . . . . . . . . . . . . . . . 148
APPENDIX A
TABLES . . . . . . . . . . . . . . . . . . . . . . . . . . . . . . . . . . . . . . . . . . . . . . . . . . . . . . . . . . 153

iv
LIST OF FIGURES
Figure 1 Unengageable Family Assistance Cases, New York City, 1996–2002
Figure 2 Unengageable Safety Net Assistance Cases, New York City, 1996–2002
Figure 3 Engageable Family Assistance Cases, New York City, 1996–2002
Figure 4 Engageable Safety Net Assistance Cases, New York City, 1996–2002
Figure 5 Family Assistance Cases: Engagement Status, New York City, 1996–2002
Figure 6 Safety Net Assistance Cases: Engagement Status, New York City, 1996–2002
Figure 7 Work Experience Program Participation, New York City, March 1997–September2001
Figure 8 Engageable Family Assistance Cases, Engagement Status, December 1999
Figure 9 Engageable Safety Net Assistance Cases, Engagement Status, December 1999
Figure 10 Welfare’s Growth and Decline, United States, 1960–2002
Figure 11 Welfare’s Growth and Decline, New York City, 1960–2002
Figure 12 Family Assistance Declines, New York City versus Rest of State, 1993–2002
Figure 13 Safety Net Assistance Declines, New York City versus Rest of State, 1993–2002
Figure 14 Family Assistance: Total Openings and Closings, New York City, 1993–2001
Figure 15 Family Assistance Applications (Reapplications, New Openings, and Reopenings):Total Openings, and Closings, New York City, 1993–2001
Figure 16 Welfare’s Growth and Decline, United States versus New York City, 1960–2002

v
LIST OF TABLES
Table 1 Average Monthly Number of Adults in Work Experience, UnsubsidizedEmployment, or Sanctioned, Fiscal Year 2000
Table 2 Work Experience Assignments by Agency, Selected Points in Time
Table A.1 Unengageable Family Assistance Cases, New York City, 1996–2002
Table A.2 Unengageable Safety Net Assistance Cases, New York City, 1996–2002
Table A.3 Engageable Family Assistance Cases, New York City, 1996–2002
Table A.4 Engageable Safety Net Assistance Cases, New York City, 1996–2002
Table A.5 Family Assistance Cases: Engagement Status, New York City, 1996–2002
Table A.6 Safety Net Assistance Cases: Engagement Status, New York City, 1996–2002
Table A.7 Work Experience Program Participation, New York City, March 1997–September2001
Table A.8 Engageable Family Assistance Cases, Engagement Status, December 1999
Table A.9 Engageable Safety Net Assistance Cases, Engagement Status, December 1999
Table A.10 Welfare’s Growth and Decline, United States, 1960–2002
Table A.11 Welfare’s Growth and Decline, New York City, 1960–2002
Table A.12 Family Assistance Declines, New York City versus Rest of State, 1993–2002
Table A.13 Safety Net Assistance Declines, New York City versus Rest of State, 1993–2002
Table A.14 Family Assistance Applications: Total Openings and Closings, New York City,1993–2001
Table A.15 Family Assistance Applications (Reapplications, New Openings, and Reopenings):Total Openings and Closings, New York City, 1993–2001
Table A.16 Welfare’s Growth and Decline, United States versus New York City, 1960–2002

vi

vii
ACKNOWLEDGMENTS
We would like to take this opportunity to thank some of the people who helped uscomplete this volume. At the New York City Human Resources Administration (HRA), SethDiamond and Swati Desai provided the most helpful data about the agencies’ operations andpatiently answered our many questions. Jason Turner, HRA commissioner from 1998 through2001, and Mark Hoover, former first deputy commissioner, helped fill gaps in the information wecollected and provided key insights about the program and the policies.
In addition, we learned much about HRA’s welfare reform program from the other paperscommissioned as part of this effort. Particularly helpful was the paper by Michael Wiseman onHRA’s case-handling process. And, of course, as even a cursory examination of this reportreveals, we relied heavily on an Urban Institute report by Demetra Smith Nightingale, NancyPindus, Frederica D. Kramer, John Trutko, Kelly Mikelson, and Michael Egner not only forprogram information but also to corroborate (or question) our own conclusions and the claims ofothers.
Many people contributed to this volume. Marie Cohen authored the initial drafts ofsections III, V, and VII and contributed to sections IX and X. Anne Shi performed most of thestatistical analysis for this study and prepared all the figures and tables in this report. EricWeingart and Christine Imholt edited the draft and made many helpful suggestions about how itmight be improved.
Lastly, we would like to thank the Bodman Foundation and William H. DonnerFoundation for the funding that enabled us to complete and disseminate this report. Throughoutthis project, Joseph Dolan of the Bodman Foundation was a supportive force and wise soundingboard. Anita Winsor of the Donner Foundation early on appreciated the importance of what washappening in New York City and encouraged us to tell the story to the rest of the nation.
Douglas J. BesharovPeter Germanis

viii
1See generally Karlyn H. Bowman, “Attitudes About Welfare Reform,” AEI Studies in Public Opinion,July 2002, available from: www.aei.org/docLib/20030103_psbowman11.pdf, accessed February 14, 2003.
2Workfare programs are a form of work experience program, but they are limited to programs that requirerecipients to perform actual work designed to produce real goods and services—in other words, to “work off” all orpart of a welfare grant. But see Thomas Brock, David Butler, and David Long, Unpaid Work Experience forWelfare Recipients: Findings and Lessons from MDRC Research (New York: Manpower Demonstration ResearchCorporation, 1993), p. 1, stating: “The term workfare has various meanings. Sometimes it is used narrowly todescribe programs that require welfare recipients to work a prescribed number of hours to ‘earn’ their welfaregrant. Workfare is also used more broadly to refer to any program that imposes an obligation on welfare recipients,possibly including unpaid work experience but also activities such as job search, education, and vocationaltraining. To avoid ambiguity, this paper uses ‘unpaid work experience’ in the first, narrow sense, and ‘welfare-to-work program’ for the broader definition.”
3See Blanche Bernstein, The Politics of Welfare: The New York City Experience (Cambridge: Abt Books,1982), p. 42.
I. INTRODUCTION
On the surface, mandatory work and work-related activities for welfare recipients seemimmensely popular with the public. Poll after poll documents broad support for them.1
Consequently, over the years many proposals have been made to require welfare recipients towork in return for assistance (“workfare” or “work experience programs”)2 or to engage in otherspecific work-related activities (e.g., subsidized and unsubsidized employment and on-the-jobtraining). We call this approach a full-engagement welfare program.
Supporters see such mandatory activities for welfare recipients as a way to build the jobskills of recipients who do not have an extensive employment history while fulfilling the reciprocalobligation between recipient and government. It does not hurt that such programs also “smokeout” recipients who are working (usually under the table) unbeknownst to the agency.3 Moreover,work experience programs in particular also encourage recipients who can find a job to do so,because their choice is either work experience or a “real job,” as they put it. Even if mothers arenot helped to find jobs, many supporters believe that purposeful activity rather than inactivity maybe better for most welfare mothers.
Yet, the political process has been hesitant to respond to the wide support for workfare.Until the passage of the 1996 welfare reform law, opponents of mandatory work were able towater down the work requirements that, since the 1960s, have regularly been proposed inCongress.
A major reason the opponents have succeeded is that participation mandates, especiallywith regard to work experience programs, also inspire intense opposition. In the 1970s, for

4David Whitman, “Welfare: Where Do We Go From Here?,” The Atlantic Online, posted March 25, 1997,available from: www.theatlantic.com/unbound/forum/welfare/readers.htm, accessed August 6, 2002, stating:“Jimmy Carter’s Program for Better Jobs and Income, which had as its centerpiece the largest public service jobsprogram for welfare recipients since at least the New Deal, was spurned as ‘slavefare.’”
5The Work Incentive (WIN) program, created in 1967, allowed states to operate a work experienceprogram, where a participant could be assigned to a full-time position for a limited number of weeks, irrespectiveof the grant level. This approach could create situations in which participants effectively worked for less than theminimum wage. The Family Support Act of 1988 replaced WIN with the Job Opportunities and Basic SkillsTraining (JOBS) program, which allowed states to continue to operate a WIN-like work experience program,subject to approval from the U.S. Department of Health and Human Services.
6Laura Wernick, John Krinsky, and Paul Getsos, The Work Experience Program: New York City’s PublicSector Sweat Shop Economy (New York: Community Voices Heard, 2000), p. 5, available from:www.cvhaction.org/Publications.html, accessed January 23, 2002.
7Technically, the welfare reform law passed by Congress is the Personal Responsibility and WorkOpportunity Reconciliation Act of 1996 (PRWORA), of which TANF is a part.
2
example, the opponents of workfare programs successfully labeled them “slavefare”4—becausedisadvantaged mothers would be forced to work for the minimum wage or less5 in jobs thatshould pay much more. Critics also argued that a mandatory work program would create asecond-class workforce that would be paid less than regular workers for doing the same workwhile displacing regular employees. In 2002, one advocacy group called New York City’s WorkExperience Program (WEP) “a public employment program, in which workers are performingcritical services for the citizens of the city for no pay and keeps people trapped in poverty whiledisplacing a full-time union workforce.”6 Most public service unions also oppose work experienceprograms, largely because they fear losing public jobs (“worker displacement”).
State leaders, even very conservative ones, have shied away from work experienceprograms not just because of the political controversy they generate but also because of the costsand administrative challenges they involve. Such programs—again, especially those involving realwork experience—are difficult to operate; they pose tremendous administrative challenges infinding and managing sites as well as in keeping track of participants and sanctioning them whenthey fail to comply. They are also expensive: as much as two or three times more costly than cashassistance (particularly if every participating mother claims child care assistance).
TANF
Hence, as late as the mid-1990s, many experts on the right as well as the left believed thatwork experience programs were not worth the political and financial costs entailed. Then camethe 1996 welfare reform law, the Temporary Assistance for Needy Families (TANF) program,7
which mandates that states impose work- and education-related participation requirements on asuccessively larger share of the caseload. Through TANF, “The American public has made clearthat work by welfare recipients is a defining goal of state and federal welfare laws, the pursuit of

8Robert A. Moffitt, From Welfare to Work: What the Evidence Shows, Welfare Reform and Beyond Series,Policy Brief No. 13 (Washington, D.C.: The Brookings Institution, January 2002), p. 1, available from:www.brook.edu/wrb/publications/pb/pb13.pdf, accessed February 12, 2002.
9City of New York, Human Resources Administration, Ladders to Success: Innovations in CityGovernment (New York: Human Resources Administration, 2000), p. 15.
10Under TANF, the required participation rates are reduced by the “caseload reduction credit.” The creditreduces the state’s required participation rate by one percentage point for each percentage point that the state’swelfare caseload falls below the 1995 level. (Caseload reductions due to eligibility changes, such as full-familysanctions, cannot be counted in measuring the caseload decline.) The sharp decline in the rolls since 1995 has allbut eliminated the need for most states to establish mandatory work programs.
11U.S. Department of Health and Human Services, Office of Planning, Research, and Evaluation,Temporary Assistance for Needy Families (TANF) Program: Fourth Annual Report to Congress (Washington,D.C.: U.S. Department of Health and Human Services, April 2002), p. III–96, available from:www.acf.dhhs.gov/programs/opre/ar2001/indexar.htm, accessed October 13, 2002. The range for this categoryreflects the fact that there may be recipients participating in more than one activity. The 11 to 16 percent of thenational caseload who were participating in a program activity does not include those who were combining workand welfare unless they were participating in another program activity.
12U.S. Department of Health and Human Services, Temporary Assistance for Needy Families (TANF)Program: Fourth Annual Report to Congress, p. III–96. The range for this category reflects the fact that there maybe recipients participating in more than one activity. The 16 to 23 percent of the national caseload who participatein a program activity does not include those who were combining work and welfare unless they were participatingin another program activity.
3
which deserves the highest priority in social welfare policy,”8 writes Robert Moffitt, professor ofeconomics at Johns Hopkins University.
The “work” issue was supposed to have been settled by TANF’s seemingly tough“participation standards” on recipients. By 2002, 50 percent of all families receiving TANF(except child-only cases) were to be in one or more specified activities for at least thirty hours perweek (twenty hours per week for a single parent with a child under age six).9 A separate, higherrequirement applies to two-parent families: 90 percent were to be in work-related activities forthirty-five hours per week (or fifty-five hours per week if the family was receiving a child caresubsidy) by 2002.
It did not turn out that way. No state was actually required to establish a mandatory workregime, because TANF’s caseload reduction credit reduced the effective participation rate formost states to zero.10 In the absence of an operative federal mandate, and contrary to the widelyheld view, in 2000 only about 3 percent of the national caseload was actually in mandatory workprograms and only between 11 and 16 percent were participating in any program-related workactivity.11 Because about one-third of the national caseload consisted of child-only cases, thesepercentages would be slightly higher if limited to adults receiving assistance: about 4 percent inmandatory work programs and between 16 and 23 percent in any program-related work activity.12
13U.S. Department of Health and Human Services, Temporary Assistance for Needy Families (TANF)Program: Fourth Annual Report to Congress, p. III–96.
14U.S. Department of Health and Human Services, Office of Planning, Research, and Evaluation,Temporary Assistance for Needy Families (TANF) Program: Fifth Annual Report to Congress (Washington, D.C.:U.S. Department of Health and Human Services, April 2002), p. III-95, available from:www.acf.dhhs.gov/programs/opre/ar2001/indexar.htm, accessed June 16, 2004.
15Direct work activities are roughly akin to TANF’s “core” activities and represent priority activities inwhich recipients must participate for a minimum number of hours to be counted toward the participationrequirements.
16See Douglas J. Besharov and Peter Germanis, Toughening TANF: How Much? And How Attainable? AnAnalysis of Participation Requirements in the House and Senate Bills to Reauthorize the Temporary Assistance for
4
Only a few places have created large-scale work experience programs, mainly Ohio, NewJersey, Wisconsin, and New York City.13 This should not be surprising. In the past, states haveshown little interest in operating work experience programs.
What happened? The massive caseload decline combined with various TANF provisions toexcuse states from having to establish mandatory work programs. Essentially, a state’s caseloaddecline is credited toward its TANF participation requirements, thereby lowering them. Inaddition, because recipients who combine work and welfare also count toward participationrequirements, the large number of combiners satisfied whatever was left of the TANFrequirements regarding single mothers on welfare. (In many states, however, those factors werenot sufficient to meet the higher participation requirements for two-parent families. But instead ofcreating mandatory work programs for such families, many states simply transferred their two-parent welfare families to what are called “separate state programs” that had no federalparticipation requirements.14)
Toughening TANF’s participation requirements has been a key element in the debate overits reauthorization, and it is widely expected that Congress will substantially increase them whenand if TANF is reauthorized. The reauthorizing bill that passed the House of Representatives in2003 would raise both the required participation rate and the required hours of participation. Theminimum participation rates would rise by five percentage points each year, beginning at 50percent in 2004 and going to 70 percent in 2008. The bill would also increase the required hoursof participation, from thirty hours per week (twenty hours for a mother with a child under age six)to forty hours per week. The forty-hour requirement would be divided between “direct” workactivities for twenty-four hours and other state-defined work, training, or education activities forthe remaining sixteen hours.15 The Senate version of the reauthorization bill (“S. XXX”) has manysimilar provisions, such as an increase in the required participation rate to 70 percent, but it hassome differences in the hours of participation required and countable activities and introduces anemployment credit to replace the existing caseload reduction credit. (There is less than meets theeye to these proposals, because various provisions would allow most states to come into technicalcompliance without actually increasing participation.)16

Needy Families Program, and of Likely State Responses to Them (College Park, MD: University of Maryland,School of Public Affairs, Welfare Reform Academy, March 23, 2004), pp. 40–41, available from:www.welfareacademy.org/pubs/welfare/toughening_tanf.pdf, accessed July 9, 2004.
17See Demetra Smith Nightingale and Kelly S. Mikelson, An Overview of Research Related to WisconsinWorks (W-2) Washington, D.C.: Urban Institute, March 2000), p. i, available from:www.urban.org/pdfs/wisc_works.pdf, accessed December 12, 2002.
18Two types of welfare families were not included in W-2 because the adult caretakers were not consideredappropriate for the program’s work requirements. Children whose parents received Supplemental Security Incomeand could not work due to illness or incapacity were converted to the Caretaker-Supplement program. In addition,children living with non-legally responsible relatives, such as a grandmother or aunt, and who otherwise might beplaced in foster care were converted to the state’s Kinship Care program.
19Under HRA’s definition, “full engagement” means that all adults in recipient families are (1)participating in an approved work-related activity (including specified educational and treatment activities), (2) inthe process of being assigned to a work-related activity, or (3) sanctioned or in the process of being sanctioned.
20See City of New York, Human Resources Administration (HRA), Ladders to Success: Innovations inCity Government (New York: Human Resources Administration, 2000), p. 15.
5
Are such toughened participation requirements feasible? And what should they look like?
New York City as a Model
One model would surely be the Wisconsin Works (W-2) program, the nation’s first (andonly) statewide, high-participation, work-oriented welfare system. So it is natural that much of theresearch and writing about mandatory work activities has focused on the W-2 program. Forexample, Demetra Nightingale, director of the Welfare and Training Research Program at theUrban Institute, and Kelly Mikelson of the Urban Institute summarized fifty-three ongoing orcompleted studies of the W-2 program, concluding that it is “one of the most studied in thenation.”17 Indeed, Wisconsin’s experience has much to teach all states, but it provides a somewhatspecialized model. Through a combination of political happenstance and opportunistic leadership,Wisconsin essentially abolished its cash-welfare system and substituted a system based almostentirely on work.18 W-2 participants are assigned to either subsidized or unsubsidized work slotson the basis of their employability. Current and former recipients are also eligible for a range ofprogram services intended to help them find or retain employment, increase their skills or wages,and overcome barriers to employment.
For states that may not want to change their welfare systems as completely as Wisconsindid (or may not be able to do so), New York City’s welfare reform experience may be morerelevant. In a city with a liberal political environment and a large population of disadvantaged,multigenerational welfare families, it operates a nearly universal “full-engagement”19 modelgenerally involving twenty hours of mandatory work and fifteen hours of mandatory participationin “work skills or educational development and/or treatment with a continuous job searchcomponent.”20 The object is “to make work central in the lives of every able-bodied New Yorker

21City of New York, HRA, Ladders to Success: Innovations in City Government, p. 25.
22City of New York, HRA, Ladders to Success: Innovations in City Government, p. 2, stating: “Ladders toSuccess is the City of New York’s welfare reform program. The Ladders to Success program is the all-encompassing framework and approach for the City’s public assistance, welfare-to-work, and support programs.Ladders to Success encompasses the city-wide implementation of various programs and activities focused on work.. . . For example, within HRA, the Family Independence Administration (FIA) has applied the concepts of Laddersto Success to the Job Centers.” (emphasis in original)
23Demetra Smith Nightingale, Nancy Pindus, Frederica D. Kramer, John Trutko, Kelly Mikelson, andMichael Egner, Work and Welfare Reform in New York City During the Giuliani Administration: A Study ofProgram Implementation (Washington, D.C.: Urban Institute Labor and Social Policy Center, July 2002), p. 3.
24New York City Human Resources Administration, “FA/TANF - December 26, 1999 - Weekly Report”and “PA - December 26, 1999 - Weekly Report.”
25Unlike New York City’s count of work experience participants, which is based on a specific month, theWisconsin figure is an average monthly count of participants for the year. This difference does not materially affectthe comparison. See U.S. Department of Health and Human Services, Administration for Children and Families,Office of Planning, Research and Evaluation, Temporary Assistance for Needy Families Program: Third AnnualReport to Congress (Washington, D.C.: U.S. Department of Health and Human Services, August 2000), p. 49,available from: www.acf.dhhs.gov/programs/opre/annual3.pdf, accessed August 6, 2002.
6
now receiving public assistance.”21 In addition to work experience and unsubsidized employment,other work-related activities include job search, job skills training, community service, andsubsidized employment. Moreover, to help make recipients more employable, New York Cityprovides a broad array of remedial and treatment services in combination with its mandatory workprogram (and sometimes in lieu of mandatory work).
Thus, New York City’s welfare reform program, Ladders to Success,22 provides analternative approach to mandatory work experience programs—and to fulfilling what are likely tobe TANF’s toughened participation requirements. Demetra Nightingale and her colleagues at theUrban Institute point out that
the experiences in New York City in the 1990s as it attempted to revamp the entirewelfare system—organizationally and philosophically—offer important lessons about thefeasibility and limits of (1) implementing large scale work experience programs; (2)restructuring and modernizing a large, entrenched bureaucracy; and (3) adapting serviceprograms to changing policy and economic conditions and caseload characteristics.23
At its peak, in December 1999, New York City’s Work Experience Program (WEP) was morethan seven times larger than Wisconsin’s; it had about 21,933 TANF/Family Assistance (FA)recipients and 15,320 state-funded Safety Net Assistance (SNA) recipients in various workactivities.24 In comparison, Wisconsin, at its high point in 1999, had only 5,434 adults in its workexperience program and only 7,408 adults in any work-related activity.25 So, whereas Wisconsin,

26See Besharov and Germanis, Toughening TANF, pp. 40–41.
27This example assumes a steady 4 percent decline each year between 2003 and 2006. Without a full-family sanction, the caseload would have to decline at least 6 percent per year between 2003 and 2006 for the cityto meet the requirements.
28See the box “Note About Data” in Section III.
29Burt S. Barnow and John Trutko, “Analysis of Performance-Based Contracting in Welfare Programs inNew York City,” unpublished paper submitted to Baruch College, City University of New York, December 2002;James Clark, “New York’s WEP Program,” unpublished paper submitted to Baruch College, City University ofNew York, 2001; Michael Wiseman, “Public Assistance in New York City: Accomplishments and Opportunities,”October 2002, available from: http://home.gwu.edu/%7Ewisemanm/NYCPA.pdf, accessed June 18, 2004; City ofNew York, HRA, Ladders to Success: Innovations in City Government; Nightingale, Pindus, Kramer, Trutko,Mikelson, and Egner, Work and Welfare Reform in New York City During the Giuliani Administration; Sally Satel,Welfare-to-Work for People with Drug and Alcohol Problems, unpublished paper submitted to Baruch College,City University of New York, January 22, 2002; and Kay E. Sherwood, “JobStat: Creating a Tool to Manage theReform of Welfare,” unpublished paper submitted to Baruch College, City University of New York, 2001.
7
with a much smaller population, had a higher proportion of its caseload in activities, New YorkCity had many more people in monitored activities.
Ironically, even with this record New York City would not easily meet the newrequirements proposed in the TANF reauthorization bills without H.R. 4’s caseload reductioncredit or S. XXX’s employment credit.26 And even those provisions will not be enough ifcaseloads remain flat or begin to rise. In fact, unless caseloads decline at least 4 percent a year, the city would not meet TANF’s requirements in 2007 (even if it were to adopt a full-familysanction).27
After tracing the welfare caseload decline in New York City, this report broadly describesthe city’s welfare reform program (“Ladders to Success”). In the absence of a definitiveevaluation of the program, this report relies on information from a variety of sources, includingHRA’s administrative data,28 visits to various agencies involved in implementing the welfarereform program, extensive interviews with City officials, and HRA policy and proceduresmanuals. It also draws on other studies of the city’s program29 as well as research on similarprograms in other parts of the country. This information is used to reach tentative conclusionsabout some aspects of the program’s operations, costs, benefits, and impacts. It closes with adescription of a demonstration and evaluation strategy to help better understand such programs.
Lessons from New York City
Almost every objective observer agrees that the implementation of New York City’swelfare reform program was a tremendous administrative and managementaccomplishment—especially given the city’s bureaucratic and political environment. The City’sHRA demonstrated that it is possible to run a large work experience program that uses a “full-

30See, e.g., Nightingale, Pindus, Kramer, Trutko, Mikelson, and Egner, Work and Welfare Reform in NewYork City During the Giuliani Administration, p. vii, stating: “Without question the City’s welfare reform is work-centered, with strong emphasis on ensuring that all able-bodied adults are subject to work requirements, rapidimposition of sanctions for those who do not comply, and assignment to WEP jobs for those who are not employedin the regular labor market.”
31Nightingale, Pindus, Kramer, Trutko, Mikelson, and Egner, Work and Welfare Reform in New York CityDuring the Giuliani Administration, p. iii, stating: “New York City has more welfare recipients than any other cityin the nation— one out of every 13 cases nationwide receiving Temporary Assistance for Needy Families (TANF)(FA in New York) in 2001—and represents one of the strictest systems in terms of work participationrequirements. As such, the operational experiences suggest lessons important to New York City and to federalwelfare policymakers implementing large scale work programs—lessons about restructuring a large andentrenched bureaucracy and about adapting priorities and programs to changing policies, economic conditions, andcaseload characteristics.”
32See generally Jeffery Grogger, Lynn Karoly, and Jacob Alex Klerman, Consequences of WelfareReform: A Research Synthesis (Washington, D.C.: RAND, July 2002), available from:www.acf.hhs.gov/programs/opre/welfare_reform/reform_contents.html, accessed September 1, 2004.
8
engagement” model of case management requiring twenty hours per week of mandatory workexperience plus fifteen hours per week of mandatory educational and treatment services.30 As aresult, New York’s work experience program is widely seen as a model for how a high-intensityprogram should be run.31 Therefore, it is useful to consider the lessons that New York City’sexperience provides.
Unfortunately, no rigorous evaluation was performed to explore the impact of the HRAprograms on the city’s caseload. As a result, the lessons to be gleaned from them are limited andunavoidably tinged with the authors’ preconceived beliefs. Moreover, as reflected below, evensome basic information about program operations is unclear. Nevertheless, we believe that thefollowing conclusions reflect a reasonably objective reading of the evidence described in thisreport (which is broadly consistent with past welfare research).32
AFDC versus TANF.
• The HRA succeeded in establishing a high-participation, work-oriented welfare systemlargely by using the tools provided under the old Aid to Families with Dependent Children(AFDC) program. It does not have TANF’s two most well-known components: a full-family sanction or a time limit on benefits. It does, however, have two other importantTANF tools: the ability to deny eligibility to applicants who fail to perform a job search orcomply with other application requirements and the ability to increase the earningsdisregard.
• The impact of a TANF-like program did not get a full test in New York City because ofthe absence of full-family sanctions for most forms of noncompliance and the absence of atrue time limit on benefits. Some forms of noncompliance, however, did receive a full-

9
family sanction; in addition, at least initially, some confusion existed among recipientsabout whether their benefits were subject to a time limit.
Participation rates.
• Beginning the engagement process as soon as a family applies for welfare appears to haveraised participation rates.
• Careful assessment of illness and disability claims and providing services to address themsubstantially reduced the number of exemptions from participation granted for thosereasons from 9 percent of the FA caseload to 2 percent, even as the caseload was falling.
• Narrowing the age-of-child exemption for single parents from those having a child underage six to those having a child under three months old increased the number of adultsexpected to participate by about 50 percent. HRA’s experience suggests that mothers withsuch young children can work without severe disruption to the family. At the same time,however, new demands for child care and other support services were created.
• In any high-participation welfare regime, “unsubsidized employment” (i.e., combiningwork and welfare) is likely to be a major activity.
• The increase in child-only cases removed a growing share of the caseload from theengageable caseload; developing strategies to engage this group may be the next bigchallenge.
• Even New York City, with one of the largest work experience programs in the nation,would not meet the putative 70 percent participation requirement in the pending bills toreauthorize TANF, because they do not count sanctioned cases as “participating.” As ofDecember 2002, about 17 percent of its engaged cases were “in sanction process” andanother 17 percent were in the “in engagement process,” neither of which is considered acountable TANF activity. In addition, the nearly 10 percent of its caseload exempted fromparticipation due to age, disability, health, or other problems would be subject to TANFparticipation requirements. Combined, these categories would account for about half ofthe caseload subject to participation requirements.
• The proposed reauthorization of TANF sharply raises participation requirements. To meetthe new participation requirements (once they are fully phased in), New York City wouldhave to increase participation in its work experience and other activities by as much as 50percent (unless more welfare families were placed in separate state programs). (For thenation as a whole, the increase would have to be much larger, because the totalparticipation rate and the number of adults in work experience programs are considerablylower in most other states than in New York City.)

10
Management.
• Effective management can increase participation. The key tools are systematic monitoringof recipient activities, rapid placement into activities, structuring activities to meet specialneeds, minimizing downtime, and implementing other activities to minimize periods whenrecipients are not engaged in an activity.
• Using each welfare center (rather than individual recipients) as the locus of managementfocused accountability and allowed senior HRA staff to target incentives (such asemployee rewards) for successful engagement. Regular meetings between headquartersstaff and personnel at individual Job Center offices, which included using JobStat toreview operations and performance, concentrated agency efforts on finding ways toimprove operations and outcomes.
Work experience assignments.
• Work experience programs can be implemented on a large scale—and quickly. However,it helps to have a history of operating such programs, strong political leadership that wantsto implement the program, and a fiscal situation in which recipients can be placed in workassignments involving jobs vacated by attrition.
• After initial reluctance to participate in providing work experience positions, partly out ofconcerns about additional costs of supervision and the effects on the regular workforce,City agencies incorporated participants into their workforce without undue disruption, andgradually came to rely on those workers as an important resource in providing improvedservices to the city.
• Most welfare recipients can be used productively in work experience assignments andprovide valuable public services. It is possible to create work experience positions toaccommodate recipients having a wide range of capabilities, including the mildly disabled.
• Concern about displacement limited the type of work experience assignments and the levelof job skills they provided. The more that work experience assignments are like jobs, andthe more hours that are involved, the greater the concern about possible displacement willbe.
• The number of work experience slots necessary to engage a given caseload is far below100 percent of the total caseload and is probably close to 10 or 15 percent. When thenumber of people who must be processed in a large system, as well as those notparticipating for other reasons, are taken into account the number of full-time work slotsnecessary to reach full engagement is small and manageable. For example, turnover is highas individuals realize they can move into unsubsidized employment rapidly and otherscease participating altogether (and may be sanctioned), creating new positions.

33Depending on how services are valued and whether the recipient is working twenty versus thirty-fivehours per week.
11
Costs versus benefits of WEP.
• The approximate annual costs of operating a New York City work experience slotincluded site administration ($1,450); participant monitoring ($2,144); child care ($4,570);transportation ($884); and education and treatment (unknown amount).
• The monetary benefits of the New York City WEP included the value of services ($5,150to $18,375),33 reduced caseload (unknown amount), and reduced welfare payments($5,035 in savings from sanctions, but no estimate of savings or costs because recipientscombine work and welfare). Total benefits ranged from $10,185 to $23,410.
• Even using the most conservative estimate of the monetary benefits of the New York CityWEP (i.e., a part-time slot at the minimum wage, or $5,150), because of the savings fromsanctions ($5,035), WEP benefits covered the cost of site administration and participantmonitoring ($3,594) as well as the costs of child care and transportation ($5,454). Thisconservative valuation of the services provided by recipients would not exceed total costs,however, once expenditures on ancillary education and treatment services were factoredin. The costs of such services would be covered only if the value of the participants’ workwere set at that of low-level city workers or if the work assignment were full-time.
Sanctions.
• HRA’s sanctioning process was expanded and streamlined so that it could handle largenumbers of sanction cases, with apparent fairness and dispatch.
• Partial sanctions can motivate many welfare recipients to participate in work and work-related activities, but they also allow many others to avoid participating and to be “happilysanctioned.” Obtaining cooperation from the most recalcitrant recipients seems to requirethe threat of a full-family sanction. Nevertheless, full-family sanctions and time-limitedbenefits are not needed to operate a large-scale work experience program. In fact, onereading of the New York City experience is that many recipients (although probably notmost) are eager to participate in meaningful work experience programs.
• Although full-family sanctions sometimes impose additional hardship for families, theymay be fairer and more humane than other, more absolute remedies. For example, using“conditions of eligibility” to address noncompliance limits the tools that the agency hasavailable to protect the well-being of the child and family.
12
Caseload decline.
• Between March 1995 and July 2002, New York City experienced a 71 percent decline inFA cases and a 54 percent decline in SNA cases. This decline, however, included the casesthat reached the five-year time limit and were then converted to SNA, under which theycontinued to receive essentially the same benefits. Taking these cases into considerationwould mean that the FA caseload fell 59 percent.
• At the same time, it appears that although “churning” has substantially increased, NewYork City’s rates of coming on and going off welfare remain lower than the equivalentnational figures.
Safety Net Assistance cases.
• The SNA program’s full-family sanctions help keep participation rates high and may havea larger “smokeout effect” than the partial sanctions in the FA program.
• SNA recipients are much more likely than FA recipients to have substance abuse problemsthat limit their full participation in work activities. Among those deemed engageable,about one-third participate in treatment activities at any given point in time.
• Even in the SNA program, careful assessment of illness and disability claims (and servicesto address them) can reduce the number of exemptions from participation granted forthose reasons. Nevertheless, about one-third of the SNA caseload is exempt due to age ordisability and is not likely to participate in work activities.
• The benefits of an SNA work experience program are likely to exceed its costs, especiallybecause child care costs are low, job training and other services are minimized, andsanction savings are high (as a result of the full-family sanction for single adults).
• Unsubsidized employment (combining work and welfare) is not a major component ofSNA participation, probably because the welfare grant for single-person households isrelatively low.
Impacts.
• No definitive evidence proves that “work first” reduced caseloads in New York City, butthe research literature indicates that it probably did.

34See Blanche Bernstein, The Politics of Welfare, p. 42.
35See, e.g., Judith M. Gueron and Gayle Hamilton, The Role of Education and Training in WelfareReform, Welfare Reform and Beyond Series, Policy Brief No. 20 (Washington, D.C.: The Brookings Institution,April 2002); Daniel Friedlander, David H. Greenberg, and Philip K. Robins, “Evaluating Government TrainingPrograms for the Economically Disadvantaged,” Journal of Economic Literature 35, no. 4, December 1997, pp.1809–1855.
13
• No definitive evidence proves that WEP reduced caseloads, but the research literatureindicates that it probably did. If nothing else, WEP would have smoked out at least someof the recipients with jobs or other sources of support.34
• No definitive evidence proves that HRA’s remedial and treatment services had any impacton caseloads, but the research literature is mixed about whether they did.35
• No definitive evidence proves that “unsubsidized employment” reduced caseloads in NewYork City, but the research literature indicates that it probably did.
• Pending evaluations of the Personal Roads for Individual Development and Employment(PRIDE) program and the Substance Abuse Case Management program being conductedby the Manpower Demonstration and Research Corporation should shed light on thesetwo important programs.
Future research.
• Little reliable, up-to-date research exists to answer key questions regarding theimplementation or effectiveness of full-engagement welfare programs.
• A comprehensive evaluation of full-engagement welfare programs should be a priorityafter TANF’s reauthorization.

14

36Gayle Hamilton and Susan Scrivener, Promoting Participation: How to Increase Involvement inWelfare-to-Work Activities (New York: Manpower Demonstration Research Corporation, September 1999), pp.65–67, available from: www.mdrc.org/Reports99/PromotingParticipation.pdf, accessed September 19, 2001.
37Much of this section is based on information described in Michael Wiseman, “Public Assistance in NewYork City: Accomplishments and Opportunities,” October 2002, available from:http://home.gwu.edu/%7Ewisemanm/NYCPA.pdf, accessed June 18, 2004; Seth Diamond, former deputycommissioner for Operations, NYC HRA, various conversations with Marie Cohen and Douglas Besharov,November to December 2001; and Marie Cohen and Douglas Besharov, site visits in November 2001.
38Demetra Smith Nightingale, Nancy Pindus, Frederica D. Kramer, John Trutko, Kelly Mikelson, andMichael Egner, Work and Welfare Reform in New York City During the Giuliani Administration: A Study ofProgram Implementation (Washington, D.C.: Urban Institute Labor and Social Policy Center, July 2002), pp. v–vi(emphasis added).
15
II. CASE FLOW AND CASE MANAGEMENT
Many experts believe that an agency trying to move recipients from welfare to work needsto build and maintain a sense of momentum among recipients. That means minimizing periods ofdowntime between activities (e.g., when recipients are waiting for an activity to begin or whenthey are no longer exempt or deferred from participation requirements).
Based on their review of about a dozen welfare-to-work programs evaluated byManpower Demonstration Research Corporation (MDRC), Gayle Hamilton and Susan Scrivener,senior associates at MDRC, recommend limiting periods of inactivity, such as by assigningrecipients to activities quickly after the initial orientation or assessment; promoting flexibility inthe structure or scheduling of activities (such as open entry/open exit programs), having clearpolicies on deferral from participation (e.g., for a family crisis), closely monitoring participantswho are temporarily deferred, and arranging for quick re-entry into the program when participantswho have been working leave employment.36
That, in essence, describes the Human Resources Administration’s (HRA’s) work-centered, “full-engagement” model.37 To maximize participation and minimize inactivity ordowntime, applicants are required to engage in supervised job search as soon as they seekbenefits. “The welfare application process emphasizes job search before the case is actuallyapproved for benefits (to divert some from going on welfare) and intensive verification and fraudreviews,” as Nightingale and her colleagues describe.38 They continue:
To change the culture and priorities within local offices and to implement the newwork-centered policies, local welfare offices were renamed Job Centers, and theparticipant flow was changed so that individuals applying for welfare immediately wererequired to begin looking for work or engage in other activities. Most line staff positions

39Nightingale, Pindus, Kramer, Trutko, Mikelson, and Egner, Work and Welfare Reform in New York CityDuring the Giuliani Administration, p. v.
40See the discussion: “Work-related activities.”
41The Job Opportunity Specialist is a new position that consolidates the eligibility assessment andemployability planning functions formerly performed by two different workers. In some centers at the end of 2001,the applicant would still meet first with an eligibility technician. See Nightingale, Pindus, Kramer, Trutko,Mikelson, and Egner, Work and Welfare Reform in New York City During the Giuliani Administration, p. 10,stating: “HRA integrated the duties of the eligibility and employment staff in the Job Centers into the new JOSposition. JOS workers thus were responsible for intake as well as employment-focused case management, withmuch smaller caseloads than had been the case for line staff under the prior system. Conversion to the JOS positionbegan in Spring 2001, and most conversions were completed by the end of the year.”
16
were reclassified as Job Opportunity Specialists (JOS), which combined the functions ofeligibility and welfare-to-work caseworker into one position. Finally, many senior levelstaff were recruited from outside HRA and given clear mandates about employmentobjectives.39
Furthermore, if approved for benefits, recipients are immediately placed in a process designed toenroll them in carefully selected work-related activities, including the Work Experience Program(WEP), which provides a structured work assignment for each recipient who can work. In recentyears, work experience assignments have typically been combined with other education, training,and job search activities designed to increase employability and earnings, as described below.40
The following discussion describes programs as they operated in the 2002–2003 period,but practices may have changed since then. In addition, Family Assistance (FA) and Safety NetAssistance (SNA) cases are treated together because their case flow and management processesare similar; the minor differences between them reflect the particular characteristics of eachcaseload.
Intake and Work First
The intake process usually begins when a person seeking financial assistance approaches areceptionist at an HRA Job Center. After verifying that the prospective applicant has come to theright job center, the receptionist gives the person a ten-page set of forms that can be completed onsite (but need not be). The application covers cash assistance (FA or SNA), medical assistance,food stamps, and other support services.
Application and JOS interview. After turning in the paperwork, the applicant is referredto a Job Opportunity Specialist (JOS), who handles both eligibility and employment activities forthem.41 Whenever possible, this interview is scheduled immediately, but if the center staff is toobusy and no emergency needs are evident, the applicant may be asked to return one or two dayslater. Applicants who have been on welfare within the past thirty days skip the JOS and arereferred immediately to the Case Management Team previously responsible for the case.

42See the discussion: “Active single issues cases.”
43Burt S. Barnow and John Trutko, “Analysis of Performance-Based Contracting in Welfare Programs inNew York City,” unpublished paper submitted to Baruch College, City University of New York, December 2002.
44Other contractors may have had different base rates.
17
Immediate needs. The JOS reviews the applicant’s materials, explores the applicant’sneeds, and explains the participation obligations and time limits attached to the receipt of cashassistance. The JOS encourages applicants to pursue alternatives to cash assistance. After the JOShas explained the terms and conditions of assistance and addressed immediate needs, applicantsare given the opportunity to withdraw their applications (whether for cash assistance, medicalassistance, food stamps, or all three benefits).
The JOS also determines whether the applicant’s needs can be met by one-time assistance,such as expedited food stamps or a one-time cash grant, for example, to pay for rent or utilities.(These situations are called “active single issue cases” and are discussed below.)42
Assessing barriers to employment and referrals for services. As the eligibility processcontinues, discussions with the applicant help the JOS begin to develop the EmployabilityAssessment and Employment Plan (EAEP) to identify barriers to engaging in employment-relatedactivities, and to make additional referrals. Each major barrier to employment has a separatereferral process, and the JOS is responsible for monitoring the process and its outcomes.
For example, applicants needing child care are referred to providers, and the process ofobtaining child care payments is initiated. Applicants appearing to suffer from domestic violenceor reporting it are referred to a special unit, which may recommend an adjustment (or completesuspension) of the work obligation. Applicants reporting mental or physical health problems arereferred to a private contractor, Health Services Systems, for evaluation and recommendation ofappropriate activities. Applicants reporting or showing signs of substance abuse are referred to aspecial unit for assessment and any needed treatment.
Skills assessment and immediate job search. Once EAEP development has begun, childcare arrangements have been made, and applicants have been referred to be assessed for otheremployment barriers, the JOS refers them to a Skills Assessment and Placement (SAP) contractor.
HRA pays Employment Services Placement and SAP contractors on the basis of theirperformance. Burt Barnow, professor of economics at Johns Hopkins University, and JohnTrutko, of the Capital Research Corporation, describe HRA’s performance-based contractingsystem.43 For each contractor, a “base rate” is set for each participant. The contractor can receiveup to the full base rate if a series of milestones is achieved. For example, for one ESP contractor,the base rate was $4,641.44 Of this amount, the contractor would receive $1,856 for a jobplacement, $1,392 if the participant was still employed ninety days later, $464 if the participanthad “high wages” (more than $344 per week), and $928 if the participant was still employed

45The $928 is not a precise figure, but depends on whether the participant received public assistance at thetime of program entry or receives it at the follow-up period.
46New York City Human Resources Administration, Welfare to Work: New York City Welfare ReformProgram (Undated Web page, www.nyc.gov/html/hra/html/serv_welfarework.html). But see Nina Bernstein,“Experts Cast Doubt on Worth of New York Plan to Fingerprint for Medicaid,” New York Times, August 30, 2000,available from: www.endtimeinfo.net/mark/nyfingerprint.html, accessed October 31, 2002, reporting that a 1997study found that a comparison of Social Security numbers and names in New York and New Jersey resulted in1,500 matches (out of hundreds of thousands of cases), generating support for fingerprinting. (Subsequently, itturned out that most of the matches were not fraudulent claims on assistance, but reflected people who had movedfrom one state to another.) Although the effectiveness of the fingerprinting program has been questioned, RobertDoar, executive deputy commissioner for the Office of Temporary and Disability Assistance, states that it is animportant component of the state’s welfare reform program: “We think the finger imaging program is an effectivemethod of fraud deterrence, and along with a whole other range of things related to welfare reform, has contributedto making the welfare program in New York significantly more credible.”
47City of New York, Human Resources Administration, Ladders to Success: Innovations in CityGovernment (New York: Human Resources Administration, 2000), p. 14.
48Jason Turner, former commissioner, New York City Human Resources Administration, conversationwith Peter Germanis, January 15, 2002.
18
twenty-six weeks after job placement.45 SAP contractors also receive performance-basedpayments, but the amounts and the milestones are different. For example, the payments for oneSAP contractor were $250 for the completion of an assessment, $500 for full engagement (fivedays of participation in SAP activities), $1,250 for full-time employment and $750 for part-timeemployment, $250 for job retention ninety days after job placement, and $1,500 for a publicassistance case closure due to earnings.
Referrals to determine eligibility. The JOS refers applicants who decide to go ahead andapply for cash assistance to the Job Center for finger imaging. In addition, the JOS refersapplicants for Eligibility Verification and Review (EVR), which is located in Brooklyn, and ChildSupport Enforcement, which is at another location in the recipient’s borough.
Automated Fingerprint Imaging System (AFIS). All applicants must have their fingers“imaged” (fingerprinted) to confirm their identity and prevent fraud.46 Compliance is a conditionof eligibility, and failure to comply results in denial of assistance to the entire family.
Eligibility Verification and Review. The EVR process includes a review of electronic dataon income, assets, residency, and family composition, including data on wages, disability benefits,and reports from banks, credit reporting agencies, the Department of Motor Vehicles, and theDepartment of Finance. Regardless of their home borough, all applicants must go to the EVRoffice in Brooklyn and are then visited at home by EVR staff, who interview the applicant in bothplaces, review documents, and sometimes speak to neighbors and landlords.47 (HRA wanted tokeep EVR staff separate from welfare caseworkers, so it placed them at different locations.)48 Onthe basis of the information gathered, EVR recommends that the Job Center approve or

49Administration for Children’s Services, Child Support–Getting Help When You Need It (New York:Administration for Children’s Services, undated).
50See Barnow and Trutko, “Analysis of Performance-Based Contracting in Welfare Programs in New YorkCity.”
19
disapprove the application. Compliance with the EVR process is a condition of eligibility, andfailure to comply results in the denial of assistance (the equivalent of a “full-family sanction”).
Office of Child Support Enforcement. At the Office of Child Support Enforcement(OCSE), applicants are interviewed by a child support caseworker and are required to bring asmuch information as possible about the noncustodial parent so that a petition for child support canbe filed in court. Among the required documents are the absentee parent’s social security number;the birth certificate for each child; the marriage certificate, divorce decree, or separation papers;the noncustodial parent’s address, phone number, and employer; and other relevant documents.Applicants who do not know the whereabouts or social security number of the absent parent (whois almost always the father) are required to bring any other information that might help locate him,such as pay stubs, bank statements, date and place of birth, and parents’ names. Once cases arereferred for a child support order, applicants must appear at a family court hearing in Manhattan(regardless of the applicant’s home borough).49 Applicants who refuse to cooperate with childsupport enforcement face the possibility of a reduced cash grant (i.e., a “partial sanction”).
Skills Assessment. SAP vendor representatives are located at most Job Centers, wherethey provide a two-day “World of Work” orientation, after which applicants report to the SAPoffices for help with resume writing, interview preparation, and other job search activities whiletheir application is processed. Participation is for thirty-five hours per week for up to six weeks.(SAP agencies operate under contract to HRA and are paid for each job placement.) The SAPcontractors are responsible for completing an individualized employment plan for participants whodo not find employment during this stage, and HRA employees stationed at each SAP locationmust sign off on those plans. After the application is approved and applicants have spent four tosix weeks in job search, an HRA worker at the SAP contractor’s site is responsible forimmediately assigning the applicant (or, now, recipient) to a new set of activities. (Again, thecontractors are paid on the basis of job placements and retention.)50
Open Cases
Application approval. Once the applicant has provided the needed documentation andcomplied with referrals, eligibility has been established, and the case has received supervisoryreview, the case is opened and payments begin (assuming that the applicant has neither foundemployment nor had her needs met through a one-time payment). State law requires thatTemporary Assistance for Needy Families (TANF) applications for assistance be processed withinthirty days after the signed application is submitted. Hence, the application must be acted on even

51Seth Diamond, former deputy commissioner for Operations, New York City Human ResourcesAdministration, conversation with Marie Cohen, December 5, 2001.
52Wiseman, “Public Assistance in New York City: Accomplishments and Opportunities,”; untitled BEGINhandout provided by Georgia Salley, Executive Director, BEGIN Managed Programs, HRA.
53Seth Diamond, former deputy commissioner for Operations, New York City Human ResourcesAdministration, conversation with Marie Cohen, November 27, 2001.
54See the section “Education and Treatment Activities.”
55See the section “Education and Treatment Activities.”
20
if this process has not been completed, which essentially means that if no action is taken in thirtydays, the application must be approved.
Referrals to work-related activities. Opened cases are transferred to the CaseManagement Team within the Job Center. New recipients who have not been placed in a job bythe SAP vendor within four to six weeks meet with an HRA worker who is out-stationed at theSAP provider’s office.
The HRA worker generally assigns recipients without jobs to an Employment ServicesPlacement (ESP) vendor for some combination of job search preparation, job search, and short-term training as well as to a worksite participating in HRA’s WEP.51 (The HRA worker can alsoassign the recipient to full-time training, rather than to the ESP, after the case is accepted. Thisusually occurs when the applicant is enrolled in training before the application process.)Recipients who read English at less than a sixth-grade level are referred to the Begin EmploymentGain Independence Now (BEGIN) program, which provides education and manages its ownWEP sites. Both ESP and BEGIN participants are usually in WEP placements three days perweek and in education, training, or job search for the other two days, for a weekly total of thirty-five hours of activity.52 The ESP contractors and the WEP worksites provide attendanceinformation about each recipient to HRA biweekly.53 (These programs are described below.)54
Recipients who are found to have special needs are referred to programs designed to helpthem, including the Perfect Opportunity for Individual Skills and Educational Development(POISED) program, which is for pregnant recipients or those with a child less than three monthsold; HIV/AIDS Services Administration, for HIV-positive recipients; Personal Roads forIndividual Development and Employment (PRIDE) program, for recipients with disabilities (theprogram combines specially tailored work experience placements with other activities); substanceabuse treatment; or domestic violence services. (These programs also are described below.55) TheJob Center’s Case Management Team takes on the responsibility for monitoring the progress ofthese recipients.
Case review. At the third and ninth months after the case is opened, all adult recipientsreceive a form for reporting changes in family status. Cases without earnings also receive this

56Michael Keating, AMS project manager, Human Resources Administration, conversations with MarieCohen, January 23 and 24, 2001.
21
form at the six-month point and are called into the Job Center for an interview after twelvemonths. Cases with earnings are interviewed every six months. A family that has accumulatedforty-eight months of receipt since October 1996 and is thus deemed at risk of reaching the TANFtime limit is called in for an interview about employment plans, and efforts to find employment areintensified. Failure to attend the meetings can result in a case closure, that is, a full-family sanction(because the meetings are, essentially, a condition of eligibility). These case review requirementsare not unique to FA cases; similar recertification requirements are built into federal law in theFood Stamp and other programs.
Partial sanctions for noncompliance. Recipients who fail to comply with participationrequirements receive a notice telling them that they can come in for a conciliation meeting withtheir caseworker; the notice specifies a date and time. If the recipient fails to appear or comes inand cannot give good cause for noncompliance, then a Notice of Intent to sanction (NOI) is sentto the recipient. The recipient has ten days from receipt of the NOI to come in for a conference. Ifthe recipient does not come in during that ten-day period, or comes in and does not give goodcause, then the sanction is imposed. The recipient can request a fair hearing (conducted by anadministrative law judge) on the sanction at any time.56
The maximum FA sanction is a reduction in the benefit equal to the noncomplying adult’sshare of the grant (i.e., a partial sanction). For example, the sanction would be one-third of thebenefit for a family of three. SNA cases consisting of single adults or childless couples are closedwhen sanctioned. During the first sanction, compliance brings immediate restoration of the fullgrant. A second sanction is imposed for a minimum of three months and ends only when therecipient complies. A third or subsequent sanction lasts a minimum of six months and ends whenthe recipient complies. (The minimum sanction periods under SNA are a little longer, with aminimum of at least three months for the first sanction and five months for the second sanction.)Basically, New York State has only authorized partial sanctions, unless the noncomplianceinvolves a condition of eligibility, such as complying with referrals to the EVR unit and to theAFIS at the time of application or with subsequent status reporting requirements (as describedbelow).
Case Closure
Termination of cash assistance may occur at the recipient’s request; as a result of changesin income due to employment, marriage, or other events; as a result of transfer to anotherprogram; because the recipient fails to report family status information; or as a result of fraud ormisrepresentation.
Changed circumstances. A change in circumstances is probably the major reason forcase closure, but little data are available on the subject. In 1998, Andrew Bush and Swati Desai,
57Andrew S. Bush, Swati Desai, and Lawrence M. Mead, Leaving Welfare: Findings from a Survey ofFormer New York City Welfare Recipients (New York City, NY: Human Resources Administration, September1998).
58See the discussion: “Predominantly Partial Sanctions.”
59Association of the Bar of the City of New York (ABCNY), Welfare Reform in New York City: TheMeasure of Success (Committee on Social Welfare Law, August 2001), available from:www.abcny.org/currentarticle/welfare.html, accessed March 18, 2003.
22
who are HRA officials, and Lawrence Mead, professor of politics at New York University,examined the reasons a sample of welfare “leavers” gave for leaving the rolls.57 The survey wasbased on interviews with 126 family heads who left TANF in November 1997 about six monthsafter their case closing. The primary reason for leaving welfare was obtaining a full-time (39percent) or part-time (15 percent) job, followed by failure to meet program requirements (25percent), receipt of other government support (5 percent), or assistance from family ornoncustodial parents (4 percent). Because New York’s sanction for noncompliance with workactivities involves only a partial reduction in benefits, the leavers who cited “failure to meetprogram requirements” probably did not fulfill all the requirements involved in periodicrecertifications.
Full-family sanctions or adverse case closures. In some cases, noncompliance withvarious “conditions of eligibility” can lead to an adverse case closure or the rejection of anapplication (essentially the equivalent of a full-family sanction),58 although such a closure is notofficially classified as a sanction. For example, failure to comply with the initial substance abusescreening can result in a case closure. Similarly, recipients who claim to have a physical or mentalimpairment but do not cooperate with the third-party medical assessment can have their caseclosed. Finally, failure to comply with various eligibility requirements can also lead to caseclosure. Sanctioned cases may be periodically called in for an eligibility review to determine howthe family is managing on a reduced grant. Failure to keep the eligibility review may result in thecomplete termination of benefits.
Transfers to Safety Net Assistance. Welfare benefits are not really time limited in NewYork State. Instead, FA recipients who have been on welfare for a cumulative five years sinceDecember 1996 (and who cannot be exempted under TANF) are transferred to the state- and city-funded SNA program, where they can indefinitely receive the same level of benefits as they didunder FA.
Advocates have criticized HRA’s implementation of this process on the ground that theagency fails to inform recipients facing time limits about the availability of SNA when theirbenefits expire. According to the advocates, notices sent to recipients at one point suggested thatthey would have to manage without public benefits in the future, and caseworkers and postershave been reported to convey the same message.59

60Dan Bloom, Mary Farrell, Barbara Fink, with Diana Adams-Ciardullo, Welfare Time Limits: StatePolicies, Implementation, and Effects on Families (New York, NY: Manpower Demonstration ResearchCorporation, July 2002), p. 154.
61Bloom, Farrell, Fink, with Adams-Ciardullo, Welfare Time Limits: State Policies, Implementation, andEffects on Families, p. 155.
62Seth Diamond, conversation with Marie Cohen, December 5, 2001.
23
Some independent evidence indicates that this was a problem, at least at the beginning ofthe program. It is not clear how well HRA first publicized the availability of continued assistance.According to Bloom and his colleagues at MDRC, HRA at first posted signs in welfare officesand job centers that warned, “The clock is ticking” and “Welfare is time-limited.”60 They describethe situation as the first families approached the time limit:
For the initial cohort of 36,000 recipients who reached the time limit in December 2001,the lack of discussion about the availability of Safety Net Assistance likely corroboratedthe message that welfare is time-limited. In other words, the lack of a message likelyprovided a stronger message than the reality of a time limit. A letter sent to clients inmonth 58 of assistance (an earlier letter was sent at 54 months) illustrates the ambiguity ofthe time-limit message: While clients are told that they can continue to receive benefits,they are also reminded to “keep track” of their time-limit count, since “the time limit is alifetime limit.” The letter also explains that there is no time limit on Safety NetAssistance.61
City officials contend that recipients had already received two notices from the state explainingtheir eligibility for SNA and that the only way to make the time limits meaningful was, in effect, todownplay the continuation of benefits by emphasizing that welfare was time limited and thatrecipients would be transferred to another program.62
In any event, as of this writing, these problems seem to have been resolved. HRA nowsends recipients in their fifty-eighth month of assistance a letter reminding them of the time limit.HRA also sends an application for SNA and an appointment letter scheduling a “time-limitreassessment interview.” Recipients must then file an application prior to their fifty-ninth month ofassistance.
As suggested by the foregoing, in December 2001 about 36,000 families in New YorkCity exhausted their time-limited benefits. Families that were exempt or complying with programrequirements continued to receive assistance without any real hassles. About 6,000 familiesreceived an exemption and continued to receive FA benefits under the 20 percent federal timelimit exemption. About 14,000 families, primarily those combining work and welfare, wereautomatically transferred to the SNA program. The remaining families were required to file aformal SNA application. A special process was created for the “happily sanctioned” (i.e., cases in

63See the discussion: “‘Happily Sanctioned?’”
64Mark Hoover, former first deputy commissioner, New York City Human Resources Administration, e-mail to Peter Germanis, October 14, 2002.
65Mark Hoover, e-mail to Peter Germanis, October 14, 2002.
66Swati Desai, then executive deputy commissioner, Office of Program Reporting, Analysis, andAccountability, New York City Human Resources Administration, e-mail to Douglas Besharov, June 17, 2003.
24
which the adult seems willing to absorb a partial sanction rather than comply):63 These familieswere required to apply for SNA at the HRA’s fraud verification unit, where a fraud investigatorexamines how the family is surviving on a reduced income and conducts a thorough review of thefamily’s income and resources.
In the fall of 2001, in anticipation of the first families reaching the five-year time limit,HRA began offering temporary subsidized jobs in the Parks and Recreation Department torecipients who were reaching their five-year time limit of FA receipt. The jobs paid $9 per hour. Asecond program focused on the “happily sanctioned,” who were offered jobs with a temporarycontractor working at HRA and other city agencies for $7.95 an hour. Recipients offered a jobwere required to accept it as a condition of eligibility. Refusal would mean termination of benefitsfor the entire family. According to Mark Hoover, former first deputy HRA commissioner, about30 to 35 percent of sanctioned recipients did not show up for the reapplication or, subsequently,for the job.64 They were removed from the rolls. Most cases were closed for failure to completethe application process, as opposed to refusing to take the job. About 3,000 recipients, however,took the jobs.65 HRA attempted to create temporary jobs with employers who might offercontinued employment after the subsidy expired, but most of the jobs were in public agencies,such as the Parks and Recreation Department. The city did not want to create a public serviceemployment program like that created under the Comprehensive Employment and Training Actwithout successfully transitioning the participants within a year or less to an unsubsidized job. In2002, referrals to the Parks and Recreation Department continued and the number of participantsaveraged about 3,000 participants. No new referrals to the temporary contractor were made, butthe approximately 1,000 participants who were in jobs stayed in them.66
For a short period of time in 2003, HRA again offered a limited number of these jobs asrecipients left welfare, moved to other unsubsidized jobs, or completed their year and wereterminated. Dan Bloom, a senior associate at MDRC, and his colleagues explain the process:
When they arrive, there is a lengthy process that includes three meetings with threedifferent staff before they can file an application. Typically, this process takes the betterpart of a day, and clients who arrive late generally have to return for a follow-upappointment. For those reaching the time limit in late 2001, the end result was a subsidized

67Bloom, Farrell, Fink, with Adams-Ciardullo, Welfare Time Limits: State Policies, Implementation, andEffects on Families, p. 157.
68Bloom, Farrell, Fink, with Adams-Ciardullo, Welfare Time Limits: State Policies, Implementation, andEffects on Families, p. 157.
69Hamilton and Scrivener, Promoting Participation.
70Hamilton and Scrivener, Promoting Participation, p. 27.
25
job offer. Now, however, clients who chose to file an application for Safety NetAssistance at the end of the process are assigned to a work activity.67
Recipients who did not take a subsidized job or comply with the work experience assignment hadtheir cases closed and were not eligible for SNA. About 3,000 of the 16,000 recipients who wererequired to file a SNA application had their cases closed.68
Monitoring the Process
The key to achieving and maintaining full engagement is monitoring the participation ofrecipients in required activities from the very beginning of their involvement with the agency. Toidentify administrative practices associated with high levels of program participation, GayleHamilton and Susan Scrivener, researchers at MDRC, reviewed research on about a dozenMDRC-evaluated welfare-to-work programs.69 Although most of the programs operated beforethe passage of the 1996 welfare reform law and did not include a significant work experiencecomponent, the findings can still offer important insights into practices related to achieving highlevels of participation, especially because the programs were randomized experiments.
Essentially, Hamilton and Scrivener found substantially higher participation rates amongprograms it categorized as “high enforcement.” The researchers classified eleven mandatorywelfare-to-work programs as either “high enforcement” or “low enforcement.” The nine “highenforcement” programs
aimed to enroll most mandatory people, monitored participation in program activitiesmoderately or intensively, and reinforced the mandatory nature of the program throughsanctions (partial grant reductions) and other means, such as positive encouragement. Thetwo low-enforcement programs tended to give preference to those who volunteered forthe program, did not strongly communicate the mandatory participation requirements, didnot closely monitor participation in program activities, and rarely imposed financialsanctions for nonparticipation.70
Hamilton and Scrivener found that

71Hamilton and Scrivener, Promoting Participation, p. 28.
72Hamilton and Scrivener, Promoting Participation, pp. 56–60.
73Hamilton and Scrivener, Promoting Participation, p. 66.
74Lawrence M. Mead, “Welfare Employment,” in Lawrence M. Mead (Ed.), The New Paternalism:Supervisory Approaches to Poverty (Washington, D.C.: Brookings Institution Press, 1997), p. 57.
75Jason Turner and Thomas Main, “Work Experience Under Welfare Reform,” in The New World ofWelfare, edited by Ron Haskins and Rebecca Blank (Washington, D.C.: The Brookings Institution, 2001), p. 303.
26
the high-enforcement programs had an average longitudinal participation rate of 57percent (using a follow-up period of two years) and increased participation above the levelachieved by the control group by twenty-six percentage points. In contrast, the low-enforcement programs had an average longitudinal participation rate of 45 percent andincreased participation by an average of only ten percentage points.71
The steps Hamilton and Scrivener recommend to improve monitoring include ensuringthat staff have time to monitor participation, investing in a well-designed automated trackingsystem, making participation monitoring a program priority, having the staff maintain frequentcontact with participants, improving links among different people who work with the samerecipient, forging close linkages with outside agencies where recipients are participating inactivities, and using sanctions to enforce work requirements.72 They stress that these activities aretime intensive and require sufficient case managers to carry them out properly. In addition, theyrecommend that deferral policies should be clear (so that caseworkers know how to apply them)and that recipients in a deferred status should be monitored regularly so that they do not fallbetween the cracks if their situation change.73 Mead explains:
Even with a mandate, programs find achieving participation and getting recipients to workis difficult. When summoned to enroll in a program, many recipients fail to appear. If theydo enroll, they often disappear later when referred to a specific activity. Every time clientsare referred thereafter, some drop out. The disadvantaged often respond to challengeswith withdrawal. To obtain and maintain involvement, programs must get out the wordthat participation is not a formality. When first implemented, they often must reduce thegrants of many recipients for nonparticipation until the word spreads that the program isserious.74
Mandatory programs are particularly difficult to administer because of the transient natureof the welfare caseload. A recipient may begin an activity, only to find a job and go off the rolls.Other recipients become temporarily exempt due to an illness or family crisis. In New York Cityin 1996, for example, 38 percent of participants in FA work experience programs had dropped offwelfare after one month, 53 percent after two months, and 61 percent after three months.75 Theconstant rotating on and off welfare means that resources are invested in recipients who never

76See Marie Cohen, Mandatory Work-Related Activities for Welfare Recipients: The Next Step in WelfareReform (College Park: Maryland School of Public Affairs Welfare Reform Academy, October 2001), p. 26,available from: www.welfare-reform-academy.org/pubs/mandatorywork.pdf, accessed March 4, 2002.
77Nightingale, Pindus, Kramer, Trutko, Mikelson, and Egner, Work and Welfare Reform in New York CityDuring the Giuliani Administration, p. 18.
78Nightingale, Pindus, Kramer, Trutko, Mikelson, and Egner, Work and Welfare Reform in New York CityDuring the Giuliani Administration, p. x.
27
complete the program. Thus, a good system is necessary to collect and monitor information aboutrecipient attendance, progress, and problems.
According to Andrew Bush, HRA’s former executive deputy administrator, the agencymade monitoring and managing its welfare reform program a central priority. This decision wasbased on the determination that the key to involving and serving large numbers of people in awelfare-to-work program is monitoring (1) whether participants actually show up for theiractivities and (2) whether they are making progress toward the goal of the activity, such asbuilding work skills they can use or becoming free of drugs (when the participant is in drugtreatment).76 Nightingale and her colleagues elaborate:
The key step in mandating a strict work requirement was first to identify and locate everyadult recipient on the caseload and assess his or her status with regard to employability.Client tracking allowed HRA to call each recipient in for assessment and assignment, anddetermine the precise status of all individuals receiving assistance benefits (e.g., theexistence and nature of medical and other exemptions).77
HRA has been able to raise engagement rates by using its information and casemanagement information systems to refer recipients to WEP sites and other programs, receiveregular reports from sites about attendance, and review site operations and procedures. Again,according to Nightingale and her colleagues:
Like many jurisdictions, the data and management systems in New York City in the 1980swere outdated and inadequate for monitoring progress towards welfare reform goals andfor managing a complex system of service contractors. HRA made technologyimprovement a high priority in order to track whether the agency, its local offices, and itsvendors were making satisfactory progress. This was no small undertaking and required amajor commitment of resources, staff, and management attention. While the informationsystems are still being perfected, they have allowed HRA central administrators tocommunicate the employment goals and priorities, and institutionalize the use of the datafor ongoing regular management oversight.78
Through these new automated data systems, “[m]any case processing functions also becamehighly routinized or automated, including referrals to new HRA-contracted service vendors,

79Nightingale, Pindus, Kramer, Trutko, Mikelson, and Egner, Work and Welfare Reform in New York CityDuring the Giuliani Administration, pp. vi– vii.
80Kay E. Sherwood, “Jobstat: Creating a Tool to Manage the Reform of Welfare,” unpublished papersubmitted to Baruch College, City University of New York, 2001, p. 2 (emphases in original).
81Sherwood, “Jobstat: Creating a Tool to Manage the Reform of Welfare,” p. 8.
28
assignment to WEP jobs, tracking compliance with work requirements and attendance inactivities, and sanctioning clients who do not comply.”79 The major data management systems areJobStat; New York City Work, Accountability, and You (NYCWAY); and VendorStat.
JobStat. HRA’s major tool for monitoring its work-first, full-engagement process isJobStat, which compiles data on a comprehensive list of Job Center performance indicators(grouped into general areas covering employment, administration, and progress toward self-sufficiency). The JobStat system includes a series of regularly produced reports for each JobCenter, contractor, and worker within the centers; a regularly scheduled meeting (every Thursdaymorning), in which an individual center’s performance is reviewed; regular meetings of managersand staff within each center to discuss individual and group performance; and a cadre of peopleproviding technical assistance to the users of the reports. Kay Sherwood, formerly a researcher atMDRC and now an independent consultant, summarizes the JobStat system:
JobStat is a system that encompasses the collection and analysis of information aboutessential functions and outcomes of welfare reform, and the production of performanceindicators and their use by welfare agency managers and staff, from the chief agencyexecutive to line supervisors. JobStat is also a tool to educate, focus, and empowerwelfare agency managers and staff and to hold them accountable for the results of theirwork.80
For the first year of JobStat implementation (beginning in 1998), the entire system was focused onone outcome—“engagement”—which became the focus of JobStat reports, meetings, technicalassistance, and Job Center operations until the goal was achieved.81 JobStat’s focus was laterexpanded to include other outcomes as well, such as employment.
NYCWAY. In 1996, HRA established the NYCWAY system to monitor individualparticipation in work-related activities (i.e., case tracking). All organizations providing education,training, or work experience are required to report on the attendance of all HRA recipients everytwo weeks. Some of these contractors are able to enter attendance directly into HRA’s NYCWAY data system. Others submit attendance data on paper.
Because much of this information is on paper, a special unit in HRA’s central office isresponsible for entering the data so that the recipient’s Job Center has access to it and can follow
82Seth Diamond, conversation with Marie Cohen, December 20, 2001.
83Nightingale, Pindus, Kramer, Trutko, Mikelson, and Egner, Work and Welfare Reform in New York CityDuring the Giuliani Administration, p. 16.
29
up quickly with recipients who are not participating.82 The computer system checks for such casesevery week and sends those recipients notices to say that they should be participating in anactivity. In some cases, WEP assignments are coordinated with the recipient’s activity on theother days, and in other cases they are not coordinated. The tendency toward such coordination isgrowing, however. According to Demetra Nightingale and her colleagues:
Implemented in 1999, the New York City Work, Accountability, and You (NYCWAY)client tracking system provides HRA and vendors with the capability to assign individualsto ESP and SAP vendors and to track the status of public assistance recipients on anindividual basis throughout their course on public assistance. HRA workers and SAP andESP vendors record each client’s activities and status directly into the NYCWAY systemevery day. Clients’ attendance in workfare assignments, other assigned work activities,special programs, appointments and absences—both excused and unexcused—are tracked,and their progress is monitored. NYCWAY can be used to access information aboutcurrent public sector jobs participating in the HRA wage-subsidy component for thoseindividuals reaching their time limit. [Private sector jobs are not currently linked intoNYCWAY.] Through an interactive link to other state and local labor market information,staff in some SAP and ESP vendor locations also receive immediate access to jobopenings and other resources. While this was observed in some locations, not all workerswere aware of or able to access labor market information at the time of our visits.83
Recipients who are not participating in an approved activity for any reason are automaticallycalled in for an appointment within a two-week period, so that recipients do not fall between thecracks when their status changes.
VendorStat. VendorStat is similar to the JobStat system, except that it tracks theperformance of ESP vendors and SAP vendors. VendorStat reports are produced monthly, andvendors are called in each week to discuss cases and their performance on the VendorStat report.

30

31
A NOTE ABOUT DATA
This analysis of engagement and participation trends is largely based on HRA’s Weekly Engagement Reportsand various other data sources. Unfortunately, the Weekly Engagement Reports provide only limited information aboutengagement and participation trends. For example, they provide only partial information prior to April 1999 (becausethey did not exist before then) and sporadic information after that point. In some cases, we filled in data gaps by relyingon other HRA data or data from the Urban Institute’s study of HRA’s program. These data sources, however, had somedifferences in definitions and measurement practices, which may have introduced some bias into our assessment oftrends over time. For example, the Weekly Engagement Report for October 23, 2000, indicated a total of 16,626 FamilyAssistance (FA) Work Experience Program (WEP) cases, whereas our extrapolation from an HRA chart suggests onlyabout 16,000 WEP cases. The difference arose because the number of WEP adults in the Weekly Engagement Reportsis based on the primary engagement status for cases active at a point in time (every Sunday night), whereas the numberon the WEP roster is a count of the number of people in WEP during a given two-week cycle. Similarly, we relied onthe Urban Institute’s tabulations of HRA data for 1996. The definition of “engaged” used in the Urban Instituteanalysis, however, was different from HRA’s definition in the later Weekly Engagement Reports. For example, the“needed at home” group was classified as “unengageable” by the Urban Institute but as “engageable” and participatingin community service in the later HRA reports. We adjusted the Urban Institute’s data, when possible, to make the twodata sources more consistent with each other. Nevertheless, we believe the data problems are relatively minor and donot obscure the broad trends in engagement over time.
The discussion in this report usually compares caseloads or activities at five points in time: November 1996,April 1999, December 1999, November 2001, and August 2002. The first date was chosen because most data areavailable only from that point; April 1999 was chosen because it is the first date that Weekly Engagement Reportsbecame available; December 1999 was chosen because that is when full engagement was achieved; November 2001was used because that is the last month before the first families reached TANF’s five-year time limit and weretransferred from the FA program to the Safety Net Assistance program; and August 2002 because that was the lastmonth for which there was data as this report was being prepared.
III. THE “FULL-ENGAGEMENT” MODEL
The Human Resources Administration’s (HRA’s) welfare reform program is designed to“engage” all eligible recipients in planned, constructive activities in the belief that doing so willreduce dependency and increase employability. HRA closely monitors “engagement” to assess andmanage its program.
As this section describes, HRA divides cases between those that are “engageable” andthose that are “unengageable.” Engageable cases are those involving an able-bodied adult who isexpected to participate in work activities. Unengageable cases are not expected to participatebecause they are exempt or otherwise excused from participation.
Unengageable Cases
Participation is mandatory for almost all adults receiving either FA or Safety NetAssistance (SNA). Some families, however, are not expected to participate because they are

84Because of gaps in the data, the size of the decline is somewhat uncertain. We estimated the number ofunengageable cases for November 1996 by relying on data from the Urban Institute. (See Demetra SmithNightingale, Nancy Pindus, Frederica D. Kramer, John Trutko, Kelly Mikelson, and Michael Egner, Work andWelfare Reform in New York City During the Giuliani Administration: A Study of Program Implementation(Washington, D.C.: Urban Institute, July 2002), p. B-2.) They estimated the number of unengageable cases for thatmonth at 95,957, but because they excluded child-only and active single issue cases, their numbers are notconsistent with ours (or HRA’s), so this should be viewed as a minimum. Alternatively, we subtracted the numberof engageable cases, as reported by the Urban Institute, from the total caseload, as reported by HRA, to derive anestimate of 165,150, which may be somewhat high, since it would mean that about 70,000 cases are unengageablebecause they are child-only or active single issue cases. (The Urban Institute did not count “needed at home” asengageable, even though HRA includes them in this category, as we do as well. However, this number was notreported in November 1996, but it is possible if this number were added back to the engageable group, the numberof unengageables would be slightly smaller.) Nevertheless, we use the latter estimate, because it appears to be mostconsistent with the data in HRA’s Weekly Engagement Reports.
32
unengageable. The three major categories of unengageable cases are “exempt cases,” “child-onlycases,” and “active single issue cases,” as described below.
The number of unengageable FA cases fell sharply between November 1996 and April1999, as HRA narrowed available exemptions and monitored existing ones more rigorously. Thenumber of unengageable cases declined by 74 percent, from 165,150 to 42,870 (see figure 1).84
The most significant factor in that decline was the narrowing of the age-of-child exemption forsingle mothers, followed by the narrower application of the exemption for those with temporaryincapacities. Because the caseload also fell during this period, the percentage of the caseloadconsidered unengageable did not fall quite as rapidly (64 percent), declining from 59 percent ofthe caseload to 21 percent. Between April 1999 and November 2001, the number ofunengageable cases rose from 42,870 (21 percent) to 49,799 (35 percent) as a result of anincrease in child-only and active single issue cases. (In figure 1, for 1996 we labeled as“undetermined” child-only cases, active single issue cases, and any residual, because we did nothave data about the number of cases in these categories. Nevertheless, we believe that a largenumber of these cases are child-only cases.) Note that the data for August 2002 include the FAcases that, because of the five-year time limit, were transferred to the SNA caseload.

85For November 1996, the Urban Institute estimated the number of unengageable SNA cases at 64,136, butthey excluded child-only and active single issue cases, so this should be viewed as a minimum. Subtracting thenumber of engageable SNA cases, as reported by the Urban Institute, from the total SNA caseload, as reported byHRA, yields an estimate of 74,916 unengageable SNA cases. The main difference appears to be the treatment ofactive single issue cases, since child-only cases are a very small proportion of the caseload. We use this latterestimate since it is most consistent with the data summarized from Weekly Engagement Reports.
33
Figure 1. Unengageable Family Assistance Cases,New York City, 1996–2002
Apr.1999
Dec.1999
Dec.2000
Nov.2001
Aug.2002
Nov.1996
Thousands of cases
Young child
Temporary incapacity
Other exemptions
Child only(Apr. 1999 on)
Active single issue(Apr. 1999 on)
Undetermined (Nov. 1996)
150
100
50
Sources: New York City Human Resources Administration, “PA — Weekly CaseloadEngagement Status” (New York: New York City Human Resources Administration,various periods); and Demetra Smith Nightingale, Nancy Pindus, Federica D. Kramer,John Trutko, Kelly Mikelson, and Michael Egner, Work and Welfare Reform in New YorkCity During the Guliani Administration: A Study of Program Implementation(Washington, D.C.: The Urban Institute Labor and Social Policy Center, July 2002), p.B-2.Notes: In New York, Family Assistance (FA) was called “Aid to Families withDependent Children” before 1998. The data for August 2002 include FA cases that,because of the five-year time limit, were transferred to the Safety Net Assistance caseload.
The number of unengageable SNA cases also fell because of HRA’s heightened scrutiny ofexemptions (see figure 2). Between November 1996 and April 1999, the unengageable SNAcaseload declined 51 percent, from 74,916 (49 percent of the caseload) to 37,698 (38 percent).85
The tighter screening of cases claiming a temporary incapacity appears to be an important causeof this decline. This period was followed by one of relative stability. Between April 1999 and

34
Figure 2. Unengageable Safety Net Assistance Cases,New York City, 1996–2002
Apr.1999
Dec.1999
Dec.2000
Nov.2001
Aug.2002
Nov.1996
Thousands of cases
Young child(too few to show)
Temporary incapacity
Other exemptions
Child only(Apr. 1999 on,
too few to show)
Active single issue(Apr. 1999 on)
Undetermined (Nov. 1996)
60
40
20
Sources: New York City Human Resources Administration, “PA — Weekly CaseloadEngagement Status” (New York: New York City Human Resources Administration,various periods); and Demetra Smith Nightingale, Nancy Pindus, Federica D. Kramer,John Trutko, Kelly Mikelson, and Michael Egner, Work and Welfare Reform in New YorkCity During the Guliani Administration: A Study of Program Implementation(Washington, D.C.: The Urban Institute Labor and Social Policy Center, July 2002), p.B-2.Notes: In New York, Safety Net Assistance (SNA) was called “Home Relief” before 1998.The data for August 2002 exclude Family Assistance cases that, because of the five-yeartime limit, were transferred to the SNA caseload.
November 2001, the unengageable caseload fell just 2 percent, from 37,698 to 37,048, althoughthis number represented a larger share of the total caseload, growing from 38 percent to 49percent.
86TANF permits states that had welfare waivers to continue their pre-TANF policies until the waiverexpires. These waivers could affect the allowable work activities, hours of participation, and exemptions.
87See “Statement of Douglas J. Besharov, Professor, University of Maryland School of Public Affairs,College Park, Maryland, and Resident Scholar, Public Policy Research, American Enterprise Institute,” before theCommittee on Ways and Means, Subcommittee on Human Resources, Implementation of Welfare Reform WorkRequirements and Time Limits, 107th Cong., 2nd sess., March 7, 2002, pp. 69–83.
88Center for Law and Social Policy and Center on Budget and Policy Priorities, Work Requirements:Exemptions, July 2000, available from: www.spdp.org/tanf/exemptions.pdf, accessed August 1, 2002.
35
Exempt cases. Historically, the federal government allowed states to exempt largenumbers of welfare recipients from work requirements. Under TANF, however, relatively fewadults can be exempted from federal participation requirements.86 States may exclude singleparents with a child under twelve months old, but this exclusion is limited to a lifetime maximumof twelve months for any adult. In addition, states may exclude families receiving assistance inwhich an adult has been sanctioned for not complying with work activities, but that exclusion islimited to families that have been under a sanction for no more than three months in the precedingtwelve-month period. Finally, two-parent families that include a disabled parent are not includedin the calculation of the higher two-parent participation rate, but they are included in the “allfamily” requirement.
Although states may exempt any other category of recipients, they must still meet theirrequired participation rates for recipients who are not federally exempt (or face financialpenalties). But because federal participation requirements have been so easy for most states tomeet under the current version of TANF,87 most states have exempted many more categories ofrecipients. As of October 1999, the most common exemptions were caring for a young child(forty-four states); disabled or temporary illness or incapacity (thirty-four states); caring for adisabled household member (twenty-eight states); advanced age (twenty-seven states); victim ofdomestic violence (twenty-four states); child care unavailable (nineteen states); and pregnant(twenty states).88
Under TANF, New York State narrowed its exemption policies to mothers with childrenunder three months old, making it one of sixteen states to require parents with children less than ayear old to participate. Otherwise, New York retained most of the exemptions that it had beforeTANF, mainly for parents who are ill or injured (for up to three months), age sixty or older, underage sixteen (or under age nineteen and in school), disabled or incapacitated, needed in the hometo care for another member of the household, pregnant (in the later months of pregnancy or dueto a medical assessment determination), or the parent of a child under three months old in a

89The state actually exempts a parent in a single-parent family if the child is under twelve months old, butthe exemption is limited to three months for any one child, so as a practical matter, the exemption is limited toparents with a child under three months old. In addition, the exemption is limited to a maximum of twelve monthsover a parent’s lifetime.
36
single-parent home.89 These same exemptions apply to the SNA program as well, although theirrelative importance varies due to differences in the characteristics of the two caseloads.
The changes in New York State’s exemption policies resulted in a sharp initial decline inthe total number of FA and SNA cases that were considered “exempt” in New York City,followed by a slower but continued decline. For FA cases, between November 1996 and April1999, the number of exempt cases dropped from 91,380 (33 percent) to 13,282 (7 percent).Although the number continued to decline in subsequent years, these cases’ percentage of thetotal caseload actually increased slightly. By November 2001, the number of exempt cases hadfallen to 11,164 (8 percent).
For SNA cases, between November 1996 and April 1999, the number of exempt casesdropped from 64,136 (42 percent) to 31,967 (32 percent). As with the FA caseload, the numbercontinued to decline, but their percentage of the total caseload increased slightly. By November2001, the number of exempt cases had fallen to 28,121 (38 percent).
Young child. Narrowing the age-of-child exemption for single parents from those with achild under six years old to those with a child under three months old did more to reduce thenumber of exempt adults than any other policy change. In November 1996, 59,596 FA cases (21percent of the total caseload, including child-only cases) were considered exempt because theyhad a young child in the home. By April 1999 (and probably much sooner), the number hadplummeted to just 1,382 cases (less than 1 percent of the caseload), and it remained very lowthrough November 2001, when it was just 1,356 cases (1 percent). (See figure 1.)
Limiting the age-of-child exemption had almost no effect on the number of exempt adultsreceiving SNA, because until recently, the program mostly served single adults and childlesscouples. Families with children applying for public assistance were referred to the FA program. InNovember 1996, no SNA cases were considered exempt because of a young child in the home.Between April 1999 and November 2001, in any given month, fewer than 100 SNA cases wereexempt for this reason (0 percent of the total caseload). Although after December 2001, thenumber may have increased as families that exhausted their five-year time-limited FA benefitswere converted to SNA, but the number is still probably small.
Temporary incapacity. Temporary exemptions for poor health or disabilities were alsonarrowed, but the change was accomplished through administrative changes rather thanlegislation. HRA imposed more rigorous assessments of whether such incapacities precludeparticipation in a work-related activity. Nightingale and her colleagues describe the change:

90Demetra Smith Nightingale, Nancy Pindus, Frederica D. Kramer, John Trutko, Kelly Mikelson, andMichael Egner, Work and Welfare Reform in New York City During the Giuliani Administration: A Study ofProgram Implementation (Washington, D.C.: Urban Institute Labor and Social Policy Center, July 2002), p. 43,citing, City of New York, Human Resources Administration, Ladders to Success: Innovations in City Government(New York: Human Resources Administration, 2000).
91Jason Turner, former commissioner, New York City Human Resources Administration, conversationwith Peter Germanis, January 15, 2002.
37
In 1999, HRA broadened its welfare-to-work initiatives to include recipients with specialneeds, many of whom were work-exempt prior to that year. This policy reflected theunderlying philosophy of welfare reform in New York City that “. . . barring permanent orsevere disability, every adult is capable of some kind of work.” If an individual faces abarrier to immediate employment, he or she can still be engaged in structured workactivities with specialized services and assistance.90
According to Jason Turner, HRA commissioner from 1998 through 2001, the agency wasable to control the number of exempt cases by following through with third-party medicalverifications for families claiming a disability or health problem and by assigning appropriateactivities for those with a health or physical problem. HRA changed the focus of these medicalevaluations (conducted by an independent contractor, Health Services Systems) from simplyidentifying those who should be exempt from participation to determining what activitiesindividuals with physical or health problems can do and assigning them to appropriate activities—in other words, emphasizing what recipients can do, as opposed to what they cannot do. Turnerexplains that recipients are now given a list of work activities and are asked to identify those theyfeel they can do and those they cannot do.91
As a result of these stricter policies, between November 1996 and April 1999 the numberof FA cases that were temporarily exempt due to a health problem or incapacity fell from 24,927cases (9 percent of the caseload) to 3,423 cases (2 percent). The number of temporarily exemptcases has continued to decline along with the rest of the caseload. By November 2001, thenumber had dropped to 3,042 cases, and by August 2002 it had fallen further, to 2,305 cases,both representing about 2 percent of the caseload.
The tighter screening process also sharply reduced the number of SNA cases exempt dueto a temporary incapacity. Between November 1996 and April 1999, the number of SNA casesthat were temporarily exempt due to a health problem or incapacity fell from 15,182 cases (10percent of the caseload) to 3,670 cases (4 percent). The number of temporarily exempt cases hascontinued to decline along with the rest of the caseload. By November 2001, the number haddropped to 1,960 cases (3 percent).
This stricter approach to recipients with disabilities has been criticized by some welfareadvocates. Health Services Systems has been criticized for performing perfunctory physical examsand ignoring the test results and recommendations of the recipient’s own physician. A report of a

92Association of the Bar of the City of New York (ABCNY), Welfare Reform in New York City: TheMeasure of Success (New York: Committee on Social Welfare Law, August 2001), available from:www.abcny.org/currentarticle/welfare.html, accessed January 11, 2002.
93ABCNY, Welfare Reform in New York City: The Measure of Success.
94ABCNY, Welfare Reform in New York City: The Measure of Success, pp. 7-8.
95See the discussion: “Education and Treatment Activities.”
38
bar association committee, for example, questioned the fairness of the treatment given torecipients who claim they should be exempt from work activities due to medical disabilities,accusing the for-profit contractor that evaluates such disability claims of “perfunctory physicalexaminations using physicians who could not or did not communicate with the clients and . . .disregarded and sometimes discarded their personal physician recommendations and testresults.”92 According to the report, “Clients who challenged the employability determinationswere rarely able to overturn the city’s claims at these sophisticated hearings because they did notpossess sufficient documentation, and, due to funding cutbacks for public interest law offices,were unable to obtain legal representation.”93 The same report accused HRA of running a biasedhearing process in cases involving work requirements.94
HRA, however, defends its strict participation policies on the ground that it providesspecial activities and services for those with disabilities and other barriers to employment, asdescribed in the section on providing extra help for the hard to serve.95 As to the allegations ofunfairness in the medical reviews, HRA officials explain that the third-party review is a “de novo”assessment, although the recipient’s physician’s notes are considered in the review process. Themedical assessment includes a blood test, health and blood pressure measurements, an interviewwith the recipient about physical limitations, a drug screen, and additional tests determined to benecessary. Thus, they contend that the reviews allow for a more balanced application of workrequirements because the assessment tools are the same and the results are provided by the samemedical vendors.
Other exemptions. Little was changed in the remaining exemption categories, whichinclude cases in which the parent or caretaker is elderly, receiving Supplemental Security Income(SSI) (or has an SSI application pending), receiving AIDS-related assistance, awaiting assignmentto the Personal Roads for Individual Development and Employment (PRIDE) program, or exemptfor some unspecified reason.
The number of FA cases in these categories remained relatively stable between November1996 and November 2001. Between November 1996 and April 1999, the number of such casesactually increased slightly, from 6,857 (2 percent) to 8,477 (4 percent), possibly reflecting anincrease in SSI receipt as some adults were able to avoid the work requirement. By November2001, the number fell to 6,324 (4 percent). (The percentage rose because the FA caseload wasfalling during this period.)

96Child-only cases do not include cases where the adult has been removed from the grant due to asanction, since such cases would be reflected in the “in sanction” category. Swati Desai, then executive deputycommissioner, Office of Program Reporting, Analysis, and Accountability, New York City Human ResourcesAdministration, e-mail to Douglas Besharov, June 17, 2003.
97Although we do not have data on FA child-only cases prior to April 1999, we have the number of PublicAssistance child-only cases in December 1994 (45,930). Since it appears that more than 95 percent of PublicAssistance child-only cases have typically been FA cases, we estimate that there were about 44,000 FA child-onlycases in December 1994.
98The caretakers of children in child-only cases, primarily either nonparental relatives or ineligibleimmigrant parents, presumably benefitted from the same strong economic conditions that drove down caseloadsgenerally.
39
The number of SNA cases in these exemption categories declined but remained a relativelystable percentage of the caseload. Between November 1996 and April 1999, the number of SNAcases fell from 48,954 (32 percent) to 28,275 (29 percent). This appears to be due to a sharpreduction in the number of cases with an adult receiving either SSI or Social Security benefits. ByNovember 2001, the number of cases with one of those exemptions dropped further, to 26,086cases (35 percent).
Child-only cases. Cases in which no adult in the family is receiving assistance (i.e., “child-only” cases), are not subject to federal or state participation requirements.96 In November 2001,for example, 34,156 child-only cases in the FA program (about 24 percent of the caseload) werenot subject to a work requirement. Between December 1994 and April 1999, it appears that therewas a large drop in the child-only caseload, from about 44,000 cases97 to 27,814 cases. (Theirshare of the caseload was the same in both periods—14 percent—because the FA caseload wasalso falling.) Between April 1999 and November 2001, however, the number of child-only casesgrew by a quarter, from 27,814 to 34,156 (from 14 percent to 24 percent of the caseload).(Again, in figure 1, for 1996 we labeled as “undetermined” child-only cases, active single issuecases, and any residual cases because we did not have data about the number of cases in theseindividual categories. Nevertheless, we believe that a large number of these cases are child-onlycases.)
The initial drop in the number of child-only cases was probably a byproduct of the declineof the total caseload,98 but the reason for the increase since April 1999 (or earlier) is unclear. Onepossibility is that more parents may have left the family (the “assistance unit”) to avoid the newwork requirements and put their children in the care of relatives while the child continued toreceive welfare. Another possibility is an increase in the number of immigrant families that puttheir children on welfare (while the adult parents were not eligible). The growth in child-onlycases is largely responsible for the steady increase in the proportion of the caseload deemedunengageable.

99Prior to December 2001, the SNA program was primarily limited to single adults and childless couples.However, some FA household heads could be placed in the SNA program as child-only cases if they failed tocomply with mandatory drug treatment. Since December 2001, families with children who have exhausted theirfive-year, time-limited FA benefits have been transferred to the SNA program. As a result, the number of child-only cases could increase, simply because a larger share of the SNA caseload is composed of families withchildren. Nevertheless, the number is likely to remain small, because most of the transferred cases had a parent orcaretaker receiving assistance.
100Lawrence M. Mead, Professor of Politics, New York University, Testimony, Before the Committee onFinance of the United States Senate, “The Reauthorization of TANF,” April 10, 2002, p. 4, available from:http://finance.senate.gov/hearings/testimony/041002lmtest.pdf, accessed March 10, 2003.
101We did not have access to data on the number of active single issue cases prior to April 1999.
40
The number of child-only cases in the SNA program has always been small because theprogram has traditionally served only single adults and childless couples.99 Between April 1999and November 2001, the number of such cases fell from 257 cases to 142 cases, too small to evenrepresent 1 percent of the caseload.
More information is needed on the characteristics of the child-only cases to determinewhether the adults in the household can be “engaged.” As Lawrence Mead, professor of politicsat New York University, explains:
The idea that only the children receive support in these cases is a fiction. Congress shouldfind a way to bring at least some of these groups under the work test, perhaps by puttingthe caretakers on the grant. A lesser reform would be to include these cases in thedenominator for the work participation rate calculation.100
For example, some cases may involve children living with immigrant parents not eligible forTANF. Although these parents do not receive assistance, it is possible that they could benefitfrom participation in various work-related activities. Alternatively, if work requirements causesome parents to leave their children with relatives, this unintended effect should be made knownso that policymakers can explore its implications.
Active single issue cases. Applicants who receive one-time cash grants instead of goingon welfare are considered active single issue cases. In most other states, such cases are called“diversion” cases because the families receive payments to help them meet immediate needs andare thus diverted from welfare. These cases are typically not counted as part of the caseloadbecause they receive only a temporary, one-time payment. Between April 1999 and November2001, the number of active single issue FA cases grew from 1,774 to 4,479 (from 1 percent to 3percent of the caseload).101 One reason for the increase could be that some families may seekperiodic one-time payments to avoid the hassle of applying for welfare and the subsequent workrequirement; caseworkers may encourage families to take these payments for the same reason.Another reason for the increase could be a reflection of the large number of families leaving

41
welfare who are on the borderline between self-sufficiency and dependency and who may need aone-time payment to meet an immediate but temporary need.
In SNA, the number of active single issue cases also experienced considerable growth.Between April 1999 and November 2001, the number of such cases grew from 5,474 (6 percent)to 8,785 (12 percent). As with FA cases, this increase could be a reflection of the desire for somerecipients to seek periodic one-time payments to avoid the hassle of applying for welfare and thesubsequent work requirement.
More Engageable Cases
These policy changes resulted in large increases in the number and proportion ofengageable cases (i.e., cases with an able-bodied adult who is expected to participate in variouswork activities). The changes, however, had a much larger effect on FA cases than on SNA cases,as described below.
Family Assistance. The number of engageable FA cases grew remarkably, primarily dueto the narrowing of the exemption for mothers with young children and the tightening of theprocess used to determine temporary exemptions due to illness or incapacity (see figure 3).Between November 1996 and April 1999, the number grew from 113,682 to 159,078, even as thetotal caseload declined from 278,832 to 201,948. As a result, engageable cases nearly doubled asa proportion of the caseload, from 40 percent to 79 percent. By November 2001, the number ofengageable cases had fallen to 91,289, largely as a result of the decline in the caseload. The shareof caseload considered engageable also fell, to 65 percent, largely because of the increase in child-only cases, as discussed above.

42
Figure 3. Engageable Family Assistance Cases,New York City, 1996–2002
Apr.1999
Dec.1999
Dec.2000
Nov.2001
Aug.2002
Nov.1996
Thousands of cases
Work experience
Combining work and welfare
Other work-related activities
In sanction process
In engagement processUnengaged
150
100
50
Sources: New York City Human Resources Administration, “PA — Weekly CaseloadEngagement Status” (New York: New York City Human Resources Administration,various periods); and Demetra Smith Nightingale, Nancy Pindus, Federica D. Kramer,John Trutko, Kelly Mikelson, and Michael Egner, Work and Welfare Reform in New YorkCity During the Guliani Administration: A Study of Program Implementation(Washington, D.C.: The Urban Institute Labor and Social Policy Center, July 2002), p.B-2. Notes: In New York, Family Assistance (FA) was called “Aid to Families withDependent Children” before 1998. The data for August 2002 include FA cases that,because of the five-year time limit, were transferred to the Safety Net Assistance caseload.
Safety Net Assistance. Unlike the FA caseload, the number of engageable SNA casessteadily declined (see figure 4), largely because the exemption for parents with young children didnot affect many SNA cases (few of them had children). Between November 1996 and April 1999,the number of engageable cases fell from 77,953 (51 percent of the total caseload) to 60,981 (62percent), and by November 2001, it had dropped to 37,831 (51 percent).

102Nightingale, Pindus, Kramer, Trutko, Mikelson, and Egner, Work and Welfare Reform in New YorkCity During the Giuliani Administration, p. 18.
43
Figure 4. Engageable Safety Net Assistance Cases,New York City, 1996–2002
Apr.1999
Dec.1999
Dec.2000
Nov.2001
Aug.2002
Nov.1996
Thousands of cases
Work experience
Combining work and welfareOther work-related activities
In sanction process
In engagement process
Unengaged
150
100
50
Sources: New York City Human Resources Administration, “PA — Weekly CaseloadEngagement Status” (New York: New York City Human Resources Administration,various periods); and Demetra Smith Nightingale, Nancy Pindus, Federica D. Kramer,John Trutko, Kelly Mikelson, and Michael Egner, Work and Welfare Reform in New YorkCity During the Guliani Administration: A Study of Program Implementation(Washington, D.C.: The Urban Institute Labor and Social Policy Center, July 2002), p.B-2.Notes: In New York, Safety Net Assistance (SNA) was called “Home Relief” before 1998.The data for August 2002 exclude Family Assistance cases that, because of the five-yeartime limit, were transferred to the SNA caseload.
Full Engagement Achieved
In November 1996, fully one-third of the engageable FA caseload was unengaged, as was11 percent of the SNA caseload. By December 1999, both programs had achieved “fullengagement.”102 Under HRA’s definition, adults in recipient families are engaged if they are (1)participating in an approved work-related activity (including specified educational and treatmentactivities), (2) in the process of being assigned to a work-related activity, or (3) sanctioned or inthe process of being sanctioned. New York City’s Independent Budget Office has complained that

103Paul Lopatto, “Growing Share of Welfare Caseload Exempt from City’s Workfare Program,” Inside theBudget (Independent Budget Office newsletter), no. 82, May 4, 2001, p. 1, available from: www.ibo.nyc.ny.us/,accessed January 10, 2002.
104Nightingale, Pindus, Kramer, Trutko, Mikelson, and Egner, Work and Welfare Reform in New YorkCity During the Giuliani Administration, p. 18.
44
HRA uses “a fairly loose definition of full engagement.”103 This assessment is somewhat unfairbecause of the limitations placed on HRA by the absence of a full-family sanction and a true timelimit on benefits. As Demetra Nightingale and her colleagues at the Urban Institute explain:
As matter of practice, however, full engagement does not mean that all public assistancerecipients are engaged in activities. Instead, full engagement means that all recipients areaccounted for, and are either engaged in employment or work activities, in the assignmentor assessment process, sanctioned for noncompliance, or appropriately classified asexempt from work activity. In other words, full engagement is a milestone ofadministration, not participation.104
An important qualification, of course, is that the city’s large number of child-only cases are notsubject to participation requirements.
Family Assistance. In November 1996, about one-third of the engageable FA caseloadwas unengaged, with full engagement reached in December 1999. Between November 1996 andNovember 2001, among the major engagement categories, 34 percent to 55 percent of allengageable cases were participating in approved work-related activities, 11 to 17 percent were inthe “in engagement process,” and 16 to 38 percent were in the “in sanction process” (see figure5).
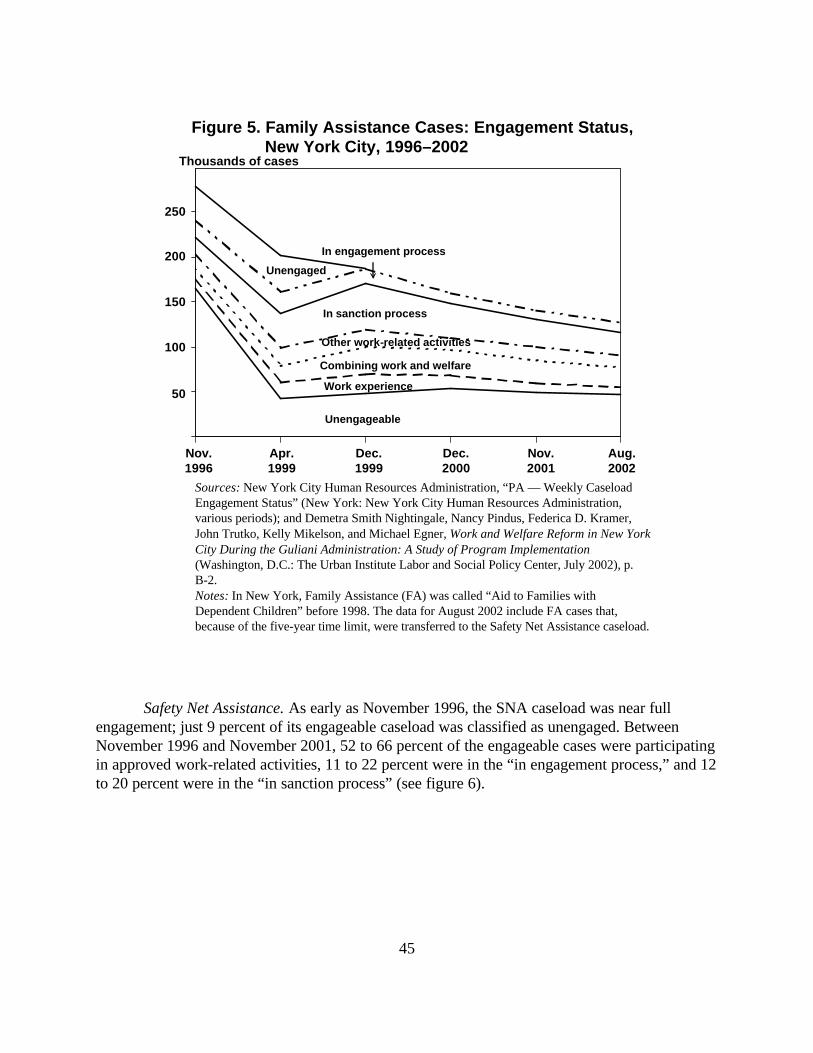
45
Figure 5. Family Assistance Cases: Engagement Status,New York City, 1996–2002
Apr.1999
Dec.1999
Dec.2000
Nov.2001
Aug.2002
Nov.1996
Thousands of cases
Work experience
Combining work and welfare
Other work-related activities
In sanction process
In engagement process
Unengaged
150
100
50
Unengageable
200
250
Sources: New York City Human Resources Administration, “PA — Weekly CaseloadEngagement Status” (New York: New York City Human Resources Administration,various periods); and Demetra Smith Nightingale, Nancy Pindus, Federica D. Kramer,John Trutko, Kelly Mikelson, and Michael Egner, Work and Welfare Reform in New YorkCity During the Guliani Administration: A Study of Program Implementation(Washington, D.C.: The Urban Institute Labor and Social Policy Center, July 2002), p.B-2. Notes: In New York, Family Assistance (FA) was called “Aid to Families withDependent Children” before 1998. The data for August 2002 include FA cases that,because of the five-year time limit, were transferred to the Safety Net Assistance caseload.
Safety Net Assistance. As early as November 1996, the SNA caseload was near fullengagement; just 9 percent of its engageable caseload was classified as unengaged. BetweenNovember 1996 and November 2001, 52 to 66 percent of the engageable cases were participatingin approved work-related activities, 11 to 22 percent were in the “in engagement process,” and 12to 20 percent were in the “in sanction process” (see figure 6).

105Nightingale and her colleagues report: “Once New York City’s caseload decline leveled off,administrators revamped their program approaches to allow a broader range of activities to ‘count’ towardsfulfilling the work requirement, rather than just regular employment or unpaid workfare.” [Nightingale, Pindus,
46
Figure 6. Safety Net Assistance Cases: Engagement Status, New York City, 1996–2002
Apr.1999
Dec.1999
Dec.2000
Nov.2001
Aug.2002
Nov.1996
Thousands of cases
Work experienceCombining work and welfare
Other work-related activities
In sanction processIn engagement process
Unengaged
150
100
50
Unengageable
Sources: New York City Human Resources Administration, “PA — Weekly CaseloadEngagement Status” (New York: New York City Human Resources Administration,various periods); and Demetra Smith Nightingale, Nancy Pindus, Federica D. Kramer,John Trutko, Kelly Mikelson, and Michael Egner, Work and Welfare Reform in New YorkCity During the Guliani Administration: A Study of Program Implementation(Washington, D.C.: The Urban Institute Labor and Social Policy Center, July 2002), p.B-2.Notes: In New York, Safety Net Assistance (SNA) was called “Home Relief” before1998. The data for August 2002 exclude Family Assistance cases that, because of thefive-year time limit, were transferred to the SNA caseload.
As for the FA cases that were transferred to SNA (because they exceeded the five-yearfederal time limit on benefits), in August 2002 this group of 36,967 families was fully engaged.About 63 percent of the engageable cases were participating in approved work-related activities,about 11 percent were in the “in engagement process,” and about 26 percent were in the “insanction process.” At least in that month, the engagement rates and patterns of this groupmirrored FA cases.
Work-related activities. Besides actual paid work and work experience activities, HRAcounts other activities, including education and training, as work-related.105

Kramer, Trutko, Mikelson, and Egner, Work and Welfare Reform in New York City During the GiulianiAdministration, p. ix.]
47
• For FA, between November 1996 and April 1999, the percentage—and, more important,the number—of the engageable caseload participating in any activity increased, going from34 percent (39,251 cases) to 35 percent (56,413 cases). By December 1999, theproportion had jumped to 52 percent (71,671 cases), as full engagement was achieved. InNovember 2001, the percentage increased further to 55 percent (56,496 cases), althoughthe total number declined.
• During the same period, the percentage of the engageable SNA caseload participating inany activity initially fell but then returned to its earlier level. Between November 1996 andApril 1999, the percentage of engageable cases participating in a work activity fell from 67percent (52,278 cases) to 52 percent (31,497 cases). By December 1999, it had reboundedto 64 percent (30,964 cases). In November 2001, the percentage increased further, to 66percent (24,798 cases), nearly matching its November 1996 level.
WEP. Work experience, or workfare, is the centerpiece of New York City’s work-basedwelfare system. In WEP, recipients are assigned to public and private agencies to perform actualwork.
• For FA, between November 1996 and April 1999 participation in WEP increased rapidly,from 10 percent (11,757) to 14 percent (17,862) of engageable cases. Participationpeaked in December 1999, reaching 16 percent of the engageable caseload (21,933 cases).However, the use of WEP then waned, dropping to just 11 percent of engageable cases byNovember 2001 (just 10,127 cases). In addition, a marked shift from “basic WEP” toWEP combined with other activities occurred. Between April 1999 and November 2001,the percentage of WEP participants in basic WEP declined from 86 percent to just 10percent.
• For SNA, WEP participation cases initially increased more slowly than FA as a percentageof the engageable caseload, but that may be because, compared with the FA caseload, itstarted at a relatively high level. Between November 1996 and April 1999, it increasedfrom 26 percent (19,982 cases) to 27 percent (16,219 cases) of engageable cases.Participation peaked in December 1999, reaching 32 percent of the engageable caseload(15,320 cases). As with the FA caseload, SNA participation in WEP then declined,dropping to 19 percent of engageable cases by November 2001 (just 7,186 cases). Asimilarly large shift in the SNA caseload from basic WEP to WEP combined with otheractivities occurred. Between April 1999 and November 2001, the percentage of basicWEP participants declined from 88 percent to just 12 percent.

106Recipients combining work and welfare are not required to spend as much time in work-relatedactivities; part-time work of twenty hours or more per week is generally sufficient to excuse a recipient from anyfurther program requirements. Jason Turner, former commissioner, New York City Human ResourcesAdministration, conversation with Peter Germanis, January 15, 2002.
107See the discussion: “Combining work and welfare.”
48
Combining work and welfare. HRA considers as engaged those welfare recipients who areworking while receiving benefits (even if they are working fewer hours than would otherwise berequired under WEP).106 This approach may not help reduce dependency, as discussed below.107
The ability of recipients to work and receive welfare benefits is dependent on the state’s“earnings disregard,” that is, a designated amount of earnings that is not taken into account indetermining the welfare grant. Under Aid to Families with Dependent Children (AFDC), thefederal government set the amount of the earnings disregard nationally. For all practical purposes,the AFDC earnings disregard was limited to the first $90 in earnings, after which benefits werereduced dollar-for-dollar as earnings increased—a 100 percent marginal tax rate. Under TANF,though, individual states set the amount of their earnings disregard, and most greatly liberalizedthem. In 1997, New York State expanded the earned income disregard in its FA program to allowfamilies to remain eligible until their gross income reached the poverty level (about $14,250 for afamily of three in 2001). In that first year, the disregard was $90 plus 42 percent of the remainderof the family’s monthly earned income. Reflecting increases in the Federal Poverty Guidelines(because of inflation), the percentage of income disregarded has been increased each year. Theseexpansions raised the income eligibility limit for recipients with earnings to 100 percent of thepoverty level afterwards.
• For FA, the largest increase in participation was among recipients combining work andwelfare. Between November 1996 and April 1999, the proportion of the engageablecaseload combing work and welfare increased slightly, from 10 percent (11,005 cases) to12 percent (18,821 cases). The expansion in the earnings disregard, beginning in 1999,seems to be the reason for the rapid increase in the percentage combining work andwelfare after April 1999, reaching 22 percent by December 1999 (30,316 cases) and 26percent (25,106 cases) by November 2001.
• For SNA, the percentage of engageable cases combining work and welfare tripled betweenNovember 1996 and November 2001. However, both the absolute number of suchcombiners and their share of the caseload was relatively small, increasing from 2 percent(1,824 cases) to 6 percent (2,081 cases). We hypothesize that so few “combiners” were inthe SNA program because most of its recipients were single adults receiving relativelysmall grants. Those who find work generally have earnings high enough to make themineligible for cash assistance.
Education and training activities. Although TANF emphasizes engaging in work andwork-related activities to meet participation requirements, states are free to require other program

108We did not have access to data on the number of cases participating in education, remedial, andtreatment activities prior to April 1999.
49
components, including education and training activities. HRA considers participation in suchactivities as engagement if the activities are consistent with a recipient’s employability plan.
• For FA, between April 1999 and November 2001, the percentage of the engageablecaseload participating in education and training was relatively stable, falling slightly from 7percent (11,692 cases) to 6 percent (5,274 cases).108
• For SNA during this same period, the percentage of the engageable caseload participatingin education and training activities increased, from 1 percent (516 cases) to 4 percent(1,390 cases), although total participation in these activities remained relatively low.
Treatment activities. Some welfare recipients cannot participate in work or job trainingprograms because they have serious substance abuse problems. Increasing proportions of FA andSNA cases participate in various treatment activities, often in lieu of mandatory work. (Manytreatment programs, however, include a work experience component.) Among FA cases,participation in treatment activities markedly increased.
• For FA, between April 1999 and November 2001, the percentage of the engageablecaseload in a treatment program grew from 0 percent (421 cases) to 2 percent (2,044cases).
• For SNA, a similar increase occurred. Between April 1999 and November 2001, thepercentage of the engageable SNA caseload participating in treatment activities increasedfrom 19 percent (11,558 cases) to 27 percent (10,311 cases). This increase in participationmay reflect improved coordination between HRA and substance abuse treatmentproviders.
Wellness/rehab. Recipients with a short-term medical problem are placed in a“wellness/rehab” program, where they can receive treatment for their illness and report back inseveral months. This initiative seeks to help recipients with chronic health problems, such asdiabetes, high blood pressure, or asthma, who need to be on a proper health regimen and learnhow to manage their health problem before engaging in work activities. The required engagementplan for recipients in this category is prepared by the medical assessment contractor and involvesboth medical rehabilitation services and regular assessments. Once the particular condition isstabilized, usually in three to six months, recipients are placed in a combined work, rehabilitation,and training engagement plan. The wellness plan is mandatory, and noncooperation results in thenormal work (i.e., partial) sanction.

109New York’s Office of Temporary and Disability Assistance gives localities flexibility in definingcommunity service, but specifies that “an individual needed in the home because another member of the householdrequires his/her presence due to a verified mental or physical impairment shall be deemed to be engaged incommunity service to the extent such person is actually providing care for such member of the household.” SeeNew York State Department of Labor, “Section 1300.9: Work Activities and Work Requirements,” p. 9-2,available from: www.labor.state.ny.us/pdf/13009.pdf, accessed February 3, 2003.
110We did not have access to data on the number of cases participating in community service prior to April1999.
111See the discussion: “Transfers to Safety Net Assistance.”
50
• For FA, between April 1999 and November 2001, the percentage of the engageablecaseload participating in wellness/rehab activities increased from 0 percent (0 cases) to 2percent (2,044 cases).
• For SNA during this same period, the percentage of the engageable caseload participatingin education and training activities increased from 0 percent (0 cases) to 7 percent (2,667cases), although total participation in those activities remained relatively low.
Community service. Working in a public or nonprofit agency, whether for pay or not, isgenerally considered a form of community service and would ordinarily be an allowable activityunder TANF. New York State defines this activity broadly to include caring for family memberswith impairments or other special needs.109 Thus, recipients who are “needed at home” areconsidered to have met their participation requirements. This is not a complete change in policy,because under the old AFDC program, such participants would have been exempt fromparticipation. However, because federal law no longer treats being needed at home as anexemption, considering such activities as a community service makes them countable towardapplicable participation requirements. (Foster parents are also considered to be providing acommunity service.)
HRA is apparently careful in granting exemptions in this category, which is bothamorphous and easily abused.
• For FA, the percentage of engageable cases classified as “needed at home” remainedsteady at 5 percent between April 1999 (7,617 cases) and November 2001 (4,638cases).110
• For SNA, the same pattern is evident: 3 percent of engageable cases were “needed athome” in April 1999 (1,606 cases) and in November 2001 (1,025 cases).
Other activities. Beginning in late 2000, HRA began offering some public assistancerecipients temporary, subsidized jobs.111 For example, under the Job Opportunities Program, HRA

112Jo Anne Barnhart, Deborah Chassman, and Sandie Hoback, Moving From Full Engagement to FullEmployment: A Program Review of New York City’s Welfare Reform (Klamath Falls, OR: American Institute forFull Employment, November 5, 2001), p. 14.
113See the discussion: “Monitoring the Process.”
51
developed arrangements with three city agencies to create temporary, one-year jobs paying about$8 to $10 per hour.112
• For FA, in November 2001, 3 percent (2,352 cases) of engageable cases were in asubsidized job.
• For SNA, 1 percent (397 cases) of engageable cases were in a subsidized job.
In engagement process. Even in a full-engagement program, some recipients experienceperiods when they are not participating in any activity and are waiting for an assignment. Thissituation generally arises when they lose an exemption or have completed an activity and have notyet been assigned to a new one. HRA tries to minimize such periods of inactivity by callingnonparticipants into the office within two weeks of a change in status (referred to as “call-inappointment scheduled”). Because recipients are involved with HRA while they are beingassessed and assigned to appropriate work activities, this process is also considered a form ofengagement, and participants are referred to as being in the engagement process.
In the past, it could take weeks, even months, for HRA to assign nonparticipants toprogram activities. With the adoption of its full-engagement model, however, HRA appears tohave also streamlined the engagement process.
• For FA, between November 1996 and November 2001, the percentage of engageablecases in the engagement process steadily declined from 17 percent (19,173 cases) to 11percent (10,022 cases). This trend is a reflection of heightened monitoring and schedulingactivities designed to minimize downtime.113
• For SNA, in contrast to the trend in the FA caseload, the percentage of engageable casesin the engagement process increased. Between November 1996 and November 2001, theproportion awaiting to be assigned to an activity increased from 10 percent (8,380 cases)to 17 percent (6,528 cases). We assume that this trend was caused by participants’ greaterneed for treatment services. It may take longer initially to assess their condition and placethem in an appropriate activity, thus leaving them in the engagement process longer.
In sanction process. Engagement includes both being sanctioned and “in the process ofbeing sanctioned.” The latter category is important because before a sanction can be imposed,HRA must provide recipients with an opportunity to resolve the problems associated withnonparticipation. This opportunity consists of a “conciliation conference.” If HRA determines that
114Barnhart, Chassman, and Hoback, Moving From Full Engagement to Full Employment, p. 14.
115See the discussion: “Less participation.”
52
a sanction should be imposed, a recipient can still request a fair hearing, and benefits will continueuntil a hearing decision has been made. This process can be time consuming and can delay thetime it takes to actually impose a sanction. (For FA cases, a first sanction can be ended when thenonparticipant complies with program requirements. In the case of a second sanction, benefits arereduced for a minimum of three months, and in the case of all subsequent sanctions, benefits arereduced for a minimum of six months. For SNA cases without children, the first and secondminimum sanction periods are slightly longer—three months and five months, respectively.)
Between November 1996 and April 1999, the proportion of engageable FA cases thatwere in the “in sanction process” category (including sanctioned cases) increased from 16 percent(17,727 cases) to 24 percent (37,911 cases). By December 1999, the proportion had reached 37percent (50,743 cases), after which point it seems to have leveled off. In November 2001, forexample, 34 percent (30,679 cases) of the engageable caseload was in the sanction process.
For FA cases, most of the growth in this category since April 1999, the earliest period forwhich detailed data are available, was the result of an increase in the number of cases with asanction in effect, rather than in the number of cases in the process of being sanctioned (e.g., inthe conciliation or fair hearing process). For example, just between April 1999 and November2001, the proportion of cases in the category that were actually under a sanction increased from20 percent to 51 percent, reflecting HRA’s commitment to making the process more efficient.
The large proportion of engaged cases that are under a sanction rather than in a work-related activity raises important concerns. Jo Anne Barnhart and her colleagues call this high levelof sanctions a “major barrier faced by NYC in moving case heads into work and self-sufficiency.”114 For example, alternative policies may be needed to bring the “happily sanctioned”recipients into compliance, as discussed below.115
The proportion of engageable SNA cases in the sanction process also increased, but atconsiderably lower levels than in the FA caseload. Between November 1996 and November 2001,the percentage of engageable SNA cases in the sanction process increased from 13 percent(10,386 cases) to 17 percent (6,505 cases) (see figure 6). However, the percentage in November2001 was half that of the FA caseload (17 percent vs. 34 percent). This relatively low percentagereflects that more than 95 percent of SNA cases are single adults, for whom a sanction usuallymeans case closure. Indeed, the percentage of engageable SNA cases that were in the process ofbeing sanctioned was about the same for the two programs (16 percent for FA and 17 percent forSNA).

116Douglas Martin, “New York Workfare Expansion Fuels Debate,” New York Times, September 1, 1995,p. A1.
117Joyce Purnick, “Metro Matters; Many Women On Workfare Express Hope,” New York Times, August22, 1996, p. B1.
118See the discussion: “Three-plus-two.”
53
IV. THE WORK EXPERIENCE PROGRAM
The centerpiece of the Human Resources Administration’s (HRA) welfare reform programis its Work Experience Program (WEP), the largest workfare program in the nation. Although itsprecursors date back at least to the 1970s, WEP was greatly expanded under the GiulianiAdministration in January 1995, when all new, able-bodied Home Relief recipients were madesubject to its requirements. In October 1995, the remainder of employable Home Relief recipientswere added, as were all new Aid to Families with Dependent Children (AFDC) recipients.116
Then, in April 1996, all the able-bodied AFDC recipients who had been receiving benefits beforeWEP began were added.117
Participation requirements are generally divided as follows: twenty hours per week in amandatory work experience placement (or less, if dividing the grant by the minimum wage wouldresult in fewer hours) and fifteen hours per week in one or more mandatory educational ortreatment programs. This is a relatively rigid delineation, and some observers have recommendedthat HRA be more flexible in emphasizing other services, particularly education and training, or intargeting the program to recipients who could most benefit from it.118
WEP’s Expansion
A long history in New York. Both New York State and New York City have a longhistory of operating mandatory work programs, although mostly for single adults receiving HomeRelief. In 1971, New York State established the Public Works Program (PWP)—the precursor ofWEP—to require Home Relief recipients to “work off” their grants. Two years later, New YorkCity created a mandatory work program for Home Relief recipients, the Work Relief EmploymentProject (WREP), under which participants received a paycheck and benefits in lieu of their grant.Participants worked in a wide range of jobs, including child care aides, couriers, janitors, clericalworkers, and security guards. An evaluation of the program, however, indicated that the cost of aWREP job was 19 to 33 percent higher than simply providing a welfare check, so program

119See Judith M. Gueron and Barbara Goldman, The U.S. Experience in Work Relief (New York:Manpower Demonstration Research Corporation, March 1983), p. 32.
120Blanche Bernstein, The Politics of Welfare: The New York City Experience (Cambridge: Abt Books,1982), p. 48.
121“City Welfare Work Program Grows,” New York Times, July 4, 1983, p. A23.
122Maurice Carroll, “New York Plans Job Requirement For Welfare Aid,” New York Times, October 20,1985, p. A1.
123“City Welfare Work Program Grows,” p. A23.
54
participation was limited to a maximum of eighteen months and the program was terminated in1976.119
From 1976 through the 1990s, New York City operated a public works program for able-bodied Home Relief recipients. The number of hours worked was based on the size of therecipient’s welfare payment and the nature of the work assignment. Blanche Bernstein suggeststhat these early workfare programs had significant deterrent effects:
Equally revealing are the results of the work test in the form of what is generally referredto as “workfare” but has various names in different states. In New York it is called thePublic Works Program (PWP), a program which involves working off the welfare grant atprevailing wages in various jobs in state and city agencies and, to some extent, in nonprofitagencies. (It can be used, however, only with respect to General Assistance cases. TheWIN [Work Incentive] program preempts the work test for AFDC clients.) In New YorkCity, where beginning in 1977 HRA succeeded in substantially enlarging PWPemployment, it was found that of the total number referred for jobs, 13 percent failed toreport for a PWP interview, 5 percent refused to accept an assignment, and 4 percentaccepted the assignment but failed to report for work—a total of 21 percent whose caseswere closed, of which about half remained closed for six months or more.120
By 1983, more than 11,000 welfare recipients were in public works jobs.121 Over the nexttwo years, the number increased to about 15,000, at which point the state capped the program.122
About one-third of the participants performed clerical and janitorial work in welfare centers.Others worked in the Parks and Recreation Department, the Housing Authority, the SanitationDepartment, and other public agencies and city-funded community organizations.
Beginning in April 1983, HRA began a pilot community work experience program forAFDC recipients who were scheduled to be dropped from assistance the following year (whentheir youngest children turned eighteen).123 Participants were assigned to work an average of fifty-eight hours per month in a variety of jobs at city and state government agencies and nonprofitorganizations, including the Department of Aging, HRA, the Parks and Recreation Department,the Housing Authority, Health and Hospitals Corporation, the Sanitation Department, the

124“City Welfare Work Program Grows,” p. A23.; Michael Goodwin, “Thousands on ‘Workfare’ Get Half-Pay for Doing City Jobs,” New York Times, August 20, 1984, p. A1.
125Alison Mitchell, “Giuliani Plans to Require Work From Able Welfare Recipients,” New York Times,October 8, 1994, p. A1.
126Jonathan Hicks, “Students at CUNY Complain Work Rule Limits Education,” New York Times,September 21, 1995, p. B3.
127The number of hours of WEP is limited to the combined value of a family’s public assistance(Temporary Assistance for Needy Families, or TANF, or Safety Net Assistance, or SNA) and Food Stamp benefits,divided by the minimum wage. The U.S. Department of Labor has held that mandatory work programs underTANF are subject to the Fair Labor Standards Act (FLSA), including the minimum wage. (The FLSA applies towork activities where recipients would be considered “employees” under the FLSA’s broad definition of that word.As a result, the minimum wage requirement may not apply to some activities, such as vocational education, jobsearch assistance, and secondary school attendance, because such activities are generally not consideredemployment.) Thus, the number of hours that a recipient can be required to work is determined by dividing thewelfare grant by the federal minimum wage. However, states can add the value of food stamps in the calculation ofthe hourly requirement. (For those TANF households with a child under six years of age, who would normally beexempt from a Food Stamp work requirement, states can use the Simplified Food Stamp Program to lower the ageexemption in the Food Stamp Program and bring it into conformity with TANF. New York has a Simplified FoodStamp Program that lowers the age exemption from six years to one year.)
In 2001, the maximum monthly TANF grant in New York City for a three-person family was $577,resulting in a maximum work obligation of a about 25 hours per week. Adding food stamps would raise themonthly benefit total to $888, allowing for a WEP assignment of about forty hours per week.
55
Cultural Affairs Department, and the Board of Education as well as various hospitals, communityboards, and libraries.124 In addition, New York City periodically operated work programs forspecial populations, such as the homeless. Thus, by the mid-1990s, it had operated sizeable workexperience programs for various welfare populations for nearly a quarter of a century.
Current WEP. When WEP began in 1995, participants were required to work a minimumof twenty hours per week.125 In its first year of operation, this requirement was increased totwenty-six hours per week for Home Relief recipients.126 The work hour requirements weregradually raised to the point that, by 1999, most able-bodied adults receiving assistance undereither Family Assistance (FA) or Safety Net Assistance (SNA) had to work or participate in otherdesignated activities for thirty-five hours per week.127 At least 40 percent of the thirty-five hours,however, are usually not in a work experience assignment, but are in a specified education ortreatment program, as described below.
This thirty-five hour requirement exceeds the current federal requirement of thirty hoursneeded to satisfy TANF (twenty hours for a single parent with a child under six) and is more thanalmost any program in the nation. It is intended to simulate full-time work and to give recipientsan incentive to leave welfare or at least to find unsubsidized employment. As one HRApublication explains:
128City of New York, Human Resources Administration, Ladders to Success: Innovations in CityGovernment (New York: Human Resources Administration, 2000), p. 15 (emphasis in original).
129See the discussion: “Combining work and welfare.”
130Due to data gaps, the only month in Fiscal Year 2000 for data on work experience participation in NewYork City was December 1999. It is used as proxy for the average monthly caseload for that year. This is onereason why the number of work experience participants in New York City exceeds the total number of participantsin New York State. It suggests that the number of work experience participants in the city declined throughoutmost of 2000. Indeed, by November 2000 (which is part of Fiscal Year 2001), the number of work experienceparticipants in New York City had dropped to 15,774. There are probably other differences between the way thecity and state compute the number.
56
Since individuals will be involved in activities full time, the choice is no longer betweenworking and not working but between working in a work experience assignment andworking in the private sector earning real income. There is no advantage for an individualto perform work experience instead of unsubsidized employment.128
Although the standard obligation for most recipients is to participate for 35 hours per week,recipients working and receiving a welfare grant (“unsubsidized employment”) are generally notrequired to participate for more hours than their jobs.129
HRA’s mandatory work experience program is the largest in the nation. As table 1indicates, at its peak in December 1999, 14 percent of the adults receiving FA participated inWEP, compared with a national monthly average of just 4 percent in fiscal year 2000.130 With21,933 WEP participants, New York City accounted for more than one-third of the nation’s61,643 work experience participants, and it far exceeded the average monthly number ofparticipants in other states with a relatively high reliance on work experience programs, includingNew Jersey (6,016), Ohio (14,127), and Wisconsin (3,227).

57
Table 1. Average Monthly Number of Adults in Work Experience, Unsubsidized Employment, or Sanctioned, Selected States, Fiscal Year 2000
U.S. CA IL MI NJ NY NYCa OH PA TN TX WV WI
Adults 1,588,651 304,705 66,143 54,679 33,056 232,540 154,019 65,129 63,879 44,003 90,275 10,157 5,710
Workexperience
4%61,643
<1%1,613
5%2,984
<1%62
18%6,016
6% 14,601
14%21,933
22%14,127
2%1,257
<1%253
<1%417
8%776
57%3,227
Unsubsidizedemploymentb
24%382,604
25%75,631
39%25,478
40%21,782
20%6,658
20%45,508
20%30,316
31%20,279
25%15,911
20%8,646
6%5,733
6%632
8%438
Sanctionc 5%79,433
1%2,864
10%6,475
3%1,755
8%2,658
11%25,902d
14%21,976
2%1,420
5%3,449
NA 15%13,966
NA 23%1,299
Unsubsidizedemploymentor sanction
29%462,037
26%78,495
48%31,953
43%23,537
24%9,316
29%68,505
34%52,292
33%21,699
30%19,360
20%8,646
22%19,699
6%632
30%1,737
Subject tomandatee
1,126,614 226,210 34,190 31,142 23,740 161,130 101,727 43,430 65,675 35,357 70,576 9,525 3,973
% subject tomandate inworkexperience
6% 1% 9% <1% 25% 9% 22% 33% 1% 1% 1% 8% 81%
March 1994caseload
5,098,288 916,427 241,817 227,114 123,025 457,660 308,685 254,021 211,711 111,740 286,613 41,521 78,739
FY 2000caseload
2,272,210 501,019 88,493 74,709 51,630 258,702 187,343 98,443 89,899 56,476 127,880 12,146 16,719
Caseloaddecline
55%2,826,078
45%415,408
63%153,324
67%152,405
58%71,395
43%198,958
39%121,342
61%155,578
58%121,812
49%55,264
55%158,733
71%29,375
79%62,020
Sources: For national data, see U.S. Department of Health and Human Services, Administration for Children and Families, Office of Planning, Research, andEvaluation, Temporary Assistance for Needy Families Program: Fourth Annual Report to Congress (Washington, D.C.: U.S. Department of Health and Human

58
Services, April 2002), p. III-96, available from: www.acf.dhhs.gov/programs/opre/ar2001/indexar.htm, accessed August 6, 2002. For New York City data, see NewYork City Human Resources Administration, “FA/TANF — December 26, 1999 — Weekly Report” (New York: New York City Human Resources Administration,December 1999).Notes:aNew York City data for December 26, 1999.bAlthough the 1996 welfare reform law calls this category “unsubsidized employment,” the term is misleading because it involves the ongoing provision of a welfaregrant.cBased on sanction rates reported by the U.S. General Accounting Office for 1998.dThe number of sanctions in the state of New York was not reported. The number of sanctions in the state is based on the sum of those reported in New York City forDecember 1999 and 5 percent of the remaining caseload, based on the national average reported by the U.S. General Accounting Office.eThe term “subject to mandate” is intended to identify the number of recipients who are potentially available for participation in work-related activities because they areneither in unsubsidized employment nor in sanction status.

131“Saving the City’s Backyards,” New York Times, January 25, 1995, p. A20.
132Martin, “New York Workfare Expansion Fuels Debate,” p. A1.
133Paul Moses, “Less Welfare Means More Workfare,” Newsday, August 2, 1996, p. A6; RobertPolner,“City Welfare Plan: Workfare or Else / Homeless Moms Will Lose Aid If They Refuse,” Newsday, August17, 1996, p. A5; and Dan Morrison, “East or West, Which Is Best?” Newsday, September 1, 1996, p. A6.
134Andrew Bush, former executive deputy administrator, New York City Human ResourcesAdministration, e-mail to Douglas Besharov, May 14, 2003.
59
WEP caseloads grew rapidly, going from 850 Home Relief participants in January 1995131
to 23,000 Home Relief recipients by September of that year (in both Home Relief and FA).132 Thisincreased to about 35,000 participants in 1996, with as many as 15,000 of them coming from theAFDC rolls.133 WEP’s caseload peaked in May 1997 at nearly 40,000 adult participants (dividedalmost equally between FA and SNA recipients). Over the next three years, the total number ofWEP participants gradually declined to about 33,000, and FA recipients making up an increasingshare of participants. Then, from May 2000 to September 2001, the WEP caseload fell by nearly50 percent, to about 17,000 (about 10,000 FA recipients and about 7,000 SNA recipients) (seefigure 7). Some of this decline is probably related to the decline in total caseloads, which fell 18percent during this period, from 268,903 to 219,244. According to Andrew Bush, former HRAexecutive deputy administrator:
As we developed our program, WEP itself became just part—one of the tools—of whatour reforms were about (and a declining part of those reforms). We felt that whenproperly focused and operated, and backed-up by a real work requirement, the programwould become one where people getting real jobs was a common and central concern ofthe enterprise. Thus, as we became more employment oriented—moving up job search tothe application period and before WEP, and doing job search concurrently with just abouteverything, our reliance on WEP declined, both numerically and as a percentage ofcaseload.134

60
Figure 7. Work Experience Program Participation,New York City, March 1997–September 2001
In thousands
Family Assistance (FA)
Safety Net Assistance (SNA)
Mar. 1997
Sep. 2001
Sep. 1997
Mar. 1998
Sep. 1998
Mar. 1999
Sep. 1999
Mar. 2000
Sep. 2000
Mar. 2001
40
30
20
10
Sources: Authors’ estimates from New York City Human Resources Administration, PAin NYC: 6-Year Engagement Comparison (New York: New York City Human ResourcesAdministration, October 18, 2001), figures. “Bi-Weekly WEP Roster for FA and SNAthrough 7/17/01” and “Bi-Weekly WEP Roster through 9/17/01.”Note: In New York, FA was called “Aid to Families with Dependent Children” and SNAwas called “Home Relief” before 1998.
New York City’s WEP is impressive not only in how rapidly it could create work slots forso many welfare recipients but also in the size of the caseload involved, especially for FArecipients. Between 1995 and 2001, WEP provided a mixture of mandatory work experiencesenriched by an array of remedial and treatment services to more than 250,000 recipients.
In December 1999, the New York City rate of WEP participation was more than fourtimes that of the entire nation. Table 1 shows the average monthly number of TANF adults in theU.S. and eleven selected states in fiscal year 2000, including the number and proportion involvedin various work activities. (The eleven states were selected either because they had the largestTANF caseloads or had large numbers of adults in work experience programs.) The table includessimilar information for New York City’s FA caseload in December 1999, the only month in fiscalyear 2000 for which we had data. The table shows that about 14 percent of the city’s adult FArecipients were in work experience activities, compared with about 4 percent for the nation as awhole (or 3 percent if New York City were excluded). Moreover, New York City aloneaccounted for more than one-third of all work experience participants in the United States. Even

135The number of WEP participants is approximated from an HRA figure of the number of people in WEPduring a given two-week cycle. As explained above, this number differs from the number on Weekly EngagementReports, which show the primary engagement status for cases active at a point in time (every Sunday night).
136See note 135.
137Martin, “New York Workfare Expansion Fuels Debate,” p. A1.
138Demetra Smith Nightingale, Nancy Pindus, Frederica D. Kramer, John Trutko, Kelly Mikelson, andMichael Egner, Work and Welfare Reform in New York City During the Giuliani Administration: A Study ofProgram Implementation (Washington, D.C.: Urban Institute, July 2002), p. 39, stating: “Agencies, vendors, andworksite supervisors have no control over when assignments are made or who is assigned to their worksite, orwhen a participant may be transferred from one site to another.” And, stating in the footnote: “Parks Departmentstaff, for example, noted that although they operated two job assistance programs as an ESP vendor, their ownWEP participants frequently could not take advantage of these opportunities because they had already beenassigned to other ESP vendors.”
61
as a percentage of the caseload, only Ohio and Wisconsin had a larger share of their caseload inwork experience programs.
• For FA, WEP was implemented beginning in October 1995. The program expanded untilMay 1997, when it had about 20,000 participants. Over the next three years, the numberof WEP participants gradually declined to about 15,000 in 1999, but it rose back to justover 20,000 by May 2000. (During this period, the FA caseload fell 31 percent, from260,017 to 180,022.) From May 2000 on, however, the number of WEP participants fellsteadily. By November 2001, the WEP caseload had fallen nearly 50 percent, to about10,000 participants. During this eighteen-month period, the FA caseload fell 17 percent,from 180,022 to 148,608.135
• For SNA, WEP appears to have peaked in March 1997, at about 21,000 participants,declining slightly by May 1997 to about 19,000 participants. Over the next three years, thenumber of WEP participants gradually declined to about 13,000 by May 2000. (Duringthis period, the SNA caseload fell 29 percent, from 146,179 to 104,428.) By November2001, the WEP caseload had fallen nearly 50 percent, to about 7,100 participants. Duringthis eighteen-month period, the SNA caseload fell 28 percent, from 104,428 to 74,828.136
The WEP Experience
WEP participants mainly worked in government and nonprofit agencies, “cleaningSanitation Department garages, picking up litter in parks, and performing clerical tasksthroughout New York City.”137 Assignments are made by HRA staff.138
WEP sites. Most WEP assignments are in city agencies, although some are in private,nonprofit organizations. Table 2 shows the number of WEP assignments by agency at selectedpoints in time. (These are assignments for the total Public Assistance caseload; a separate

62
breakdown for FA and SNA cases is not available.) Almost all WEP participants were placed withcity agencies; although about forty different agencies provided WEP slots, as of December 2000nearly two-thirds of WEP participants were placed in just four agencies: the Department of Parksand Recreation (“Parks Department”), HRA, the Department of Sanitation, and the Departmentof Citywide Administration Services. The few WEP participants not assigned to city agencieswere mostly in community-based organizations.
In March 1996, the Parks Department had the largest number of WEP participants(6,259), or nearly a third of the entire WEP caseload. This total dropped slightly, to 6,154participants in June 1999 (less than 20 percent of the WEP caseload), but then fell to 4,259 inJune 2000 (14 percent of all WEP participants) and to 3,852 in December 2000 (18 percent of allWEP participants). Nearly half of all the agencies with WEP workers had fewer than twenty-fiveparticipants.
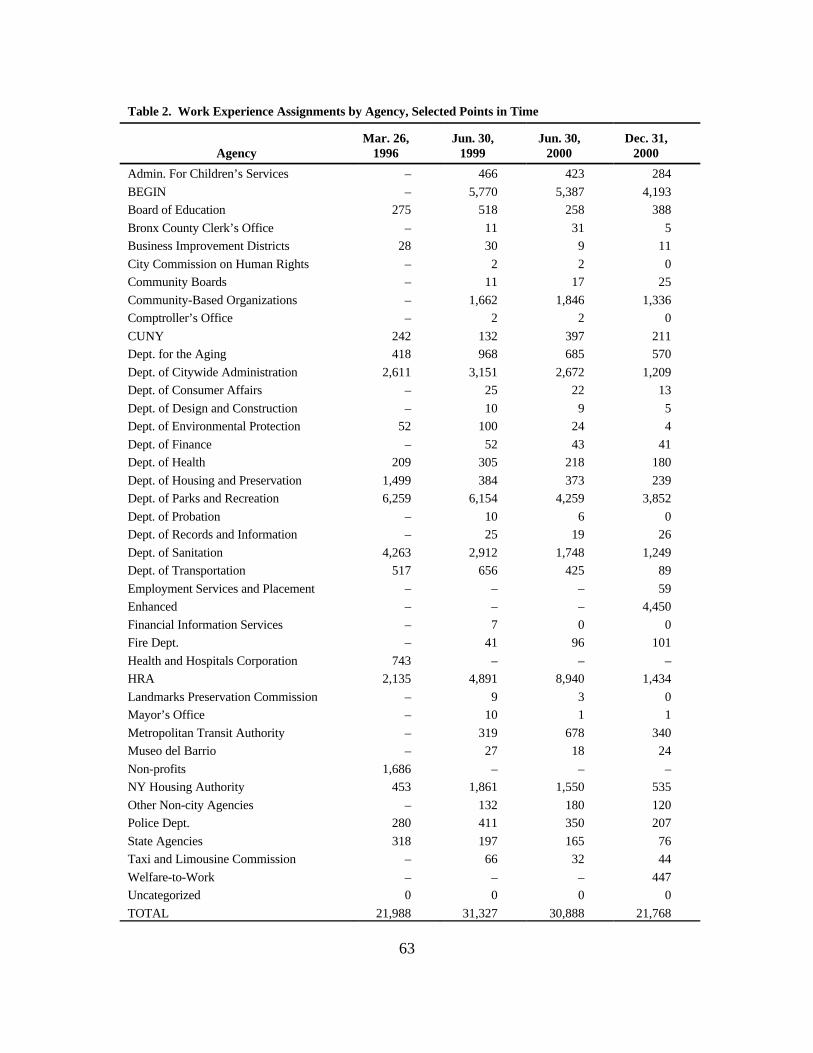
63
Table 2. Work Experience Assignments by Agency, Selected Points in Time
AgencyMar. 26,
1996Jun. 30,
1999Jun. 30,
2000Dec. 31,
2000
Admin. For Children’s Services – 466 423 284BEGIN – 5,770 5,387 4,193Board of Education 275 518 258 388Bronx County Clerk’s Office – 11 31 5Business Improvement Districts 28 30 9 11City Commission on Human Rights – 2 2 0Community Boards – 11 17 25Community-Based Organizations – 1,662 1,846 1,336Comptroller’s Office – 2 2 0CUNY 242 132 397 211Dept. for the Aging 418 968 685 570Dept. of Citywide Administration 2,611 3,151 2,672 1,209Dept. of Consumer Affairs – 25 22 13Dept. of Design and Construction – 10 9 5Dept. of Environmental Protection 52 100 24 4Dept. of Finance – 52 43 41Dept. of Health 209 305 218 180Dept. of Housing and Preservation 1,499 384 373 239Dept. of Parks and Recreation 6,259 6,154 4,259 3,852Dept. of Probation – 10 6 0Dept. of Records and Information – 25 19 26Dept. of Sanitation 4,263 2,912 1,748 1,249Dept. of Transportation 517 656 425 89Employment Services and Placement – – – 59Enhanced – – – 4,450Financial Information Services – 7 0 0Fire Dept. – 41 96 101Health and Hospitals Corporation 743 – – –HRA 2,135 4,891 8,940 1,434Landmarks Preservation Commission – 9 3 0Mayor’s Office – 10 1 1Metropolitan Transit Authority – 319 678 340Museo del Barrio – 27 18 24Non-profits 1,686 – – –NY Housing Authority 453 1,861 1,550 535Other Non-city Agencies – 132 180 120Police Dept. 280 411 350 207State Agencies 318 197 165 76Taxi and Limousine Commission – 66 32 44Welfare-to-Work – – – 447Uncategorized 0 0 0 0TOTAL 21,988 31,327 30,888 21,768

139Nightingale, Pindus, Kramer, Trutko, Mikelson, and Egner, Work and Welfare Reform in New YorkCity During the Giuliani Administration, p. 39.
140Elizabeth Zeldin, “Use of Work Experience Program Participants at the Department of Parks andRecreation,” Inside the Budget (Independent Budget Office of the City of New York newsletter), November 1,2000, available from: www.ibo.nyc.ny.us/, accessed January 10, 2002.
141Zeldin, “Use of Work Experience Program Participants at the Department of Parks and Recreation.”
142Nightingale, Pindus, Kramer, Trutko, Mikelson, and Egner, Work and Welfare Reform in New YorkCity During the Giuliani Administration, pp. 39 and 41.
143Laura Wernick, John Krinsky, and Paul Getsos, The Work Experience Program: New York City’sPublic Sector Sweat Shop Economy (New York: Community Voices Heard, 2000), available from:www.cvhaction.org/Publications.html, accessed January 23, 2002.
64
Source: Demetra Smith Nightingale, Nancy Pindus, Fredrica D. Kramer, John Trutko, Kelly Mikelson, andMichael Egner, Work and Welfare Reform in New York City During the Giuliani Administration: A Study ofProgram Implementation (Washington, D.C.: The Urban Institute Labor and Social Policy Center, July 2002),p. 40, table III.2.
WEP activities. Most WEP participants perform one of three types of activities: “clerical,custodial/maintenance, and human services (such as work at day care and senior citizencenters).”139 In the Parks Department, for example, according to Elizabeth Zeldin of the NewYork City Independent Budget Office, WEP workers generally performed low-skill maintenanceand clean-up.140 The most frequently reported tasks were sweeping and raking litter (96 percent ofrespondents), emptying garbage cans (82 percent), cleaning and maintaining restrooms (53percent), and refuse collection (46 percent).141 WEP workers have constituted as much as 20percent of the department’s maintenance staff and have been credited with having helped improvethe cleanliness of the city’s parks.142
In a 1999–2000 survey of city agencies with a significant number of WEP slots byCommunity Voices Heard (CVH), a citywide organization of welfare recipients, WEP participantsreported similar assignments.143 At the Department of Citywide Administration Services, whichmaintains city properties, 84 percent of WEP participants reported cleaning bathrooms, 82percent reported emptying wastebaskets, 75 percent cited sweeping and mopping, and 56 percentincluded replacing bathroom supplies among their duties. WEP clerical and office workers at avariety of agencies most frequently reported filing records (81 percent), answering phones (63percent), and keeping records (55 percent). Similarly, WEP workers in nonprofits and schoolsreported being teacher’s aides (53 percent), clerical workers (26 percent), or helpers in seniorcitizens’ homes (11 percent). At the Transit Authority, WEP participants reported emptying

144Cited in James Clark, “New York’s WEP Program,” unpublished paper submitted to Baruch College,City University of New York, 2001, p. 92.
145Seth Diamond, former deputy commissioner for Operations, New York City Human ResourcesAdministration, conversation with Marie Cohen, December 5, 2001.
146James Clark, “New York’s WEP Program,” p. 95.
147Nightingale, Pindus, Kramer, Trutko, Mikelson, and Egner, Work and Welfare Reform in New YorkCity During the Giuliani Administration, pp. 36-37.
148Nightingale, Pindus, Kramer, Trutko, Mikelson, and Egner, Work and Welfare Reform in New YorkCity During the Giuliani Administration, p. 39.
65
garbage cans (98 percent), sweeping stairs and street areas (83 percent), cleaning and polishingsurfaces (81 percent), and dusting handrails and turnstiles (74 percent).
Some of the agencies that use a large number of WEP participants, like the ParksDepartment, invest substantial resources in supervising them.144 HRA pays these agencies so thata WEP supervisor gets an extra $2,000 for supervising a crew of WEP participants.145 The ParksDepartment has developed a “procedures manual” for WEP supervisors, which includesinstructions on supervision as well as information on program rules and regulations.146 Sometimes,the agencies made real accommodation to the WEP participants, as Nightingale and hercolleagues describe:
Administrators in WEP programs visited also noted their interest in making WEP moreresponsive to the needs of participants. For example, the Parks Department has adjustedthe work hours for WEP assignments (changed from 7 am to 3:30 pm to 9 to 5:30) inorder to accommodate women with children, tries to make assignments close toparticipants’ homes or children’s schools, and assigns some individuals to recreationcenters and after school programs. However, most available slots are still in outdoormaintenance. HRA also grants four weeks of excused absence from workfare if nochildcare is available, and up to two days absence without a doctor's note for illness or tocare for a sick child.147
Attendance is reported biweekly from worksites, affording worksite supervisors somediscretion in mediating compliance with attendance and work requirements. Participants who donot work all scheduled hours (and are not excused from doing so) are supposed to be droppedfrom the WEP assignment, and a conciliation notice is supposed to be issued. Individuals assignedto WEP are expected to continue seeking paid employment and are granted excused absence fromwork assignments for the time spent in job interviews (but interviews must be documented).148
Enhanced WEP. A number of WEP programs have been structured to accommodate thespecial circumstances or needs of recipients. (These programs are often called “enhanced WEP.”)For example, in 1994 the Parks and Recreation Department (in cooperation with HRA) created

149The Parks and Recreation Department administers the program, but HRA provides three-fourths of thefunding. See James Clark, “New York’s WEP Program,” p. 94.
150Hugh O’Neill, Kathryn Garcia, Virginie Amerlynck and Barbara Blum, Policies Affecting New YorkCity’s Low-Income Families (New York: National Center for Children in Poverty, October 2001), p. 33, availablefrom: http://cpmcnet.columbia.edu/dept/nccp/policiesNYCrep.pdf, accessed March 26, 2002.
151O’Neill, Garcia, Amerlynck and Blum, Policies Affecting New York City’s Low-Income Families, p. 33.
152James Clark, “New York’s WEP Program,” p. 93.
153James Clark, “New York’s WEP Program,” p. 93. (See above note.)
154City of New York Parks and Recreation Department, About PACT (Department of Parks and RecreationWeb site, http://nycparks.completeinet.net/sub_opportunities/pact/html/about.html).
155City of New York Parks and Recreation Department, About PACT.
156James Clark, “New York’s WEP Program,” p. 93.
157O’Neill, Garcia, Amerlynck and Blum, Policies Affecting New York City’s Low-Income Families, p. 33.
66
the Parks Career Training (PACT) program.149 As of October 2001, the Department’s agreementwith HRA required PACT to serve 1,000 public assistance recipients per year.150 In 2001, about500 participants were in the program at any given time; 75 percent of them were women withchildren.151 PACT participation typically lasts about six to eight months.152 Training is for jobs in“security, construction, custodial work, horticulture, clerical, auto mechanics,telecommunications, and MIS support.”153 In addition, PACT workers have the opportunity toobtain a regular or commercial driver’s license and become certified in security, first aid, andCPR.154
PACT allows public assistance recipients with WEP assignments at the Parks Departmentto volunteer for an intensive training program that combines WEP with training in occupationalfields such as security, construction, custodial work, horticulture, clerical work, auto mechanics,and telecommunications. On-the-job training is provided in either “small, supervised crews” orthrough individual internships for about six months.155 This training is supplemented by classroomtraining in topics such as computer literacy, graffiti removal, plant identification, pest control,basic electrical and plumbing skills, floor care, and sheet rock installation.
Through an agreement with the city’s Board of Education, PACT participants may alsoattend classes in basic education, GED preparation, and English as a Second Language.156 PACTcounselors provide job readiness training, resume assistance, and referrals to employers. They alsowork with participants to help them address child care, housing, and other needs that might affecttheir transition to employment. PACT retention specialists also provide follow-up and supportservices to participants once they find jobs.157 According to James Clark, former director of theSouth Carolina Department of Social Services, “the idea was to go beyond the development of

158James Clark, “New York’s WEP Program,” p. 93.
159James Clark, “New York’s WEP Program,” pp. 86–89.
160Jo Anne Barnhart, Deborah Chassman, and Sandie Hoback, Moving From Full Engagement to FullEmployment: A Program Review of New York City’s Welfare Reform (Klamath Falls: American Institute for FullEmployment, November 5, 2001), p. 20.
161Seth Diamond, former deputy commissioner for Operations, New York City Human ResourcesAdministration, personal communication to Marie Cohen, November 12, 2001.
162See Nightingale, Pindus, Kramer, Trutko, Mikelson, and Egner, Work and Welfare Reform in New YorkCity During the Giuliani Administration, p. v, stating: “After major opposition, court challenges, and a two-yearmoratorium, 30 Job Centers where individuals can apply for FA, SNA and other benefits were operating by 2001.”
67
basic work readiness skills, such as showing up for work on time and dealing with supervision, toobtaining marketable skills.”158 Many of its participants have been placed in regular employment,usually in the private sector.
Such coordination is most prevalent in programs for special populations, such as BeginEmployment Gain Independent Now (BEGIN) program, Personal Roads for IndividualDevelopment and Employment (PRIDE), and programs for drug-dependent recipients. Some ofthe Employment Services Placement (ESP) contractors, however, are also trying to work with theWEP worksites. According to Clark, one ESP contractor, Career Education Consultants (CEC),works with supervisors of WEP recipients to make the two experiences complement each other asmuch as possible.159 For example, CEC staff work with supervisors to try to adjust both the WEPplacement and the training provided by CEC. They also attempt to get letters of reference fromthe supervisors.
A private contractor, Wildcat Service Corp., develops its own WEP sites by bidding onservice contracts such as park maintenance, cleaning shelters, and temporary services for HRA.Wildcat has also developed customized programs that combine WEP with classroom trainingtailored to industries such as banking, finance, and home care. Moreover, Wildcat has differentmodels for combining WEP with classroom training. In addition to the traditional model of threedays per week of WEP and two days per week of classroom training, Wildcat offers one programin which 80 percent of the participants’ time is spent on WEP and 20 percent is spent onclassroom training. It also offers a program that trains participants for jobs in the financial servicesindustry, which provides one week of WEP alternating with one week of classroom training.160
Criticisms. Despite the HRA’s success in implementing WEP on a large scale,implementation has not been without its critics. There has been a regular flow of critical reports,newspaper articles, and lawsuits, which appear to have consumed much of the time of high-levelHRA administrators and slowed implementation of various program initiatives.161 In fact, theopening of about half the Job Centers was delayed for at least two years by “major opposition[and] court challenges.”162

163Community Voices Heard, Welfare to Work: Is It Working? The Failure of Current Welfare-to-WorkStrategies To Move the Hardest To Employ Into Jobs (New York: Community Voices Heard, 1999), p. 12,available from: www.cvhaction.org/Publications.html, accessed January 23, 2002.
164Laura Wernick, John Krinsky, and Paul Getsos, The Work Experience Program: New York City’sPublic Sector Sweat Shop Economy (New York: Community Voices Heard, 2000), available from:www.cvhaction.org/Publications.html, accessed January 23, 2002.
165Wernick, Krinsky, and Getsos, The Work Experience Program: New York City’s Public Sector SweatShop Economy, p. 14.
166Heather Mac Donald, “Don’t Mess with Welfare Reform’s Success,” City Journal, Winter 2002, vol.12, no. 1, available from: www.city-journal.org/html/12_1_dont_mess.html, accessed January 8, 2002.
68
Advocates have complained that WEP has not enhanced the employability of mostrecipients. Of 328 WEP workers responding to a 1998 CVH survey, a majority (57 percent) saidthat WEP had not developed their skills and experience. The authors concluded: “Without anidentity as an employee of the agency, and the worksite, WEP workers are treated like a casuallabor force that does not merit training, a job description, or close supervision.”163
These criticisms seem exaggerated, however. We have no information about the survey’sresponse rate or its representativeness. Moreover, a later study by the same group seems tocontradict its earlier claims. The second survey involved 649 WEP participants at 131 worksitesin 1999 and 2000. It found that most respondents reported doing the same work as regularmunicipal employees and that WEP workers were performing 35 of the 36 tasks in three union jobtitles.164 (The survey included a mixture of FA and SNA recipients, but the findings were notreported separately.) CVH found that “workfare workers are doing critical work for the city,ranging from keeping parks clean and safe, doing light repair work and doing entry-levelreceptionist duties.”165 This finding suggests that participants were performing “real work.”Ironically, the survey was used as the basis of a complaint that WEP participants are performingthe same work as public employees at a much lower wage rate.
Based on the available data, we tentatively conclude that, at a minimum, most WEPparticipants after 1999 had a work experience that resembled the real world of work, whichshould have at least given them the experience of having a job. We have no way of knowing whatspecific work-related skills participants may have gained or how common would be positivecomments similar to those of a participant quoted by Heather Mac Donald:
Denyse Paul, an elegant young woman who sought Medicaid and welfare after developingrheumatoid arthritis, maintains otherwise, based on firsthand experience. “WEP was goodfor me,” she says, “I could show them I could do it.”166
Some WEP participants have also complained about being treated as second-class workersin their agencies. WEP workers in the Parks and Recreation Department, for example, had special

167Nightingale, Pindus, Kramer, Trutko, Mikelson, and Egner, Work and Welfare Reform in New YorkCity During the Giuliani Administration, pp. 39 and 41.
168Annette Fuentes, “Giuliani’s Workfare: Slaves of New York,” In These Times, December 23, 1996.
169Seth Diamond, conversation with Marie Cohen, December 20, 2001.
170Nightingale, Pindus, Kramer, Trutko, Mikelson, and Egner, Work and Welfare Reform in New YorkCity During the Giuliani Administration, p. 41.
171Steven Greenhouse, “Federal Suit Accuses City of Not Acting on Harassment Complaints,” New YorkTimes, July 15, 2001, p. A27.
172Greenhouse, “Federal Suit Accuses City of Not Acting on Harassment Complaints,” p. A27.
69
uniforms that are different from the uniforms worn by regular department employees.167 WEPparticipants (and their advocates) have also complained that some WEP employees are notallowed to use the same bathrooms and cafeterias as regular employees. One critical account ofWEP described the plight of one participant, Sandra White:
Assigned to street cleaning, White endures dangerous and unsanitary conditions—and thecontempt of regular sanitation employees. The orange safety vests that WEP workerswear are stored in garbage cans, and if they bring a bag lunch it gets tied to the cans’handles for storage. But worst of all, White says, is the “bathroom problem.” “I have to gofrom business to business looking for a toilet,” she says. At the sanitation depot inBrooklyn where they meet before being driven by van to work sites, union workers wroteon the bathroom door, “No WEP workers.”168
According to Seth Diamond, HRA’s deputy commissioner for operations at the time, the agencyhas been unable to substantiate those claims when it calls the agencies involved and such practicesare not a matter of policy for either HRA or the agencies involved.169 Indeed, some have arguedthat many WEP recipients like their assignments and have trouble leaving them. Seeming tosupport HRA’s position, Demetra Nightingale and her colleagues report that “some participantsmight get too comfortable in work assignments, particularly if they have little or no prior workexperience and see no other options.”170
At least a few complaints have been made about sexual and racial harassment of WEPparticipants. The Clinton administration sued the Giuliani administration for failing to protectwomen in WEP assignments from sexual and racial harassment.171 In filing the suit, the U.S.attorney described incidents such as a supervisor turning out the office lights and telling a welfareworker to pull down her pants; and another supervisor minimizing the significance of racialcaricatures and a noose hanging in a window when a recipient was assigned to paint a building.172
We cannot assess the accuracy of such claims. HRA officials noted in our interviews that thenumber of such claims was small and that they were dealt with thoroughly.
173Public Advocate for New York City, Welfare and Child Care: What About the Children? (New York:Office of the Public Advocate, June, 1997), as quoted in Association of the Bar of the City of New York,Committee on Social Welfare Law, Welfare Reform in New York City: The Measure of Success (New York:Association of the Bar of the City of New York, August 2001), p. 9, available from:www.abcny.org/currentarticle/welfare.html, accessed January 11, 2002.
174O’Neill, Garcia, Amerlynck and Blum, Policies Affecting New York City’s Low-Income Families, p. 66.
175O’Neill, Garcia, Amerlynck and Blum, Policies Affecting New York City’s Low-Income Families, p. 66.(See above note.)
70
We are prepared to accept at least some of the foregoing allegations as individual cases ofinappropriate or unfair behavior, but in the absence of any independent corroboration (includingreliable statistical evidence), we have no objective reason to believe that the incidents arewidespread.
Finally, the child care provided under HRA’s auspices has also been criticized. HRA’sofficial policy is to provide subsidized child care for all welfare recipients with children under agethirteen who are working or engaged in approved activities. Parents are free to choose the type ofcare they prefer, including center-based care, licensed family day care, or informal care by a friendor relative. Child care specialists or job center workers help find child care for recipients whocannot find it on their own. Some service providers, however, raised concerns regarding the childcare arrangements of participants, particularly informal care. For example, in 1997 the city’sPublic Advocate accused HRA of failing to ensure that children are being cared for in safe,appropriate settings.173 Again, little systematic evidence supports such claims.
Moreover, none of the recipients, former recipients, or service providers that participatedin focus groups run by the National Center for Children in Poverty cited inability to obtain childcare as a barrier to employment.174 The focus group results suggest that the prevalence of informalarrangements reflects recipient preferences as well as shortages of licensed care, although somefocus group participants cited problems with the convenience and reliability of informalproviders.175

176Thomas Brock, David Butler, and David Long, Unpaid Work Experience for Welfare Recipients:Findings and Lessons from MDRC Research (New York: Manpower Demonstration Research Corporation, 1993),pp. 69-70.
177Jason Turner and Thomas Main, “Work Experience Under Welfare Reform,” in The New World ofWelfare, edited by Ron Haskins and Rebecca Blank (Washington, D.C.: The Brookings Institution, 2001), p. 300.
71
V. “MEANINGFUL” WORK VERSUS DISPLACEMENT
All mandatory work experience programs that seek to provide a realistic, or “meaningful,”work experience—in which welfare recipients provide services of value to the community—mustface the issue of possible worker displacement (i.e., the substitution of regular employees withwelfare recipients). If the work would otherwise have been performed by a regular employee,someone else does not have the job. Invariably, unions oppose the creation of placements in whichreal work is performed, fearing that existing state or municipal union employees will be replaced.Their opposition helps explain why so few large-scale mandatory work experience programs havebeen established.176
“Meaningful” Work
Not “make-work”. Too many work experience programs are little more than make-work,which is both demeaning and ultimately counterproductive because it breeds a contempt for theresponsibility to become self-sufficient. Most experts believe that if the potential of workexperience programs is to be achieved, participants should be performing “real work.” Forexample, Jason Turner, former commissioner of the Human Resources Administration (HRA),and his co-author Thomas Main, professor at Baruch College, write:
Real work must be accomplished. Nothing is more dispiriting to those expecting to workthan to remain idle, or worse, ignored, on the job. By contrast, the pride and satisfactionof successfully mastering work tasks often result in a big psychological lift and translateinto confidence in the search for private employment.177
That does not mean, however, that the work experience needs to be in a white-collar job.As Heather MacDonald complains:
Many share the prejudice of Orange County, California’s, social services director, LarryLeaman, who exclaims: “The last thing we need is leaf rakers in California! In moderntimes, it’s unthinkable.” Leaman and others see workfare as demeaning to participants anda throwback to the WPA [Works Progress Administration] days.

178Heather Mac Donald, “Don’t Mess with Welfare Reform’s Success,” City Journal, Winter 2002, vol.12, no. 1, available from: www.city-journal.org/html/12_1_dont_mess.html, accessed January 8, 2002.
179Turner and Main, “Work Experience Under Welfare Reform,” p. 291.
180Turner and Main, “Work Experience Under Welfare Reform,” pp. 303-304.
181Brock, Butler, and Long, Unpaid Work Experience for Welfare Recipients.
182Brock, Butler, and Long, Unpaid Work Experience for Welfare Recipients, p. 32.
183Brock, Butler, and Long, Unpaid Work Experience for Welfare Recipients, p. 33.
72
But why is it more demeaning to rake leaves outside Leaman’s offices than to be sprawledout on one of the benches there, high on drugs—a frequent local sight?178
Building skills. In theory, successful participation in a work experience program shouldincrease confidence, job skills, and employability (even if only through recommendations to use inlooking for a job). As Turner and Main put it, one goal of work experience should be “to increasethe employability of participants by offering opportunities to practice work and to learn the habitsand social skills necessary to succeed in entry-level employment.”179 They report that “privateemployers like to receive attendance information and recommendations from work experiencesupervisors and take them into account.”180 At least some HRA sites provide such information aswell as recommendations about specific participants.
Thomas Brock, David Butler, and David Long of the Manpower Demonstration ResearchCorporation (MDRC) reviewed studies of work experience programs operated by MDRC in themid-1980s in seven states.181 They studied the implementation and operational aspects of theprograms, and, in some states, their impact on employment, earnings, and welfare receipt. Most ofthe programs targeted single mothers receiving Aid to Families with Dependent Children (AFDC),but some also targeted two-parent families receiving AFDC-Unemployed Parent (UP) benefits.Brock, Butler, and Long explain that work experience programs can “help participants gaingeneral work skills and to teach them how to interact with co-workers and supervisors. Thesetypes of skills might be called job-holding skills, in contrast to more specific occupational skills,which are not usually emphasized in these types of programs.”182
The MDRC researchers surveyed the supervisors of Work Experience Program (WEP)participants before and after assignment to a work experience job about participants’ skill levels.Most participants were found to have adequate skills even before beginning their assignment, butthe relatively small group judged to not have sufficient skills at the beginning was found to beperforming adequately at the time of the follow-up interview, indicating that participation in theprogram had improved their skills. Moreover, most recipients themselves responded that they hadlearned new skills, and more than 80 percent believed that their participation “would enhance theiremployability and help them get a decent paying job later.”183

184Demetra Nightingale, director of the Welfare and Training Research Program at the Urban Institute’sHuman Resources Policy Center, conversation with Marie Cohen, December 3, 2001; Seth Diamond, formerdeputy commissioner for Operations, New York City Human Resources Administration, conversation with MarieCohen, December 5, 2001.
185Sharon K. Long, "Welfare Reform at Three Years: The Case of Washington State’s FamilyIndependence Program," The Journal of Human Resources, vol. XXX, no. 4, 1995, pp. 766-790.
186Lawrence M. Mead, Professor of Politics, New York University, Testimony, Before the Committee onFinance of the United States Senate, “The Reauthorization of TANF,” April 10, 2002, available from:http://finance.senate.gov/hearings/testimony/041002lmtest.pdf, accessed March 10, 2003.
73
Not an alternative to work. Providing real work or “real jobs” conflicts, to some extentat least, with the goal of moving recipients off welfare, because positions that provide a goodopportunity to learn skills and work habits might be more attractive to recipients than leavingwelfare.184 For example, the Washington Family Independence Program (FIP), a welfare reformdemonstration that operated between 1988 and 1993, was specifically designed to “humanize”welfare by providing a “client-oriented, supportive environment” that expanded benefits,education and training opportunities, and other services to welfare families. (FIP did not include amandatory work component.) By making welfare more attractive, however, it had the unintendedeffect of increasing welfare caseloads and reducing employment. Sharon Long and DouglasWissoker of the Urban Institute explain:
A likely key factor contributing to higher welfare participation under FIP is the change inthe “culture” of welfare in Washington state among both the FIP clientele and the broadercommunity. This change, combined with the cashing out of food stamps, reduced thestigma associated with assistance, thus increasing the attractiveness of welfare relative towork.185
Similarly, some recipients may become too comfortable with their work experience jobs, therebyincreasing their reliance on welfare, rather than reducing it. Lawrence Mead contends that aproblem with “public employment is that it makes no provision, by itself, for job search to get areal job outside of government.”186 This may be one reason why most of HRA’s WEP assignmentsinclude a job search component.
A proper balance must be achieved between providing real work experience and simplycreating make-work jobs to avoid making Temporary Assistance for Needy Families (TANF)work experience programs a reincarnation of the Comprehensive Employment and Training Act(CETA), which, in too many places, offered nothing more than meaningless, make-work jobs.Nightingale and her colleagues describe the conflicting tensions involved in operating HRA’sprogram:
The reliance on WEP workers can pose challenges for both the host agency and theworkers. Because WEP workers perform useful tasks for the agency, especially tasks that

187Demetra Smith Nightingale, Nancy Pindus, Frederica D. Kramer, John Trutko, Kelly Mikelson, andMichael Egner, Work and Welfare Reform in New York City During the Giuliani Administration: A Study ofProgram Implementation (Washington, D.C.: Urban Institute Labor and Social Policy Center, July 2002), p. 41.
188Jonathan P. Hicks, “First Accord By New York With a Union On Workfare,” New York Times,December 15, 1994, p. B3.
74
may be critical but burdensome or undesirable to regular staff (e.g., clerical filing, pickingup trash in public parks), there is a potential conflict between the interests of the hostagency to keep participants engaged in productive WEP assignments versus transitioningparticipants into permanent wage-paying employment. As one administrator noted, “. . . itis a really good supervisor who can look beyond (his) own needs.” WEP workers can alsobecome resentful that they are working alongside regular employees, and yet not receivingregular pay or fringe benefits. On the other hand, some participants might get toocomfortable in work assignments, particularly if they have little or no prior workexperience and see no other options. Guidelines for the maximum duration of WEPassignments vary across WEP sites—typically ranging from six months to one year(though worksite staff also report that the limitation is not consistently monitored orenforced).187
Displacement
The more realistic the work assignment, the more likely it is that the job will raise thespecter of worker displacement (i.e., the substitution of regular employees with welfarerecipients). In fact, the city government and HRA have been criticized for allegedly using WEP toeliminate well-paid union jobs and replace them with poorly paid welfare recipients. As HRA’sWEP grew, so did union complaints about worker displacement.
Agreements with unions. From the beginning of the Giuliani administration in 1994,relations with public employee unions have influenced the development and implementation ofWEP. When the city administration was planning the WEP program, it assured the publicemployee unions that no displacement would occur and it entered into negotiations with the keypublic employee unions to gain their support
In December 1994, the Giuliani administration reached its first workfare-related agreementwith the city’s largest municipal union, District Council 37 (DC 37). The City was to develop apilot program in which welfare recipients would be assigned to work in low-skilled jobs atschools, such as crossing guard and cafeteria server.188 The expectation, at least on the union’sside, was that as attrition created job openings, welfare recipients could be moved into permanentjobs and become members of the union. Apparently, this did not happen.
Two years later, in 1996, the mayor and DC 37 met and agreed to create a jointcommittee that would meet biweekly to investigate complaints that full-time workers were being

189David Firestone, “Labor Leader Drops Demand On Workfare,” New York Times, September 28, 1996, p.A25.
190Firestone, “Labor Leader Drops Demand On Workfare,” p. A25.
191Firestone, “Labor Leader Drops Demand On Workfare,” p. A25.
192Turner and Main, “Work Experience Under Welfare Reform,” p. 304.
193Steven Greenhouse, “Compromise With Unions On Workfare,” New York Times, August 8, 1997, p. B2.
194Greenhouse, “Compromise With Unions On Workfare,” p. B2.
195James Clark, “New York’s WEP Program,” unpublished paper submitted to Baruch College, CityUniversity of New York, 2001, pp. 56-57.
196Jason Turner, former commissioner, New York City Human Resources Administration, conversationwith Peter Germanis, January 15, 2002.
197Jason Turner, conversation with Peter Germanis, January 15, 2002.
75
displaced by workfare participants.189 After the meeting, Stanley Hill, then the head of DC 37,dropped his call for a moratorium on the growth of workfare, and the mayor pledged to “considerhiring an unspecified number of welfare workers as city employees.”190 Other union leaders,however, were critical of the agreement because no specific guarantees were made to hire acertain number of welfare recipients.191
Claims of displacement continued to be a major point of contention. In August 1997,union complaints led Mayor Giuliani to agree to a “statement of principles,” which remained ineffect for the rest of his administration.192 It stated, in part, that the “city and the union recognizethat no current city employees are intended to be displaced as a result of WEP assignmentsthrough the loss of job or position, reduction of wages and benefits or infringement ofpromotional opportunities.”193 The statement also said that welfare recipients should be allowedto apply for all city job openings, that the city could take money earmarked for welfare benefitsand apply it to training for workfare participants, and that workfare participants should receiveadequate health and safety protections.194 The City and the unions agreed that WEP participationshould be encouraged and that they would jointly develop demonstration programs and form ajoint committee that would meet regularly to discuss welfare reform issues.195 In addition,supervisors were to be paid extra to supervise WEP participants.
These agreements were apparently facilitated by the fact that public employee layoffsseemed possible due to budget cuts. The Mayor promised that there would be no layoffs (in atleast some areas of DC 37 membership) if the union agreed to an expanded WEP program.196
Thus, in major aspects, WEP seems to have been expanded in exchange for a no-layoff pledge.197
198Nina Bernstein, “As Welfare Comes to an End, So Do the Jobs,” New York Times, December 17, 2001,p. A1, reporting that of 9,509 people sent for WEP placements in the city’s subway system since December 1999,about 4,400 actually showed up, and 301 were hired.
199Seth Diamond, former deputy commissioner for Operations, New York City Human ResourcesAdministration, conversation with Marie Cohen, November 21, 2001.
200Maurice Emsellem, “Statement of the National Employment Law Project, Hearing Before theSubcommittee on Human Resources, Committee on Ways and Means, U.S. House of Representatives, April 3,2001,” p. 3, available from: www.nelp.org/pub68.pdf, accessed February 14, 2003.
201“Testimony of Lee Saunders, Executive Assistant to the President of the American Federation of State,County and Municipal Employees (AFSCME), On Welfare Reform Reauthorization Proposals, Before theSubcommittee on Human Resources, Committee on Ways and Means, U.S. House of Representatives, April 11,
76
As noted, a vague promise to hire WEP participants repeatedly appears in the give andtake between the city and union officials. At least as of 2001, however, HRA officials did not seeWEP as an avenue to municipal jobs for welfare recipients. At that time, they reported that fewWEP participants were hired into permanent jobs by the agencies where they were placed,198 andthey stressed that such permanent hiring was not an aim of the program. Rather, they expressedthe hope that participants would find private sector jobs.199
Only attrition? Throughout this multiyear process, the union’s basic complaint was thatthe city was using welfare recipients to displace more highly paid union members, although doingso would have been against New York State law. The unions, however, could not establish adirect or clear causal link between employee layoffs and the substitution of welfare recipients.Instead, they pointed to the decline in the paid workforce in an agency and the growth of theworkfare workers. For example, Maurice Emsellem, director of Public Policy with the NationalEmployment Law Project, cited the fact that the number of Parks Department workers droppeddramatically between 1993 and 1998 while the number of WEP workers increased.200
Lee Saunders, executive assistant to the president of the American Federation of State,County and Municipal Employees (AFSCME), explains the displacement concerns of unionworkers:
AFSCME’s affiliate, District Council 37, filed five separate lawsuits alleging displacementviolations under the New York State social services law, which was amended to providefor substantially stronger non-displacement protections than the weak provisions in thefederal law. Among other things, these lawsuits documented an 85 percent staff reductionfrom 136 to 24 custodial assistants in the City’s welfare offices while hundreds of WEPworkers were assigned to clean the offices. Another City agency lost 274 custodianpositions out of a total of 389 positions over a six-year period. In Orchard Beach Park,there were over 60 employees in 1996, yet by the summer of 1999 only about 12-13 cityworkers were left. Even so, there were still over 60 people working in the Park. The restwere WEP workers.201

2002,” available from: www.afscme.org/action/sr020411.htm, accessed February 18, 2003.
202“Testimony of Lee Saunders, On Welfare Reform Reauthorization Proposals, Before the Subcommitteeon Human Resources, Committee on Ways and Means, U.S. House of Representatives
203Steven Greenhouse, “Manhattan: Workfare Agreement,” in Anthony Ramirez, “Metro Briefing,” NewYork Times, June 9, 2000, p. B4.
204Robert Polner, “Fighting To Keep Parks Jobs,” Newsday, January 17, 2002, p. A28.
205Turner and Main, “Work Experience Under Welfare Reform,” p. 304.
206Seth Diamond, conversation with Marie Cohen, December 5, 2001.
207Seth Diamond, conversation with Marie Cohen, December 5, 2001.
77
Several lawsuits, some of which are still pending, have alleged displacement of public employeesby welfare recipients, which is prohibited under federal law.202 In June 2000, for example, theGiuliani administration hired 27 carpenters and painters to settle a lawsuit (which was brought bythe unions representing municipal workers) charging the city with using workfare workers todisplace city employee. The city admitted no wrongdoing in the settlement,203 but other lawsuitsbrought by DC 37 continued.204
In response, New York City has steadfastly denied that any displacement was takingplace.205 The City has argued that it did not fire union workers and replace them with WEPparticipants; instead, it has let attrition take its course, and WEP workers have performed thework that was formerly provided by the workers who left the agency and were not going to bereplaced.206 (In other words, WEP participants did not displace public sector workers, becausethey performed work that otherwise would not have been performed.) In an interview, SethDiamond, former HRA deputy commissioner for operations, explained, “If you definedisplacement as actually firing workers and replacing them with WEP workers, then it is nothappening, but others have argued displacement is really letting attrition take its course and notreplacing people.”207
That would be in keeping with federal rules. The federal TANF rules governingdisplacement are as follows:
In general, an adult in a family receiving IV-A assistance may fill a work vacancy.However, no adult in a Title IV-A work activity shall be employed or assigned whenanother person is on layoff from the same or a substantially equivalent job, or when theemployer has terminated the employment of a regular worker or otherwise caused aninvoluntary reduction of its workforce in order to fill the vacancy thus created with asubsidized worker. This provision does not preempt or supersede any State or local lawproviding greater protection from displacement. . . . States must establish and maintain a

208U.S. House of Representatives, Personal Responsibility and Work Opportunity Reconciliation Act of1996: Conference Report (Washington, D.C., U.S. House of Representatives, Report 104-725, July 30, 1996), pp.282-283.
209Robert Lerman and Eric Rosenberg, The Benefits and Costs of New York City Workfare (unpublishedpaper, January 2, 1997), pp. 15-16.
210David T. Ellwood and Elizabeth D. Welty, Public Service Employment and Mandatory Work: A PolicyWhose Time Has Come and Gone and Come Again? (Cambridge, MA: Harvard University, March 1999), p. 15,available from: www.jcpr.org/wpfiles/ellwood-welty.pdf, accessed January 4, 2002.
211Ellwood and Welty, Public Service Employment and Mandatory Work, p. 15.
212Ellwood and Welty, Public Service Employment and Mandatory Work, p. 15.
213Ian Fisher, “Giuliani Drops Workfare Jobs At the Hospitals,” New York Times, April 24, 1998, p. A1.See generally James Clark, “New York’s WEP Program,” unpublished paper submitted to Baruch College, City
78
grievance procedure, including hearing opportunity, for resolving complaints andproviding remedies for violations.208
Robert Lerman and Eric Rosenberg of the Urban Institute, based on a mid-1990s surveyof twenty-two worksite managers (when WEP participants were mostly Home Relief recipients)and reports from various union officials, conclude that “[a]lthough some WEP labor apparently isreplacing unionized city labor excised by budget cuts, most of the WEP workers aresupplementary laborers. They perform tasks on a daily basis that were previously done perhapsonce a week or once a month.”209
David Ellwood and Elizabeth Welty of Harvard also studied displacement in New YorkCity. According to them, “at least some displacement is occurring,” but it is not clear whetherthey are simply referring to the fact that many WEP workers are replacing workers whosepositions had been eliminated though attrition.210 This statement seems based on anecdotalevidence and data showing a decline of city workers in some departments along with an increasein WEP participants. They are, therefore, careful to add that “there are no rigorous attempts tomeasure the extent of substitution”211 and that “ because the city was seeking to cut backemployment anyway, the statement of one administrator is also true in many cases: ‘They’re[WEP workers are] saving this agency.’”212
The independent evidence that is available to us indicates that the city has largely (if notentirely) used attrition to create workfare slots. Little evidence supports a direct substitution, andwhat substitution may have taken place seems hopelessly entangled with the layoffs the city wentthrough during much of this period.
An example of how murky the issue of displacement can be in regard to layoffs versusattrition is illustrated by what happened in the city’s public hospitals.213 In April 1998, when the

University of New York, 2001, pp. 56-57.
214Robert D. McFadden, “Union Chief Calls Workfare ‘Slavery’,” New York Times, April 19, 1998, p. 37.
215Steven Greenhouse, “Many Participants in Workfare Take the Place of City Workers,” New York Times,April 13, 1998, p. A1.
216Greenhouse, “Many Participants in Workfare Take the Place of City Workers,” p. A1.
217Steven Greenhouse, “Layoffs Rupture Tie Between Giuliani and Labor Leader,” New York Times, April25, 1998, p. B1.
218As of March 26, 1996, there were 743 WEP participants assigned to the Health and HospitalsCorporation. [Nightingale, Pindus, Kramer, Trutko, Mikelson, and Egner, Work and Welfare Reform in New YorkCity During the Giuliani Administration, p. 40.]
219See also Ian Fisher, “Giuliani Drops Workfare Jobs At the Hospitals,” p. A1; and Steven Greenhouse,“Union’s Tactics Questioned in Failed Deal,” New York Times, May 20, 1998, p. B5.
79
Giuliani administration attempted to lay off about 900 of the city’s 35,000 public hospitalworkers, a similar number of WEP participants were already working in the hospitals, so theunion filed a lawsuit alleging that WEP workers were replacing union workers.214
DC 37’s Hill accused Giuliani of violating the state law against displacement of cityworkers by workfare participants, the promise of training applicable to other jobs for 34,000workfare workers, and a promise to use all other available options before laying off hospitalworkers. Sarah Kennedy, executive vice president of the hospital workers local, asserted thatmore than 500 WEP workers were doing work once performed by some of the 1,000 employeesthat were laid off in 1996.215 Referring to 1996 and the pending layoff of 800 more workers in1988, she added, “This is a way to bust the union. They’re trying to use slave labor.”216
The City denied all the allegations217 and claimed that the reduction in the number ofworkers was in response to a decline in the bed occupancy and that the increase in WEP workerswas a result of that program’s growth.218 In any event, the city withdrew all the WEP workers,but it also laid off 600 hospital workers.219
Compliance with federal law, however, may no longer be sufficient in New York. In 1997,the displacement provisions in state law were broadened so that a recipient may not be assigned toa workfare position (in a private as well as public agency or firm) if, in the words of the statute,the result would be:
(a) the displacement of any currently employed worker or loss of position (includingpartial displacement such as reduction in the hours of non-overtime work, wages oremployment benefits) or result in the impairment of existing contracts for services orcollective bargaining agreements;

220See New York State Department of Labor, “Section 1300.9: Work Activities and Work Requirements,”pp. 9-8 and 9-9, available from: www.labor.state.ny.us/pdf/13009.pdf, accessed February 3, 2003 (emphasisadded).
221Nightingale, Pindus, Kramer, Trutko, Mikelson, and Egner, Work and Welfare Reform in New YorkCity During the Giuliani Administration, p. 39 and 41.
80
(b) the assignment of a participant or the filling of a position when any other person is onlayoff from the same or any equivalent position or the employer has terminated theemployment of any regular employee or otherwise reduced its workforce with the effect offilling the vacancy so created with a participant assigned pursuant to this section;
(c) any infringement of the promotional opportunities of any current employed person;
(d) the performance, by such participant, of a substantial portion of the work ordinarilyand actually performed by regular employees; or
(e) the loss of a bargaining unit position as a result of work experience participantsperforming, in part or in whole, the work normally performed by the employee in suchposition;
(f) such assignment is not at any work site at which the regular employees are on a legalstrike against the employer or are being subjected to lock out by the employer.”220
Clearly, a full-time WEP assignment would have difficulty meeting these restrictions: Inmany—perhaps most—sites, recipients performed “a substantial portion of the work ordinarilyand actually performed by regular employees” and the result was probably “the loss of abargaining unit position.” As Nightingale and her colleagues write:
WEP slots represent an important portion of the workforce of several of the City’sagencies. For example, a Parks Department administrator indicated that participants inWEP have accounted for up to about 20 percent of that agency’s maintenance staff. TheParks Department credits, in part, the presence of the WEP workers for the markedimprovement in its internal ratings for the cleanliness of the City’s public parks. WEPparticipants work side-by-side with regular Parks Department maintenance staff, althoughWEP workers are distinguishable by their uniforms.221
Only the fact that WEP is now on the “three-plus-two” schedule, discussed in the next section,would seem to make it feasible (and legal) under New York State law.

222“Subsidized employment” (either public or private) is so rare that it need not be discussed here.
223First the Clinton Administration and now the Bush Administration have helped muddy the waters byrepeatedly reporting that large percentages of welfare recipients were “working,” which suggested to many thatthey were in work experience programs, when, in fact, the vast majority were taking advantage of expandedearnings disregards to combine work and welfare.
224In addition, time limits, family caps, and other benefit restrictions have reduced the value of welfare,also making work relatively more attractive.
81
VI. “UNSUBSIDIZED EMPLOYMENT”
The problems with creating workfare-type assignments make all the more important theother major type of work experience under welfare reform: unsubsidized employment.222 InNovember 2001, about 26 percent of engaged adults were combining work and welfare (in largepart because of the newly generous earnings disregards described above). Temporary Assistancefor Needy Families (TANF) regulations call this “unsubsidized employment,” but that clearly is amisnomer because the families continue to receive welfare payments, which can be a substantialportion of their original grants.223
Earnings Disregards
Under Aid to Families with Dependent Children (AFDC), the federal government set whatis called the “earnings disregard,” that is, the amount that a recipient could earn without areduction in the welfare grant. For all practical purposes, the AFDC earnings disregard waslimited to the first $90 in earnings, after which benefits were reduced dollar-for-dollar as earningsincreased—a 100 percent marginal tax rate. As a result, few welfare mothers would gainfinancially if they worked without earning enough to leave welfare.
TANF, however, allows individual states to set the amount of their own earningsdisregards, and most states have greatly liberalized them. Since the mid-1990s, most states havetried to increase incentives to work by disregarding a larger portion of earnings when determininga recipient’s benefit or by providing an additional earnings-related income supplement.224 Indeed,twenty-two states (comprising about 60 percent of the national caseload) disregard at least 50percent of earnings in computing benefits (two states disregard all earnings up to the poverty levelfor a limited period).
In 1997 New York State expanded the earned income disregard in its Family Assistance(FA) program to allow families to remain eligible until their gross income reaches the povertylevel (about $14,250 for a family of three in 2001). In that first year, the disregard was $90 plus42 percent of the remainder of the family’s monthly earned income. By 2002, as a result of

225U.S. Department of Health and Human Services, Office of Planning, Research, and Evaluation,Temporary Assistance for Needy Families (TANF) Program: Fifth Annual Report to Congress (Washington, D.C.:U.S. Department of Health and Human Services, February 2003), p. X–230, available from:www.acf.dhhs.gov/programs/ofa/annualreport5/, accessed March 15, 2003. A number of states started receivingwaivers to expand earnings disregards beginning in the early 1990s, several years before the 1996 welfare reformlaw.
226See U.S. Department of Health and Human Services, Temporary Assistance for Needy Families (TANF)Program: Fifth Annual Report to Congress, p. X–244. Unlike most other statements of work effort among TANFrecipients, our calculation includes child-only cases in the denominator, because about half of these cases haveparents present in the home. A measure that focuses on just adults receiving assistance exaggerates the increase inwork, because it ignores the growth in the number of adults who do not receive assistance because they have beensanctioned, or are ineligible due to the receipt of disability benefits or their noncitizen status. If one does notinclude these groups in the calculation, it appears that the percent working rose more than it actually did.
82
inflation-related increases in the Federal Poverty Guidelines, the percentage of income disregardedhad increased to 50 percent of the family’s grant.
Combining Work and Welfare
As the disregard increased, so did the number of families combining work and welfare.Between November 1996 (before the expanded disregard went into effect) and November 1999,the number of FA cases combining work and welfare tripled, increasing from 11,005 to 30,199(or from 10 percent to 21 percent of the engageable caseload). By November 2001, the number ofsuch cases had fallen to 25,106, but they represented an even larger share of the engageablecaseload (26 percent).
This rapid increase reflected a national trend, which also was associated with increases inthe disregard in other states. Nationally, the proportion of TANF adults combining paid work andwelfare increased steadily and substantially, rising from 7 percent in 1992 to 27 percent in 2001.225
Counting child-only cases, the proportion of recipient families in which an adult combined workand welfare more than doubled from about 8 percent in 1994 to about 16 percent in 2001.226
In December 1999, about 20 percent of adults on the New York City caseload were inunsubsidized employment, about the same proportion as statewide (see table 1). This proportion,however, was below the 24 percent nationwide average and considerably lower than in somestates, such as Illinois and Michigan, where about 40 percent of adults were combining work andwelfare.

83
Figure 8. Engageable Family Assistance Cases,Engagement Status, December 1999
Work Experience
Program16% Combining
work/welfare22%
Education andtraining 7%
In sanction process
37%
In engagement process
12%
Community service/“needed at home” 6%
Substance abusetreatment 1%
Source: New York City Human Resources Administration, “PA — Weekly CaseloadEngagement Status” (New York: New York City Human Resources Administration,December 1999).
Figure 9. Engageable Safety Net Assistance Cases,Engagement Status, December 1999
Work Experience
Program32%
Combining work/welfare4%
Education and training 2%
In sanction process14%
In engagement process
22%
Community service/“needed at home” 4%
Substance abusetreatment
23%
Source: New York City Human Resources Administration, “PA — Weekly CaseloadEngagement Status” (New York: New York City Human Resources Administration,December 1999).

227Jason Turner, former commissioner, New York City Human Resources Administration, conversationwith Peter Germanis, January 15, 2002.
228See, e.g., Rob Schneider, “Up to 35,000 families may see cash aid cut,” The Indianapolis Star, January17, 2003, available from: www.indystar.com/print/articles/1/016198-2901-009.html, accessed January 21, 2003.
84
The increase in recipients combining work and welfare raises various issues. First, becauseunsubsidized employment is counted as a work activity for federal participation purposes, itreduces the need to establish and operate other work-related activities. Recipients combiningwork and welfare are not required to spend as much time in work-related activities; part-timework of twenty hours or more per week is generally sufficient to excuse a recipient from anyfurther program requirements.227
Second, an expanded disregard (with no time limit on receiving) probably results in higherwelfare caseloads and costs than otherwise. In a weakened economy, if caseloads begin to rise,New York and other states may reassess their earnings disregard policies and explore otheroptions to minimize their cost.228
Third, expanded earnings disregards increase disposable family income by allowingfamilies to combine earnings with welfare receipt. However, they also increase the likelihood thatrecipients will stay on welfare and thereby more quickly exhaust their time-limited benefits whilereceiving the reduced grants. Such recipients face an increased possibility that they will not haveaccess to benefits in future years, when they may need them more, perhaps due to a job loss. InNew York State, of course, the availability of the Safety Net Assistance program minimizes thisconcern, because there is essentially no real time limit.

229See U.S. General Accounting Office, Welfare Reform: Moving Hard-to-Employ Recipients into theWorkforce (Washington, D.C.: U.S. General Accounting Office, March 2001, GAO 01-368), p. 32, available from:www.gao.gov/cgi-bin/fetchrpt?rptno=GAO-01-368, accessed September 19, 2001, stating that “limiting workactivities to those that count for federal participation rate purposes makes it more difficult to prepare hard-toemploy TANF recipients for employment.”
230Seth Diamond, former deputy commissioner for Operations, New York City’s Human ResourcesAdministration, conversation with Marie Cohen, December 20, 2001. See also Leslie Kaufman, “New York SaysThose on Welfare Are Increasingly Hard to Employ,” New York Times, November 29, 2002.
231Demetra Smith Nightingale, Nancy Pindus, Frederica D. Kramer, John Trutko, Kelly Mikelson, andMichael Egner, Work and Welfare Reform in New York City During the Giuliani Administration: A Study ofProgram Implementation (Washington, D.C.: Urban Institute Labor and Social Policy Center, July 2002), pp.56–57.
232See the discussion: “Enhanced WEP.”
85
VII. EDUCATION AND TREATMENT ACTIVITIES
To get and keep a job, some welfare recipients may need more intensive help than justwork first and work experience. They may have very low job skills, physical and mental healthproblems (including substance abuse), or other disabilities that limit their employability or reducetheir ability to work.229 Human Resources Administration (HRA) officials believe that because ofthe large decline in the welfare rolls, the remaining caseload has a higher proportion of peoplewho have severe barriers to employment and who need additional services to supplement thework experience.230
Hence, HRA has expended considerable energy and funding to develop education andtreatment programs. By around mid 2000, almost all welfare cases engaged in mandatoryactivities were spending at least fifteen hours per week in an activity designed to address specificbarriers to employment. Some recipients were spending as many as thirty-five hours per week insuch activities. According to Nightingale and her colleagues at the Urban Institute, “The specialprograms have been designed to combine the strong work-requirement aspects of welfare reformwith the recognition that some specific groups are likely to require substantial services and specialinterventions if they are to become employable.”231
Some of the programs that HRA developed, such as the Division of Parks andRecreation’s Parks Career Training (PACT) program232 use an integrated model in which workexperience and remedial services are provided at one site. City officials believe that thisintegration significantly increases program effectiveness because of the synergy created bycombining different activities and the reduced likelihood of “losing” people between activities.
233See the discussion: “Current WEP.”
234City of New York, Human Resources Administration, Ladders to Success: Innovations in CityGovernment (New York: Human Resources Administration, 2000), p. 15.
235Testimony of Seth Diamond, executive deputy commissioner Family Independence, AdministrationHuman Resources Administration, before the City Council Committee on general welfare “Intro 93: Education andTraining for Public Assistance Recipients,” available from: www.nyc.gov/html/hra/html/news_press4_18_02.html,accessed February 18, 2003.
86
The other reason for expanding education and treatment services seems to have been toincrease the number of hours of required participation without running afoul of minimum wagerules233 and without aggravating complaints about displacement.
Required Participation
HRA provides education and treatment services in two ways: (1) As part of the WorkExperience Program (WEP), in which recipients are assigned to fifteen hours per week ineducation or treatment activities (“with a continuous job search component”)234 in addition totwenty hours per week in a work assignment, or (2) separately from WEP, when recipients arejudged to have such serious problems that they cannot participate in work experience. Theserecipients are assigned directly to full-time participation in education or treatment activities; theyundergo regular review period and are expected to move on to the “normal” work-trainingtreatment regime with continuous job search.
WEP with education and treatment activities. Initially, WEP alone (often called “basicWEP” or “WEP basic”) was the primary mandatory activity. Beginning in 1999, however, HRAgradually expanded its menu of mandatory activities to include a larger number of education andtreatment services designed to make recipients more employable. By the middle of 2000, almostall WEP participants were also required to participate in a concurrent education or treatmentactivity. Seth Diamond, executive deputy commissioner of the Family IndependenceAdministration and former deputy commissioner for HRA operations, describes the rationale forcombining WEP with other activities:
[W]e believe that education alone is not the answer, just as work alone is not the answer.Our own experience and the experience of other jurisdictions across the country suggest amore balanced approach would be most beneficial. In recent years, we have developed abalanced approach that seeks ways to combine education and training with work in anintegrated program that provides targeted services people need to get off welfare.235
Thus, WEP is now typically combined with other education, training, and job searchactivities designed to help recipients achieve self-sufficiency. As of this writing, most WEPparticipants (in both FA and SNA) are in the “three-plus-two” model of activity; that is, theyspend three days per week (twenty hours) in WEP and two days (fifteen hours) in education or

236Nightingale, Pindus, Kramer, Trutko, Mikelson, and Egner, Work and Welfare Reform in New YorkCity During the Giuliani Administration, p. iv, stating: “In the last week of November 2000, about 25,000 personswere in WEP assignments, but only about 25 percent of those were in basic WEP. The other 75 percent were inWEP assignments that combined work experience with some other activity such as job readiness services,short-term training, or education—usually three days per week of work experience or workfare (21 hours) plus twodays of some other activity (14 hours). This is often referred to as the “three-plus-two” model for full-time activity,defined as 35 hours per week. In comparison, in the first week of April 1999, nearly 90 percent of WEPassignments had been of the basic workfare type.”
237Nightingale, Pindus, Kramer, Trutko, Mikelson, and Egner, Work and Welfare Reform in New YorkCity During the Giuliani Administration, p. 56.
87
treatment activities.236 The basic WEP cases consisted primarily of those who stoppedparticipating in their concurrent assignment but did not drop out of WEP. Some cases may alsoinvolve situations in which individuals are between concurrent assignments.
• For FA, most WEP participants now combine work experience with other activities.Between April 1999 and November 2001, the percentage of FA WEP participants alsoparticipating in other activities increased from 18 percent (2,271 cases) to 87 percent(8,796 cases). Moreover, in April 1999, 98 percent of the cases combining WEP withanother activity were in job search. By November 2001, the percentage in job search haddropped to 30 percent; instead, 32 percent were combining WEP with the Personal Roadsfor Individual Development and Employment (PRIDE) program (discussed below) and 23percent were combining WEP with the Begin Employment Gain Independence Now(BEGIN) program. (Smaller percentages were mixing WEP with various substance abusetreatment or training activities.) This shift in emphasis happened because HRA officialsbelieved that recipients could benefit from ancillary services while maintaining a strongemphasis on work.
• For SNA, although it serves a very different population from that of FA (primarily singleadults), a similar shift in the mixture of services provided to WEP participants occurred.Between April 1999 and November 2001, the percentage of SNA WEP participants inother activities increased from 14 percent (2,199 cases) to 90 percent (6,383 cases). Aswith FA, the mixture of activities shifted. In April 1999, about 75 percent of the casescombining WEP with another activity were in substance abuse treatment and theremaining 25 percent were in job search. By November 2001, this range of activities hadexpanded: 48 percent of cases participated in PRIDE, 42 percent in job search, 6 percentin substance abuse treatment, and the remainder in various other activities.
Three-plus-two. Only a few exceptions are made in the formula for work and educationor treatment activities. “The same ‘three-plus-two’ model is used in nearly all theprograms—three days of work or WEP plus two days of some other service or intervention,”237
report Nightingale and her colleagues. They continue:

238Nightingale, Pindus, Kramer, Trutko, Mikelson, and Egner, Work and Welfare Reform in New YorkCity During the Giuliani Administration, pp. 56–57.
239Hugh O’Neill, Kathryn Garcia, Virginie Amerlynck, and Barbara Blum, Policies Affecting New YorkCity’s Low-Income Families (New York, NY: Research Forum on Families, Children, and the New Federalism,October 2001), pp. 70-71, available from: www.nccp.org/policies/NYCrep.pdf, accessed January 3, 2003.
88
In discussions with HRA staff, Job Center staff, vendor staff, and communityrepresentatives, there is general support for special programs. The main concerns raisedrelated to the distance some individuals had to travel to the lower-Manhattan SpecialNeeds Job Center, where many of the programs are housed, and the difficulty somecontractors have had reconciling the work requirement procedures and sanctioningprocess with their mainstream activities such as education or substance abuse treatment.There is no doubt that employment and compliance with the work requirements areHRA’s top priority in these programs, just as it is in the HRA local Job Centers and theregular SAP [Skills Assessment and Placement] and ESP [Employment ServicesPlacement].238
Some observers, however, have called for greater flexibility in the combination of workexperience and education and treatment services. For example, Hugh O’Neill, president ofAppleseed, a New York City-based consulting firm, and his colleagues argue that programadministrators should have more flexibility in the number of hours recipients are assigned to each:
[T]he Human Resources Administration should consider adopting a more flexibleapproach to the definition of full engagement. Employment service and placementcontractors could be given authority to vary the mix of training and work experience inwhich participants are engaged. Some participants, for example, might benefit more in thelong run if for six to 12 months they could combine 10 to 12 hours a week of workexperience with more intensive English language and literacy instruction. Others whoalready have solid basic skills, and perhaps some work experience, might be able to moveinto higher-paying jobs, with greater potential for advancement, if they could spendseveral months in full-time vocational training.
The city could consider developing an alternative definition of “full engagement” forparents with very young children. Mothers with children between the ages of three and 12months, for example, could have the option of limiting their participation to 20 hours perweek.239
The Task Force for Sensible Welfare Reform has made a similar recommendation:
The potential for New York to be a laboratory for understanding the implementation andeffectiveness of work experience on a large scale, including the value that may be derivedfrom the work performed, has clearly yet to be realized.

240New School University, Robert J. Milano Graduate School of Management and Urban Policy, WelfareReform in New York: A Report on Implementation Issues in New York City (New York: New School University,Task Force on Sensible Welfare Reform, January 1999), p. 14.
241Testimony of Seth Diamond, “Intro 93: Education and Training for Public Assistance Recipients.”
89
A major assumption of the City’s initiative, and a parallel concern of service providers andprogram analysts, is that 20 hours of WEP is the appropriate program experience for allwelfare recipients, regardless of their skills, work related problems or life circumstance.This “one size fits all” approach is especially problematic for the harder to serveindividuals on the caseload who may need more individualized schedules and supports.240
The data available provide no objective way to judge such recommendations. On the onehand, the requirement is relatively rigid. On the other hand, without a rigid rule, the programcould be a nightmare to administer. Moreover, as described next, recipients needing more servicespresumably would have been assigned to them directly as part of the Job Opportunity Specialists(JOS) process rather than as part of WEP.
Education and treatment alone. Recipients with severe barriers to employment orspecial needs may be excused from WEP and assigned to other education and treatment activities.Seth Diamond, former HRA deputy commissioner for Operations, explains:
. . . HRA realizes that employment may not be an option right away for clients with specialneeds. We closely review each case, monitor each assessor and assessment, and identifythe best and most appropriate services. HRA provides a range of services for those withsevere barriers to employment. These services are designed to move each person towardsa sense of greater self-sufficiency by providing a continuum of support. This groupincludes chronic chemical abusers, who are referred to treatment centers suited to theirneeds. As they overcome their dependencies, they are integrated into work activities.Victims of domestic violence are assisted in finding safety when unable to remain in theirhomes and communities due to threat of further violence. As appropriate, they areinvolved in work activities that will assist them to free themselves from economicdependency. Those temporarily or permanently mentally and/or physically disabled aretrained for work, when appropriate, and receive medical and rehabilitative care.Immigrants receive English language instruction when cultural and language barriers couldkeep them languishing on the rolls, unable to access services or jobs.241
Vendors’ contracts providing treatment and training services normally include job placementpayments, which are a significant part of the payment and often subsume the cost of training. As aresult, the vendors tend to focus on job search and job placement.
Since at least April 1999, an increasing proportion of engageable Family Assistance (FA)cases has been assigned to full-time education and training or substance abuse treatment. In

242Nightingale, Pindus, Kramer, Trutko, Mikelson, and Egner, Work and Welfare Reform in New YorkCity During the Giuliani Administration, pp. 43–44, stating: “A special HRA Resource Development (RD) officereceives funding from city, state, and federal agencies to design and implement initiatives to serve some specialpopulations, such as students in college. Parallel to the administrative reorganization discussed in Chapter II,offices serving specialized populations were brought under regional management and included within the goal-oriented and work-focused administrative structure serving the general public assistance population.”
243Nightingale, Pindus, Kramer, Trutko, Mikelson, and Egner, Work and Welfare Reform in New YorkCity During the Giuliani Administration, p. 43.
90
contrast, WEP participation declined throughout most of this period. Between April 1999 andNovember 2001, the percentage of engageable FA participants in these activities increased from 8percent (12,113 cases) to 9 percent (8,390 cases). Between April 1999 and December 1999, thepercentage in WEP rose from 11 percent (17,862 cases) to 16 percent (21,933 cases), but it haddropped back to 11 percent (10,127 cases) by November 2001.
A similar trend is evident in Safety Net Assistance (SNA) cases. Between April 1999 andNovember 2001, the proportion of engageable SNA participants in these activities increased from20 percent (12,074 cases) to 38 percent (14,488 cases), and the percentage in WEP fell from 27percent (16,219 cases) to 19 percent (7,110 cases). About 80 percent of SNA participants were insome form of substance abuse treatment throughout this two-and-a-half year period.
Education and Treatment Activities
HRA made a major effort to develop and provide education and treatment services.242
Nightingale and her colleagues write:
Several work initiatives serve recipients with special needs. Some programs operate inconjunction with HRA’s ESP and WEP programs, and some operate separately withfunding from other sources. Some of the programs have been operating for over a decade,while others were only recently developed. They all, however, maintain the same HRAwork-centered policies, although blending in work with education, special services, ortreatment.243
The major activities include education and treatment services for those with limited English orreading skills, those with physical or mental disabilities, those who are pregnant or who have achild under three months old, those who have a substance abuse problem, those who are sufferingfrom AIDS, those who are victims of domestic violence, those who are age fifty-five and older,veterans, caretaker relative cases, dropouts, and those who are in the criminal justice system. Inaddition, recipients may attend college, either as part of WEP or separately.
Limited English or reading skills. Welfare recipients who read English at the sixth-gradelevel or below are often placed in BEGIN, a program that seeks to give recipients immediatework experience while providing remedial education. Recipients are generally sent to BEGIN by

244Georgia Salley, executive director, BEGIN Managed Programs, conversation with Marie Cohen,November 13, 2001.
245Marcia Salovitz, director, PRIDE, conversation with Marie Cohen, November 13, 2001.
246Marcia Salovitz, conversation with Marie Cohen, November 13, 2001; Marcia Salovitz, “PRIDE:Personal Roads for Individual Development and Employment: A Focus on Rehabilitation,” Power Pointpresentation provided by Ms. Salovitz, November 13, 2001.
91
their HRA case manager. BEGIN generally provides three days of WEP and two days ofclassroom education in Adult Basic Education, GED, or English language instruction per week.Late in 2001, BEGIN also had eight sites that combined work experience with related vocationaltraining, and HRA was planning to add six more sites by April 1, 2002.244 In essence, BEGINoffers more extensive educational and training opportunities for participants than is available forother WEP participants to accommodate their limited reading and language skills. BEGIN’s“worksite teachers” maintain contact with the worksite supervisors, thereby facilitatingcoordination between the classroom and the worksite. The program also has job developers, jobcoaches, and counselors. Worksites include government agencies, nonprofits, and even for-profitcompanies. Participants are usually in BEGIN for six months, and participation may last for up toone year for those who are the least literate or do not speak English.
As of November 2001, a total of 2,058 FA recipients were participating in WEP andBEGIN (about 2 percent of the engageable caseload), representing more than 20 percent of all FAWEP participants. BEGIN does not serve SNA recipients. The program has not been evaluated.
Disability. Created in July 1999, PRIDE is HRA’s program for FA and SNA recipientswith physical or mental disabilities who, in the past, would have been exempt from required workactivities. The program provides vocational rehabilitation, work experience, and case managementservices for recipients with physical or medical limitations that prevent participation in regularWEP but are not serious enough to qualify them for the Social Security Disability Insurance(SSDI) or Supplemental Security Income (SSI) programs. Health Services Systems, thecontractor that assesses Public Assistance applicants and recipients for work-limiting disabilities,refers those determined to be employable with limitations to PRIDE.
In 2001, about a third of PRIDE participants had orthopedic impairments, a third hadcardiac or respiratory problems, and a third had mental limitations. Many had educational needs aswell.245 The program reflects the growing belief (reflected, for example, in legislation such as theAmericans with Disabilities Act) that many people with disabilities can work as long as the tasksto which they are assigned are appropriate for their condition.246 According to Jason Turner,
A work experience program which aspires to have close to universal applicability mustalso have an inventory of assignments suitable for participants of varying ability levels.Both New York City and Wisconsin provide for a “ladder” of work options which providereal work for adults with all levels of experience and job readiness. Standard work

247Jason A. Turner, commissioner, New York City Human Resources Administration, Testimony, Beforethe Subcommittee on Human Resources, Committee on Ways and Means, U.S. House of Representatives, Hearingon Welfare Reform and Work, April 3, 2001, available from:http://waysandmeans.house.gov/humres/107cong/4-3-01/4-3turn.htm, accessed December 12, 2002.
248Salovitz, “PRIDE: Personal Roads for Individual Development and Employment: A Focus onRehabilitation,” Power Point presentation.
249Marcia Salovitz, conversation with Marie Cohen November 13, 2001; Marcia Salovitz, “PRIDE:Personal Roads for Individual Development and Employment: A Focus on Rehabilitation,” Power Pointpresentation.
92
assignments range from outdoor physical work to office jobs in government or non-profitagencies. For adults with mild disabilities, vocational rehabilitation agencies such asGoodwill can provide work in specialized settings.247
All recipients referred to PRIDE are assigned an HRA case manager who discusses therecipient’s medical history, medical limitations, other barriers to work, skills and abilities, self-sufficiency goals, and how PRIDE can help. The recipient then receives a “comprehensiveassessment that includes gathering additional medical, social, and psychiatric information as wellas determining reading and math achievement levels.”248 Based on the assessment, the recipient isplaced in one of three “tracks.” Those who are deemed to be possibly eligible for SSI or SSDIbenefits are referred to one of six Independent Living Centers, where they receive assistance inapplying for benefits.
Of the remaining recipients, those who meet state eligibility criteria for vocationalrehabilitation services are assigned to the “Work/Education/Training Track.” They are assigned tothe New York State Education Department’s Office for Vocational Educational Services forIndividuals with Disabilities (VESID). Each recipient is assigned a VESID counselor and initiallyspends at least twenty-five hours per week in a combination of specialized WEP assignmentstailored to meet their needs and job counseling, training, and placement services. The goal is toincrease participation to twenty hours of work experience and fifteen hours of training per weekwhen the participant is ready. Participation in this track is for sixty-five working days, which canbe extended for another sixty-five days for participants who are considered to need more time.
Recipients that are determined to have relatively less serious medical conditions areassigned to the “Work-Based Education Track.” They spend twenty hours per week in WEPassignments and the remaining time in education and job preparation and placement activities, fora total of at least thirty-five hours per week for up to one year. PRIDE attempts to placeparticipants in jobs that accommodate their special needs and provides ongoing support toparticipants once they are working.
From its inception through late 2001, PRIDE engaged 11,917 participants in workactivities and placed 1,147 in jobs.249 In November 2001, 2,824 FA recipients were participating

250City of New York, Human Resources Administration, Ladders to Success: Innovations in CityGovernment (New York: Human Resources Administration, 2000), p. 26.
251Nightingale, Pindus, Kramer,Trutko, Mikelson, and Egner, Work and Welfare Reform in New York CityDuring the Giuliani Administration, p. 48.
93
in combined WEP/PRIDE activities (about 3 percent of the engageable caseload), representingabout 28 percent of all FA WEP participants. An even larger number of SNA cases wereparticipating in WEP/PRIDE activities: 3,083 participants (about 8 percent of the engageablecaseload), about 43 percent of all SNA WEP participants.
Manpower Demonstration Research Corporation (MDRC) began conducting a randomassignment evaluation of the PRIDE program in December 2001. Those assigned to theexperimental group are required to participate in PRIDE and can be sanctioned for failure tocomply with the program’s requirements. Participants assigned to the control group are notrequired to participate in work activities, unless their disability status changes, but they do receivecase management services for their medical needs. Findings are not expected for some time.
Pregnancy. The Perfect Opportunity for Individual Skills and Educational Development(POISED) program “combines ‘traditional employment services’ with programs tailored topregnant women and new parents.”250 In the past, most of these women would have been exemptfrom program participation requirements. Demetra Nightingale and her colleagues observe,“Despite the small size of POISED, it represents a philosophical change from the mid-1990’s,when both pregnant women and mothers of young children were exempt from workrequirements.”251 Such women are now required to participate, except for a short period whenthey are exempt, generally from the eighth month of pregnancy until thirteen weeks after delivery.An extended exemption is granted for women with a high-risk pregnancy.
Funded by HRA and operated through the City University of New York (CUNY),POISED combines parenting instruction with employment preparation to help pregnant womenand new mothers move toward becoming more employable. Training may include classes toimprove reading, writing, English, and math skills; computer classes to provide skills in wordprocessing and using the Internet; parenting workshops with information about caring for the newbaby; health classes covering the physical and emotional aspects of pregnancy along with maternaland child health; and counseling to address personal and employment-related concerns. Theprogram generally lasts about three months for a total of about twenty-five hours per week.Participation satisfies the recipient’s participation requirement.
Substance abuse. All Public Assistance applicants and recipients are screened forsubstance abuse problems. Those identified as having a possible substance abuse problem arereferred to the Substance Abuse Center Assessment Program (SACAP), where they are assessedby a Certified Alcohol and Substance Abuse Counselor (CASAC). Those accepted for theprogram are provided substance abuse treatment and employment activities.

252Sally Satel, Welfare-to-Work for People with Drug and Alcohol Problems, unpublished paper submittedto Baruch College, City University of New York, January 22, 2002.
253City of New York, HRA, Ladders to Success: Innovations in City Government.
254Seth Diamond, former deputy commissioner for Operations, New York City’s Human ResourcesAdministration, conversation with Marie Cohen, November 27, 2001.
255Sally Satel, Welfare-to-Work for People with Drug and Alcohol Problems, unpublished paper submittedto Baruch College, City University of New York, February 4, 2002, p. 27.
94
Case management services for substance abusers are provided (under contract) by theVisiting Nurse Service, the National Association for Drug Abuse Problems, and UniversityBehavioral Associates. The case managers coordinate the multiple services received by eachrecipient, monitor compliance, and report noncompliance to HRA.252
In November 2001, about 1,286 FA cases were in substance abuse treatment. For 1,264 ofthose participants, the treatment was their only program activity. Most FA recipients in treatmentwere enrolled in a nonresidential treatment program. Only 133 were combining treatment withWEP or another activity.
Among SNA cases, substance abuse treatment had more participants than any otheractivity. In November 2001, 10,311 SNA cases were in substance abuse treatment and, for 97percent of them, it was their only activity. Most were receiving treatment through a nonresidentialtreatment program, although a sizeable minority (41 percent) were in a residential treatmentprogram. Only 3 percent were combining treatment with WEP or another activity.
Participants who are deemed able to work are assigned to WEP for twenty hours perweek and are required to attend a substance abuse treatment program.253 Those who are deemedunable to work due to the severity of their condition are required to attend a treatment programfor at least fifteen hours per week for up to ninety days. After this period, they are expected tohave made enough progress to participate in required work activities for twenty hours per weekwhile remaining in treatment. HRA initially tried to establish special WEP placements for somesubstance abusers, but found that, in general, this population differed so little from the caseload asa whole that the special placements were unnecessary.254
After ninety days in treatment, recipients are evaluated by a CASAC for their continuedneed for treatment and their employability status. According to Sally Satel of the AmericanEnterprise Institute, who conducted an in-depth review of HRA’s programs for people with drugand alcohol problems, SACAP reports that about half of the recipients seen at this point needcontinued treatment.255 Those with more serious substance abuse problems are placed inresidential treatment programs.

256Seth Diamond, conversation with Marie Cohen, November 27, 2001.
257Satel, Welfare-to-Work for People with Drug and Alcohol Problems, pp. 30-34.
258Association of the Bar of the City of New York (ABCNY), Committee on Social Welfare Law, WelfareReform in New York City: The Measure of Success (New York: Association of the Bar of the City of New York,August 2001), pp. 6-7, available from: www.abcny.org/currentarticle/welfare.html, accessed January 11, 2002.
259Association of the Bar of the City of New York (ABCNY), Welfare Reform in New York City, p. 7.
95
Apparently, the availability of space in treatment programs has not been an issue.Treatment slots have been available for everyone who is required to enter treatment.256
Until about the middle of 2001, there apparently was considerable tension between HRA,drug treatment programs, and advocates for drug-addicted welfare recipients as HRA tried to gainsome control of treatment practices that were previously the business of the treatment providersalone. For example, when HRA asked treatment providers to sign off on a new set of clinicalpractice guidelines in order to receive referrals from HRA, many providers refused—with theencouragement of the state office dealing with alcohol and substance abuse services. A majorsticking point was whether HRA or the provider would decide whether a patient should besanctioned. After Governor Pataki got involved, the standards were adjusted so that HRA wouldmake the sanction decision on the basis of information provided by the treatment provider.257
Most providers then signed on.
Some program advocates, however, continue to criticize HRA’s treatment of drug-addicted welfare recipients. For example, the Committee on Social Welfare Law of the BarAssociation of the City of New York has accused the city of assigning some addicted recipients towork activities along with their treatment when they are unable to participate in those activities,leading to their inevitable sanction for “alleged non-cooperation.”258 According to a report by thecommittee, “HRA has yet to develop practical and humane treatment programs that support fullrecovery in welfare recipients, preferring to rely on punitive measures that do not move clients tofunctional independence.”259
MDRC is planning a random assignment evaluation of the Substance Abuse CaseManagement project. Recipients referred to substance abuse treatment will be randomly assignedto one of three organizations providing case management services. Case managers will seek toenroll and keep participants in substance abuse treatment as well as refer them to other services,such as mental health counseling and job search or job readiness programs.
HIV/AIDS. Recipients with AIDS or advanced HIV disease are provided expeditedbenefits and services by the HIV/AIDS Services Administration. Services include vocationalrehabilitation activities to help participants develop skills to prepare for employment. Benefits mayalso include more generous earnings disregards to allow participants to keep more of their PublicAssistance and Food Stamp benefits and provide for continued Medicaid coverage for those who

260NYC.gov, “Human Resources Administration,” available from:www.nyc.gov/html/hra/html/serv_dvei.html, accessed December 12, 2002.
96
leave welfare. Given advances in medication and treatment, the hope is that many of theseindividuals can eventually resume their work careers and regain their independence. The programis run on a voluntary basis.
Domestic violence. Recipients who are victims of (or at risk for) domestic violence canreceive counseling and referral services through the Domestic Violence Liaison Unit. They can beexcused from other program requirements if such compliance would put them at further risk ofharm. According to an HRA publication:
As part of the compliance with the State Welfare Reform Act, HRA established DomesticViolence Liaison Units in various Job Centers throughout the City. The units are staffedwith social workers trained in the domestic violence field who assess clients to determinetheir special needs for Welfare to Work compliance. In a pilot project that began thisspring, the liaison unit outlines recommended engagement plans that may includecounseling, working on a GED, attending ESL (English as a Second Language) classes,job or skills training, a WEP assignment, or unsubsidized work, and helps coordinate workand work-related activities.
If a client has just entered a shelter, most likely she will have counseling as an importantcomponent of her 35-hour workweek. She might attend GED classes two days a week andgo to a WEP assignment one or two days. The important part of this program is that theclient will be protected from being sanctioned if she is unable to comply with herengagement plan on any given day because of the domestic violence. She has a domesticviolence counselor to call who will intercede for her and help her to be successful in herjourney toward self-reliance and self-sufficiency while remaining safe.260
No further data are available for this program.
Elderly. In the fall of 2001, the Senior Works program was developed at a single locationto address the needs of the elderly, particularly those over age sixty-five and those individualsunder age sixty-five with insufficient work history to qualify for Social Security once they reachage sixty-five. A special unit was established at the Social Security office to expedite processingof SSI and regular Social Security benefits. Home visits are performed to complete SocialSecurity applications and to link people to other program benefits and services, effectivelycreating a one-stop approach for everyone served at the center. Part-time work slots, particularlythose funded under the Title V elderly employment program, are offered to people who needadditional work quarters so that they can qualify for Social Security and Medicare benefits.
Veterans. In 2002 HRA opened an integrated Veterans Center to target veterans onHRA’s caseload, primarily those in the SNA program. The program consisted of a Veteran’s

261Nightingale, Pindus, Kramer, Trutko, Mikelson, and Egner, Work and Welfare Reform in New YorkCity During the Giuliani Administration, p. 50.
262Nightingale, Pindus, Kramer, Trutko, Mikelson, and Egner, Work and Welfare Reform in New YorkCity During the Giuliani Administration, p. 50.
97
Administration (VA) health clinic with outreach services for homeless veterans and those withsubstance abuse and mental health issues. The center housed city, state, and federal staff dealingwith veterans’ programs to maximize the resources available to help move people from welfare towork and to access veterans’ benefits.
Caretaker relative cases. A special program was developed to target relatives who weretaking care of children. The object is to provide both work and family strengthening services inorder to reduce the risk of out-of-home placement.
Teen school dropouts. A model alternative school was developed in 1999 for 250 youthof Temporary Assistance for Needy Families (TANF) households who had dropped out of school.The idea is to work with the youths to address their educational deficits and prepare them forwork so that they do not go on welfare. Services include help in obtaining a GED, graduatingfrom high school, or enrolling in postsecondary education. The school operates on the basis ofone week of work alternating with one week of school. In 2001 its first students graduated, andsome went on to enroll in college. The school now has been converted to a charter school underNew York City school system.
Criminal justice. HRA integrated employment and substance abuse treatment programswith state corrections, state parole, and city probation services as well as with the state courtsystem. The program is designed to integrate resources and case management with the power thatvarious criminal justice entities have to compel behavior. With probation, parole, and courts, forexample, the objective is to establish a consistent message that government’s obligation to providetemporary support is contingent on the concurrent obligation of the citizen receiving that supportto engage in a constructive plan to move to self-sufficiency.
College attendance. Prior to 1996, welfare recipients in New York City were allowed toattend college and other postsecondary educational institutions; in fact, full-time students wereexempt from work requirements.261 In 1995 about 28,000 FA and SNA recipients were enrolled atCity University in New York (CUNY), constituting more than 10 percent of the total studentbody.262
Under welfare reform, however, the conditions under which welfare recipients can usecollege attendance to satisfy their participation requirements are much narrower. Attendance mustbe consistent with the recipient’s employability plan and generally must be limited to no more thantwo years.

263Swati Desai, former executive deputy commissioner, Office of Program Reporting, Analysis, andAccountability, New York City Human Resources Administration, e-mail to Douglas Besharov, June 17, 2003.
264Testimony of Seth Diamond, “Intro 93: Education and Training for Public Assistance Recipients.”
265Nightingale, Pindus, Kramer, Trutko, Mikelson, and Egner, Work and Welfare Reform in New YorkCity During the Giuliani Administration, p. 50.
98
In addition, in order to maintain HRA’s employment focus, recipients are ordinarilyrequired to participate in a WEP activity while attending college. (Students can be granted atwelve month exemption from participating in WEP if the education program is short-term—usually six months to one year—and fits the recipient’s employability plan.) Studentscombining WEP with college are assigned to a WEP site for 20 hours per week and participate inschool activities for 15 hours per week (defined as class hours, supervised study hall hours, andlab hours, for up to twelve months, as well as federal work-study or internship hours, if they arerelated to helping the participant secure employment). Work assignments are designed to avoidconflicts with class schedules and, when possible, to reflect the student’s educational focus.263
Combining work experience with coursework is seen as a way to improve theemployability of college students. Seth Diamond, former deputy commissioner for HRAoperations, explains:
We believe the best way to prepare college students to succeed after graduation is tocombine work with education. To that end, we have worked with the CUNY WEP toallow for work. HRA funds CUNY to provide College Opportunities to Prepare forEmployment (COPE) for TANF participants. COPE provides caseworkers, verification ofattendance and job developers. Caseworkers provide counseling and support servicesincluding assistance with domestic violence and child care and support to understandHRA’s policies. Job developers assist with resume preparation, interviewing techniques,job readiness, job search and job placement services.264
After the imposition of these restrictions, the number of welfare recipients enrolled incollege dropped substantially. Between 1995 and 2001, for example, the number of welfarerecipients attending CUNY declined by 75 percent, from 28,000 to 7,000.265 Much of thereduction in the number of recipients enrolled in college, however, may be attributable to thedecline in the total caseload, rather than to restrictions on college attendance. During the sameperiod, the FA caseload declined by 51 percent, from 312,220 to 153,239, and the SNA caseloaddeclined by 64 percent, from 215,513 to 78,356.

266Gayle Hamilton and Susan Scrivener, Promoting Participation: How to Increase Involvement inWelfare-to-Work Activities (New York: Manpower Demonstration Research Corporation, September 1999), p. 58,available from: www.mdrc.org/Reports99/PromotingParticipation.pdf, accessed September 19, 2001.
267U.S. House of Representatives, Personal Responsibility and Work Opportunity Reconciliation Act of1996: Conference Report (Washington, D.C., Government Printing Office, Report 104-725, July 30, 1996), pp. 30-31, stating: “[I]f an individual in a family receiving assistance under the State program funded under this partrefuses to engage in work required in accordance with this section, the State shall—
(A) reduce the amount of assistance otherwise payable to the family pro rata (or more, at theoption of the State) with respect to any period during a month in which the individual refuses; or (B) terminate such assistance,
subject to such good cause and other exceptions as the State may establish.”
99
VIII. SANCTIONS
Sanctions are essential to enforcing mandatory participation, because participation is nottruly mandatory unless there is a consequence for not participating. As Gayle Hamilton and SusanScrivener, senior associates at the Manpower Demonstration Research Corporation (MDRC)write, sanctions are “important in reinforcing the mandatory nature of a welfare-to-workprogram.”266 With limited exceptions, New York State allows only partial sanctions. Manyexperts believe that this policy has undercut New York’s work mandate.
Predominantly Partial Sanctions
Under the old Aid to Families with Dependent Children (AFDC) program, states wererequired to sanction nonexempt recipients who, without good cause, failed to participate inassigned work activities, refused to accept employment, terminated employment, or reduced theirhours of work. In practice, however, most states sanctioned few people. Moreover, under AFDCsanction involved, at most, removing the noncomplying adult from the grant. The rest of thefamily continued receiving assistance. This is called a “partial” sanction, as opposed to a “full-family” sanction. There were also federal limits on the duration of the sanction: The first sanctionlasted until the recipient complied, the second sanction lasted the longer of three months or untilthe recipient complied, and any subsequent sanction lasted the longer of six months or until therecipient complied.
TANF rules. The drafters of Temporary Assistance for Needy Families (TANF)legislation apparently sought to toughen sanctions. TANF requires states to establish pro ratareductions in benefits for recipients who do not comply with state work or participationrequirements.267 (This requirement is a minimum. States may impose larger sanctions, includingfull-family sanctions.) Key policymakers and experts involved in the drafting of this provision,including Ron Haskins, then of the House Ways and Means Committee staff, and Robert Rector

268Merriam-Webster OnLine, s.v. “pro rata,” available from: www.m-w.com/cgi-bin/dictionary, accessedDecember 13, 2002.
269Black’s Law Dictionary, 7th ed., s.v. "pro rata."
270GMB, “Part time workers,” available from:www.gmb.org.uk/docs/ViewADocument.asp?ID=86&CatID=3, accessed December 12, 2002.
271Mack Storrs, senior policy analyst, HHS Office of Family Assistance, e-mail to Peter Germanis, October9, 2002.
100
of the Heritage Foundation, believe that this reference to a pro rata reduction directed states toreduce benefits in proportion to the degree of noncompliance, including a full-family sanction forthose who do not comply at all.
Dictionary definitions of the term support their interpretation. Merriam-Webster definespro rata as “proportionately according to an exactly calculable factor (as share or liability).”268
Black’s Law Dictionary defines the term as “Proportionately; according to an exact rate, measure,or interest.”269 Similarly, a British trade union document states: “The basis of negotiating for parttimers is equal rights to full timers or ‘pro rata’. Pro rata means in proportion to hours worked.For example, someone who works half the week of a full timer should get the same number ofweeks’ annual leave, but will be paid for half the hours compared to the full timer. The pay is prorata to hours.”270
The U.S. Department of Health and Human Services (HHS), however, took a differentposition, as Mack Storrs, a senior policy analyst in its Office of Family Assistance, explains:
There was some controversy about this point. Initially, as States implemented theprovision, we allowed them “any reasonable” interpretation of the statute and also allowedsimilar flexibility in the NPRM [Notice of Proposed Rulemaking]. Jason Turner and othersargued that in enacting the provision, Congress had intended the Robert Rectorinterpretation. While we were developing the final rules, Ron Haskins confirmed that thiswas also his understanding of the language, but no one on the Hill commented on thisissue, and most commentators asked for State flexibility. Given the lack of clarity in thestatutory language and no clarifying conference language, OGC [Office of GeneralCounsel] said we could basically interpret the provision or leave it up to States. In the finalrule, we basically repeated the statutory language and in the preamble told States wewould not prescribe one method of proration and that they could use any reasonablemethod or proration. (Many States chose to remove the needs of the adult that is beingsanctioned.)271

272U.S. Department of Health and Human Services, Temporary Assistance for Needy Families Final Rule,45 CFR Part 260, et al., Federal Register 64 (69), April 12, 1999, p. 17769.
273State Policy Documentation Project, Summary of State Sanction Policies as of April 2000 (Washington,D.C.: State Policy Documentation Project, 2000), available from: www.spdp.org/tanf/sanctions_overview.pdf,accessed December 21, 2001.
101
Thus, the preamble discussion of the final TANF regulation regarding this provision states thatthere is no single method for applying a pro rata sanction and that states may use “any reasonablemethod.”272
As a result, state sanction policies vary widely in regard to the amount and duration of thesanction, what recipients must do for a sanction to be lifted, and what constitutes good cause. Asof April 2000, fourteen states and the District of Columbia continued to provide partial sanctionseven in instances in which the recipient does not comply at all.273 Thirty-six states had full-familysanctions, including fifteen states that imposed such sanctions on the first instance ofnoncompliance. Seven states terminated assistance permanently for repeated or continuednoncompliance. The states with the most stringent sanction policies, in terms of the proportion ofthe grant reduction and the duration of the sanction, tended to be those with relatively low TANFbenefits. The states that did not have full-family sanctions tended to be the ones with higherbenefits, including several with large TANF caseloads (such as California and New York).
New York State’s rules. New York State essentially retained the same sanctions it hadunder the old AFDC program. As a result, the state does not have a full-family sanction (except inlimited circumstances related to eligibility, as described below and in Section IV). This has been amajor point of contention.
Family Assistance sanctions. Under Family Assistance (FA), the first instance ofnoncompliance triggers a partial reduction in benefits until the recipient complies with theparticipation requirement. The maximum sanction is a reduction of the benefit by the inverse ofthe family size, that is, one-third for a family of three. If a second sanction is subsequently applied,the benefit is reduced for a minimum of three months, after which it can be restored withcompliance. For the third and subsequent sanctions, the benefit is reduced for a minimum of sixmonths, after which it can be restored with compliance. (These rules are essentially the same asunder AFDC.)
According to Jo Anne Barnhart and her colleagues at the American Institute for FullEmployment, “NYS’s sanction policy violates another important economic theory, in that itimposes a minimum sanction period of three months for the second instance of non-compliance
274Jo Anne Barnhart, Deborah Chassman, and Sandie Hoback, Moving From Full Engagement to FullEmployment: A Program Review of New York City’s Welfare Reform (Klamath Falls: American Institute for FullEmployment, November 5, 2001), p. 15.
275Barnhart, Chassman, and Hoback, Moving From Full Engagement to Full Employment, p. 15.
276See the discussion: “Full-family sanctions or adverse case closures.”
277New York State Office of Temporary and Disability Assistance, “The Automated Finger ImagingSystem (AFIS) for Public Assistance,” Administrative Directive, January 25, 1996, available from:www.otda.state.ny.us/directives/1996/ADM/96_ADM-04.pdf, accessed February 6, 2003.
278See the discussion: “Transfers to Safety Net Assistance.”
102
and six months for third instance noncompliers.”274 They recommend that benefits be restored assoon as a family comes into compliance.275
Safety Net Assistance sanctions. The Safety Net Assistance (SNA) sanctions are slightlydifferent from those for FA, and they can have a different impact. Because most SNA casesinvolve only one person, what is in effect a partial sanction under FA usually results in a caseclosure under SNA. In addition, the minimum sanction periods under SNA are a little longer. Thefirst instance of noncompliance results in a sanction for at least three months, the second for aminimum of five months, and any subsequent sanction for a minimum of six months. After theseminimum periods have been met, benefits can be restored with compliance. (If the SNA caseincludes dependent children, the minimum sanction periods described for FA apply.)
Sanctions in the two programs have been aligned in that the progressive imposition ofsanctions continues if a family moves from FA to SNA. For example, if a family has two sanctionsunder FA, but then transfers to SNA with the time limit and is sanctioned again, it would bedeemed a third sanction, with a minimum six-month benefit reduction.
In some cases, noncompliance with various “conditions of eligibility” can lead to anadverse case closure or the rejection of an application (essentially, the equivalent of a full-familysanction). In New York, this includes failure to comply with the finger imaging requirement, theinitial substance abuse screen, the third-party medical assessment, and various other eligibility-related reporting requirements.276 For example, the “Administrative Directive to Commissioners ofSocial Services” states, “[I]f one required member of a case refuses to comply with the fingerimaging requirement, the entire case is to be denied, because verification of eligibility by means ofthe finger imaging is a condition of eligibility for the household.”277 In addition to the basicrequirements, a sanctioned case may be periodically called in for an eligibility review to determinehow the family is managing on a reduced grant. Failure to keep the eligibility review appointmentmay also result in the termination of benefits for the entire family.
In addition, for some period of time at least, the city used the five-year time limit as anopportunity to impose full-family sanctions on noncooperating case heads. As described above,278

279Mark Hoover, former first deputy commissioner, New York City Human Resources Administration, e-mail to Peter Germanis, October 14, 2002.
280The Simplified Food Stamp Program allows states to develop a common set of rules for determiningeligibility and benefits for households in which some or all members receive TANF, although this flexibility issubject to a number of limitations.
281In 2001, the maximum monthly TANF grant in New York City for a three-person family was $577,with an additional $311 in food stamps, bringing the combined monthly benefit package to $888. The maximumsanction for families with young children was $192 (22 percent of the total benefit) when only TANF could bereduced, but increased to $270 (30 percent) with the addition of the Food Stamp sanction. Of course, when otherbenefits the family may be receiving are included, such as Medicaid, housing assistance, and subsidized schoolmeals, the sanction becomes an even smaller percentage of the total benefit package.
282This is an upper bound estimate, because some of the families did not receive food stamps or wouldhave remained exempt for some other reason.
103
the Human Resources Administration (HRA) began offering temporary subsidized jobs in the fallof 2001, in anticipation of the first families reaching the five-year time limit. Initially, these joboffers focused on the so-called “happily sanctioned.” Recipients offered a job were required toaccept it as a condition of eligibility. Refusal meant termination of benefits for the entire family.According to Mark Hoover, a former HRA first deputy commissioner, about 30 to 35 percent ofthe sanctioned recipients were eventually removed from the rolls through this process.279
New York also toughened Food Stamp sanctions for many TANF recipients with youngchildren. Ordinarily, under the Food Stamp Program, single parents with a child under age six areexempt from work requirements. Thus, even if they are sanctioned for noncompliance with aTANF work requirement, their Food Stamp benefits remain unaffected. The PersonalResponsibility and Work Opportunity Reconciliation Act of 1996 (PRWORA), however, allowsstates to conform their Food Stamp exemptions to those of the TANF program by adopting aSimplified Food Stamp Program.280 This provision, in turn, permits states to impose Food Stampsanctions on noncompliant families. New York adopted the Simplified Food Stamp Program,which increased the size of the sanction from $192 (FA) to $261 (FA plus).281 (In 2000, about 40percent of welfare families in New York had a child between age one and six and were thuspotentially affected by this change.282)
Increased Sanctioning
How much sanctioning is the right amount? Is there such a thing as a “right” amount?Although Gayle Hamilton and Susan Scrivener state that sanctioning is an important aspect ofcareful monitoring, they argue that high rates of sanctioning do not necessarily increaseparticipation rates:
Sanctioning should be viewed as a tool to bring welfare recipients into compliance withprogram requirements, not as an end in itself . . . programs with high sanctioning rates do

283Hamilton and Scrivener, Promoting Participation: How to Increase Involvement in Welfare-to-WorkActivities, pp. 58.
284In November 2001, more than 96 percent of SNA cases outside New York City were composed of oneadult. This same data is not available for New York City, but the city had 74,542 SNA cases, with 77,538 adultrecipients and 2,221 child recipients. This too suggests a very small number of multi-person households. New YorkState, Office of Temporary and Disability Assistance, Temporary and Disability Assistance Statistics: November2001 (Albany: New York State Office of Temporary and Disability Assistance, January 28, 2002), available from:www.otda.state.ny.us/bdma/2001/stats1101.pdf, accessed January 17, 2003.
104
not necessarily achieve greater participation rates or impacts than those with moderatesanctioning rates. Sanctions are, however, important in reinforcing the mandatory natureof a welfare-to-work program.283
The effects they cite, however, cannot be viewed as direct results of sanctions because a numberof other factors defined the level of enforcement. Moreover, the studies they examined werelimited to programs that could only impose partial sanctions and do not suggest what the potentialimpact of full-family sanctions would be.
Sanctions in New York City. The patterns and consequences of sanctions are quitedifferent in FA and SNA cases both because of the differences in sanction rules and because therecipients in each program have different characteristics (the latter, for example, are much lesslikely to have children).
Family Assistance. Between November 1996 and November 1999, the number of FAcases in the sanction process increased sharply, from 17,727 to 54,012 (from 16 percent to 38percent of the engageable caseload). (These numbers do not include cases that were closed forfailing to comply with various reporting requirements related to the participation requirements,which are not available.) Although the number of sanction cases subsequently declined over thenext two years by about 40 percent (from 54,012 in November 1999 to 30,679 in November2001), they remained a significant share of the engageable caseload (34 percent).
The proportion of cases actually sanctioned, as opposed to being in the “process” of beingsanctioned, also grew steadily. Between April 1999 and November 2001, the proportion ofrecipients in the sanction process who had already had their grants reduced increased from 20percent to 51 percent, probably as a result of HRA’s efforts to make the process more efficient.
Safety Net Assistance (SNA) sanctions. The SNA program has almost the identicalsanction rules as FA, but because more than 95 percent of the SNA caseload has traditionallybeen composed of single adults, until recently, a sanction usually meant case closure.284 As aresult, in November 2001, of the 6,505 cases in the “in sanction process” only 184 (2 percent)were actually considered sanctioned (compared with 51 percent of FA cases). However, sinceDecember 2001, when families on FA reaching their five-year time limit were converted to SNA,an increasing share of the SNA caseload has consisted of single mothers with children. As a result,

285Association of the Bar of the City of New York (ABCNY), Committee on Social Welfare Law, WelfareReform in New York City: The Measure of Success (New York: Association of the Bar of the City of New York,August 2001), available from: www.abcny.org/currentarticle/welfare.html, accessed January 11, 2002.
286Association of the Bar of the City of New York (ABCNY), Welfare Reform in New York City.
287Roslyn Powell, Sherry Leiwant, and Elizabeth Goncher Hempstead, Still Nowhere to Turn: New YorkCity’s Continuing Failure to Inform Parents About Their Child Care Rights (NOW Legal Defense and EducationFund, 2001), available from: www.nowldef.org/html/pub/pubs/stillnowhere.pdf, accessed August 12, 2004.
288U.S. General Accounting Office, Welfare Reform: State Sanction Policies and Number of FamiliesAffected, GAO/HEHS-00-44 (Washington, D.C.: GAO, March 2000).
105
by August 2002, the proportion of SNA cases in the “in sanction process” had nearly quadrupled,from 2 percent to 8 percent, probably reflecting the growing number of families on SNA.
A report by the Committee on Social Welfare Law of the Association of the Bar of theCity of New York claims that the “fair hearing” process has become more biased against welfareapplicants and recipients since welfare reform. Under Mayor Giuliani, the setting for work-relatedhearings was moved from the state office building to HRA’s Office of Employment services, and anew group of judges was hired. According to the bar association, the new judges were biased infavor of the city, and the hearings were attended by a new set of city representatives who hadbeen “trained to aggressively defend HRA determinations.”285 According to the bar association,“the result was fewer settlements and a precipitous decline in the appellant win rate from ninetypercent to fifty-five percent.”286 In addition, the HRA hearing process has been accused of failingto inform participants that they cannot be sanctioned if they cannot find appropriate child care.287
HRA officials counter that although they changed the fair hearing process, it was mademore balanced. For example, missing information from a file previously led to a favorable decisionfor the participant, regardless of whether the missing information was related to the issue at hand.In addition, they contend that the agency was often represented poorly or not at all at thehearings. Under the new system, the agency’s representatives argued in favor of agencyinterpretations and were able to ask for short postponements to obtain agency information asnecessary. As a result, agency win rates improved.
We have no additional data on the subject and have no way of judging the validity of theclaim that the new judges were biased. Otherwise, the statements of both sides of the debate seemto reflect the same underlying reality: The HRA sanction process became much more rigorous.
National rates. If no objective way exists to determine the appropriate level of sanctions,it might be informative to compare New York City’s rate with that of other states. In what isapparently the only comprehensive national study of sanctions, the U.S. General AccountingOffice (GAO) estimated that 136,000 families (about 5 percent of the national caseload) weresanctioned during an average month in 1998, including 23,100 families with a full-familysanction.288

289Dan Bloom and Don Winstead, Sanctions and Welfare Reform, Welfare Reform and Beyond Series,Policy Brief No. 12 (Washington, D.C.: The Brookings Institution, January 2002), p. 3.
290Heidi Goldberg and Liz Schott, A Compliance-Oriented Approach to Sanction in State and CountyTANF Programs (Washington, D.C.: Center on Budget and Policy Priorities, October 1, 2000), p. 43, October 1,2000, available from: www.cbpp.org/10-1-00sliip.pdf, accessed February 4, 2002.
106
The GAO’s estimate, however, is problematic. On the one hand, the estimate overstatesthe number of work-related sanctions because it is based on the total number of sanctions fornoncompliance with any state requirement, not just those that are work or participation related.(The GAO reports that about two-thirds of the sanctions appear to be related to workrequirements, but the precise number is uncertain because several states did not identify thespecific reasons for sanctions.)
On the other hand, the GAO’s estimate understates the number of families affected bysanctions (especially for the purpose of comparing it with New York City’s monthly rate) becauseit counts the cases with a full-family sanction (23,100) only in the month the sanction was firstimposed. Because of the sanction, many such families may have been kept off welfare for monthsor, sometimes, years, even though they were otherwise eligible for assistance. As Dan Bloom andDon Winstead observe, “If one simply projects GAO’s monthly estimates over several years, it iseasy to conclude that well over half a million families have had their cases closed due to full-family sanctions . . .”289 This calculation overcompensates for the problem, however, becausesome families comply with program requirements after a full-family sanction is imposed and thenreturn to the rolls, or they compensate for the sanction by earning more or moving in with othersand, thus, are no longer be eligible for assistance. And some recipients were not truly beingsanctioned: After having found a job, they did not report back to the welfare agency and werethen dropped for noncompliance.
We could find only one study, by Heidi Goldberg and Liz Schott, both of the Center onBudget and Policy Priorities, estimating the total number of families not receiving welfare becauseof a full-family sanction. They used the state data reported in the GAO study, with somecorrections, and assumed that about one-third of the families with a full-family sanction wouldreturn to the welfare rolls within four months of leaving. They estimated that between 1997 and1999, “nearly 370,000 families had lost welfare benefits due to assistance and remained off aid.”290
Adding this figure to the 112,700 families with a partial sanction suggests that about 480,000families were affected by a sanction during an average month by the end of 1999.
Adopting the Goldberg and Schott approach, the total number of work-related sanctionsmay be about 320,000, applying GAO’s estimate that about two-thirds of all sanctions are fornoncompliance with work requirements. This formula results in a national sanction rate of roughly
291There are many problems with the data and assumptions used to derive this estimate. Two examplesillustrate the seriousness of these problems. First, the GAO estimated that 23,100 families had received a full-family sanction in an average month in 1998. When Goldberg and Schott developed their estimates, they noted thatthere was a large discrepancy between the GAO’s estimate of full-family sanctions in Illinois and the numberreported by the states to HHS (7,214 vs. 44 per month). They concluded that the discrepancy was due to GAO’smisinterpretation of the sanction data and that they had counted many cases that were closed due to proceduralreasons, such as failing to comply with the recertification process, rather than a sanction. This discrepancyaccounted for about one-third of the full-family sanctions. In addition, there are problems with the assumptions.For example, Goldberg and Schott acknowledge, however, that “this is not a measure of the number of familiesthat would be on welfare today in the absence of a sanction policy, both because it does not reflect sanctionsimposed in 2000 and because it does not reflect that some families that left welfare due to sanction would have leftat some point for other reasons in the absence of a sanction.” (p. 43)
292HRA’s reported sanction rate ignores the undetermined number of families denied assistance by failingto comply with various conditions of eligibility, that is, its version of the full-family sanction. All states, however,have similar conditions of eligibility, so it is unclear how excluding these case closures from the calculation of asanction rate affects New York City’s sanction rate relative to the national average.
293Barnhart, Chassman, and Hoback, Moving From Full Engagement to Full Employment, p. 15.
294See generally Kathryn Edin and Laura Lein, Making Ends Meet: How Single Mothers Survive Welfareand Low-Wage Work (New York: Russell Sage Foundation, 1997). From 1988 to 1992, Edin and Lein conductedin-depth interviews with 379 low-income mothers in four cities—Chicago, San Antonio, Boston, and Charleston,South Carolina—to examine their income and spending patterns. Although their sample is not representative ofwelfare mothers nationally, it raises interesting insights into the survival strategies of these mothers (confirmed bymore representative surveys). More than half their sample consisted of mothers on welfare. The average monthly
107
12 percent. Although this calculation has many problems,291 it suggests that New York City’ssanction rate in 1999 was about the same as the national average.292
“Happily Sanctioned?”
Although some recipients sanctioned by HRA may have misunderstood programrequirements or been the victims of erroneous reports from program sites, such cases are usuallycleared up easily. City officials consider most of the recipients currently being sanctioned as the“happily sanctioned”—that is, they are accepting the sanction as the price of noncompliance.According to Jo Anne Barnhart and her colleagues at the American Institute for Full Employment,“Employment Vendor interviewees reported that a considerable number of these sanctioned casesare headed by long-term, ‘happily sanctioned’ participants, who are content to indefinitelycontinue to receive the reduced benefits.”293
Bearable costs. How can these families absorb the loss of the mother’s portion of thegrant? First, the rest of the welfare grant can be substantial: $385 for a family of three (comparedwith $577 before the sanction). In addition, the family would still receive $233 worth of foodstamps (reduced from $311 because of the sanction), and it might well be receiving one of anumber of housing subsidies. Finally, the family might be getting help from relatives or themother’s boyfriend, or the mother might be working without telling HRA.294

income for these families was $883. Of this amount, 64 percent consisted of welfare income (primarily AFDC andfood stamps). Five percent had jobs, which they reported to the welfare agency, but nearly half worked inunreported employment or in the underground economy. They estimated that such “off the books” work accountedfor 12 percent of their income. However, this may have been an underestimate, because Edin and Lein stoppedasking the mothers about their income when their responses were within $50 of monthly expenses.
295Jason Turner, “Don’t Let California and New York Undermine Welfare Reform’s Work Requirements,”Executive Memorandum, no. 819, June 13, 2002, available from: www.heritage.org/Research/Welfare/EM819.cfm,accessed June 17, 2004.
296U.S. General Accounting Office, States’ Early Experiences With Benefit Termination, GAO/HEHS-97-74 (Washington, D.C.: GAO, May 1997), p. 34.
297U.S. General Accounting Office, States’ Early Experiences With Benefit Termination, p. 34.
298State Policy Documentation Project, Sanctions for Noncompliance with Work Activities (State PolicyDocumentation Project, June 2001), available from: www.spdp.org/tanf/sanctions/sanctions_findings.htm, accessedSeptember 19, 2001.
108
That is why many experts believe that full-family sanctions are the best way to achievecompliance with participation requirements.295 Full-family sanctions tend to “smoke out” thoserecipients with unreported income who then leave the rolls if doing so is more profitable, and theyput more teeth in the requirement to participate for those recipients who are staying at home.According to the GAO, “The number of reopened cases demonstrated that stronger sanctionswere working as intended—to reinforce the need for recipients to comply with requirements ifthey wished to continue receiving benefits, according to state officials.”296 As one Massachusettscaseworker explained: “Many clients don’t take the program seriously until the checks stop. Lossof just the adult portion of the grant isn’t enough to get their attention. [But] when they get nobenefits at all, they’re on the phone with their caseworkers right away.”297
Although there is reason to be concerned about the people who may be too disorganizedor otherwise dysfunctional to comply with participation requirements, states and counties can takevarious measures to help these people participate. Almost all states have a process to resolvecompliance issues before a sanction is imposed.298 In some states, that process involves extensiveattempts to contact the recipient and resolve issues that may be preventing participation. Forexample, in Oregon, before a case can be closed, case managers are required to conduct anintensive case management session with the noncompliant adult and, usually, make a home visit.
Another matter of concern has been the initial slowness of HRA’s sanctioning process. Itprovided opportunities for uncooperative recipients to “game” the system and continue receivingfull benefits, perhaps for months, before either complying with work requirements or receiving abenefit cut. According to Barnhart and her colleagues,
NYS’s conciliation and conference stages take an enormous amount of time to complete,with about eight weeks elapsing from the time of the infraction to the imposition of the

299Barnhart, Chassman, and Hoback, Moving From Full Engagement to Full Employment, p. 15.
300James Clark, “New York’s WEP Program,” unpublished paper submitted to Baruch College, CityUniversity of New York, 2001, p. 74.
301See the discussion: “Full-family sanctions or adverse case closures.”
302Barnhart, Chassman, and Hoback, Moving From Full Engagement to Full Employment, p. 16.
303La Donna Pavetti and Dan Bloom, “State Sanctions and Time Limits,” in The New World of Welfare,edited by Ron Haskins and Rebecca Blank (Washington, D.C.: Brookings, 2001), p. 256.
109
sanction. Therefore, the imposition of the actual sanctions is very much delayed, whichobscures the connection between the violation and the penalty.299
For example, the ten-day waiting period between notification of an impending sanction andimposition of the sanction allows the recipient to wait until the tenth day before responding. Therecipient can then request a hearing, thus further delaying the imposition of the sanction.300
Less participation. Does the absence of a full-family sanction (except in the limitedcircumstances involving “conditions of eligibility”)301 and the slowness of the process make adifference? It seems intuitively obvious that a severe sanction will be more effective than a mildsanction at inducing participation. Anecdotally, Barnhart and her colleagues report that “ESPcontractors. . . . report significant no-show rates [and] attribute this to the partial sanctionpolicy.”302 The evidence comparing the effects of partial sanctions and full-family sanctions onparticipation, however, is very limited.
For example, using data from two states, LaDonna Pavetti, a senior fellow at MathematicaPolicy Research, and Dan Bloom, a senior associate at MDRC, argue that full-family sanctionsmay not be necessary to reduce caseloads and increase employment exits. They note that severalexperimental studies generated employment increases even in the absence of full-familysanctions.303 Their observation, however, provides no information on the relative impact of a full-family sanction compared with that of a partial sanction. It is possible that the observed effects inthese experimental studies would have been considerably larger with a full-family sanction, but inthe absence of a direct comparison of the two sanction policies, it is impossible to make aninformed judgment.
Robert Rector, senior policy analyst at the Heritage Foundation, and Sarah Youssef,formerly a research assistant there, conducted a statistical analysis to determine the relativeimportance of various policy and economic variables on the caseload decline that occurredbetween January 1997 and June 1998. They found that states with immediate full-family sanctionshad, on average, caseload declines that were 25 percentage points larger than states with weakersanctions. They also reported that states with immediate work requirements had caseload declines

304Robert Rector and Sarah Youssef, The Determinants of Welfare Caseload Decline (A Report of theHeritage Center for Data Analysis, May 11, 1999), available from:www.heritage.org/Research/Welfare/CDA99-04.cfm, accessed December 12, 2002.
305Barnhart, Chassman, and Hoback, Moving From Full Engagement to Full Employment, p. 14.
306See the discussion: “Full-family sanctions or adverse case closures.”
307Barnhart, Chassman, and Hoback, Moving From Full Engagement to Full Employment, p. 16.
110
that were 11 percentage points larger than those without such requirements.304 Theirmethodology, however, only established a correlation, not causation, and the actual cause of thedecline could be quite different. For example, the states with full-family sanctions tended to bethose with relatively low TANF benefits; in such states, a larger sanction might be necessary toinduce compliance.
Thus, about the most that can be said on the basis of research about the impact ofsanctions is that the effects of sanctions depend on many factors, including the size of the originalgrant, the proportion that is cut, the duration of the sanction, and the availability of other financialsupport.
In any event, the growing share of the engageable caseload in the sanction processsuggests that alternative policies may be needed to bring the “happily sanctioned” intocompliance. According to Barnhart and her colleagues, “The long and cumbersome New YorkState conciliation process and the modest financial sanctions assessed under the NYS program fornoncompliance do not sufficiently motivate individuals to participate in activities that will helpthem gain independence.”305 They conclude that the problem exists even though HRA seems torigorously enforce the “conditions of eligibility”306 for those sanctioned:
The significant number in sanction status exists despite HRA’s use of data matches andother EVR (fraud program) tools, such as home visits, to make sure that sanctionedfamilies do not have other sources of income. NYC also calls in the sanctioned individualsperiodically, for re-determinations or health checks, and attempts to convince them toparticipate.307
HRA has several times requested waivers from New York State to modify its sanctionpolicy to provide actual pro rata sanctions that would eventually result in a full sanction. None ofits requests, however, have been granted, although the governor has more than once supportedlegislation to create a full-family sanction. According to Mark Hoover, a former HRA first deputycommissioner, this request could have been approved without a change in state law:
[W]hen NYS law changed due to TANF passage, it provided for prorated sanctionspicking up the federal language. NYS had never put out a rule as to what it meant.Sharing the written intent of the congressional language there was generally a legal

308Mark Hoover, former first deputy commissioner, New York City Human Resources Administration, e-mail to Peter Germanis, February 10, 2003.
309See the discussion: “Less participation.”
310See Douglas J. Besharov and Peter Germanis, Toughening TANF: How Much? And How Attainable? AnAnalysis of Participation Requirements in the House and Senate Bills to Reauthorize the Temporary Assistance forNeedy Families Program, and of Likely State Responses to Them (College Park, MD: University of Maryland,School of Public Affairs, Welfare Reform Academy, March 23, 2004), pp. 40-41, available from:www.welfareacademy.org/pubs/welfare/toughening_tanf.pdf, accessed July 9, 2004.
311Under current TANF law, a state may “disregard” a family under a partial sanction from theparticipation rate calculation for up to three months in any twelve-month period. This rule provides a partialexclusion of such families from the participation rate requirement. This exclusion is most helpful to states thatallow a partial sanction to continue for three months or longer.
111
agreement at the state level that the state could, without changing the law, interpret that“prorated” meant that each subsequent sanction would go against an already reducedgrant. So after three or four sanctions the grant would be eliminated. For example, for afamily of three, the first sanction would be 1/3, second 2/3, third 0. The state had twoconcerns: 1) the ability of city’s bureaucracy to implement without totally automating and,2) court action. It wasn’t worth it politically.308
This may change, however. H.R. 4, the administration’s TANF reauthorization proposals passedby the House in 2003, would require that states adopt tougher sanction rules.309 States would berequired to reduce the assistance payment either pro rata or terminate assistance during the firstmonth a sanction is imposed. For recipients who failed to participate for two consecutive months,without good cause, the state would be required to terminate all cash assistance until the recipientresumed full participation. (California and New York would be exempt from this mandate for thefirst year.) It would still be possible, however, for HRA to avoid this stricture by placing suchsanctioned families in a separate state program.310
H.R. 4 would also toughen the enforcement of participation requirements. It wouldeffectively require all states to adopt either an immediate full-family sanction or a specified formof a progressive full-family sanction. For recipients who failed to comply for two consecutivemonths without good cause the state would be required to terminate all cash assistance until therecipient resumed full compliance. (In its first year, H.R. 4 exempts from this requirement thosestates, such as California and New York, that have a constitutional or statutory requirement toprovide assistance to needy parents and children.) The Senate reauthorization bill, unlike H.R. 4,would not require states to adopt a full-family sanction but would essentially retain current TANFsanction policies.311 (The only modification would be to require states to describe how they woulddeal with noncomplying families.)
In the absence of a full-family sanction, HRA is trying other ways to increase participationamong adults who are choosing to take a benefit cut rather than cooperate with work

312Barnhart, Chassman, and Hoback, Moving From Full Engagement to Full Employment, p. 16.
112
requirements. HRA is funding an experimental program in which churches are working to followup with sanctioned families and bring them back into the program by identifying and addressingbarriers to employment.312 For example, mothers with substance abuse problems may be reluctantto divulge their condition to caseworkers, fearing that they will lose custody of their children. Afaith-based organization may be able to act as an intermediary to work with the mother and HRAto obtain the necessary treatment.

313Thomas Brock, David Butler, and David Long, Unpaid Work Experience for Welfare Recipients:Findings and Lessons from MDRC Research (New York: Manpower Demonstration Research Corporation, 1993).The San Diego site included two separate programs that operated during different periods. In addition, all eightprograms targeted single mothers receiving AFDC, but in four sites, two-parent families receiving AFDC-Unemployed Parent (UP) benefits were also targeted. The findings from the four two-parent programs are excludedfrom this analysis, because the costs of administering a work experience program were about the same for the twotypes of families in those sites that operated programs for both groups and because two-parent families represent asmall percentage of the FA/TANF caseload.
113
IX. MONETARY COSTS VERSUS MONETARY BENEFITS
Although a jurisdiction could well decide that work experience programs are good policyregardless of their cost, in many places, fears of a high price tag has clearly prevented theiradoption. Limited data from New York and other jurisdictions suggest that well-run workexperience programs result in benefits to the community that can more than match the costs ofadministration, that can probably cover the costs of child care, and that may cover the costs of atleast some education and treatment services. (This paper deals only with the possible monetarybenefits of work experience programs, but they may provide many other benefits that are difficultto quantify in monetary terms, such as increased skills and self-worth among recipients and theability of recipients to serve as positive role models for their children.)
Thomas Brock, David Butler, and David Long of the Manpower Demonstration ResearchCorporation (MDRC) reviewed studies of eight work experience programs operated by MDRC inseven sites in the mid-1980s.313 The researchers examined the implementation and operationalaspects of the programs and, in some sites, the programs’ impact on employment, earnings, andwelfare receipt. In addition, they estimated the major cost components of work experienceprograms, including site administration, participant monitoring, and support services. We use theirestimates as the starting point for our analysis.
This section refers to costs and monetary benefits from various years, as early as 1993. Tofacilitate comparison, all dollar amounts are in 2003 constant dollars.
Costs
The costs of work experience programs vary greatly and depend on a number of factors,including the number of participants, the average length and intensity of participation, the types ofactivities in which people participate, the characteristics of participants (e.g., age of children,barriers to employment), the extent of participant monitoring and case management, the scope

314See, e.g., Gayle Hamilton and Susan Scrivener, Promoting Participation: How to Increase Involvementin Welfare-to-Work Activities (New York: Manpower Demonstration Research Corporation, September 1999), pp.31-32, available from: www.mdrc.org/Reports99/PromotingParticipation.pdf, accessed September 19, 2001.
315Brock, Butler, and Long, Unpaid Work Experience for Welfare Recipients, tables 10 and A.1. Thefindings for AFDC and AFDC-UP are reported separately in four of the sites studies and are considered separateprograms.
316Brock, Butler, and Long, Unpaid Work Experience for Welfare Recipients, p. 3.
317Brock, Butler, and Long, Unpaid Work Experience for Welfare Recipients, tables 10 and A.1.
318These figures are for only the single-parent programs. As mentioned above, there were four sites thathad programs for both single-parent and two-parent families. We excluded the cost data for the latter because thesites with both programs tended to be the higher-cost sites and would therefore skew the averages, but they werealmost the same in a given site.
319Jason Turner and Thomas Main, “Work Experience Under Welfare Reform,” in The New World ofWelfare, edited by Ron Haskins and Rebecca Blank (Washington, D.C.: The Brookings Institution, 2001), p. 301.
320New York City Human Resources Administration, “FA - Weekly Caseload Engagement Status,” variousreports issued in 1999.
114
and intensity of support services offered, management practices, overhead costs, and employeewage scales.314
Administrative costs. Actually operating the program, including finding and supervisingquality sites, assigning recipients to the sites, and making sure that the recipients actuallyparticipate is a major undertaking.
Site administration. The cost of site administration includes costs for developingworksites, assigning participants to work slots, and monitoring program operations. The MDRCresearchers estimated that in the programs they studied, the costs ranged from about $334 up toabout $1,245 per participant.315 Most participants were in a work experience position for threemonths or less,316 so the annual cost of keeping a slot filled was generally higher, ranging fromabout $468 to about $4,076.317 The mean cost was about $2,042, and the median cost was about$1,771.318
Jason Turner, then commissioner of the Human Resources Administration (HRA), andThomas Main, Turner’s co-author and a professor at Baruch College, estimated the annual cost toadminister a HRA Work Experience Program (WEP) slot at about $1,546 in 1999.319 At that time,they were mostly full-time. This estimate largely reflects the costs of operating a full-time, thirty-five-hour-per-week WEP program, because in 1999 only about 15 to 25 percent of WEPparticipants combined their WEP participation with another activity.320 About 67 percent of costswent to payments to other government agencies for direct costs, including timekeepers,coordinators, and field supervisors as well as tools and equipment. About another 24 percent went

321Brock, Butler, and Long, Unpaid Work Experience for Welfare Recipients, p. 71.
322Brock, Butler, and Long, Unpaid Work Experience for Welfare Recipients, p. 21.
323Brock, Butler, and Long, Unpaid Work Experience for Welfare Recipients, tables 10 and A.1. Thefindings for AFDC and AFDC-UP are reported separately in four of the sites studies and are considered separateprograms.
324These figures are for only the single-parent programs. As mentioned above, there were four sites thathad programs for both single-parent and two-parent families. We excluded the cost data for the latter to avoidgiving too much weight to the sites with both programs, but the costs across the two programs were almost thesame in a given site.
115
to third-party medical assessments, and approximately 9 percent was used for HRA’sadministrative costs.
The Turner and Main estimate of the cost of site administration is at the low end of therange for the MDRC-evaluated programs (about $1,546 vs. a mean of about $2,042). Moreover,it reflects more hours on assignment: The work obligation in New York City was thirty-five hoursper week, compared with about twenty hours per week in most of the MDRC-evaluatedprograms.321 In some MDRC sites, participation involved considerably fewer hours. For example,in Cook County, Illinois, the Aid to Families with Dependent Children (AFDC) applicants andrecipients assigned to unpaid work experience were expected to participate just twenty to fortyhours per month.322 The economies of operating on a large scale may help explain HRA’s lowercosts. Indeed, the MDRC research indicates that the work experience programs in West Virginiaand Cook County, which had the largest number of work experience positions, also had thelowest costs per filled slot.
Participant monitoring (especially the sanctioning process). The MDRC researchers alsoestimated the costs associated with monitoring participant compliance, primarily the costsassociated with the sanctioning process. Those costs ranged from about $44 to about $1,194 perparticipant.323 The annual cost per slot ranged from about $37 to $5,190. The mean cost wasabout $2,228, and the median cost was about $2,316.324
Turner and Main apparently did not include the cost of monitoring recipients and thesanctions process in their cost estimate. We assume that such costs would be at least as high asthe costs in the MDRC projects (about $2,234 per slot per year). This assumption may still resultin an underestimation of the direct cost of the WEP because HRA’s sanction process involves amuch larger share of the caseload than any of the work experience programs evaluated by MDRC.HRA refined the process to the point that costs per case may be significantly lower than theywould be if sanctioning were less frequent. For example, in November 2001 about one-third ofthe city’s engageable caseload either had a sanction in effect or was in the process of beingsanctioned. In contrast, Brock, Butler, and Long report that “sanctions were not used extensively

325Brock, Butler, and Long, Unpaid Work Experience for Welfare Recipients, p. 73.
326Amy Brown, Work First: How to Implement an Employment-Focused Welfare Reform (Washington,D.C.: Manpower Demonstration Research Corporation, March 1997), p. 55. The Center for Law and Social Policyused the midpoint of this range, $3,000, for its 2002 analysis of the Bush Administration’s TANF workparticipation proposal (also excluding child care costs). By not adjusting the MDRC estimate for inflation from1993 to 2002, the CLASP analysis may understate the annual cost of a work experience position by more than$600. See Mark Greenberg, Elise Richer, Jennifer Mezey, Steve Savner, and Rachel Schumacher, At What Price?A Cost Analysis for the Administration’s Temporary Assistance for Needy Families (TANF) Work ParticipationProposal (Washington, D.C.: CLASP, April 15, 2002), p. 18, available from:www.clasp.org/DMS/Documents/1023208530.14/At_What_Price_anaylsis.pdf, accessed March 5, 2003.
327Sheila Dacey, Congressional Budget Office, conversation with Peter Germanis, January 27, 2003.
328For example, some families do not need a child care subsidy because they receive free child care fromfriends and relatives or because their children are in Head Start, preschool, or school. In addition, some familiesmay not be aware of their eligibility or may not apply because of the stigma associated with subsidized child care.
116
at the study sites.”325 Of course, sanctions also reduce the cost of benefits, which ideally should bereflected in the cost of a work experience slot.
As the foregoing indicates, the MDRC estimates of the cost of work experience programsvary considerably, making it difficult to generalize. Nevertheless, because the costs associatedwith most of the programs were in the middle of this range, many analysts have narrowed thisrange to develop cost estimates for program administrators and policy analysts exploring federaland state welfare reform options. For example, Amy Brown, a senior associate at MDRC,concluded that the cost of filling a work experience position (excluding child care costs) for oneyear would be between about $2,546 and about $5,091.326 More recently, Sheila Dacey, an analystat the U.S. Congressional Budget Office (CBO), estimated that the annual cost of a twenty-hour-per-week work experience slot (excluding child care) would be about $3,300 and that a forty-hour-per-week slot would cost about $3,700.327 Because Brown and Dacey both relied on theearlier MDRC research, it is not surprising that all three estimates are relatively close.
Support services. The foregoing cost estimates do not include costs for child care andtransportation, often needed if a mother is to work. Some Temporary Assistance for NeedyFamilies (TANF) recipients may also need to resolve other issues, such as lack of stable housing,medical or legal issues, or family or personal issues, in order to participate in activities. Becausewe have no data on the later, we offer cost estimates only for child care and transportation.
Child care. HRA, as well as all other jurisdictions, provides child care subsidies formothers who participate in work experience programs. Four variables go into an estimate of thecosts of child care subsidies: (1) the cost associated with a child care slot, (2) the number ofchildren per family receiving a child care subsidy, (3) the percentage of welfare families with aneligible child, and (4) the take-up rate of the subsidy. (For various reasons, many families do notobtain a subsidy.)328

In some cases, the value of the subsidy may not be sufficient to offset the hassle associated with applying andmaintaining eligibility, particularly when relatively large copayments are required.
329Sheila Dacey, conversation with Peter Germanis, January 27, 2003.
330See, e.g., Ann Dryden Witte and Magaly Queralt, Take-Up Rates and Trade Offs After the Age ofEntitlement: Some Thoughts and Empirical Evidence for Child Care Subsidies (Wellesley, MA: Wellesley College,Department of Economics, March 2002).
331Mark Greenberg, Elise Richer, Jennifer Mezey, Steve Savner, and Rachel Schumacher, At What Price?A Cost Analysis for the Administration's Temporary Assistance for Needy Families (TANF) Work ParticipationProposal (Washington, D.C.: CLASP, April 15, 2002), p.21, available from:www.clasp.org/DMS/Documents/1023208530.14/At_What_Price_anaylsis.pdf.
117
Although the MDRC researchers collected information about the costs of child care, theirestimates are of limited usefulness in the post TANF world, and are undoubtedly low for currentprogramming. When the programs operated in the mid-1980s, mothers with children under age sixgenerally were exempt from work activities. Thus, most of the participating mothers did not needchild care because they had children who were in school or had someone at home to care forthem. In addition, most of the MDRC programs had relatively short participation mandates, so itmay have not been worth the bother for families to obtain child care assistance. Today, afteralmost a decade of expanded subsidies, the child care infrastructure has grown, making it easierfor families with a subsidy to find an acceptable and accessible provider. Thus, most analysts donot use MDRC data on child care costs.
Sheila Dacey used administrative data on child care subsidies under the Child Care andDevelopment Fund (CCDF) to estimate child care costs for work experience programs.329 Sheestimated that the annual cost of child care for a child in CCDF-funded child care was about$4,000, including both full-time and part-time child care. The administrative data also indicatedthat about 1.68 children per family received subsidies, resulting in an estimated annual cost ofabout $6,720 per family. She further estimated that 86 percent of TANF families included a childunder age thirteen and were eligible for a subsidy and that 50 percent of eligible families wouldactually use the subsidy. (She chose the 50 percent take-up rate for eligible welfare familiesbecause of research from several state programs.)330 Dacey thus estimated that the annual cost ofchild care for a twenty-four-hour-per-week work slot would be about $2,900. She also estimatedthat child care cost for a full-time work slot would be about 10 percent higher, or about $3,200.
A similar national estimate of child care costs was made by Mark Greenberg and hiscolleagues at the Center for Law and Social Policy (CLASP). Using CCDF administrative data for2000, they estimated that the per child cost of a child care subsidy was about $3,896, with 1.68children per family receiving a subsidy. The CLASP estimate assumes a take-up rate of 52percent. This rate was slightly higher than the take-up rate assumed by CBO, but it factored in thefact that not all welfare families had children under age thirteen. That formula resulted in anestimated child care cost of about $3,404 per work slot.331 (This estimate was about $500 higherthan the CBO child care estimate for a twenty-four-hour-per-week work slot because CLASP

332Greenberg, Richer, Mezey, Savner, and Schumacher, At What Price?, p.21.
333Paul Lopatto, “Where Have All the New Child Care Dollars Gone?” Inside the Budget, no. 111,December 12, 2002, p. 1.
334Seth Diamond, former deputy commissioner for Operations, New York City Human ResourcesAdministration, conversation with Marie Cohen, December 20, 2001.
118
assumed a higher take-up rate and did not adjust the data to reflect the percentage of families withage-eligible children.) Unlike the CBO, the CLASP estimate did not estimate a higher cost forfull-time child care, but the researchers cautioned that their estimate might be low:
First, the FY 2000 data [CCDF administrative data] reflects child care costs for a mixtureof families with full- and part-time participation, while participants here would typically befull-time participants. Second, as states seek to engage families with the most seriousbarriers, there will be a higher share of new participants with children with disabilities,along with a greater need for sick child care, and night and weekend care. The fact thatsuch care is limited in supply and often expensive when available suggests higher thanaverage costs for these new participants. Third, CCDF participants are a mixture of TANFrecipients, former TANF recipients, and other low-income families; families with relativelylower incomes generally receive larger subsidies, since they have reduced or no copaymentrequirements. Accordingly, applying the average expenditure for all families to these newTANF recipients engaging in full-time work activities does not reflect that some CCDFfamilies were only receiving part-time care or receiving partial subsidies.332
HRA’s child care costs per slot are apparently higher than these national estimates. NewYork City’s Independent Budget Office, for example, reports that in 2002 the average annual costof subsidized child care per child was about $6,605, considerably higher than the $4,000 per childestimate used by the CBO.333 Applying the CBO’s assumptions of 1.68 children per familysuggests a cost per family of about $11,096; applying CBO’s assumptions of 86 percent of TANFfamilies with a child under age thirteen and a 50 percent take-up rate results in an estimatedannual child care cost of about $4,771 per WEP slot. (We have no data on take-up rates or totalcosts.)
These estimates are rough. For example, whether the cost of a part-time or part-day slot isconsiderably less expensive than a full-time slot depends on the actual number of hours involvedand the availability of child care providers willing to provide part-time or part-day care. Similarly,the take-up rate might well rise in a full-engagement regime.
Transportation. Recipients may need financial help getting to worksites and to otherprogram activities. HRA assists TANF recipients with transportation. Every two weeks, $34 isadded to the welfare checks of WEP participants so that they can buy two weekly unlimitedfarecards. (The unlimited farecard has the added advantage of helping recipients who have tomake separate stops at child care providers.334)

335Seth Diamond, conversation with Marie Cohen, December 20, 2001.
336For more ideas, see Carolyn Jeskey, Linking People to the Workplace (Washington, D.C.: CommunityTransportation Association of America (CTAA), revised January 2001), available from:www.ctaa.org/ntrc/atj/toolkit, accessed September 19, 2001; Community Transportation Association of America,Access to Jobs: A Guide to Innovative Practices in Welfare-to-Work Transportation (Washington, D.C.: CTAA,updated July 1999), available from: www.ctaa.org/ntrc/atj/pubs/innovative/, accessed September 19, 2001; MargyWaller and Mark Allen Hughes, Working Far From Home: Transportation and Welfare Reform in the Ten BigStates (Philadelphia: Public/Private Ventures and Washington, D.C.: Progressive Policy Institute, July 1999),available from: www.ppionline.org/documents/far_from_home.pdf, accessed September 19, 2001.
337Brown, Work First, p. 55
338Greenberg, Richer, Mezey, Savner, and Schumacher, At What Price?, p.21.
119
This benefit adds $884 to the annual cost of a WEP slot. HRA has no assurance,however, that the money is actually spent on transportation. As Seth Diamond explains, “Wedon’t know that they are buying the farecards, but we hope they are.”335 (Other jurisdictions havehelped TANF recipients set up van services to transport participants to activities.)336
Education and treatment services. Most recipients also participate in one or more of anextensive array of education and treatment services. We have no information on the costsassociated with those services in New York City, but they could easily exceed the cost of workexperience activities. For example, Amy Brown, a MDRC researcher, compared the costs ofvarious program activities for five welfare-to-work programs. She reported that the cost of“basic education” and “vocational training and college” ranged from about $2,037 to about$8,911 per participant, considerably higher than the about $433 to about $1,782 for workexperience in the same programs.337 As we will see, determining whether the financial benefits ofHRA’s WEP program exceed its costs depends on how much those services cost.
Total costs. Based on the foregoing, we estimate that HRA’s costs for site administration(about $1,546), participant monitoring (about $2,228), child care (about $4,771), andtransportation ($884) total about $9,429 per slot per year. As noted above, even this costestimate may be low, because the cost of the sanctioning process may be understated. It alsodoes not take into account the cost of providing other education, training, treatment, or supportservices that may be associated with WEP.
By way of comparison, both the CBO and CLASP estimates are lower. The CBO’sDacey estimates that the annual cost of a twenty-four-hour-per-week work experience slot,including child care, was about $6,200 and about $6,900 for the cost for a forty-hour-per-weekwork experience. The CLASP estimate for 2003 would be about $6,476.338

339The findings for AFDC and AFDC-UP are reported separately in four of the programs evaluated.
340Brock, Butler, and Long, Unpaid Work Experience for Welfare Recipients, p. 32. Their assessment alsoincludes findings from the four programs targeted to two-parent families.
341Authors’ calculations based on Brock, Butler, and Long, Unpaid Work Experience for WelfareRecipients, tables 11 and 13.
342See the discussion: “WEP activities.”
343Turner and Main, “Work Experience Under Welfare Reform,” p. 302.
120
Monetary Benefits
Counterbalancing the costs is (1) the value of the services provided by WEP participants,plus (2) the possible reductions in welfare caseloads and payments. (We consider benefits to theCity, only, not to other levels of government or recipients because of data limitations.)
Value of services. Based on MDRC studies of twelve programs in seven sites,339 Brock,Butler, and Long concluded that the work performed by work experience participants was ofvalue to the government and nonprofit organizations where they worked.340 Most supervisorsand participants rated the work as necessary, and almost all the supervisors surveyed said thatthe work would be done by regular staff if unpaid welfare recipients were not available.
The MDRC researchers estimated the value of output from the work experienceassignments by using information from the surveys of supervisors who assessed the productivityof work experience participants compared with regular workers. Their assessment was expressedin percentage terms and multiplied by the wage rates of the regular workers to estimate thehourly value of participants’ work hours in work experience. This “wage rate” was thenmultiplied by the participants’ number of work hours to derive the value of their output.
Using this procedure, the MDRC researchers estimated that the annual value of theoutput produced by each participant ranged from about $1,138 to about $5,837. The annualbenefit associated with each slot ranged from about $4,231 to about $11,065.341 The meanannual value per slot filled was $6,715, and the median was $6,163.
By all accounts, HRA’s WEP placements resulted in “real work” that provided “real”benefits to the community.342 Turner and Main report that immediately before the introduction oflarge numbers of welfare workers in New York City’s parks, the parks had an “acceptablecleanliness” rating of 74 percent. With the introduction of welfare workers to a peak of morethan 3,000 full-time worker equivalents, the acceptable cleanliness rating of the city’s parksclimbed from 74 percent to 95 percent, an increase that they attribute largely to WEP.343
According to Demetra Nightingale and her colleagues,

344Demetra Smith Nightingale, Nancy Pindus, Frederica D. Kramer, John Trutko, Kelly Mikelson, andMichael Egner, Work and Welfare Reform in New York City During the Giuliani Administration: A Study ofProgram Implementation (Washington, D.C.: Urban Institute, July 2002), pp. 39 and 41.
345Community Voices Heard, Welfare to Work: Is It Working? The Failure of Current Welfare-to-WorkStrategies To Move the Hardest To Employ Into Jobs (New York: Community Voices Heard, 1999) p. 6, availablefrom: www.cvhaction.org/Publications.html, accessed January 23, 2002.
346According to Elizabeth Zeldin, an assistant budget and policy analyst in New York City’s IndependentBudget Office, a low-level, full-time worker at the Department of Parks and Recreation earned about $21,000 in1999. See Elizabeth Zeldin, “Use of Work Experience Program Participants at the Department of Parks andRecreation,” Inside the Budget, no. 72, November 1, 2000, p. 3. But see Robert Lerman and Eric Rosenberg, TheBenefits and Costs of New York City Workfare (unpublished paper, January 2, 1997), suggesting that, in the mid-1990s, “the cost of one low level Parks employee is approximately $29,000 per year.”
121
[a] Parks Department administrator indicated that participants in WEP have accountedfor up to about 20 percent of the agency’s maintenance staff. The Parks Departmentcredits, in part, the presence of the WEP workers for marked improvements in its internalratings for the cleanliness of the City’s public parks. WEP participants work side-by-sidewith regular Parks Department maintenance staff, although WEP workers aredistinguishable by their uniforms.344
Also, as mentioned earlier, Community Voices Heard (CVH), a citywide organization of welfarerecipients, surveyed 649 WEP participants at 131 worksites in 1999 and 2000; most respondentsreported doing the same work as regular municipal employees. CVH also found that WEPworkers were performing 35 of the 36 tasks in three union job titles.345 (The survey included amixture of TANF and SNA recipients, but the findings were not reported separately.)
Because the maximum number of hours a welfare recipient can be required to work isbased on the amount of the welfare grant plus the value of food stamps divided by the minimumwage, one way of valuing the output produced by WEP participants is to base it on the minimumwage multiplied by the number of hours worked. Thus, a twenty-hour-per-week WEP slot wouldproduce services valued at about $5,150 per year ($5.15 multiplied by 1,000 hours), and a thirty-five-hour-per-week slot would produce services valued at about $9,000 per year ($5.15multiplied by 1,750 hours).
The minimum wage approach may substantially underestimate the value of the servicesperformed by WEP participants. Hence, we also could use MDRC’s approach, which wouldapply the hourly cost of a city worker doing the same work. Because at least two surveysindicate that WEP participants perform real work and are nearly as productive as regular cityworkers performing similar tasks, we could use the salary of a low-level, full-time worker at theDepartment of Parks and Recreation (about $23,189 per year) as a proxy for the value of thework of WEP participants.346 (Some would suggest a higher valuation of the services providedbased on a comparison of specific services to associated salaries, but we refrain from doing so.)Thus, we estimate that the annual value of work produced by a WEP participant in twenty-hour-

347Robert Lerman and Eric Rosenberg, The Benefits and Costs of New York City Workfare (unpublishedpaper, January 2, 1997). The work in the paper was completed at a time when most WEP participants wererecipients of Home Relief (New York City’s general assistance program), not AFDC.
348Lerman and Rosenberg, The Benefits and Costs of New York City Workfare, pp. 18-19. The work in thepaper was completed at a time when most WEP participants were recipients of Home Relief (New York City’sgeneral assistance program), not AFDC.
349Lerman and Rosenberg, The Benefits and Costs of New York City Workfare, p. 16.
350Lerman and Rosenberg, The Benefits and Costs of New York City Workfare, p. 16.
122
per-week assignments could be about $11,595. For a participant in a thirty-five-hour-per-weekassignment, the value of output produced could be nearly $20,290.
Along these lines, Robert Lerman and Eric Rosenberg of the Urban Institute conducted arough benefit-cost analysis of the WEP program as it existed in 1996. They interviewed twenty-two managers at WEP sites in five New York City agencies.347 The managers rated the quality ofthe WEP workforce only slightly below that of city workers, on average, and they all indicatedthat they would accept more WEP workers. Lerman and Rosenberg noted that the costassociated with administering WEP was $9.4 million. Using a cost estimate of $29,000 per yearfor a low-level Parks Department employee, they concluded that the benefits of the programexceeded the costs:
Since $9.4 million would hire an additional 325 Parks workers, each of the city’s 20,000WEPs would need to be less than 1/30th as efficient as the average city employee(keeping in mind that WEP workers work half-time), for the WEP program to be costineffective—the least efficient workers recorded in the departmental survey were onequarter as efficient.348
The survey also indicated, however, that WEP workers were performing tasks that werepreviously done much less often. As a result, although their work may have been important, itmay not have been valued as much as the ongoing work of the city. Lerman and Rosenbergexplain, “Though the value of having the brass in the city court house polished more often maynot have direct economic value, it has the secondary benefit of helping of maintain the dignityand stature of the rule of law.”349 They also suggest that the work may have other, less tangible,benefits: “Cleaner parks and streets improve overall city morale and make for a more pleasantenvironment in which law abiding citizens can congregate and drive down the number ofdesolate, abandoned spaces where crimes or criminal dealings can occur.”350 This analysissuggests caution in comparing the value of the work produced by WEP workers with that ofother city workers.
Reduced welfare payments. Theoretically, a well-functioning work experience programshould reduce welfare caseloads and, because of sanctions, the payments to the families

351See Blanche Bernstein, The Politics of Welfare: The New York City Experience, p.42.
352Swati Desai, then executive deputy commissioner, Office of Program Reporting, Analysis, andAccountability, New York City Human Resources Administration, e-mail to Douglas Besharov, June 17, 2003.
353Vivian S. Toy, “Tough Workfare Rules Used As Way to Cut Welfare Rolls,” New York Times, April 15,1998, p. A1.
354See the discussion: “Combining work and welfare.”
123
remaining on welfare. Unfortunately, we have no basis for estimating the first effect and canmake only a rough estimate of the second.
Reduced welfare caseloads. Many experts believe that work experience programsdiscourage families from applying for welfare and facilitate and encourage those receivingassistance to leave.351 One HRA official explained that “by design, WEP was also intended toreduce caseloads by providing participants with job experience and skills necessary to findemployment.”352 In addition, work experience programs appear to “smoke out” recipients whoare working (usually under the table) and encourage nonworking recipients to find a job, becausetheir choice is either unpaid work experience or a “real job.” As an article in the New York Timesdescribes,
Workfare has also had a less direct effect on the size of the welfare rolls: It hascontributed to what welfare experts call a “smoke-out effect,” pushing people off welfarewhether they have jobs or not.
In some cases, welfare recipients who were already working off the books have decidedto leave the rolls, experts say. There are no reliable estimates of how many people fallinto that category, but welfare experts say that because it is virtually impossible tosurvive on welfare benefits alone, a significant number of welfare recipients probably relyon other sources of income.353
Other aspects of HRA’s program, however, such as accessability to quality education andtraining services, might attract families to welfare or at least give them an incentive to stay on.Similarly, the pre-TANF tendency of earnings disregards to encourage families to stay on welfareis well documented. Whether families do so under time limits or mandatory participation regimesare still open questions.354
Some of the MDRC projects described above isolated the impact of work experience onwelfare expenditures and tax revenues associated with changes in employment and found that

355Most of the programs combined work experience with other services and could not isolate the impact ofwork experience alone. Total benefits exceeded total costs in two of the three programs for single parents, with anet gain of $1,001 in West Virginia and $997 in San Diego ($1,227 and $1,222 in 2001 dollars, respectively).[Brock, Butler, and Long, Unpaid Work Experience for Welfare Recipients, table A.2.] Reductions in welfareexpenditures and increases in tax revenues accounted for about 12 percent to the net gain in West Virginia andabout 60 percent of the net gain in San Diego.
124
benefits exceeded total costs.355 Unfortunately, we do not have similar data for New York City;hence, we do not include such likely effects in our calculations here.
Higher sanction rates. Work experience programs can reduce welfare payments byencouraging welfare recipients to find work and by imposing sanctions for those who fail tocomply with the participation requirements. Unlike the MDRC projects, however, a large portionof the HRA caseload is under a partial sanction, and it is possible to estimate (very roughly, ofcourse) the amounts saved.
In November 2001, 15,738 Family Assistance (FA) cases were receiving reduced benefitsdue to a sanction, compared with just 10,127 FA cases participating in WEP. Assuming a familyof three, each sanction case would bring savings of about $270 in monthly TANF and FoodStamp benefits. Assuming that all the sanctions were due to nonparticipation in WEP, the annualsavings per WEP slot would be about $5,035. (About $936 of this amount would be in FoodStamp savings, which would accrue to the federal government, not the city.)
A net monetary benefit?
To recapitulate, we estimate the following costs and benefits for HRA’s WEP program:
Costs (2003 $) Site administration $1,546 Participant monitoring 2,228 Child care 4,771 Transportation 884 Education and treatment Unknown
Total Costs $9,429
Benefits (2003 $) Value of services $5,150–
$20,290 Depending on how services arevalued and if 20 or 35 hours ofwork per week
Reduced caseload Not available

356This includes $936 in Food Stamp savings that accrue to the federal government.
125
Reduced welfare payments 5,035 Savings from sanctions, but noestimate of savings or costs asrecipients combine work andwelfare
Total Benefits $10,185–$25,325
Net benefit $756–$15,896356
Depending on (1) the costs ofeducation and treatmentservices, (2) the valuation ofthe services provided, and (3)the possible caseload reduction
Given the paucity of information and evaluation, the net benefit is necessarily expressedas a range ($756 to $15,896). Another way of viewing the benefits versus costs of HRA’s WEPis as follows: Even using the most conservative estimate of the benefits of work experience (i.e.,a part-time slot at the minimum wage, or $5,150), because of the savings from sanctions (about$5,035), our estimate is that WEP benefits covered the cost of site administration and participantmonitoring (about $3,774) as well as the costs of child care and transportation (about $5,655).This conservative valuation of the services provided by recipients would not exceed total costs,however, once expenditures on ancillary education and treatment services were factored in. Thecosts of such services would be covered only if the value of the participants’ work were set atthat of low-level city workers or if the work assignment were full-time.

126

357In 1940, about one-third of children entering the program were eligible because of a deceased parent,about one-third because of an incapacitated parent, and about one-third because of another reason for absence(including divorce, separation, or no marriage tie).
358U.S. Department of Health and Human Services, Administration for Children and Families, “CashAssistance for Needy Families–Aid to Families with Dependent Children (AFDC) and Temporary Assistance forNeedy Families (TANF): 1936-2001,” available from: www.acf.dhhs.gov/news/stats/3697.htm, accessed October13, 2002.
127
X. THE CASELOAD DECLINE
The Aid to Families with Dependent Children (AFDC) program was created in 1935 aspart of the new Social Security Act. AFDC was essentially tailored after the old Mother’sPension Laws, which assumed that mothers would not work and that fathers were unavailable tohelp support the family (due to death, disappearance, or disability). Welfare policy is stillstruggling to shed this legacy of having been structured as an aid program for nonworkingwidows (even though, from the very beginning of the AFDC program, many divorced and unwedmothers received benefits).357
For more than half a century, it seemed that caseloads could only grow. Through the1960s and early 1970s, at least, the focus of progressive social policy was to expand eligibilityand to ensure that eligible families received benefits. Between 1960 and 1977, the program morethan quadrupled, going from about 800,000 families to more than 3.5 million families (see figure10).358

128
Figure 10. Welfare’s Growth and Decline, United States, 1960–2002
Millions of families
1960 1970 1980 1990 2000
+344%
+8%
+35%
–59%
5
4
3
2
1
June 2002
Sources: For caseload from 1936 to 1999: U.S. Department of Health and HumanServices, Administration for Children and Families, ACF News, Statistics, U.S. WelfareCaseloads Information: Temporary Assistance for Needy Families (TANF), 1936-1999,last updated: 12/14/00 Friday, July 27, 2001, available from:www.acf.dhhs.gov/news/stats/3697.htm, accessed April 29, 2002; for caseload in 2000and 2001: U.S. Department of Health and Human Services, Office of Planning, Researchand Evaluation, Temporary Assistance for Needy Families Program (TANF): FourthAnnual Report to Congress (Washington, D.C.: U.S. Department of Health and HumanServices, April 2002), tables 2:1a and 2:1b, pp. II-13 and II-15 available from:www.acf.dhhs.gov/programs/opre/ar2001/chapter02.pdf, accessed May 23, 2002; forcaseload in 2002: Elise Richer, Hedieh Rahmanou, and Mark Greenberg, “TANFCaseloads Declined in Most States in Second Quarter, But Most States Saw IncreasesOver the Last Year,” October 1, 2002, available from:www.clasp.org/DMS/Documents/1033487945.66/caseload_2002_Q2.pdf, accessedOctober 13, 2002; for percentage change from previous year: authors’ calculation; forunemployment rate: U.S. Census Bureau, Statistical Abstract of the United States,various years.Notes: Cases represent total number of families on welfare, which was called “Aid toDependent Children” from 1936 to 1962, “Aid to Families with Dependent Children”(AFDC) from 1962 to 1996, and “Temporary Assistance for Needy Families” from 1996to 2002. Totals include AFDC Unemployed Parent program.

359Between 1994 and 2000 (the most recent year for which we have data on the race of recipients), theAFDC/TANF caseload declined by 55 percent. In that period, the number of white families on welfare showed thesteepest decline falling by 63 percent, while the number of black families on welfare fell by 52 percent, and thenumber of Hispanic families by 44 percent (with immigration presumably countering what would have been alarger decline). [U.S. Department of Health and Human Services, Office of Planning, Research, and Evaluation,Temporary Assistance for Needy Families (TANF) Program: Fourth Annual Report to Congress (Washington,D.C.: U.S. Department of Health and Human Services, April 2002), p. X-192, available from:www.acf.dhhs.gov/programs/opre/ar2001/indexar.htm, accessed October 13, 2002.]
360Elise Richer, Hedieh Rahmanou, and Mark Greenberg, “TANF Caseloads Declined in Most States inSecond Quarter, But Most States Saw Increases Over the Last Year,” October 1, 2002, available from:www.clasp.org/DMS/Documents/1033487945.66/caseload_2002_Q2.pdf, accessed October 13, 2002.
361Douglas J. Besharov, “Welfare Rolls: On the Rise Again,” The Washington Post, July 16, 2002, p. A17.
362The following categories of individuals and families are eligible for New York State’s Safety NetAssistance (SNA) program: “single adults; childless couples; children living apart from any adult relative; familiesof persons abusing drugs or alcohol; families of persons refusing drug/alcohol screening, assessment or treatment;persons who have exceeded the 60-month limit on assistance; aliens who are eligible for temporary assistance, but
129
A 59 Percent Decline
In 1994, welfare caseloads reached their historic high of 5.1 million families (about 15percent of all American families with children). That year, however, caseloads began a seven-year decline: Between March 1994 and July 2001, they fell 59 percent. Caseloads droppedalmost everywhere—in suburbs, rural areas, and even most inner cities. Declines were substantialfor whites, blacks, and Hispanics alike.359 When welfare reform began, no one, not even thestrongest proponents of the original Temporary Assistance for Needy Families (TANF)legislation, predicted a decline of this size and scope.
Around July 2001, caseloads stopped declining in most states and started rising again,presumably because of the weakening economy. Although about ten states experienced caseloadincreases of from 10 to 20 percent between then and June 2002,360 the nationwide rise has beensurprisingly modest.361
New York State’s welfare program, Temporary Assistance (referred to as PublicAssistance in New York City), is actually two separate programs:
• The Family Assistance (FA) program provides cash assistance to needy families with oneor more minor children living with a parent or other caretaker relative. It operates underthe federal TANF program: FA families are subject to such TANF provisions as its workrequirements and five-year limit on benefits. The program is funded by a combination offederal (50 percent), state (25 percent), and local funds (25 percent).
• The Safety Net Assistance (SNA) program, with origins in the state’s Home Reliefprogram, originally provided benefits only to single adults or couples without children.362
who are not eligible for federal reimbursement.” [New York State Office of Temporary and Disability Assistance,“Temporary Assistance,” available from: www.otda.state.ny.us/otda/ta/default.htm, accessed June 17, 2002.]
130
However, since December 2001, the program has experienced a sharp increase in thenumber of families with children (as FA families reaching their five-year time limit losetheir eligibility for FA and are converted to SNA). Generally, SNA cash assistance isavailable for a cumulative two years in a lifetime, after which some portion of aid,primarily that portion intended for rent and utilities, is to be provided in non-cash form,such as a two-party check or a voucher. (It is not clear that the noncash aspect of theprogram has been implemented.) The program is funded equally by state and local funds.
Decline. Significantly, the decline in the FA caseload was greater than the nationaldecline (71 percent), falling from 318,681 to 93,645 between March 1995 and July 2002. This issomewhat misleading, however, because about 38,000 of the families were no longer receivingFA as a result of the five-year time limit; those families were simply converted to SNA, underwhich they continued to receive the same level of benefits. The decline in the FA caseload wouldhave been about the same as the national decline (59 percent) if the converted cases were stillcounted as part of the FA caseload (see figure 12). In fact, as will be seen in figure 16, the trendin the city’s caseload closely tracks the national trend throughout this same period. (Unlessotherwise noted, we use the official Human Resources Administration (HRA) caseload data,which exclude from the FA case count the FA cases that hit their five-year time limit and wereconverted to SNA. In accordance with HRA practice, those cases are included in the SNAcaseload figures.)
Although the nationwide caseload reached its lowest point in July 2001 and has sincestarted to increase or at least level off, New York City’s caseload continued to decline at leastthrough July 2002, the latest month for which data are available at this writing. Figure 11portrays welfare’s growth and decline in New York City between 1960 and 2002. It shows thatthe FA caseload would have continued to decline even after including the FA cases that wereconverted to SNA.

363The FA caseload began declining in March 1995, but we start with 1994, because the caseloads werevirtually identical in those two years and it facilitates comparisons with the national caseload decline, the SNAcaseload decline, and the FA caseload decline in the rest of the state, which all began in 1994.
131
Safety Net Assistance (SNA)
Family Assistance (FA)
1960 1970 1980 1990 2000
Thousands of cases
SNA5-year limit(12/01–07/02)
Figure 11. Welfare’s Growth and Decline,New York City, 1960–2002
+445%
+10%
+56%
–63%
600
500
400
300
200
100
–10%
Sources: For 1960–2001: New York City Human Resources Administration, Office ofProgram Reporting, Analysis, and Accountability, unpublished data, April 3, 2002; for2002: New York City Human Resources Administration, Office of Program Reporting,Analysis, and Accountability, HRA Facts, available from:www.nyc.gov/html/hra/html/hrafacts.html, accessed January 20, 2003.Notes: Before 1998, Family Assistance was called “Aid to Families with DependentChildren.” SNA denotes the FA cases that were converted to SNA after exhausting theirfive-year, time-limited benefits.
Until 2000, New York City’s FA caseload declined at a slower pace than the caseload inthe rest of the state. Between 1994 and 2000, the city caseload declined 43 percent, comparedwith a drop of 53 percent in the rest of the state.363 As a result, New York City’s share of thestatewide caseload grew from 68 percent to 72 percent. This initially slower decline mirrors thenational urban/nonurban pattern. According to Paul Leonard and Maureen Kennedy of theBrookings Institution, “In the 89 urban counties that contain the 100 largest American cities, theaggregate caseload decline between 1994 and 1999 (41 percent) lagged the national decline (52

364Paul Leonard and Maureen Kennedy, What Cities Need from Welfare Reform Reauthorization(Washington, D.C.: The Brookings Institution, January 2002), p. 2, available from:www.brookings.edu/es/urban/publications/leonkencitieswelfare.pdf, accessed February 10, 2002.
365For purposes of presentation, we have included in the FA caseload those cases that hit their five-yeartime limit and were converted to SNA, under which they continue to receive essentially the same benefits.
366Illinois Department of Human Services, Division of Transitional Services, Office of Employment andTraining, Bureau of Program Design and Evaluation, “TANF Case Numbers,” April 29, 2002.
367George Zeller, senior researcher, Council for Economic Opportunities in Greater Cleveland, e-mail toPeter Germanis, May 20, 2002.
132
percent) by a substantial amount.”364 As they imply, this would be consistent with urban areashaving caseloads that are somewhat more disadvantaged and more difficult to help off welfare.
Beginning sometime in 2000, however, New York City’s caseload started to fall fasterthan the caseload in the rest of the state. As a result, the city’s share of the statewide caseloaddeclined from 72 percent to 70 percent (see figure 12).365 (Some observers think the reason maybe that the caseload in the rest of the state could not fall further because the program had alreadyreached the hardest to help or employ). Similar declines were seen in other cities. For example, inCook County, Illinois (which includes Chicago), caseloads fell even faster than in New YorkCity. Between 1994 and March 2002, the caseload declined about 74 percent, from 158,692 to40,578.366 Similarly, in Cuyahoga County (which includes Cleveland), between March 1994 andApril 2002 the caseload declined about 67 percent, from 48,028 to 16,034.367

133
Figure 12. Family Assistance Declines, New York City vs. Rest of State, 1993–2002
Thousands of cases
Rest of state
New York City
% NYS caseload
%
SNA
SNA
1994 1996 1998 2000 2002
500
400
300
200
100
100
80
60
40
20
Source: New York State, Office of Temporary and Disability Assistance, Temporaryand Disability Assistance Statistics (Albany: New York State, Office of Temporary andDisability Assistance, various years).Notes: Before 1998, Family Assistance was called “Aid to Families with DependentChildren.” SNA denotes the Family Assistance cases that were converted to Safety NetAssistance after exhausting their five-year, time-limited benefits.
Initially, the decline in New York City’s SNA caseload was much more rapid than that ofits FA caseload. For example, between 1994 and 1997, the SNA caseload fell 40 percent, whilethe FA caseload fell just 17 percent. Moreover, unlike the FA caseload, between 1994 and 2002the SNA caseload declined at about the same pace as that of the rest of the state (see figure 13).
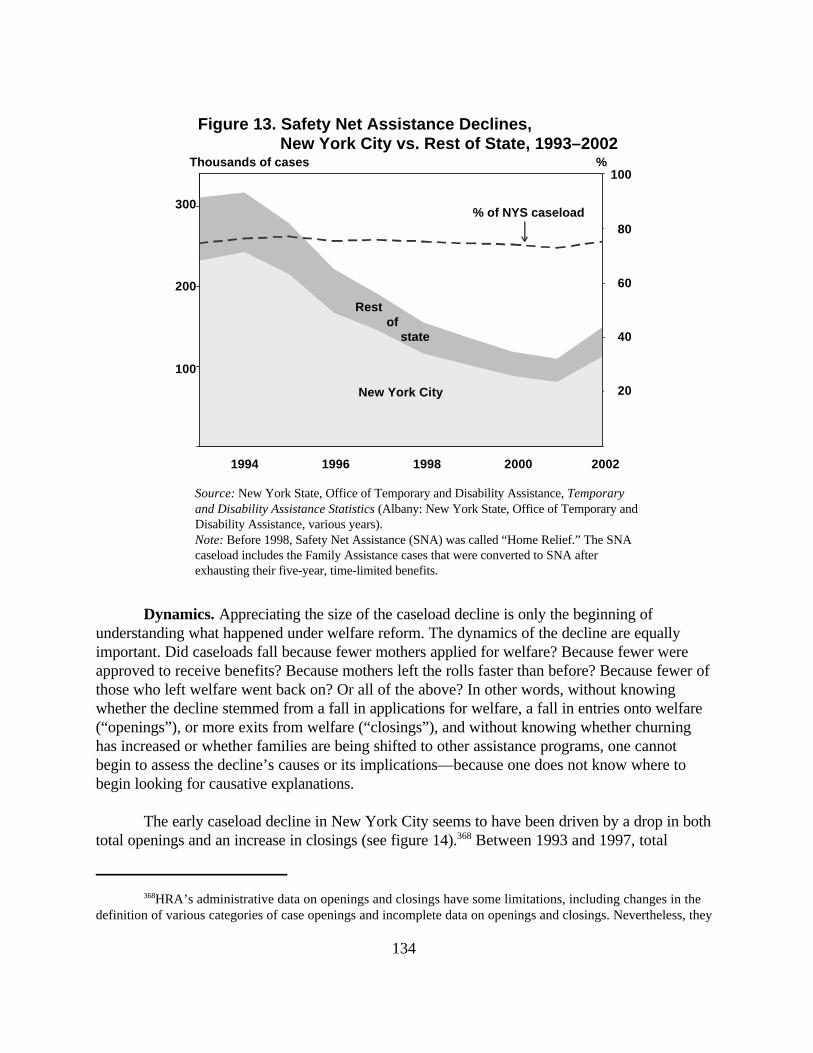
368HRA’s administrative data on openings and closings have some limitations, including changes in thedefinition of various categories of case openings and incomplete data on openings and closings. Nevertheless, they
134
Figure 13. Safety Net Assistance Declines, New York City vs. Rest of State, 1993–2002
Thousands of cases
New York City
% of NYS caseload
%
1994 1996 1998 2000 2002
300
200
100
100
80
60
40
20
Restof
state
Source: New York State, Office of Temporary and Disability Assistance, Temporaryand Disability Assistance Statistics (Albany: New York State, Office of Temporary andDisability Assistance, various years).Note: Before 1998, Safety Net Assistance (SNA) was called “Home Relief.” The SNAcaseload includes the Family Assistance cases that were converted to SNA afterexhausting their five-year, time-limited benefits.
Dynamics. Appreciating the size of the caseload decline is only the beginning ofunderstanding what happened under welfare reform. The dynamics of the decline are equallyimportant. Did caseloads fall because fewer mothers applied for welfare? Because fewer wereapproved to receive benefits? Because mothers left the rolls faster than before? Because fewer ofthose who left welfare went back on? Or all of the above? In other words, without knowingwhether the decline stemmed from a fall in applications for welfare, a fall in entries onto welfare(“openings”), or more exits from welfare (“closings”), and without knowing whether churninghas increased or whether families are being shifted to other assistance programs, one cannotbegin to assess the decline’s causes or its implications—because one does not know where tobegin looking for causative explanations.
The early caseload decline in New York City seems to have been driven by a drop in bothtotal openings and an increase in closings (see figure 14).368 Between 1993 and 1997, total

are the only data available and are consistent with changes in the overall caseload.
135
Thousands of cases
Total openings
Closings
1993 1994 1995 1996 1997 1998 1999 2000 2001
300
250
200
150
100
50
Figure 14. Family Assistance: Total Openings and Closings, New York City, 1993–2001
Total caseload
Source: New York City Human Resources Administration, Office of ProgramReporting, Analysis, and Accountability, unpublished data, April 1, 2002.Notes: Caseload represents the average number of monthly Aid to Families withDependent Children cases before 1998 and Family Assistance cases since 1998. Totalopenings include new applications accepted, reapplications (cases closed longer than 30days that are reopened), and reopenings (cases closed that are reopened within 30 days).Closings represent net closings (closings minus reopenings) and reopenings.
openings declined 31 percent, from 100,359 to 69,534, and closings rose 14 percent, from88,371 to 100,430 (with an intermediate peak of 123,754 in 1996).
The decline in total openings was driven by an especially sharp drop in “new openings”(i.e., new cases for first-time recipients). Between 1993 and 1997, new openings fell 69 percent,from 43,969 to 13,800 (see figure 15). This drop in new openings suggests that at least part ofthe decline was caused by either the economy, work-first policies, or welfare reform’s generalimpact on potential applicants (“entry effects”).
An important question is whether this fall in new openings was caused by applicantsbeing inappropriately discouraged, diverted, or rejected from going on welfare. Many advocates,for example, claim that the approval rate for applications fell sharply, causing much of thedecline. For example, in 1998, Timothy Casey, assistant director of the Policy, Advocacy and
369Timothy J. Casey, “Welfare Reform and its Impact in the Nation and in New York,” Western New YorkLaw Center, August 1998, available from: www.wnylc.net/web/welfare-law/resource-material/welrefor.htm,accessed March 13, 2003.
370See Peter J. Ferrara, “Caesar in Robes: Case Studies in Judicial Administration of New York CityWelfare Programs,” unpublished paper submitted to Baruch College, City University of New York, undated.
136
Research Department of the Federation of Protestant Welfare Agencies, complained that the JobCenters were denying eligible families assistance:
Much of the decline in the caseload may be due to an increase in denials to needy,financially eligible persons resulting from stricter verification requirements and stricteradministration of the work rules. Under Mayor Giuliani, the welfare application rejectionrate rose from 27 percent in 1994 to 54 percent in 1997. The Citizens BudgetCommission concluded in a 1997 report that there was “evidence that elements of the[HRA] initiative are causing otherwise eligible indigent New Yorkers to be denied cashbenefits,” and recommended that “[a]dministrative procedures could be revised to avoidinappropriate rejection of applications and inappropriate closing of cases.”369
That does not seem to be the case, however. We found no evidence of a major change inapproval rates, which would have suggested an increase in diversion or rejected applications.Although the data have problems, it appears that between 1993 and 1996, the approval ratedeclined and then rose, but the decline was not more than about 15 percent. Between 1996 and2001, the approval rate rose from 68 percent to 79 percent (with an intermediate high of 81percent in 2000). Of course, it is possible that potential applicants were discouraged from evengoing to a Job Center or, if they did, were discouraged from formally submitting an applicationfor assistance. In fact, however, the decline in openings, as well as the increase in closings,occurred before any major welfare reforms were implemented in New York City, so other factorswere probably more influential.
Whatever might be the truth of these allegations, it is unlikely that the practices continuedafter a 1999 court decision, Reynolds vs. Giuliani, which forced HRA to make changes in theway it processed applications for cash assistance, food stamps, and Medicaid.370

371Part of the increase in total openings appears to be due to an increase in the approval rate, from 74percent to 79 percent, with an intermediate peak of 81 percent in 2000.
372Douglas J. Besharov, “Leaving Welfare Without Work: How do mothers do it? And what are theimplications?” (paper prepared for the workshop on “Welfare Reform: A Comparative Assessment of French andU.S. Experiences,” Berkeley, Calif., February 2002), available from:www.welfareacademy.org/pubs/leavingwithoutwork.pdf, accessed January 28, 2003.
137
Thousands of cases
New openings (1)
Total openings (1 + 2 + 3)
ClosingsApplications
Reapplications (2)
Reopenings (3)
Figure 15. Family Assistance Applications (Reapplications, New Openings, and Reopenings): Total Openings, and Closings, New York City, 1993–2001
1993 1994 1995 1996 1997 1998 1999 2000 2001
120
80
100
60
40
20
Source: New York City Human Resources Administration, Office of ProgramReporting, Analysis, and Accountability, unpublished data, April 1, 2002.Notes: Approvals and closings are annual totals. Total openings include new openings(new applications accepted), reapplications (cases closed longer than 30 days that arereopened), and reopenings (cases closed that are reopened within 30 days). Closingsrepresent net closings (closings minus reopenings) and reopenings.
After 1997, however, total openings ceased to decline, and between 1997 and 2001, theyrose 31 percent, from 69,534 to 91,375.371 Despite these considerable increases, however,caseloads continued to fall because the number of closings rose. Many former recipientsapparently left welfare for work or other government aid programs or because they were beingsupported by friends and relatives.372
A continued increase in closings is apparently responsible for the caseload decline after1997. Between 1997 and 2001, closings rose 14 percent, from 100,430 to 114,752. Even greaterwas the growth in the number of closings compared with the size of the caseload. In 1997,

373Although New York has a partial sanction for noncompliance with participation requirements, somefamilies may be terminated for failure to comply with various reporting requirements associated with theparticipation requirements.
374Terrence Maxwell, After Welfare: A Study of Work and Benefit Use After Case Closing (RevisedInterim Report) (Albany, NY: The Nelson A. Rockefeller Institute of Government, December 1999), availablefrom: www.otda.state.ny.us/otda/welfare/welfarestudy.pdf, accessed June 21, 2004.
375Howard Rolston, “Comments,” on Patricia Ruggles and Matthew Stagner, “Plans of the Department ofHealth and Human Services,” in Douglas J. Besharov (editor), Family Well-Being After Welfare Reform (CollegePark, MD: University of Maryland, School of Public Affairs, Welfare Reform Academy, 2002), available from:www.welfareacademy.org/pubs/welfare/familywellbeing/familywellbeing-frontmatter.pdf, accessed July 9, 2004.
376Maxwell, After Welfare: A Study of Work and Benefit Use After Case Closing, p. iv.
138
closings equaled just 39 percent of the average monthly caseload, whereas in 2001 they rose to75 percent of the caseload.
If a substantial portion of the caseload decline was caused by an increase in closings, thenan important question would be whether the families were leaving welfare because of betteropportunities or because they were being pushed off welfare.373 This determination is difficult tomake because it is often impossible to know why a family left welfare.
Researchers at the Nelson A. Rockefeller Institute of Government used administrativedata to examine the subsequent employment and welfare experiences of welfare recipients wholeft welfare in New York State during the first quarter of 1997.374 The study was based on astatewide sample of 8,983 cases involving at least one adult and one child that left welfare anddid not return within two months of closing. (The study included a subsample of 4,855 casesfrom New York City.) In the fourth quarter after leaving welfare, only 52 percent of the leaverswere employed; their mean quarterly earnings were $4,630. The actual percentage working wasprobably slightly higher, because some of those who left welfare were employed in another stateand were not captured in the study’s examination of administrative records.375 The researchersestimated that 60 percent of leavers were employed, once out-of-state and off-the-booksemployment were considered, and had mean quarterly earnings of $5,034.376 Only 20 percent hadreturned to welfare, 27 percent received food stamps, and 47 percent received Medicaid (for atleast one family member).
These patterns are roughly in accord with the available evidence from other states andsuggest that nothing was unusual about HRA’s case-closing practices.

377“Churning” refers to very short welfare exits caused by administrative procedures that lead a family tolose aid for a month or two, before returning to the welfare rolls. “Cycling” refers to longer term welfare exits thatare related to employment or other nonadministrative reasons.
378U.S. Department of Health and Human Services, Office of the Assistant Secretary for Planning andEvaluation, “Findings from ASPE Leaver Studies (Appendix B),” July 2001, available from:http://aspe.hhs.gov/hsp/welf-ref-outcomes01/appb.htm, accessed October 13, 2002.
139
Increased Churning and Cycling377
Sometime around 1995, in both the nation as a whole and in New York City, cycling onand off welfare seems to have increased, perhaps because the economy softened or because morerecipients who left welfare with a job or in contemplation of the time limit found that they neededto return to the rolls. (These cases probably mirror the 13 to 30 percent of welfare leavers inother states who tell surveys that they are worse off financially.)378
This process is revealed after subdividing the data on openings by whether they are newopenings or “reapplications” (i.e., families returning for assistance). HRA data are divided intonew openings (i.e., cases for first-time recipients), reapplications (i.e., openings of previous casesthat had been closed longer than thirty days), and “reopenings” (i.e., openings of previous casesthat had been closed by agency error and reopened once the error was connected). (Prior to1996, the reapplications and reopenings are considered together in the reopening category.)Between 1995 and 2001, the number of reapplications and reopenings (combined) grew 46percent, from 50,839 to 74,010, even as the number of new openings remained roughly constantthroughout most of this period.
Only a small number of total openings seem to represent families new to welfare.Between 1993 and 1998, the number of first-time recipients in the city declined from 43,968 to13,458 (from 15 percent of the caseload to 6 percent of the caseload). Between 1998 and 2001,the number of new openings increased slightly (from 13,458 to 17,671), but it remained low.
Moreover, during much of this period, the number of FA reapplications increased.Between 1996 and 2001 (there are no data for earlier than 1996), reapplications increased 142percent, from 25,348 to 61,303, suggesting an increase in cycling because many of those wholeft welfare returned.
It is possible that the increase in reapplications is merely the result of a change inadministrative coding that resulted in reclassifying many reopenings as reapplications. In 1996,HRA decided that only cases closed by agency error or in which a fair hearing decision was inthe recipient’s favor could bypass the application process and be classified as a reopening. As a

379Personal communication from Swati Desai, then executive deputy commissioner, Office of ProgramReporting, Analysis, and Accountability, New York City Human Resources Administration, to Peter Germanis,April 24, 2002.
380Mark Hoover, former first deputy commissioner, New York City Human Resources Administration, e-mail to Peter Germanis, February 5, 2003.
381Maxwell, After Welfare: A Study of Work and Benefit Use After Case Closing.
382Office of the State Comptroller, Staff Analysis of New York State’s Welfare Evaluation Report: AfterWelfare: A Study of Work and Benefit Use After Case Closings (Albany, NY: Office of the State Comptroller,November 2000), p. 1, available from: www.osc.state.ny.us/reports/welfare/welf11-00.pdf, accessed October 8,2002.
140
result, there was a sharp drop in the number of reopenings beginning in 1996, and some casesthat had been considered reopenings were reclassified as reapplications.379
Thus, at least part of this increase in reapplications may reflect not increased cycling butthe inadvertent shift of very short-term case closures to the reapplication category. For example,if a case was closed in error or closed because the recipient failed to comply with reportingrequirements, even if the error could be corrected quickly, the case could only be added back tothe rolls as a reapplication.
We also hypothesize that one of the reasons for the increase in the number ofreapplications is that the reopening process slowed down with the implementation of welfarereform, thereby transforming what would have been reopenings into reapplications. HRAinvested more time and resources in helping applicants find alternatives to welfare and inverifying their eligibility. As a result, it took longer to process an application.380 For example,before welfare reform, if a family did not comply with reporting requirements and its case wasclosed, it could often return to the rolls within thirty days simply by submitting the requiredreports. After welfare reform, the family would have to go through a more formal reapplicationprocess, which could take up to forty-five days.
In any event, there appears to have been a steady increase in reapplications, indicatingmore cycling.
The HRA data have some limitations, and on their own, they might not be sufficient toconclude that churning sharply increased. Other research, however, seems to confirm thisconclusion. One of the more interesting findings of the study of welfare leavers conducted by theRockefeller Institute of Government381 was not reported by the researchers themselves but wasraised in a critique of the study by the Office of the State Comptroller. According to theComptroller’s analysis, the study “failed to disclose the fact that some 3,300 families (out of thesurvey group of 12,000) who left the welfare rolls came back onto the rolls within twomonths.”382 It further added:

383Office of the State Comptroller, Staff Analysis of New York State’s Welfare Evaluation Report: AfterWelfare, p. 1.
384These measures are not precise indicators of the extent of churning, because they do not parse out theproportion of new cases that are first-time welfare recipients from those who are returning to the rolls. However,the increased rate of entries and exits is suggestive of increased churning.
385Mark Greenberg, Elise Richer, Jennifer Mezey, Steve Savner, and Rachel Schumacher, At What Price?A Cost Analysis for the Administration's Temporary Assistance for Needy Families (TANF) Work ParticipationProposal (Washington, D.C.: CLASP, April 15, 2002), p. 12, available from:www.clasp.org/DMS/Documents/1023208530.14/At_What_Price_anaylsis.pdf, accessed March 5, 2003.
386See, e.g., Sandra L. Hofferth, Stephen Stanhope, and Kathleen Mullan Harris, “Remaining Off Welfarein the 1990s: The Influence of Public Policy and Economic Conditions,” February 27, 2002, available from:www.popcenter.umd.edu/people/hofferth_sandra/online.shtml, accessed September 30, 2002, concluding that somepolicies are likely to increase churning. Hofferth and her colleagues used the Panel Study of Income Dynamics(PSID) to examine the welfare recidivism rate among women who headed their own household sometime between1989 and 1996. They used regression analysis to control for relevant demographic, economic, and policy variables.They observed:
The risk of return is 37 percent higher (p<.10) for those in states with a more restrictive work exemptioncompared with those in states with less restrictive policies. While restrictive policies should discourage
141
[T]he fact that some 27% of the caseload returned to the rolls within two months sends ared flag about the underlying administration of the State’s welfare program. This problemof a high number of administrative case closings parallels a recent judicial decision and isconsistent with advocacy groups, media, and prior audit reports. Some review of these3,000 plus cases might give the State insights into how this group of recipients that ishaving trouble demonstrating administrative compliance is doing.383
Nationally, we have data only about total applications, approvals, and discontinuances(closings). Although these data are only indirect indicators,384 they, too, suggest that cycling onand off welfare has been rising rapidly. In 2001, for example, the national TANF caseload almostcompletely turned over, meaning that the number of families that entered welfare and left it wasalmost equal to the total number of recipients. (Mark Greenberg and his colleagues at the Centerfor Law and Social Policy have estimated that in fiscal year 2000, there were 2.1 million caseclosings and 1.9 million case openings. They divided these estimates by the average monthlycaseload and concluded that “the case closure rate was 93%, and the case opening rate was 84%,or 7% monthly.”)385 This high rate of churning, about 50 percent higher than the rate beforewelfare reform, is one reason why real mandatory work programs will be necessary to maintainthe momentum of welfare reform.
On the one hand, such cycling, especially if it increases, may be a warning that welfareagencies are too aggressively pushing families to leave the rolls; however, some increase incycling is probably the unavoidable result of policies that increase welfare exits (especially inanticipation of time limits).386 (Time limits or sanctions that terminate assistance permanently, of

reentry, instead, women faced with these policies while they are on welfare may exit, only to find that theycannot make it on their own. Greater churning may be an unanticipated consequence. (p. 24)
142
course, are two notable exceptions to this general rule.) On the other hand, an increase in cyclingcould also be a positive sign, because it might indicate that recipients who otherwise would haveremained passively on the caseload are trying to become self-sufficient, and it could take severalattempts for those who have little work experience to achieve self-sufficiency.

387As described in the discussion: “A 59 Percent Decline,” the “official” decline was 71 percent, but thisdecline includes the cases that hit their five-year time limit and that were then converted to SNA, under which theycontinued to receive essentially the same benefits.
388The “official” decline was 54 percent, but this decline includes the cases that hit their five-year timelimit and were converted to SNA, under which they continued to receive essentially the same benefits.
389Douglas J. Besharov, “The Past and Future of Welfare Reform,” The Public Interest, no. 150 (Winter2003): 4-21.
143
XI. ASSESSING THE IMPACT OF FULL ENGAGEMENT
Between March 1995 and July 2002, New York City’s Family Assistance (FA) caseloadfell 59 percent.387 Its Safety Net Assistance (SNA) caseload fell 71 percent.388 How much of thisdecline was the result of the city’s welfare reform program, and how much was due to otherfactors—primarily a strong economy and increased aid to low-income, working families?
Although expert opinion is divided on the relative contribution of each factor, it isgenerally agreed that this unprecedented decline (like that in the rest of the nation) was caused bya combination of three major factors: welfare reform writ large (the decline started nearly twoyears before the passage of Temporary Assistance to Needy Families [TANF]); an extremelystrong economy (especially for unskilled workers and single mothers); and increases in aid tolow-income, working families (including the Earned Income Tax Credit [EITC] and expandedMedicaid benefits).389
No Useful Evaluation
New York City officials and some outsiders who have examined HRA’s experiencebelieve that its full-engagement model, backed up with a strong work mandate, is responsible fora large share of the caseload decline. According to a report from the Task Force on SensibleWelfare Reform, a group of public officials, program administrators, policy analysts, researchersand advocates:
Mayor Giuliani and HRA officials cite the benefits of WEP as embodying the concept ofmutual obligation, teaching the value of work and generating work that is of value to theCity. Equally important is the implicit role of the program in reducing the caseload by“smoking out” those who may already be employed or who have other options thanwelfare. As a result, the Mayor and City officials use caseload declines as the measure of
390New School University, Robert J. Milano Graduate School of Management and Urban Policy, WelfareReform in New York: A Report on Implementation Issues in New York City (New York: New School University,Task Force on Sensible Welfare Reform, January 1999), p. 14.
391See the discussion: “New York’s Caseload Decline.”
144
program success, without specifically attributing this success to the experiences of WEPparticipants in finding jobs. In this regard, actual evidence is scanty.390
But it really is not possible to say for certain how much HRA’s programs contributed to thedecline because no scientifically rigorous research has been conducted to determine its impact.
On the one hand, in this period HRA adopted many new programs and policies designedto reduce welfare dependency and welfare caseloads, including rigorous work-first, job search,and work experience requirements. On the other hand, even states that did not change theirprograms very much experienced comparable declines. (Figure 16, for example, depicts theremarkable correspondence between the rises and declines of the New York City and nationalcaseloads.) Some would argue that this lack of difference indicates that HRA’s program may nothave had the dramatic effect on welfare caseloads that its supporters claim. It could be that HRAhas a more disadvantaged, inner-city population that was more difficult to move from welfare towork—so that the fact that the city’s caseload fell as far as it did is an indication of theprogram’s effectiveness. If that is true, however, then other cities—without large mandatorywork programs—should have experienced smaller declines. But some cities saw even greatercaseload declines than New York City—often without having adopted work experience or otherwelfare reform programs.391

145
New York City (Safety Net Assistance [SNA])
New York City (Family Assistance [FA])
1960 1970 1980 1990 2000
Figure 16. Welfare’s Growth and Decline, United States vs. New York City, 1960–2002
500
400
300
200
100
5
4
3
2
1
Thousands of cases (NYC) Millions of cases (U.S.)
U.S. (AFDC/TANF)
Sources: For U.S. caseload in 1960–1999: U.S. Department of Health and HumanServices, Administration for Children and Families, ACF News, Statistics, U.S. WelfareCaseloads Information: Temporary Assistance for Needy Families (TANF), 1936–1999,last updated: 12/14/00 Friday, July 27, 2001, available from:www.acf.dhhs.gov/news/stats/3697.htm, accessed April 29, 2002; for caseload in 2000and 2001: U.S. Department of Health and Human Services, Office of Planning, Researchand Evaluation, Temporary Assistance for Needy Families Program (TANF): FourthAnnual Report to Congress (Washington, D.C.: U.S. Department of Health and HumanServices, April 2002), tables 2:1a and 2:1b, pp. II-13 and II-15 available from:www.acf.dhhs.gov/programs/opre/ar2001/chapter02.pdf, accessed May 23, 2002; forcaseload in 2002: U.S. Department of Health and Human Services, Administration forChildren and Families, ACF News, Statistics, U.S. Welfare Caseloads Information:Temporary Assistance for Needy Families, Total Number of Families and Recipients,April-June 2002, available from: www.acf.dhhs.gov/news/stats/apr_jun2002_rev.htm,accessed February 4, 2003; for New York City caseload 1960–2001: New York CityHuman Resources Administration, Office of Program Reporting, Analysis, andAccountability, unpublished data, April 3, 2002; for 2002: New York City HumanResources Administration, Office of Program Reporting, Analysis, and Accountability,HRA Facts, available from: www.nyc.gov/html/hra/html/hrafacts.html, accessed January20, 2003.Notes: Welfare in the United States was called “Aid to Dependent Children” from 1936to 1962, “Aid to Families with Dependent Children” (AFDC) from 1962 to 1996, and“Temporary Assistance for Needy Families” (TANF) from 1996 to 2002. In New York,Family Assistance was called “Aid to Families with Dependent Children” and Safety NetAssistance was called “Home Relief” before 1998.

392For a powerful, interstate analysis of the caseload decline, see Jeffery Grogger, Lynn Karoly, and JacobAlex Klerman, Consequences of Welfare Reform: A Research Synthesis (Washington D.C.: RAND, July 2002),available from: www.acf.hhs.gov/programs/opre/welfare_reform/reform_contents.html, accessed September 1,2004.
393See generally Peter J. Ferrara, “Caesar in Robes: Case Studies in Judicial Administration of New YorkCity Welfare Programs,” unpublished paper submitted to Baruch College, City University of New York, undated.
146
It could also be possible that HRA’s work experience program had (or could have had) agreater impact but was countered by other state policies that tended to increase caseloads. Forexample, the state adopted a generous earnings disregard that allows families with earnings up tothe poverty level to remain eligible for assistance, thus encouraging mothers working at low-wage jobs to stay on welfare. New York State also allows families that exhaust their five-year,time-limited benefits to continue to receive full benefits under the state’s SNA program,undermining the message that welfare is temporary and thereby reducing the incentive to findwork or other arrangements as quickly as possible. And, despite its get-tough rhetoric, the citycan only impose partial sanctions on recipients who fail to comply with work requirements, thusallowing noncompliant families to remain on assistance with only a relatively minor reduction intheir total benefit package. It is unlikely, however, that these policies countered caseload declinesin New York any more than in other states. Most states also significantly expanded earningsdisregards, and many allow families who have played by the rules to receive extended benefits insome fashion. Most states with relatively high benefits, such as New York, also impose onlypartial sanctions.
Of course, coarse comparisons like these can be deeply misleading because cities varygreatly on many socioeconomic and policy dimensions.392 The point is, we just don’t know howmuch of New York’s caseload decline came from its ambitious welfare reform program.
We cannot leave this subject without contrasting the availability of data and evaluationsin Wisconsin versus New York City. Much more data and evaluation findings are available inWisconsin than in New York City. Yet, many of the same people led both efforts, so it is unlikelythat the difference has to do with personal preferences. Although it is true that Wisconsin wasmaking the bulk of its changes while Aid to Families with Dependent Children (AFDC) waivers(and hence evaluations) were still required, we think that the power (and stridency) of advocacygroups and their ability to gain assistance from the media and the courts are also responsible forthe relative dearth of information about New York City’s program. The fact is that programinnovation involves many false starts, dead ends, weak or problematic implementation, andmistaken policies. An environment that makes these problems potential lawsuits adds to theunderlying reluctance of bureaucracies to release unflattering data.393
Systematic Evaluation Needed
Many people believe that able-bodied welfare recipients should be required to work inorder to repay society for the benefits they receive. “Work among welfare recipients,” writes

394Robert A. Moffitt, “From Welfare to Work: What the Evidence Shows,” Welfare Reform and Beyond,The Brookings Institution Policy Brief No. 13, January 2002, p. 1.
395Jason Turner and Thomas Main, “Work Experience Under Welfare Reform,” in The New World ofWelfare, edited by Ron Haskins and Rebecca Blank (Washington, D.C.: The Brookings Institution, 2001), p. 291.
147
Robert Moffitt, “is widely regarded as part of the social contract—a quid pro quo for theprovision of income support—as well as a source of self-esteem and self-reliance among singlemothers. This in turn is thought to increase the mothers’ chances for long-term economicimprovement for themselves and their children.”394
For some, fulfilling this “moral” obligation is sufficient reason to establish a full-engagement program with a strong work experience or workfare component. Turner and Main,for example, call work programs a way “to fulfill a social and moral obligation of recipients tocontribute to society in exchange for benefits.”395 We, too, believe in mandatory welfare-to-workprograms, including workfare programs, and believe that past research provides at least somesupport for them. The evidence on the subject is modest, however, and even more so in regard toprogram design and operation. Moreover, work experience and workfare programs imposesubstantial costs on welfare agencies as well as on recipient families. Thus, it is important toexplore the degree to which work experience programs increase employability and reducedependency, and how they can be made more effective in doing so.
Unfortunately, as mentioned earlier, no serious evaluation of full-engagement or intensivework experience programs was conducted under TANF, even though that was a central elementof welfare reform. A real opportunity was missed.
The U.S. Department of Health and Human Services (HHS) is now conducting fourmajor, multiyear experiments on employment retention and advancement services, enhancedservices for the hard-to-employ, rural welfare-to-work strategies, and efforts to build strongfamilies. Although each of these areas is important to the further development of welfare reformstrategies, it would have been more important for HHS to test how best to implement workexperience programs, a major—and still problematic—aspect of TANF.
Regardless of whether the reauthorization process results in more stringent participationrequirements, full-engagement and intensive work experience programs are sure to be centralissues of contention. Hence, we strongly endorse much more research on the subject.
Randomized experiments. The preferred evaluation methodology of most socialscientists is experimental design, in which individuals are randomly assigned to an experimentalor control group. In such an evaluation, the experimental group would be assigned to a newwelfare regime and would be compared with a control group that received the existing set ofbenefits and services. A control group provides a benchmark for measuring programimprovement (and making sure that various programmatic approaches do not do more harm than
396Gary Burtless, “The Case for Randomized Field Trials in Economic and Policy Research,” Journal ofEconomic Perspectives, 9, Spring 1995, p. 69.
148
good). Some experimental evaluations include multiple experimental groups that allowresearchers to not only assess the impact of a particular welfare regime but also to compare itwith alternative approaches.
If properly planned and implemented, an experimental design should result inexperimental and control groups that have comparable measurable and unmeasurable aggregatecharacteristics (within the limits of chance variation). From the moment of randomization, bothgroups would be exposed to the same outside forces, such as economic conditions, socialenvironments, and other events, allowing any subsequent differences in outcomes to be attributedto the intervention.
In the past thirty years, experimental designs have been used to evaluate a wide range ofsocial interventions, including evaluations of welfare-to-work programs. With less rigorousmethodologies, the findings of such research are often questioned. But with experimentalfindings, policymakers can focus on the implications of findings, rather than, as Gary Burtless hasobserved, “become entangled in a protracted debate about whether the findings of a particularstudy are statistically valid.”396
Questions about the effectiveness of mandatory work experience programs could best beanswered by conducting randomized experiments in which the experimental group is subject tomandatory work and the control group is not. Randomized experiments are probably the bestway to “unbundle” TANF programs to discern the optimal programmatic arrangements. Thus,the test could be between alternative strategies, such as mandatory work versus mandatoryeducation and training, and both versus combining work and welfare.
Testing policy options. Depending on the funds available, an experimental test of workexperience programs could explore the impact of a wide array of services and interventions. Theevaluation could involve randomly assigning groups to various interventions and then trackingthem for several years to compare long-term impacts on employment, earnings, and welfarereceipt. Random assignment could be used to compare the relative effectiveness of various workexperience designs. For example, it could involve assignment to any one of threegroups—existing work experience program, a control group, and a third group implementing themore flexible approach described above. Of course, other program models or other variationswithin the existing model could be tested . For example, the current New York City WorkExperience Program (WEP) structure could be compared with WEP-basic, which essentiallyinvolves full-time WEP participation. Or, sanction policies could be made tougher to address theproblem of having too many cases remaining out-of-compliance as part of the “happilysanctioned.” With a rigorous evaluation, it would be possible to see whether families are morelikely to comply with tougher sanctions and whether tougher sanctions adversely affect familiesand children.

149
Current full-engagement program. Under the current full-engagement program, mostparticipants are required to engage in a twenty-hour work week and fifteen hours of otheractivities, including job search, as well as job skills training, substance abuse treatment, oreducational development. Because several advocacy groups have challenged the effectiveness ofthe full-engagement program, it is important to establish its impact on welfare receipt,employment, and earnings. One option would be to compare those assigned to the city’s currentfull-engagement program with those who do not have a participation mandate but who canvolunteer for services generally available to the public. This comparison would demonstrate theimpact of New York City’s current approach. (However, because this model includes an array ofservices, it would not isolate the impact of WEP alone.)
Work first. As described earlier, New York City’s caseload decline began with a drop incase openings, suggesting that it was caused by either the economy, work first, welfare reform’sgeneral deterrence effects or, more likely, all of these. HRA’s version of work first combines thetraditional, mandatory up-front job search to encourage employment with an added dose of“hassle”: Applicants are subject to more rigorous eligibility requirements, including scanningfingerprints and multiple visits to various welfare offices. One option would be to comparerecipients assigned just to work first with those who do not have a participation mandate. Thiscomparison would show the impact of work first itself. Although considerable research on thistopic exists already, as described above, this would be the first evaluation of work first in thepost–welfare reform era. Other options could isolate the impact of various elements of the work-first strategy, such as the hassle associated with having to go to multiple offices to establish andmaintain eligibility. For example, current applicants, who are now required to make multiplevisits to different offices, could be compared with a group allowed to sign up for the full range ofbenefits and activities in one building at one time. Because all other services and assignmentswould remain the same, this design would measure the impact of hassle in the current programmodel.
WEP. The centerpiece of New York City’s full-engagement model is WEP. Most pastresearch of work experience programs has focused on short-term programs offered as part of asequence of activities. No rigorous research has been conducted on an ongoing mandate toparticipate in a WEP-like program. One option would be to compare recipients assigned to WEPwith those who do not have a participation mandate beyond work first. This design would isolateWEP’s added impact. Alternatively, the comparison could be with a group that has noparticipation mandate, a design that would then reveal the impact of work first plus WEP.
Intensive WEP. Initially, most WEP participants were placed in full-time (five days perweek) work assignments. In 1999, a pronounced shift began toward the current WEP model,which involves a combination of twenty hours per week of work experience and fifteen hours ofparticipation in other activities. The number of hours of work experience could be increased tothe maximum allowed under current law (the combined TANF and food stamp grant divided bythe minimum wage). One option would be to compare recipients assigned to full-time WEP withthose subject to the existing sequence of program assignments. Because both requirements

150
would be based on full-time participation, this comparison would indicate whether the current,mixed approach is more effective than simply requiring full-time work experience.
Education and training first. An alternative to the work-first model would be to placewelfare recipients into education or training programs before mandating participation in workactivities. Proponents of this approach argue that most welfare recipients need to raise their skillsto get a job that will pay enough to raise their family out of poverty. Recipients without a highschool degree or the equivalent usually must participate in basic education, GED preparationcourses, or English as a second language classes. For high school graduates, this approach maylead to vocational training or, in some cases, postsecondary classes. Critics argue that theeducation-and-training-first approach is costly, promotes welfare dependency, and does little toimprove the long-term employability of most families. One option would be to comparerecipients assigned to the education-and-training-first approach with those subject to the existingsequence of program assignments. As discussed above, past research suggests that recipientsassigned to an “education-first” program (which can also include assignment to various trainingactivities) eventually catch up to families assigned to a “job-search-first” program in terms ofemployment and earnings gains. Thus, follow-up of three years or more may be required todetermine the relative effectiveness of an education-and-training-first program in New York Citycompared with the existing sequence of activities.
Mixed strategy. Although the current WEP program offers two days of participation inother services, an alternative strategy could involve allowing case managers to assign welfarerecipients to alternative activities on the basis of an up-front assessment. The assessment couldbe conducted upon application or after the recipient has gone through an initial period of jobsearch. Based on the assessment, a wide range of activities could be considered, including jobsearch, basic education, short-term postsecondary education, job skills training, job readiness,on-the-job training, and work experience. Work experience, however, would not have to be partof the treatment. One option would be to compare recipients assigned to a mixed-strategyapproach with those subject to the existing sequence of program assignments. As describedabove, past research suggests that programs offering a mixture of services tend to have largereffects on employment and earnings than do solely job-search, work-first, or education-firstprograms. No research, however, has compared outcomes for mixed-strategy programs andprograms having an ongoing work mandate, such as New York City’s.
Subsidized employment. Participants in WEP “work off” their welfare grants; they do notearn wages. An alternative to WEP would be to create subsidized employment slots, whereby thewelfare grant can be used to subsidize jobs in the private sector or the public sector. This may bea cost-effective alternative to WEP if the benefit payments are used to leverage other resources.In addition, participants become eligible for the EITC, thereby increasing their income by morethan WEP. The main drawbacks to this approach are that it is more complicated to structure asubsidized employment slot than a work experience program and that the effort could providewindfall subsidies to employers who would have hired the participants anyway. One optionwould to compare recipients required to participate in a subsidized employment program with

151
those subject to the existing WEP mandate. It should be possible to determine relatively quicklyany differences in participation levels and employer interest in offering subsidized employmentslots. Long-term follow-up would be needed to determine the impact on other outcomes, such asincome.
Sanctions. One barrier to achieving higher participation rates identified by several outsideobservers is the relatively large number of “happily sanctioned” families. As of November 2001,17 percent of engageable TANF families received a sanction (and 17 percent were in the sanctionprocess). New York’s current sanction involves removing the adult’s needs from the grant, orabout a one-third reduction for a family of three. One option would be to compare recipientssubject to a larger sanction, perhaps even including a full-family sanction, with those subject tothe existing sanction policies. It should be possible to determine relatively quickly how manyfamilies come into compliance and how many lose their benefits. Long-term follow-up would beneeded to determine the impact on other outcomes, such as income, but the effects onparticipation could be important. For example, if most of the families come into compliance, it islikely that their incomes would be higher because the sanction would be cured.
Earnings disregards. New York’s current earnings disregards are very generouscompared with prior AFDC law. The intent of expanded earnings disregards is to encouragenonworking welfare recipients to seek employment. Such disregards, however, increase programcosts and welfare receipt, and they create inequities by providing some low-income families withsupplements while denying them to others. Moreover, the need for such a supplement isdiminished because (1) a work requirement should provide the stimulus for work and (2) othersupports for the working poor have been expanded in the past decade, including the EITC,Medicaid/State Children’s Health Insurance Program, and child care subsidies. One option wouldbe to compare the impact of WEP combined with existing earnings disregards against the impactof a program without an earnings disregard (or with a less generous disregard). As discussedabove, many states are now reassessing the costs associated with generous earnings disregards.This option would provide direct evidence about the behavioral effects of expanded earningsdisregards and provide data on their cost.
Two-parent families. Under TANF, two-parent families are subject to a stricter workmandate than other families; 90 percent are required to participate for a minimum of thirty-fivehours per week (up to fifty-five hours per week if the family received a child care subsidy). Onereason for this differential approach is that two-parent families are perceived as having fewerbarriers to employment, particularly child care (because one parent could be available to care forthe children while the other parent works). Some two-parent families, however, receive welfarebecause one of the parents is disabled; thus, such families may face even greater barriers toemployment than single-parent families. Most states have met the two-parent work requirementsby taking advantage of the caseload reduction credit or by shifting their two-parent caseload to a“separate state program.” Nevertheless, at some point, the requirements are likely to becomebinding. Hence, the impact of work experience on two-parent families should be examinedseparately from that on single-parent families. One option would be to compare families under
397Mothers cohabiting with the biological father of one of the children are subject to the same TANF rulesas married-couple families.
398Thomas M. Fraker, Christine M. Ross, Rita A. Stapulonis, Robert B. Olsen, Martha D. Kovac, M.Robin Dion, and Anu Rangarajan, The Evaluation of Welfare Reform in Iowa: Final Impact Report (Washington,D.C.: Mathematica Policy Research, Inc., June 11, 2002), p. 56.
152
WEP with families who do not have a participation mandate beyond work first. Alternatively, theresearch could compare WEP recipients with recipients who have no mandate to participate atall. (There could also be a special analysis of mothers cohabiting with a man who is not thebiological father of the children, by either conducting random assignment separately for thisgroup or examining the impact as part of the subgroup analysis for the single-parent group.)397
In addition to effects on employment and welfare receipt, special attention should be paidto assessing welfare’s effects on marriage and other family-related outcomes. For example, arecent evaluation in Iowa found that the state’s welfare reform program, which was intended tomake it easier for two-parent families to qualify for assistance, may have actually discouragedmarriage among two-parent welfare applicant families.398 One of the researchers involvedspeculated that this may have occurred because the state imposed the work requirement on bothparents, rather than just one. Hard evidence, rather than speculation, is needed to address thesequestions.

153
APPENDIX A
TABLES

154
Table A.1. Unengageable Family Assistance Cases, New York City, 1996–2002
Nov.20,
1996April,1999
July28,
1999
Nov.29,
1999
Dec.26,
1999
Nov.29,
2000
Dec.26,
2000
Nov.25,
2001
Dec.30,
2001a Aug. 4, 2002a
Total caseload 278,832
201,948
196,271
189,614
187,357
163,020
160,012
141,843
136,256
127,411
Active single issue–
1%1,774
1%2,309
2%2,896
2%2,918
2%3,628
2%3,664
3%4,479
3%4,398
3%3,439
Child-only cases 26%73,770
14%27,814
15%29,051
16%30,178
16%30,420
21%33,739
21%33,894
24%34,156
25%33,849
26%33,670
Indefinitely unengageable 2%6,857
3%6,130
3%6,135
3%6,158
3%5,945
3%5,216
3%5,191
3%4,449
3%4,447
4%4,528
Case head on Supplement Security Income (SSI)
2%5,619
2%3,243
2%2,992
2%2,891
2%2,751
1%1,756
1%1,717
1%1,141
1%1,204
1%1,190
Division of AIDS Services and Income Support case –
1%1,453
1%1,666
1%1,813
1%1,769
1%2,370
2%2,432
2%2,573
2%2,529
2%2,768
Case head age 60 or over 0%1,238
1%1,434
1%1,477
1%1,454
1%1,425
1%1,090
1%1,042
1%735
1%714
0%570
Temporarily unengageable 30%84,523
4%7,152
4%7,627
4%7,096
5%8,996
7%11,521
7%11,264
5%6,715
5%6,253
5%5,889
Temporarily incapacitated
9%24,927
2%3,423
2%4,125
2%3,050
2%4,433
4%6,042
4%5,865
2%2,183
1%1,983
1%1,623
Young child exemption 21%59,596
1%1,382
1%1,166
1%1,102
1%1,237
2%3,741
2%3,681
1%1,361
1%1,356
1%1,611
SSI pending/appealing–
1%2,347
1%2,336
1%1,948
1%2,611
1%1,247
1%1,202
1%1,875
1%1,839
1%1,550
Temporarily exempt–
0%0
0%0
0%302
0%356
0%475
0%511
1%859
1%885
1%682

155
Limitations — pending Personal Roads for Individual Development and Employment scheduling
0%0
0%0
0%0
0%694
0%359
0%16
0%5
0%437
0%190
0%423
Other 0%0
0%0
0%0
0%0
0%0
0%0
0%0
0%0
0%0
0%0
Total unengageable 59%165,15
0
21%42,870
23%45,122
24%46,328
26%48,279
33%54,104
34%54,013
35%49,799
36%48,947
37%47,526
Sources: New York City Human Resources Administration, “PA — Weekly Caseload Engagement Status” (New York: New York City Human ResourcesAdministration, various periods); and Demetra Smith Nightingale, Nancy Pindus, Federica D. Kramer, John Trutko, Kelly Mikelson, and Michael Egner, Work andWelfare Reform in New York City During the Guliani Administration: A Study of Program Implementation (Washington, D.C.: The Urban Institute Labor and SocialPolicy Center, July 2002), p. B-2.Notes: In New York, Family Assistance was called “Aid to Families with Dependent Children” before 1998.aCombines Temporary Assistance for Needy Families cases with “conversion” cases, those that reached the five-year time limit and received extended benefitsthrough a separate state program.
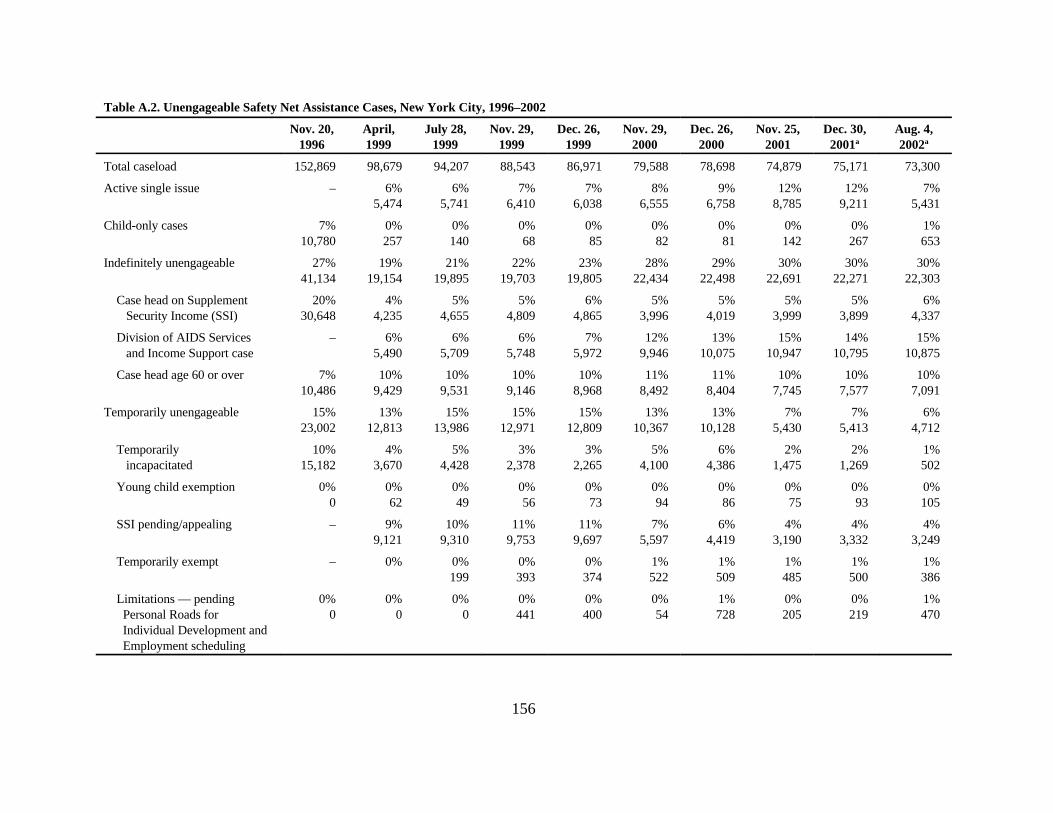
156
Table A.2. Unengageable Safety Net Assistance Cases, New York City, 1996–2002
Nov. 20,1996
April,1999
July 28,1999
Nov. 29,1999
Dec. 26,1999
Nov. 29,2000
Dec. 26,2000
Nov. 25,2001
Dec. 30,2001a
Aug. 4,2002a
Total caseload 152,869 98,679 94,207 88,543 86,971 79,588 78,698 74,879 75,171 73,300
Active single issue – 6%5,474
6%5,741
7%6,410
7%6,038
8%6,555
9%6,758
12%8,785
12%9,211
7%5,431
Child-only cases 7%10,780
0%257
0%140
0%68
0%85
0%82
0%81
0%142
0%267
1%653
Indefinitely unengageable 27%41,134
19%19,154
21%19,895
22%19,703
23%19,805
28%22,434
29%22,498
30%22,691
30%22,271
30%22,303
Case head on Supplement Security Income (SSI)
20%30,648
4%4,235
5%4,655
5%4,809
6%4,865
5%3,996
5%4,019
5%3,999
5%3,899
6%4,337
Division of AIDS Services and Income Support case
– 6%5,490
6%5,709
6%5,748
7%5,972
12%9,946
13%10,075
15%10,947
14%10,795
15%10,875
Case head age 60 or over 7%10,486
10%9,429
10%9,531
10%9,146
10%8,968
11%8,492
11%8,404
10%7,745
10%7,577
10%7,091
Temporarily unengageable 15%23,002
13%12,813
15%13,986
15%12,971
15%12,809
13%10,367
13%10,128
7%5,430
7%5,413
6%4,712
Temporarily incapacitated
10%15,182
4%3,670
5%4,428
3%2,378
3%2,265
5%4,100
6%4,386
2%1,475
2%1,269
1%502
Young child exemption 0%0
0%62
0%49
0%56
0%73
0%94
0%86
0%75
0%93
0%105
SSI pending/appealing – 9%9,121
10%9,310
11%9,753
11%9,697
7%5,597
6%4,419
4%3,190
4%3,332
4%3,249
Temporarily exempt – 0% 0%199
0%393
0%374
1%522
1%509
1%485
1%500
1%386
Limitations — pending Personal Roads for Individual Development and Employment scheduling
0%0
0%0
0%0
0%441
0%400
0%54
1%728
0%205
0%219
1%470

157
Other 5%7,820
0%0
0%0
0%0
0%0
0%0
0%0
0%0
0%0
0%0
Total unengageable 49%74,916
38%37,698
42%39,762
44%39,152
45%38,737
50%39,438
50%39,465
49%37,048
49%37,162
45%33,099
Sources: New York City Human Resources Administration, “PA — Weekly Caseload Engagement Status” (New York: New York City Human ResourcesAdministration, various periods); and Demetra Smith Nightingale, Nancy Pindus, Federica D. Kramer, John Trutko, Kelly Mikelson, and Michael Egner, Work andWelfare Reform in New York City During the Guliani Administration: A Study of Program Implementation (Washington, D.C.: The Urban Institute Labor andSocial Policy Center, July 2002), p. B-2.Notes: In New York, Safety Net Assistance was called “Home Relief” before 1998.aExcludes Family Assistance cases that reached the Temporary Assistance for Needy Families five-year time limit and were converted to the Safety Net Assistance.

158
Table A.3. Engageable Family Assistance Cases, New York City, 1996–2002
Nov. 20,1996
Apr. 1,1999
July 28,1999
Nov. 29,1999
Dec. 26,1999
Nov. 27,2000
Dec. 26,2000
Nov. 25,2001
Dec. 30,2001a
Aug. 4,2002a
Engageable casesb 113,682 159,078 151,149 143,286 139,078 108,916 105,999 91,289 87,309 79,885
Participating in anyactivityc
34%39,251
35%56,413
41%61,657
48%68,367
52%71,671
54%58,847
53%56,496
55%50,588
57%49,676
55%43,957
Combining work andwelfare
10%11,005
12%18,821
17%26,356
21%30,199
22%30,316
26%27,968
27%28,297
26%25,106
28%24,812
27%21,537
Work Experience Program(WEP)
WEP basic
WEP mixed
10%11,757
–
–
11%17,862
10%15,591
1%2,271
11%17,229
10%14,546
2%2,683
14%20,676
11%15,411
4%5,265
16%21,933
12%16,269
4%5,664
14%15,774
3%3,68011%
12,094
14%14,996
4%3,84011%
11,156
11%10,127
1%1,33110%
8,796
12%10,532
2%1,72410%
8,808
10%8,038
1%7629%
7,276
Other activities
Wage subsidy
Substance abuse
Education training
Student
Needed at home
Wellness/rehab
Other
15%16,489
–
–
–
–
–
–
–
12%19,730
0%0
0%4212%
3,3475%
8,3455%
7,6170%
00%
0
12%18,072
0%0
1%8663%
3,8424%
5,3495%
8,0150%
00%
0
13%18,492
0%0
1%1,385
3%4,074
4%5,339
5%7,361
0%0
0%333
14%19,422
0%0
1%1,506
3%3,798
4%5,423
6%8,394
0%0
0%301
14%15,105
0%2961%
1,6284%
4,3283%
3,4325%
4,9900%
00%431
12%13,203
0%2112%
1,6163%
2,7323%
3,2805%
4,9820%
00%382
17%15,355
3%2,327
1%1,286
4%3,700
2%1,574
5%4,638
2%1,805
0%25
16%14,322
2%1,818
2%1,492
3%2,950
2%1,546
5%4,659
2%1,846
0%21
18%14,382
3%2,273
2%1,442
3%2,679
2%1,434
6%4,503
3%2,044
0%7

Nov. 20,1996
Apr. 1,1999
July 28,1999
Nov. 29,1999
Dec. 26,1999
Nov. 27,2000
Dec. 26,2000
Nov. 25,2001
Dec. 30,2001a
Aug. 4,2002a
159
In sanction process
In effect
In process
16%17,727
––––
24%37,911
5%7,61019%
30,301
28%42,388
10%15,583
18%26,805
38%54,012
15%20,808
23%33,204
37%50,743
14%21,976
23%28,767
34%37,265
17%18,231
17%19,034
36%37,677
17%17,842
19%19,835
34%30,679
17%15,738
16%14,441
32%28,002
16%13,642
16%14,360
31%24,706
16%12,385
15%12,321
In engagement process 17%19,173
15%23,924
16%24,106
14%19,672
12%16,664
12%12,804
11%11,826
11%10,022
11%9,541
14%11,222
Unengaged 33%37,531
26%40,830
15%22,998
0%232
0%0
0%0
0%0
0%0
0%0
0%0
Sources: New York City Human Resources Administration, “PA — Weekly Caseload Engagement Status” (New York: New York City Human ResourcesAdministration, various periods); and Demetra Smith Nightingale, Nancy Pindus, Federica D. Kramer, John Trutko, Kelly Mikelson, and Michael Egner, Work andWelfare Reform in New York City During the Guliani Administration: A Study of Program Implementation (Washington, D.C.: The Urban Institute Labor andSocial Policy Center, July 2002), p. B-2. Notes: In New York, Family Assistance was called “Aid to Families with Dependent Children” before 1998.aCombines Temporary Assistance for Needy Families (TANF) cases with “conversion” cases, those that reached the five-year time limit and received extendedbenefits through a separate state program.bThe Urban Institute did not count “needed at home” in its count of engageable cases. New York City’s Human Resources Administration does count this group inits total for engageable cases, so we have added this number back to the columns based on the Urban Institute report, covering the following periods: Dec. 19,1994; Nov. 20, 1996; Apr. 1, 1999; Nov. 29, 1999; Nov. 27, 2000; and Nov. 25, 2001. A state can count this as participation in a “community service” programcParticipating in any activity reflects any activity counted by the city. This includes some activities, such as substance abuse treatment or needed at home, whichhave traditionally not been counted by the federal government as allowable activities, but may be counted under TANF, at state option.

160
Table A.4. Engageable Safety Net Assistance Cases, New York City, 1996–2002
Nov. 20,1996
Apr. 1,1999
July 28,1999
Nov. 29,1999
Dec. 26,1999
Nov. 27,2000
Dec. 26,2000
Nov. 25,2001
Dec. 30,2001a
Aug. 4,2002a
Engageable casesb 77,953 60,981 54,445 49,391 48,234 40,150 39,233 37,831 38,009 40,201
Participating in anyactivity
67%52,278
52%31,497
57%31,237
63%30,962
64%30,964
64%25,515
63%24,745
66%24,798
66%25,134
64%25,836
Combining work andwelfare
2%1,824
3%1,598
3%1,777
3%1,727
4%1,764
5%2,175
5%2,073
6%2,081
6%2,268
7%2,741
Work ExperienceProgram (WEP)
WEP basic
WEP mixed
26%19,982
–
–
27%16,219
23%14,020
4%2,199
29%16,018
25%13,719
4%2,299
30%15,008
24%11,699
7%3,309
32%15,320
23%10,904
9%4,416
23%9,103
5%2,14917%
6,954
21%8,370
5%2,11016%
6,260
19%7,110
2%727
17%6,383
19%7,186
2%699
17%6,487
17%6,806
2%712
15%6,094
Other activities
Wage subsidy
Substance abuse
Education training
Student
Needed at home
Wellness/rehab
Other
39%30,472
–
–
–
–
–
–
–
22%13,685
0%0
19%11,558
0%2560%2603%
1,6060%
00%
0
25%13,442
0%0
21%11,531
1%5340%99
2%1,278
0%0
0%0
29%14,227
0%0
23%11,469
2%8040%97
3%1,723
0%0
0%134
29%13,880
0%0
23%11,120
2%7490%87
4%1,793
0%0
0%0
35%14,237
0%0
27%10,779
4%1,480
0%1113%
1,2760%
00%591
37%14,302
0%0
28%10,989
4%1,547
0%1223%
1,1350%
01%509
41%15,607
0%59
27%10,290
3%1,288
0%1023%
1,0606%
2,3880%420
41%15,680
0%50
27%10,311
3%1,318
0%1013%
1,0257%
2,4781%397
41%16,289
1%279
26%10,577
3%1,055
0%1433%
1,1047%
2,6671%464

Nov. 20,1996
Apr. 1,1999
July 28,1999
Nov. 29,1999
Dec. 26,1999
Nov. 27,2000
Dec. 26,2000
Nov. 25,2001
Dec. 30,2001a
Aug. 4,2002a
161
In sanction process
In effect
In process
13%10,386
–
–
12%7,271
0%73
12%7,198
13%7,213
2%1,16811%
6,045
15%7,442
2%823
13%6,619
14%6,579
2%965
12%5,614
19%7,541
1%422
18%7,119
20%7,928
1%391
19%7,537
17%6,505
0%147
17%6,358
18%6,8410.5%
18418%
6,657
19%7,585
1%598
17%6,987
In engagement process 11%8,340
21%12,741
20%11,048
22%10,681
22%10,691
18%7,094
17%6,560
17%6,528
16%6,034
17%6,780
Unengaged 9%6,949
16%9,472
9%4,947
1%306
0%0
0%0
0%0
0%0
0%0
0%0
Sources: New York City Human Resources Administration, “PA — Weekly Caseload Engagement Status” (New York: New York City Human ResourcesAdministration, various periods); and Demetra Smith Nightingale, Nancy Pindus, Federica D. Kramer, John Trutko, Kelly Mikelson, and Michael Egner, Work andWelfare Reform in New York City During the Guliani Administration: A Study of Program Implementation (Washington, D.C.: The Urban Institute Labor andSocial Policy Center, July 2002), p. B-2.Notes: In New York, Safety Net Assistance (SNA) was called “Home Relief” before 1998.aExcludes Family Assistance cases that reached the Temporary Assistance for Needy Families five-year time limit and were converted to SNA.bThe Urban Institute did not count “needed at home” in its count of engageable cases. New York City’s Human Resources Administration does count this group inits total for engageable cases, so we have added this number back to the columns based on the Urban Institute report, covering the following periods: Dec. 19,1994; Nov. 20, 1996; Apr. 1, 1999; Nov. 29, 1999; Nov. 27, 2000; and Nov. 25, 2001. A state can count this as participation in a “community service” program.

162
Table A.5. Family Assistance Cases: Engagement Status, New York City, 1996–2002
Nov. 20,1996
Apr. 1,1999
July 28,1999
Nov. 29,1999
Dec. 26,1999
Nov. 27,2000
Dec. 26,2000
Nov. 25,2001
Dec. 30,2001a
Aug. 4,2002a
Engageable casesb 113,682 159,078 151,149 143,286 139,078 108,916 105,999 91,289 87,309 79,885
Combining work andwelfare
11,005 18,821 26,356 30,199 30,316 27,968 28,297 25,106 24,812 21,537
Work Experience Program (WEP)
11,757 17,862 17,229 20,676 21,933 15,774 14,996 10,127 10,532 8,038
Other activities 16,489 19,730 18,072 18,492 19,422 15,105 13,203 15,355 14,322 14,382
In sanction process 17,727 37,911 42,388 54,012 50,743 37,265 37,677 30,679 28,002 24,706
In engagement process 19,173 23,924 24,106 19,672 16,664 12,804 11,826 10,022 9,541 11,222
Unengaged 37,531 40,830 22,998 232 0 0 0 0 0 0
Unengageable cases 165,150 42,870 45,122 46,328 48,279 54,104 54,013 49,799 48,947 47,526
Sources: New York City Human Resources Administration, “PA — Weekly Caseload Engagement Status” (New York: New York City Human ResourcesAdministration, various periods); and Demetra Smith Nightingale, Nancy Pindus, Federica D. Kramer, John Trutko, Kelly Mikelson, and Michael Egner, Work andWelfare Reform in New York City During the Guliani Administration: A Study of Program Implementation (Washington, D.C.: The Urban Institute Labor andSocial Policy Center, July 2002), p. B-2. Notes: In New York, Family Assistance was called “Aid to Families with Dependent Children” before 1998.aCombines Temporary Assistance for Needy Families cases with “conversion” cases, those that reached the five-year time limit and received extended benefitsthrough a separate state program.bThe Urban Institute did not count “needed at home” in its count of engageable cases. New York City’s Human Resources Administration does count this group inits total for engageable cases, so we have added this number back to the columns based on the Urban Institute report, covering the following periods: Dec. 19,1994; Nov. 20, 1996; Apr. 1, 1999; Nov. 29, 1999; Nov. 27, 2000; and Nov. 25, 2001. A state can count this as participation in a “community service” program.

163
Table A.6. Safety Net Assistance Cases: Engagement Status, New York City, 1996–2002
Nov. 20,1996
Apr. 1,1999
July 28,1999
Nov. 29,1999
Dec. 26,1999
Nov. 27,2000
Dec. 26,2000
Nov. 25,2001
Dec. 30,2001a
Aug. 4,2002a
Engageable casesb 77,953 60,981 54,445 49,391 48,234 40,150 39,233 37,831 38,009 40,201
Combining work and welfare 1,824 1,598 1,777 1,727 1,764 2,175 2,073 2,081 2,268 2,741
Work Experience Program (WEP)
19,982 16,219 16,018 15,008 15,320 9,103 8,370 7,110 7,186 6,806
Other activities 30,472 13,685 13,442 14,227 13,880 14,237 14,302 15,607 15,680 16,289
In sanction process 10,386 7,271 7,213 7,442 6,579 7,541 7,928 6,505 6,841 7,585
In engagement process 8,340 12,741 11,048 10,681 10,691 7,094 6,560 6,528 6,034 6,780
Unengaged 6,949 9,472 4,947 306 0 0 0 0 0 0
Unengageable cases 74,916 37,698 39,762 39,152 38,737 39,438 39,465 37,048 37,162 33,099
Sources: New York City Human Resources Administration, “PA — Weekly Caseload Engagement Status” (New York: New York City Human ResourcesAdministration, various periods); and Demetra Smith Nightingale, Nancy Pindus, Federica D. Kramer, John Trutko, Kelly Mikelson, and Michael Egner, Work andWelfare Reform in New York City During the Guliani Administration: A Study of Program Implementation (Washington, D.C.: The Urban Institute Labor andSocial Policy Center, July 2002), p. B-2.Notes: In New York, Safety Net Assistance (SNA) was called “Home Relief” before 1998.aExcludes Family Assistance cases that reached the Temporary Assistance for Needy Families five-year time limit and were converted to SNA.bThe Urban Institute did not count “needed at home” in its count of engageable cases. New York City’s Human Resources Administration does count this group inits total for engageable cases, so we have added this number back to the columns based on the Urban Institute report, covering the following periods: Dec. 19,1994; Nov. 20, 1996; Apr. 1, 1999; Nov. 29, 1999; Nov. 27, 2000; and Nov. 25, 2001. A state can count this as participation in a “community service” program.
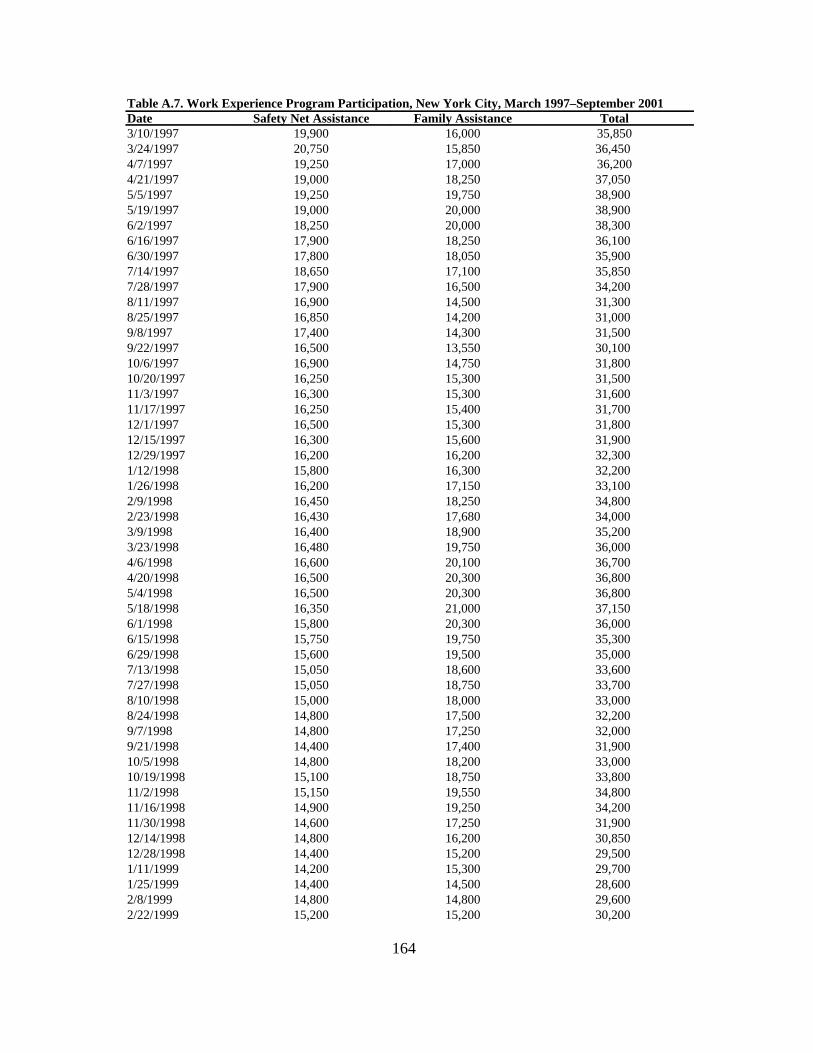
164
Table A.7. Work Experience Program Participation, New York City, March 1997–September 2001Date Safety Net Assistance Family Assistance Total3/10/1997 19,900 16,000 35,8503/24/1997 20,750 15,850 36,450 4/7/1997 19,250 17,000 36,2004/21/1997 19,000 18,250 37,050 5/5/1997 19,250 19,750 38,900 5/19/1997 19,000 20,000 38,900 6/2/1997 18,250 20,000 38,300 6/16/1997 17,900 18,250 36,100 6/30/1997 17,800 18,050 35,900 7/14/1997 18,650 17,100 35,850 7/28/1997 17,900 16,500 34,200 8/11/1997 16,900 14,500 31,300 8/25/1997 16,850 14,200 31,000 9/8/1997 17,400 14,300 31,500 9/22/1997 16,500 13,550 30,100 10/6/1997 16,900 14,750 31,800 10/20/1997 16,250 15,300 31,500 11/3/1997 16,300 15,300 31,600 11/17/1997 16,250 15,400 31,700 12/1/1997 16,500 15,300 31,800 12/15/1997 16,300 15,600 31,900 12/29/1997 16,200 16,200 32,300 1/12/1998 15,800 16,300 32,200 1/26/1998 16,200 17,150 33,100 2/9/1998 16,450 18,250 34,800 2/23/1998 16,430 17,680 34,000 3/9/1998 16,400 18,900 35,200 3/23/1998 16,480 19,750 36,000 4/6/1998 16,600 20,100 36,700 4/20/1998 16,500 20,300 36,800 5/4/1998 16,500 20,300 36,800 5/18/1998 16,350 21,000 37,150 6/1/1998 15,800 20,300 36,000 6/15/1998 15,750 19,750 35,300 6/29/1998 15,600 19,500 35,000 7/13/1998 15,050 18,600 33,600 7/27/1998 15,050 18,750 33,700 8/10/1998 15,000 18,000 33,000 8/24/1998 14,800 17,500 32,200 9/7/1998 14,800 17,250 32,000 9/21/1998 14,400 17,400 31,900 10/5/1998 14,800 18,200 33,000 10/19/1998 15,100 18,750 33,800 11/2/1998 15,150 19,550 34,800 11/16/1998 14,900 19,250 34,200 11/30/1998 14,600 17,250 31,900 12/14/1998 14,800 16,200 30,850 12/28/1998 14,400 15,200 29,500 1/11/1999 14,200 15,300 29,700 1/25/1999 14,400 14,500 28,600 2/8/1999 14,800 14,800 29,600 2/22/1999 15,200 15,200 30,200

Table A.7. Work Experience Program Participation, New York City, March 1997–September 2001Date Safety Net Assistance Family Assistance Total
165
3/8/1999 15,500 14,800 30,200 3/22/1999 16,200 15,700 31,900 4/5/1999 16,000 15,700 31,750 4/19/1999 16,450 15,700 32,000 5/3/1999 16,500 16,000 32,2005/17/1999 16,550 15,950 32,4005/31/1999 16,520 16,000 32,5006/14/1999 16,250 15,450 31,7506/28/1999 16,300 15,000 31,4007/12/1999 15,600 15,750 31,2007/26/1999 15,350 15,700 30,9008/9/1999 15,400 15,700 31,0008/23/1999 15,100 15,650 30,8009/6/1999 15,000 16,200 31,0009/20/1999 14,450 16,480 30,90010/4/1999 14,250 17,150 31,10010/18/1999 13,550 17,250 30,90011/1/1999 13,900 18,500 32,40011/15/1999 14,300 19,200 33,40011/29/1999 14,280 19,800 34,00012/13/1999 14,200 19,900 34,00012/27/1999 14,200 19,350 33,5001/10/2000 15,000 21,750 36,7001/24/2000 15,380 21,850 37,1002/7/2000 13,300 19,850 33,0502/21/2000 13,200 19,100 32,3003/6/2000 13,050 19,800 32,7003/20/2000 13,000 20,200 33,0004/3/2000 13,100 20,100 33,0004/17/2000 13,100 19,970 32,9005/1/2000 12,850 20,350 33,0005/15/2000 13,100 19,950 32,9005/29/2000 11,750 20,600 32,4006/12/2000 11,350 20,500 31,7006/26/2000 11,100 19,750 30,8007/10/2000 11,000 19,400 30,4007/24/2000 10,750 18,750 29,6008/7/2000 10,750 18,700 29,5008/21/2000 10,400 18,000 28,6009/4/2000 9,800 15,700 25,4009/18/2000 9,500 16,400 25,90010/2/2000 9,450 16,150 25,50010/16/2000 9,100 16,200 25,00010/30/2000 8,450 15,700 24,00011/13/2000 8,550 14,500 23,00011/27/2000 8,150 15,000 23,10012/11/2000 7,750 15,000 22,80012/25/2000 7,500 14,250 21,8001/8/2001 7,000 13,250 20,3501/22/2001 6,900 13,000 20,0002/5/2001 7,100 13,600 20,6002/19/2001 7,200 13,500 20,700

Table A.7. Work Experience Program Participation, New York City, March 1997–September 2001Date Safety Net Assistance Family Assistance Total
166
3/5/2001 7,250 13,250 20,5003/19/2001 7,350 13,000 20,4004/2/2001 6,900 12,600 19,5004/16/2001 7,000 12,750 19,7004/30/2001 6,900 12,700 19,6005/14/2001 6,600 12,500 18,8005/28/2001 6,300 12,200 18,4006/11/2001 6,100 11,900 17,8006/25/2001 5,800 11,400 17,3007/9/2001 5,670 11,200 16,8007/23/2001 5,100 10,350 15,4008/6/2001 5,500 10,500 15,8008/20/2001 5,500 10,250 15,7009/3/2001 5,100 9,700 14,9509/17/2001 5,400 9,600 14,900Sources: Authors’ estimates from New York City Human Resources Administration, PA in NYC: 6-YearEngagement Comparison (New York: New York City Human Resources Administration, October 18, 2001),figures. “Bi-Weekly WEP Roster for FA and SNA through 7/17/01” and “Bi-Weekly WEP Roster through9/17/01.”Note: In New York, Family Assistance was called “Aid to Families with Dependent Children” and Safety NetAssistance was called “Home Relief” before 1998.

167
Table A.8. Engageable Family Assistance Cases, Engagement Status, December 1999
Family Assistance
Total engageable cases 139,078
Distribution
Work Experience Program 16%
Combining work/welfare 22%
Other activities 14%
Education and training 7%
Community service/“needed at home” 6%
Substance abuse treatment 1%
In sanction process 37%
In engagement process 12%
Source: New York City Human Resources Administration, “PA — WeeklyCaseload Engagement Status” (New York: New York City HumanResources Administration, December 1999).
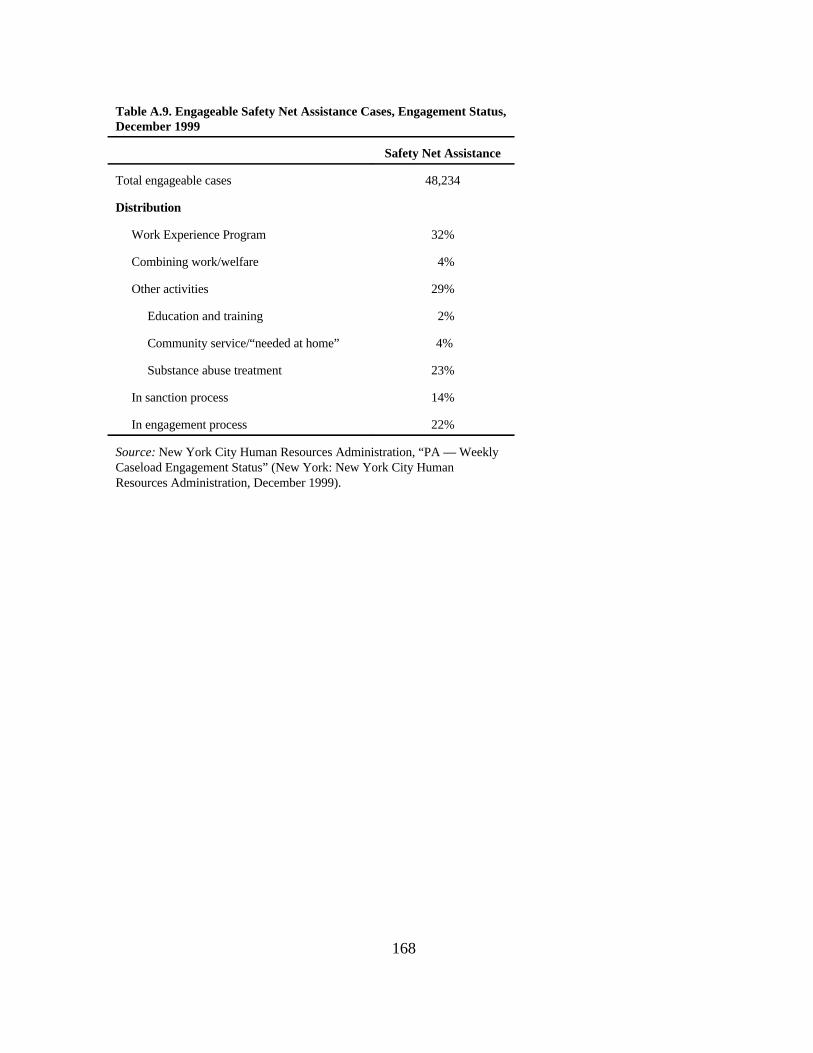
168
Table A.9. Engageable Safety Net Assistance Cases, Engagement Status, December 1999
Safety Net Assistance
Total engageable cases 48,234
Distribution
Work Experience Program 32%
Combining work/welfare 4%
Other activities 29%
Education and training 2%
Community service/“needed at home” 4%
Substance abuse treatment 23%
In sanction process 14%
In engagement process 22%
Source: New York City Human Resources Administration, “PA — WeeklyCaseload Engagement Status” (New York: New York City HumanResources Administration, December 1999).

169
Table A.10. Welfare’s Growth and Decline, United States, 1960–2002
YearNumber
ofCases
Change fromPrevious Year
(%)
UnemploymentRate (%)
Child PovertyRate (%)
Family PovertyRate (%)
19601961196219631964
19651966196719681969
19701971197219731974
19751976197719781979
1980 1981198219831984
19851986198719881989
19901991199219931994
19951996199719981999
787,000869,000931,000947,000992,000
1,039,0001,088,0001,217,000 1,410,0001,698,000
2,208,0002,762,0003,049,0003,148,0003,230,000
3,498,0003,579,0003,588,0003,522,0003,509,000
3,642,0003,870,7653,568,7813,650,7463,724,864
3,691,6103,747,5313,784,0183,747,9483,770,960
3,974,3224,373,8834,768,4954,981,2485,046,263
4,876,2404,553,3393,946,3043,179,1672,642,826
1.7 10.4 7.1 1.7 4.8
4.7 4.7 11.9 15.9 20.4
30.0 25.1 10.4 3.2 2.6
8.3 2.3 0.3 –1.8 –0.4
3.8 6.3 –7.8 2.3 2.0
–0.9 1.5 1.0 –1.0 0.6
5.4 10.1 9.0 4.5 1.3
–3.4 –6.6–13.3–19.4–16.9
5.56.75.55.75.2
4.53.83.83.63.5
4.95.95.64.95.6
8.57.77.16.15.8
7.17.69.79.67.5
7.27.06.25.55.3
5.66.87.56.96.1
5.65.44.94.54.2
26.925.625.023.123.0
21.017.616.615.614.0
15.115.315.114.415.4
17.116.016.215.916.4
18.320.021.922.321.5
20.720.520.319.519.6
20.621.822.322.721.8
20.820.519.918.916.9
212120––
–––––
–––––
–––––
–––––
–––––
–––––
–––––

170
20002001
2002 (June)
2,268,6532,123,3062,029,481
–14.2 –6.4 –4.4
4.04.85.9
16.216.3
–
– ––
Sources: For caseload from 1936 to 1999: U.S. Department of Health and Human Services, Administration forChildren and Families, ACF News, Statistics, U.S. Welfare Caseloads Information: Temporary Assistance forNeedy Families (TANF), 1936-1999, last updated: 12/14/00 Friday, July 27, 2001, available from:www.acf.dhhs.gov/news/stats/3697.htm, accessed April 29, 2002; for caseload in 2000 and 2001: U.S.Department of Health and Human Services, Office of Planning, Research and Evaluation, Temporary Assistancefor Needy Families Program (TANF): Fourth Annual Report to Congress (Washington, D.C.: U.S. Department ofHealth and Human Services, April 2002), tables 2:1a and 2:1b, pp. II-13 and II-15 available from:www.acf.dhhs.gov/programs/opre/ar2001/chapter02.pdf, accessed May 23, 2002; for caseload in 2002: EliseRicher, Hedieh Rahmanou, and Mark Greenberg, “TANF Caseloads Declined in Most States in Second Quarter,But Most States Saw Increases Over the Last Year,” October 1, 2002, available from:www.clasp.org/DMS/Documents/1033487945.66/caseload_2002_Q2.pdf, accessed October 13, 2002; forpercentage change from previous year: authors’ calculation; for unemployment rate: U.S. Census Bureau,Statistical Abstract of the United States, various years; for child poverty rates: U.S. Census Bureau, “HistoricalPoverty Tables,” table 3, available from www.census.gov/hhes/poverty/histpov/hstpov3.html, accessed November1, 2002.Notes: Cases represent total number of families on welfare, which was called “Aid to Dependent Children” from1936 to 1962, “Aid to Families with Dependent Children” (AFDC) from 1962 to 1996, and “TemporaryAssistance for Needy Families” from 1996 to 2001. Totals include AFDC Unemployed Parent program.

171
Table A.11. Welfare’s Growth and Decline, New York City, 1960–2002
Year FASNA/HR
SNA/5 YrLimit
TotalPA Year FA
SNA/HR
SNA/5 YrLimit
TotalPA
1960 47,497 18,714 – 66,211 1992 264,392 220,558 – 484,950
1961 52,997 17,960 – 70,957 1993 293,962 231,537 – 525,499
1962 56,897 16,665 – 73,561 1994 312,127 242,089 – 554,216
1963 64,251 19,670 – 83,921 1995 312,220 215,513 – 527,734
1964 74,579 26,217 – 100,796 1996 291,491 165,308 – 456,799
1965 85,960 32,516 – 118,476 1997 256,448 142,899 – 399,347
1966 101,233 37,737 – 138,970 1998 224,322 124,530 – 348,852
1967 130,059 53,985 – 184,044 1999 202,764 101,671 – 304,435
1968 167,404 77,232 – 244,635 2000 178,821 88,218 – 267,038
1969 197,492 76,906 – 274,398 2001 153,239 78,356 – 233,613
1970 216,485 71,268 – 287,753
1971 240,783 71,331 – 312,114 Monthly, January 2001–July 2002
1972 252,128 75,226 – 327,355
1973 247,915 64,291 – 312,206 Jan. 01 167,343 84,640 – 251,983
1974 242,000 58,446 – 300,446 Feb. 01 164,066 82,705 – 246,771
1975 249,724 80,653 – 330,377 Mar. 01 162,359 83,273 – 245,632
1976 255,454 101,903 – 357,357 Apr. 01 160,302 82,790 – 243,092
1977 256,299 104,327 – 360,625 May 01 159,097 82,673 – 241,770
1978 245,954 101,946 – 347,900 Jun. 01 155,901 79,263 – 235,164
1979 242,012 100,346 – 342,358 Jly. 01 152,856 75,327 – 228,183
1980 243,998 98,791 – 342,789 Aug. 01 150,879 74,083 – 224,962
1981 245,865 96,745 – 342,610 Sep. 01 147,587 71,657 – 219,244
1982 240,687 105,949 – 346,636 Oct. 01 148,516 73,916 – 222,432
1983 245,647 125,327 – 370,974 Nov. 01 148,608 74,828 – 223,436
1984 251,617 136,284 – 387,901 Dec. 01 121,351 75,115 24,221 220,687
1985 252,619 142,948 – 395,567 Jan. 02 112,813 76,933 30,729 220,475
1986 247,715 138,939 – 386,654 Feb. 02 107,392 76,947 32,677 217,016
1987 242,432 127,236 – 369,667 Mar. 02 102,765 77,795 34,967 215,527
1988 236,417 119,724 – 356,142 Apr. 02 98,942 76,868 36,556 212,366
1989 227,615 129,896 – 357,511 May 02 98,080 76,199 36,938 211,217
1990 231,879 160,743 – 392,622 Jun. 02 95,278 75,185 38,171 208,634
1991 248,653 195,678 – 444,331 Jly. 02 93,644 74,074 38,388 206,106

172
Sources: For 1960–2001: New York City Human Resources Administration, Office of Program Reporting, Analysis,and Accountability, unpublished data, April 3, 2002; for 2002: New York City Human Resources Administration,Office of Program Reporting, Analysis, and Accountability, HRA Facts, available from:www.nyc.gov/html/hra/html/hrafacts.html, accessed January 20, 2003.Note: FA, Family Assistance (Aid to Families with Dependent Children/Temporary Assistance for Needy Families);PA, Public Assistance; SNA/HR, Safety Net Assistance/Home Relief; SNA/5 Yr Limit, Cases converted to SNA afterexhausting the five-year limit on TANF receipt.

173
Table A.12. Family Assistance Declines, New York City versus Rest of State,1993–2002
Year
Average Monthly Caseload
NYC %New York State New York City
1993 440,536 293,962 67
1994 459,157 312,127 68
1995 451,633 312,220 69
1996 422,557 293,303 69
1997 371,868 258,387 69
1998 323,723 225,651 70
1999 284,985 202,718 71
2000 247,890 178,635 72
2001 215,321 153,239 71
2002 188,716 131,898 70
Source: New York State, Office of Temporary and Disability Assistance, Temporary andDisability Assistance Statistics (Albany: New York State, Office of Temporary andDisability Assistance, various years).Notes: In New York, welfare was called “Aid to Families with Dependent Children” before1998 and “Family Assistance” (FA) after 1998. Data for 2002 are for July 2002, and theyinclude the FA cases that were converted to Safety Net Assistance after exhausting theirfive-year time-limited benefits.
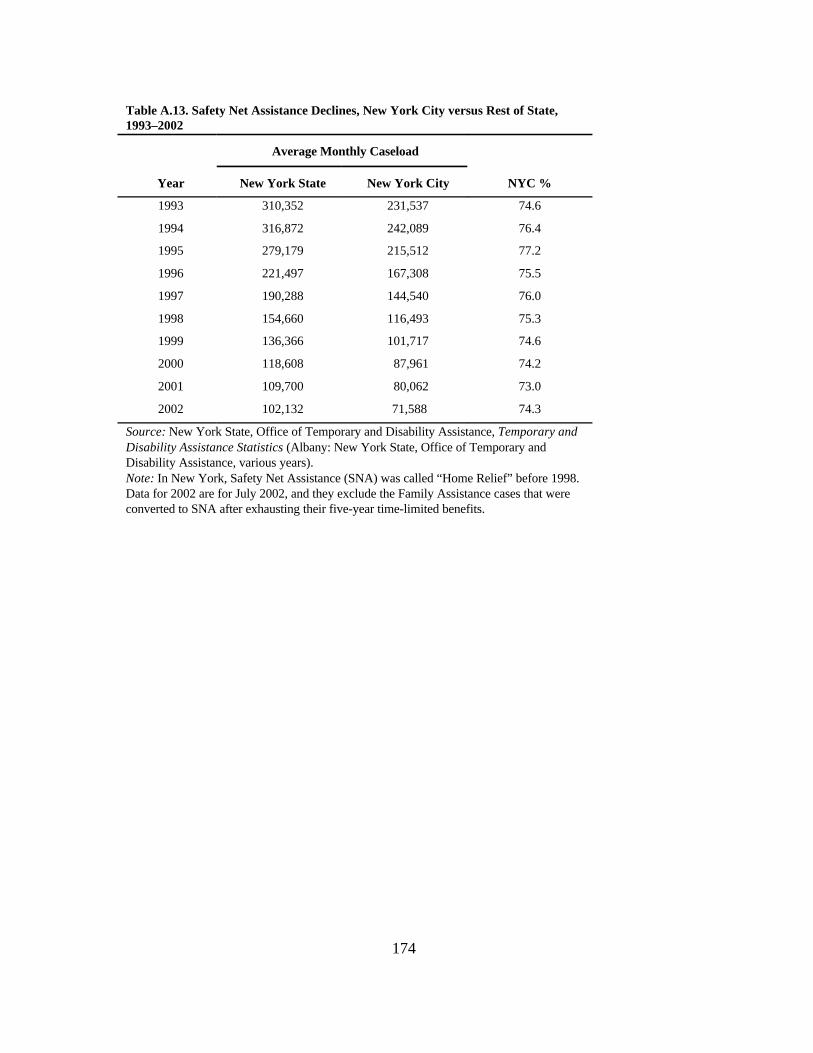
174
Table A.13. Safety Net Assistance Declines, New York City versus Rest of State,1993–2002
Year
Average Monthly Caseload
NYC %New York State New York City
1993 310,352 231,537 74.6
1994 316,872 242,089 76.4
1995 279,179 215,512 77.2
1996 221,497 167,308 75.5
1997 190,288 144,540 76.0
1998 154,660 116,493 75.3
1999 136,366 101,717 74.6
2000 118,608 87,961 74.2
2001 109,700 80,062 73.0
2002 102,132 71,588 74.3
Source: New York State, Office of Temporary and Disability Assistance, Temporary andDisability Assistance Statistics (Albany: New York State, Office of Temporary andDisability Assistance, various years).Note: In New York, Safety Net Assistance (SNA) was called “Home Relief” before 1998.Data for 2002 are for July 2002, and they exclude the Family Assistance cases that wereconverted to SNA after exhausting their five-year time-limited benefits.

175
Table A.14. Family Assistance: Total Openings and Closings, New York City, 1993–2001
Year Caseload Total Openings Closings
1993 293,962 100,359 88,371
1994 312,127 86, 023 77,692
1995 312,220 81,029 101,639
1996 291,491 85,737 123,754
1997 256,448 69,534 100,430
1998 224,322 72,395 106,650
1999 202,764 75,999 96,590
2000 178,821 89,348 115,817
2001 153,263 91,375 114,752
Source: New York City Human Resources Administration, Office of Program Reporting, Analysis, andAccountability, unpublished data, April 1, 2002.Notes: Caseload represents the average number of monthly Aid to Families with Dependent Childrencases before 1998 and Family Assistance cases since 1998. Approvals and closings are annual totals.Approvals include new openings (new applications accepted), reapplications (cases closed longer than30 days that are reopened), and reopenings (cases closed that are reopened within 30 days). Closingsrepresent net closings (closings minus reopenings) and reopenings.

176
Table A.15. Family Assistance Applications (Reapplications, New Openings, and Reopenings), Total Openings,and Closings: New York City, 1993–2001
Year Caseload
Openings
ClosingsTotal New Openings Reapplications Reopenings
1993 293,962 100,359 43,968 – 56,390 88,371
1994 312,127 86, 023 38,162 – 47,861 77,692
1995 312,220 81,029 30, 190 – 50,839 101,639
1996 291,491 85,737 17,424 25,348 38,289 123,754
1997 256,448 69,534 13,800 33,753 21,981 100,430
1998 224,322 72,395 13,458 38,386 20,551 106,650
1999 202,764 75,999 15,764 44,103 16,132 96,590
2000 178,821 89,348 17,671 59,122 12,555 115,817
2001 153,263 91,375 17,365 61,303 12,707 114,752
Source: New York City Human Resources Administration, Office of Program Reporting, Analysis, andAccountability, unpublished data, April 1, 2002.Notes: Caseload represents the average number of monthly Aid to Families with Dependent Children cases before1998 and Family Assistance cases since 1998. Approvals and closings are annual totals. Approvals include newopenings (new applications accepted), reapplications (cases closed longer than 30 days that are reopened), andreopenings (cases closed that are reopened within 30 days). Closings represent net closings (closings minusreopenings) and reopenings.

177
Table A.16. Welfare’s Growth and Decline, United States versus New York City, 1960–2002United States New York City
Year AFDC/TANF AFDC/FA SNA/HR Total PA1960 787,000 47,497 18,714 66,2111961 869,000 52,997 17,960 70,9571962 931,000 56,897 16,665 73,5611963 947,000 64,251 19,670 83,9211964 992,000 74,579 26,217 100,7961965 1,039,000 85,960 32,516 118,4761966 1,088,000 101,233 37,737 138,9701967 1,217,000 130,059 53,985 184,0441968 1,410,000 167,404 77,232 244,6351969 1,698,000 197,492 76,906 274,3981970 2,208,000 216,485 71,268 287,7531971 2,762,000 240,783 71,331 312,1141972 3,049,000 252,128 75,226 327,3551973 3,148,000 247,915 64,291 312,2061974 3,230,000 242,000 58,446 300,4461975 3,498,000 249,724 80,653 330,3771976 3,579,000 255,454 101,903 357,3571977 3,588,000 256,299 104,327 360,6251978 3,522,000 245,954 101,946 347,9001979 3,509,000 242,012 100,346 342,3581980 3,642,380 243,998 98,791 342,7891981 3,870,765 245,865 96,745 342,6101982 3,568,781 240,687 105,949 346,6361983 3,650,746 245,647 125,327 370,9741984 3,724,864 251,617 136,284 387,9011985 3,691,610 252,619 142,948 395,5671986 3,747,531 247,715 138,939 386,6541987 3,784,018 242,432 127,236 369,6671988 3,747,948 236,417 119,724 356,1421989 3,770,960 227,615 129,896 357,5111990 3,974,322 231,879 160,743 392,6221991 4,373,883 248,653 195,678 444,3311992 4,768,495 264,392 220,558 484,9501993 4,981,248 293,962 231,537 525,4991994 5,046,263 312,127 242,089 554,2161995 4,876,240 312,220 215,513 527,7341996 4,553,339 291,491 165,308 456,7991997 3,946,304 256,448 142,899 399,3471998 3,179,167 224,322 124,530 348,8521999 2,642,826 202,764 101,671 304,4352000 2,272,210 178,821 88,218 267,0382001 2,123,306 153,239 78,356 233,6132002a 2,024,875 130,413 71,709 202,122
Sources: For U.S. caseload in 1960–1999: U.S. Department of Health and Human Services, Administrationfor Children and Families, ACF News, Statistics, U.S. Welfare Caseloads Information: Temporary Assistancefor Needy Families (TANF), 1936–1999, last updated: 12/14/00 Friday, July 27, 2001, available from:www.acf.dhhs.gov/news/stats/3697.htm, accessed April 29, 2002; for caseload in 2000 and 2001: U.S.Department of Health and Human Services, Office of Planning, Research and Evaluation, TemporaryAssistance for Needy Families Program (TANF): Fourth Annual Report to Congress (Washington, D.C.:

178
U.S. Department of Health and Human Services, April 2002), tables 2:1a and 2:1b, pp. II-13 and II-15available from: www.acf.dhhs.gov/programs/opre/ar2001/chapter02.pdf, accessed May 23, 2002; for caseloadin 2002: U.S. Department of Health and Human Services, Administration for Children and Families, ACFNews, Statistics, U.S. Welfare Caseloads Information: Temporary Assistance for Needy Families, TotalNumber of Families and Recipients, April-June 2002, available from:www.acf.dhhs.gov/news/stats/apr_jun2002_rev.htm, accessed February 4, 2003; for New York City caseload1960–2001: New York City Human Resources Administration, Office of Program Reporting, Analysis, andAccountability, unpublished data, April 3, 2002; for 2002: New York City Human Resources Administration,Office of Program Reporting, Analysis, and Accountability, HRA Facts, available from:www.nyc.gov/html/hra/html/hrafacts.html, accessed January 20, 2003.Notes: FA, Family Assistance (Aid to Families with Dependent Children/Temporary Assistance for NeedyFamilies); SNA/HR, Safety Net Assistance/Home Relief. In New York, Family Assistance was called “Aid toFamilies with Dependent Children” and Safety Net Assistance was called “Home Relief” before 1998.aNumber in June 2002 for U.S. caseload, in July 2002 for New York City caseload. AFDC/FA number forNew York City includes cases converted to SNA after exhausting the five-year limit on TANF receipt, and forSNA it excludes the converted cases.