Fulfillment Breakout – Gary Neights, Elemica: “Demand-Side Order Automation Metrics”
16
Elemica – T&L sourcing Optimization
-
Upload
elemica -
Category
Technology
-
view
76 -
download
3
Transcript of Fulfillment Breakout – Gary Neights, Elemica: “Demand-Side Order Automation Metrics”

Elemica – T&L sourcing
Optimization

Why Strategic T&L
sourcing
According to studies by Dickson (1966), Weber and Current (1993) and a more recent one by Sucky (2005)

Trend in T&L sourcing
• Tender complexity increases
– From local to regional tendering
– From service specific to
Network
• Increasing Supply chain
performance demands
– Transit time reliability
– Ability to absorb disruptions,
Alternative services and routings

Optimize your tendering
process
Speed up your decision process
• Develop awarding scenario’s
upfront and check after every
round where you are.
• Know your implementation cost
before you consider switching
suppliers.
• Reduce your workload during a
tender, focus only on those
area’s where you can gain.

Optimize your analyses
• Utilize your historical data to simulate the
cost of your future network with elements
such as:
– Weights/volumes.
– Peaks
– Routings
• Execute a sensitivity checks: currencies,
fuel, e.d.

Optimize the decision
• Find the best between • Current status and Cheapest pricing
• quality and timeliness
• Mitigate supplier risks to supply chain disruption
• Current and alternative performance (better or worse)
• Use the knowledge from your historical data.• disturbances, reliability

We have a great tool
Our tool helps you to support these decisions.
• It evaluate the effects of your awarding scenario’s
with a baseline: What if you would stick to our
incumbents.
• Scenario’s are based on various constrains.
– It quantifies the financial impact your objectives
or constrains have.
• For example: reduce the nr carriers by location to 1.
– You compare the difference and measure it
against the effects to your supply chain.

Scenario builder

An example
Small parcels
• Small parcels • Weight < 70 kg
• Dimensions:
Max hight = 60 cm
Max width = 60 cm
Max length = 120 cm
and 2* Hight + 2*width + length < 3 meter.
• Service • World wide pick-up or delivery
• Express delivery before 9, 12 or end of day
• Expedited service (consolidation and slower
transport means)

Market
• Main players are
– UPS
– DHL
– Fedex
– TNT
– GLS
Each of these players have own “strong area’s”
where they are able to offer “domestic” small
parcel services.
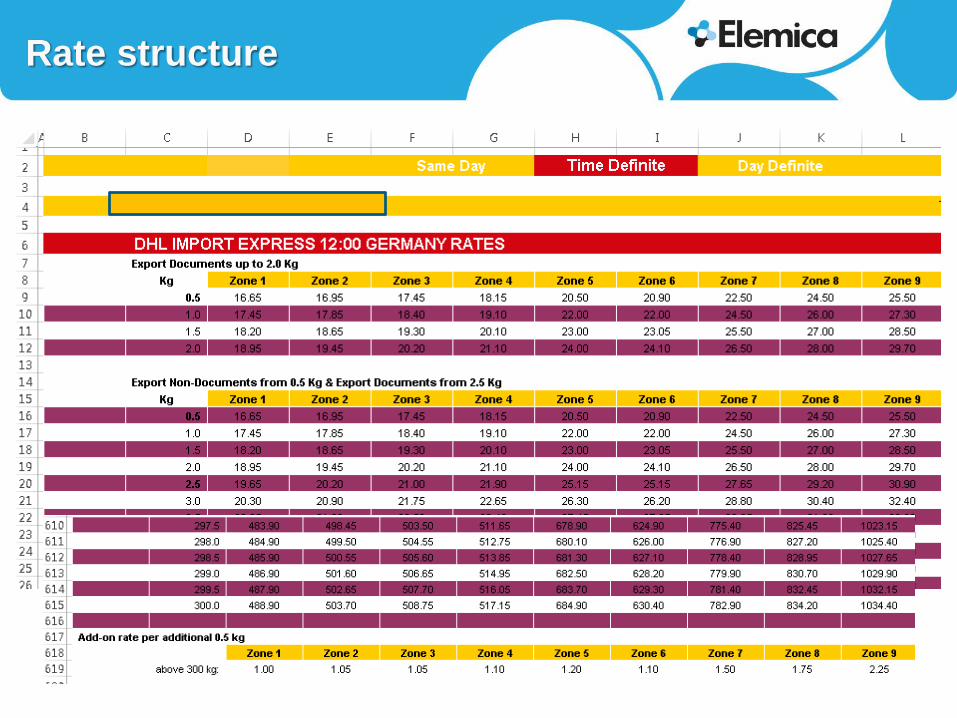
Rate structure

Zoning

Zoning
Focus changed
• Focus has changed from Zone, rate
calculation towards surcharges.
– Fuel can be 0% up to 20% of the cost
• Varies by carrier, Service and freight payer
– Customs clearance
– Special surcharges. Out of business regions etc

Decision making
• Scenario’s
24% saving 28% saving 30% saving
Scenario 1 Scenario 2 Scenario 3
one service provider for
the region
one service provider by
country
one service provider by
direction/country
229,636 266,717 285,949

Where do we go to:
• We look for Reliability and quality of your
service providers. The data collected in the
Operating network provides you insight to
current strength and weaknesses of your
partners.
• Model probabilities on:Carrier Transit times,
Seasonal effects
0
0.2
0.4
0.6
0.8
1
1.2
1 2 3 4 5 6
lane data distributionof carrier 1 on lane 6
gamma distribution(aplha=0.9, beta =2)