Fulcher standardized testing
44
STANDARDISED TESTING Fulcher (2010) Presenter Melika Rajabi
Transcript of Fulcher standardized testing
STANDARDISED TESTING
Fulcher (2010)
Presenter Melika Rajabi
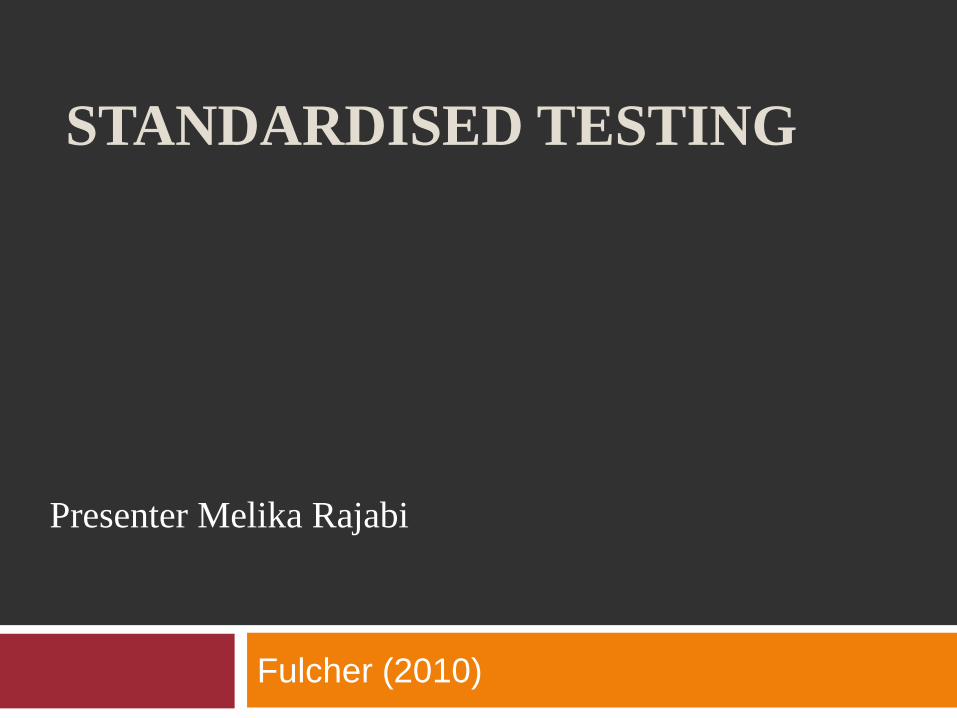
Two paradigms
norm-referenced testing
is the normative approach in educational testing.
Individuals are compared to each other.
The meaning of the score on a test is derived from the position
of an individual in relation to others. If the purpose of testing is
to distribute rare resources fairly like university places , we
need a test that separates out the test takers very effectively.
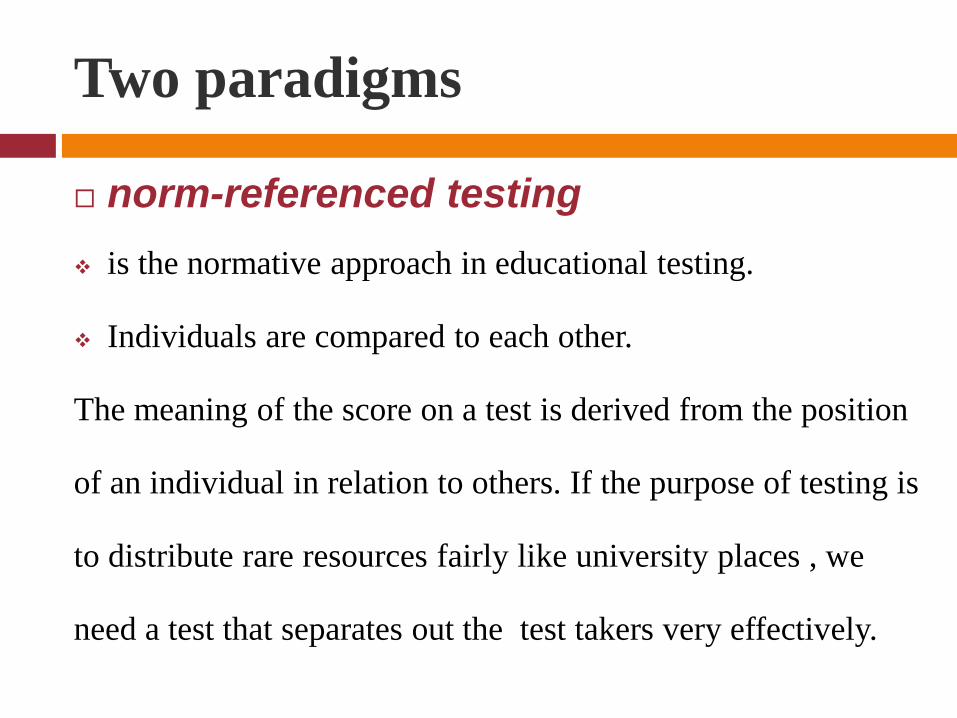
Two paradigms
The primary requirement of the test is that it should discriminate between
test takers.
The high-scoring test takers are offered places at the most prestigious
institutions, while those on lower scores may not be so fortunate. The
decision makers need the test takers to be ‘spread out’ over the range of test
scores, and this spread is called the distribution.
It has a long history, and its principles and assumptions still dominate
the testing industry today.

Two paradigms
criterion-referenced testing
The idea was first discussed in 1960s.
informs testing and assessment that is related to instructional decisions
much more than norm referenced testing.
The purpose of a criterion-referenced test is to make a decision about
whether an individual test taker has achieved a pre-specified criterion, or
standard, that is required for a particular decision context.
Like mastery tests
Testing as science
The rise of testing began during the First World War.
For the first time in history, industry was organised on a large and efficient scale in order to produce the materials necessary for military success.
With it came the need to count, measure, and quantify on a completely new scale. In an early study of labour efficiency, Greenwood (1919: 186) takes as his rationale the dictum of the natural scientist, Kelvin:
When you can measure what you are speaking about and express it in
numbers, you know something about it, but when you cannot measure it, when
you cannot express it in numbers, your knowledge is of a meagre and
unsatisfactory kind.
the First World War saw the dramatic rise of large-scale testing.
Psychologists wished to contribute to the war effort and show that testing was a scientific discipline (Kelves, 1968).
Testing as science
Tests are about measuring knowledge, skills or
abilities (‘KSAs’) and expressing their existence, or
degree or presence, in numerical form.
The assumption is that, once we are able to do this,
we have ‘genuine’ knowledge.
Testing as science
Shohamy (2001: 21) correctly identifies this as one
of the key features of the ‘power of tests’:
The language of science in Western societies
grants
authority, status and power. Testing is perceived
as a
scientific discipline because it is experimental,
statistical
and uses numbers. It is viewed as objective, fair,
true
and trustworthy.
Testing as science
When the Great War broke measurement and scientific progress went
hand in hand.
Measurement had in fact been seen as the most important development in
scientific research since the early nineteenth century.
Cattell (1893) said:
The history of science is the history of measurement. Those departments of
Knowledge in which measurement could be used most readily were the first
to become sciences, and those sciences are at the present time the furthest
advanced in which measurement is the most extended and the most exact.
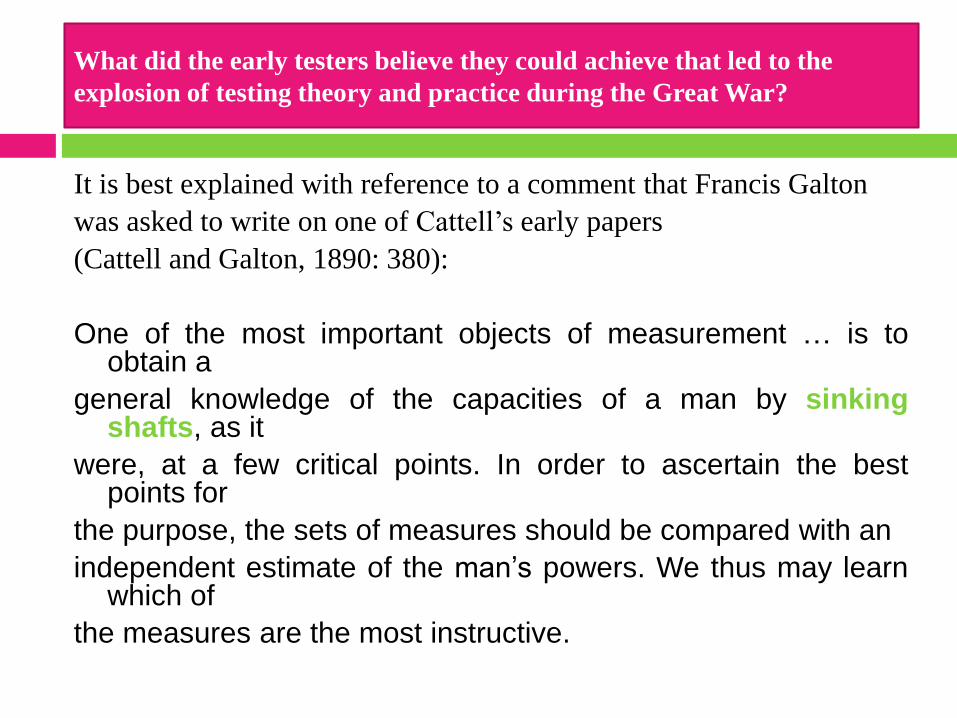
What did the early testers believe they could achieve that led to the
explosion of testing theory and practice during the Great War?
It is best explained with reference to a comment that Francis Galton
was asked to write on one of Cattell’s early papers
(Cattell and Galton, 1890: 380):
One of the most important objects of measurement … is toobtain a
general knowledge of the capacities of a man by sinkingshafts, as it
were, at a few critical points. In order to ascertain the bestpoints for
the purpose, the sets of measures should be compared with an
independent estimate of the man’s powers. We thus may learnwhich of
the measures are the most instructive.
Testing as science
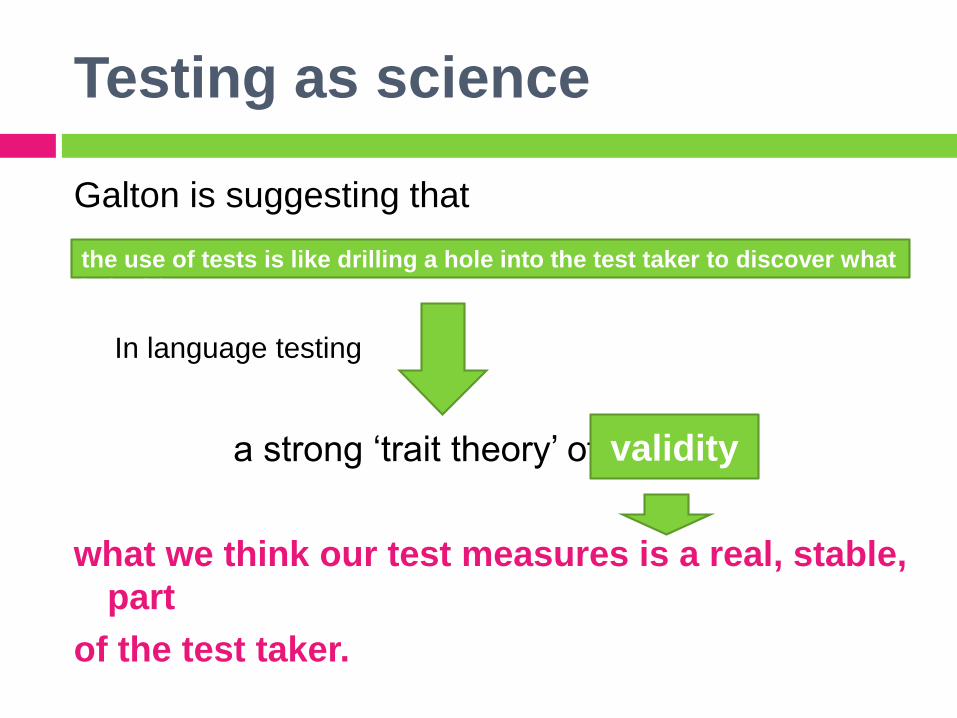
Galton is suggesting that
In language testing
a strong ‘trait theory’ of
what we think our test measures is a real, stable,
part
of the test taker.
the use of tests is like drilling a hole into the test taker to discover what
is inside.
validity
Testing as science
In order to make a decision about which tests are the
best measures, we need to compare the results of the
test with an independent estimate of whatever the
test is designed to measure.
The external aspect of validity the value of our
measurements can be judged by their relation with
other measures of the same property.
Testing as science
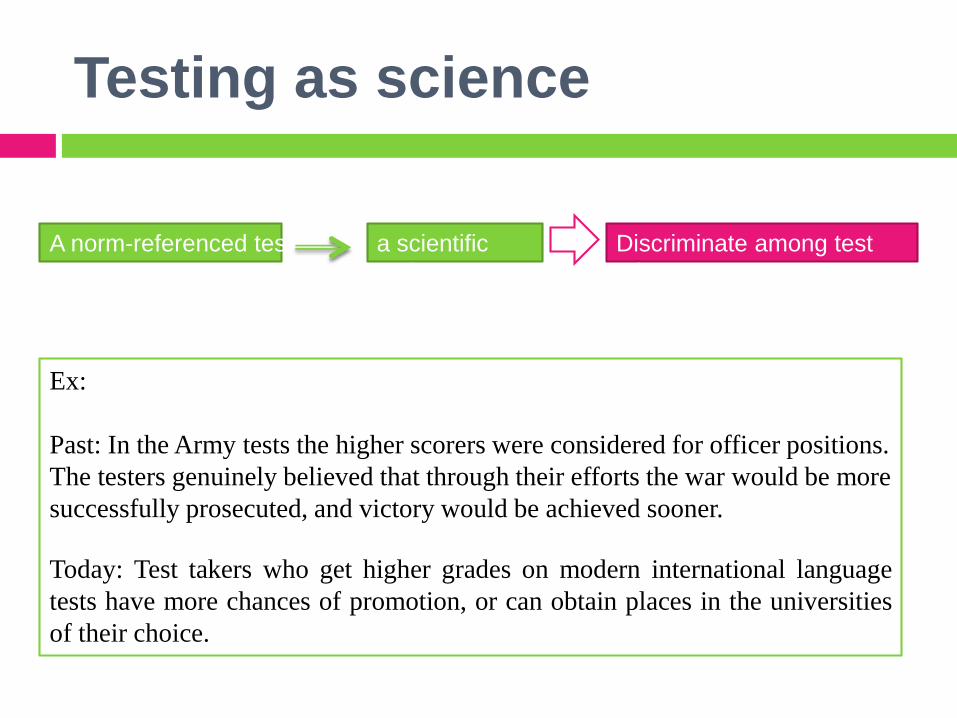
A norm-referenced test a scientific
tool
Discriminate among test
takers
Ex:
Past: In the Army tests the higher scorers were considered for officer positions.
The testers genuinely believed that through their efforts the war would be more
successfully prosecuted, and victory would be achieved sooner.
Today: Test takers who get higher grades on modern international language
tests have more chances of promotion, or can obtain places in the universities
of their choice.
Testing as science
a view of testing as ‘scientific’ has always been controversial.
Lipman (1922), argued that a strong trait theory is untenable. In
fact, most of the traits or constructs that we work with are
extremely difficult to define, and if we are not able to define
them, measurement is even more problematic.

What is in a curve?
What is in a curve?
It is possible for an illiterate enlisted man to get a score thatis similar to that obtained by a low-scoring – or even amiddle-scoring – officer. But it is highly unlikely.
Also, someone who is really officer material may get ascore similar to that expected of a high scoring illiterate.Once again, this is highly unlikely, but possible.
If we look at the intersection between the officer curve and the sergeants’ curve, however, the possibility that an officer would get the same score as a sergeant and vice versa is much higher and placement into an appropriate category becomes more difficult. This is the problem of setting cut scores on tests in order to make decisions
The curve and score meaning
In norm-referenced testing the meaning of a
score is directly related to its place in the
curve of the distribution from which it is
drawn, because it tells us how an individual
with this score relates to the rest of the test-
taking population.
Each individual is compared with all other
individuals in the distribution.
The curve and score meaning
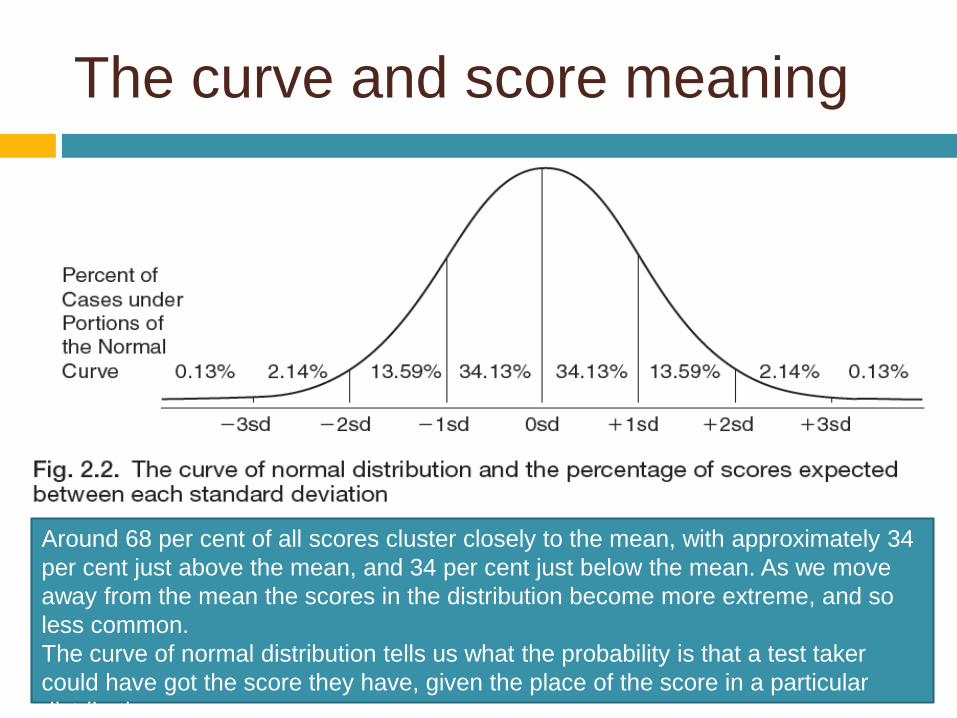
Around 68 per cent of all scores cluster closely to the mean, with approximately 34
per cent just above the mean, and 34 per cent just below the mean. As we move
away from the mean the scores in the distribution become more extreme, and so
less common.
The curve of normal distribution tells us what the probability is that a test taker
could have got the score they have, given the place of the score in a particular
distribution.
Putting it into practice
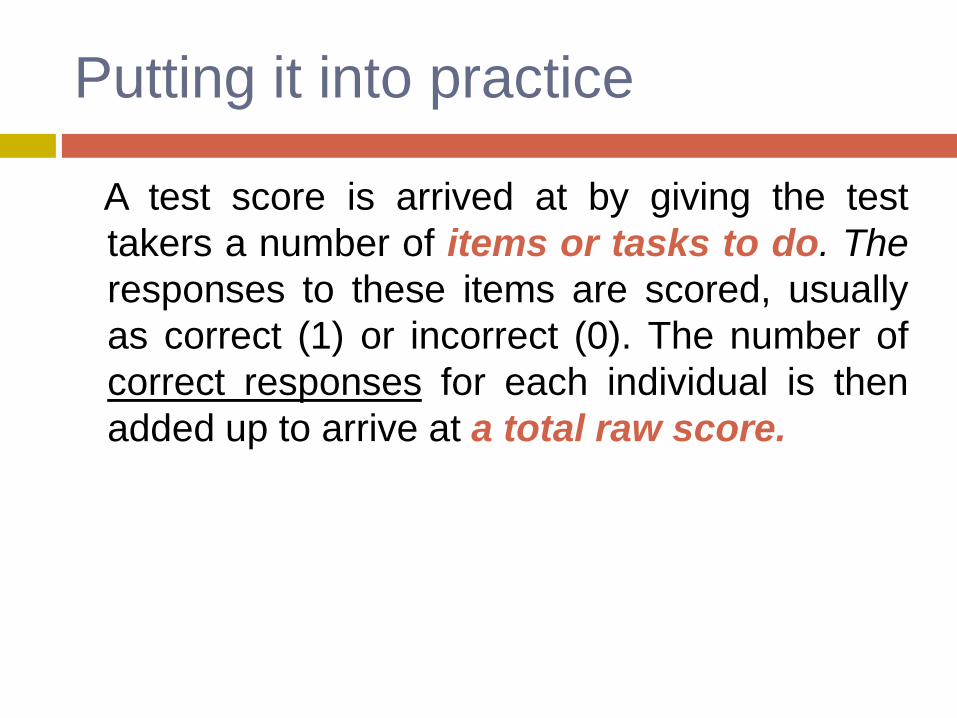
A test score is arrived at by giving the test
takers a number of items or tasks to do. The
responses to these items are scored, usually
as correct (1) or incorrect (0). The number of
correct responses for each individual is then
added up to arrive at a total raw score.

Putting it into practice
Mode: The most frequent score in a distribution.
(11)
Median: The score that falls in the middle of the
distribution.
Mean: is calculated by adding all the scores
together
and dividing the total by the number of test
takers.
Putting it into practice
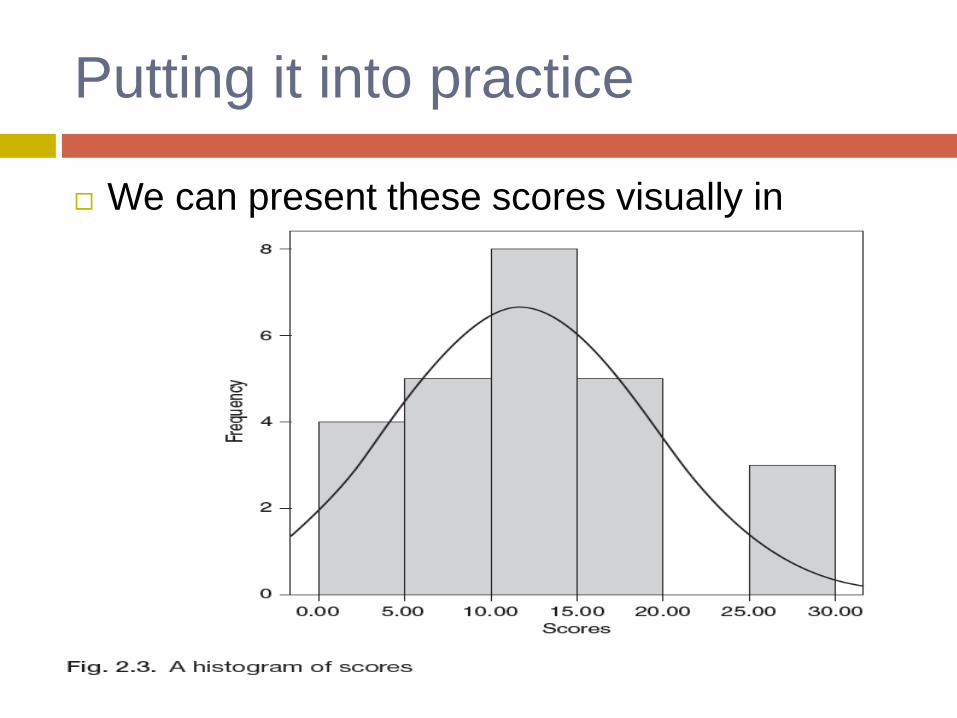
We can present these scores visually in
histograms
Putting it into practice
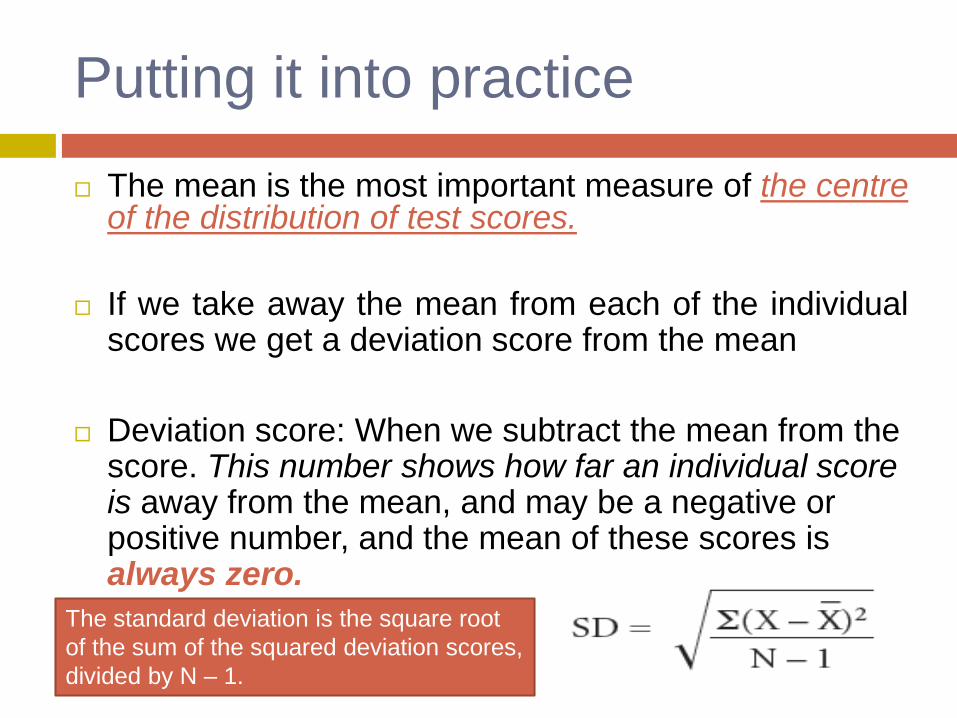
The mean is the most important measure of the centreof the distribution of test scores.
If we take away the mean from each of the individualscores we get a deviation score from the mean
Deviation score: When we subtract the mean from the score. This number shows how far an individual score is away from the mean, and may be a negative or positive number, and the mean of these scores is always zero.
The standard deviation is the square root
of the sum of the squared deviation scores,
divided by N – 1.
Putting it into practice
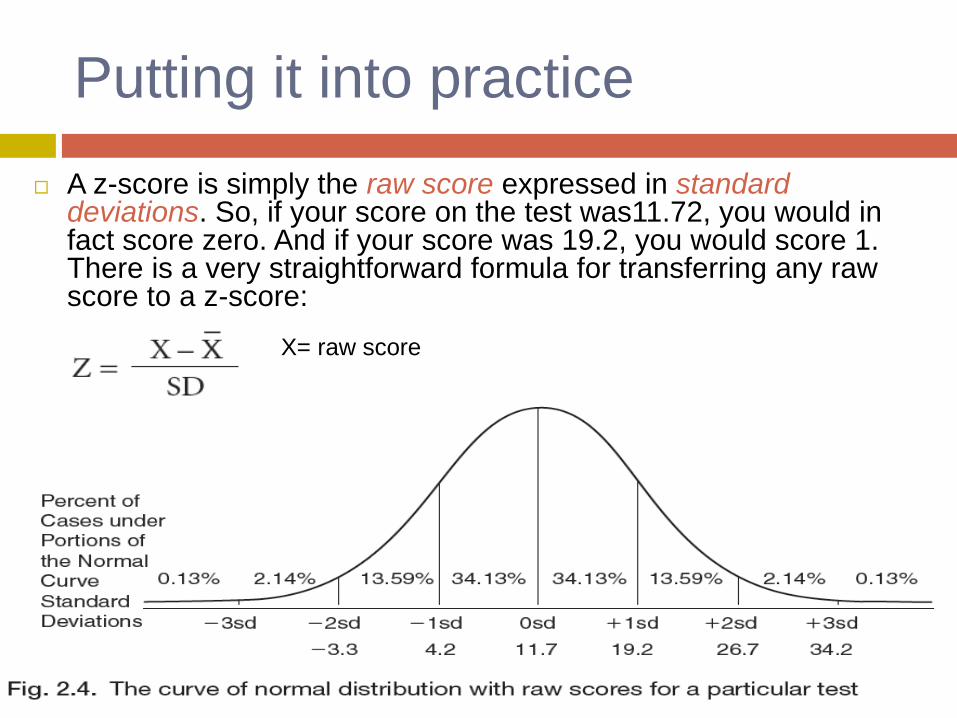
A z-score is simply the raw score expressed in standard deviations. So, if your score on the test was11.72, you would in fact score zero. And if your score was 19.2, you would score 1. There is a very straightforward formula for transferring any raw score to a z-score:
X= raw score
Test scores in a consumer age
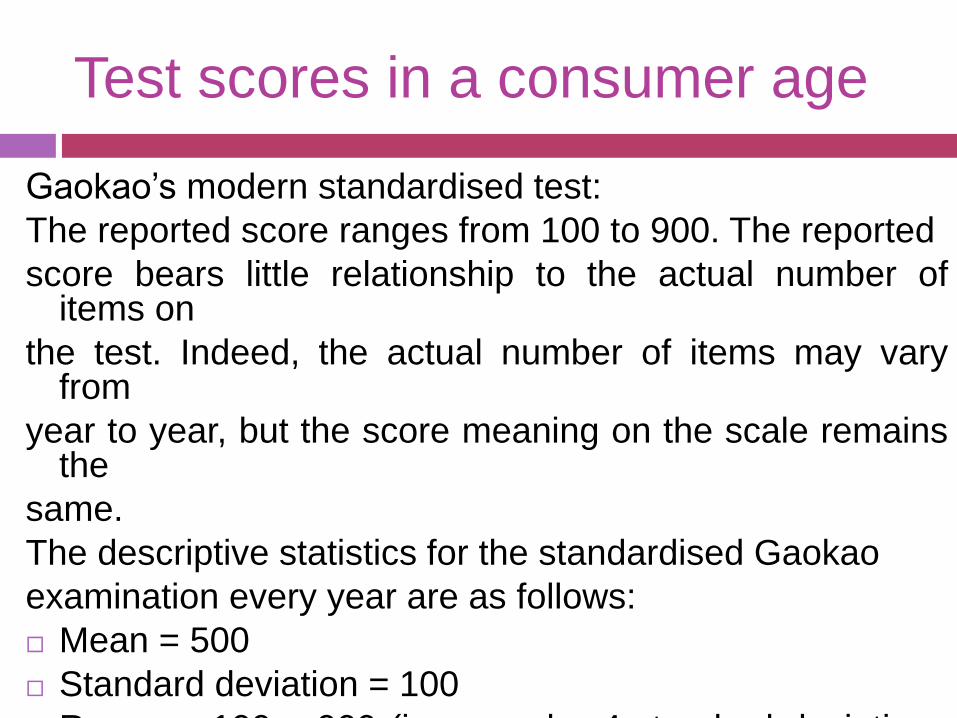
Gaokao’s modern standardised test:
The reported score ranges from 100 to 900. The reported
score bears little relationship to the actual number ofitems on
the test. Indeed, the actual number of items may varyfrom
year to year, but the score meaning on the scale remainsthe
same.
The descriptive statistics for the standardised Gaokao
examination every year are as follows:
Mean = 500
Standard deviation = 100
Range = 100 – 900 (i.e. – and + 4 standard deviations
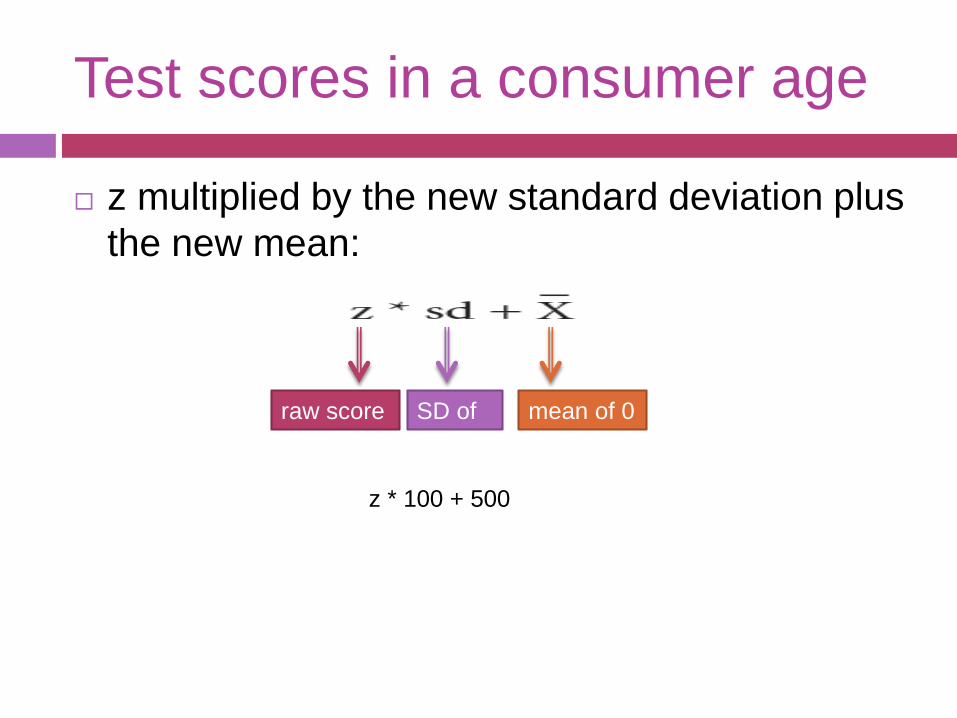
Test scores in a consumer age
z multiplied by the new standard deviation plus
the new mean:
raw score mean of 0SD of
1
z * 100 + 500
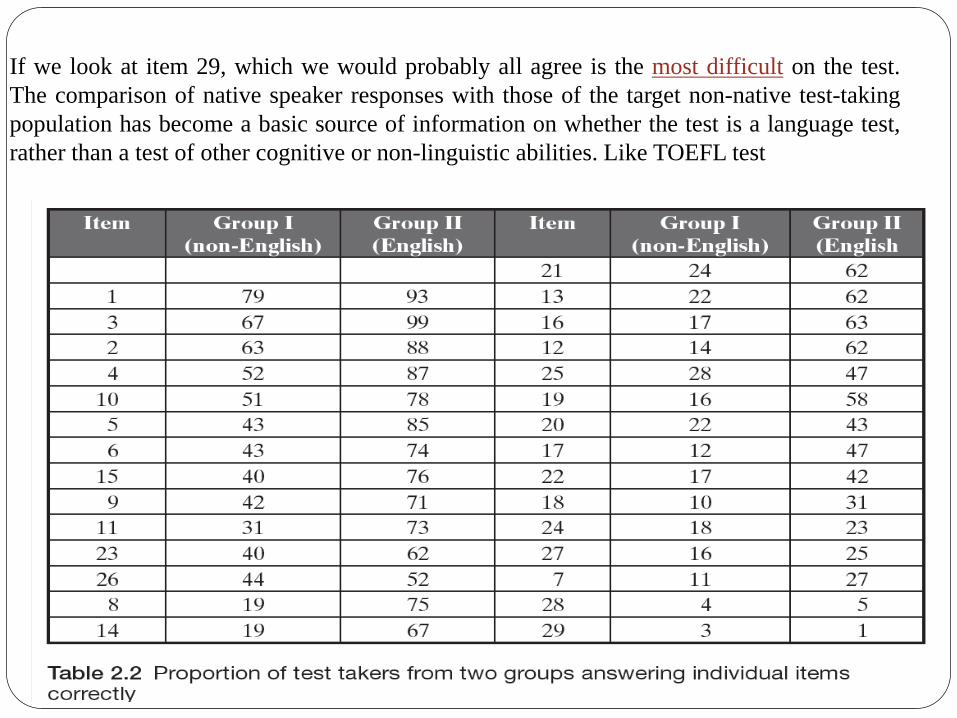
If we look at item 29, which we would probably all agree is the most difficult on the test.
The comparison of native speaker responses with those of the target non-native test-taking
population has become a basic source of information on whether the test is a language test,
rather than a test of other cognitive or non-linguistic abilities. Like TOEFL test
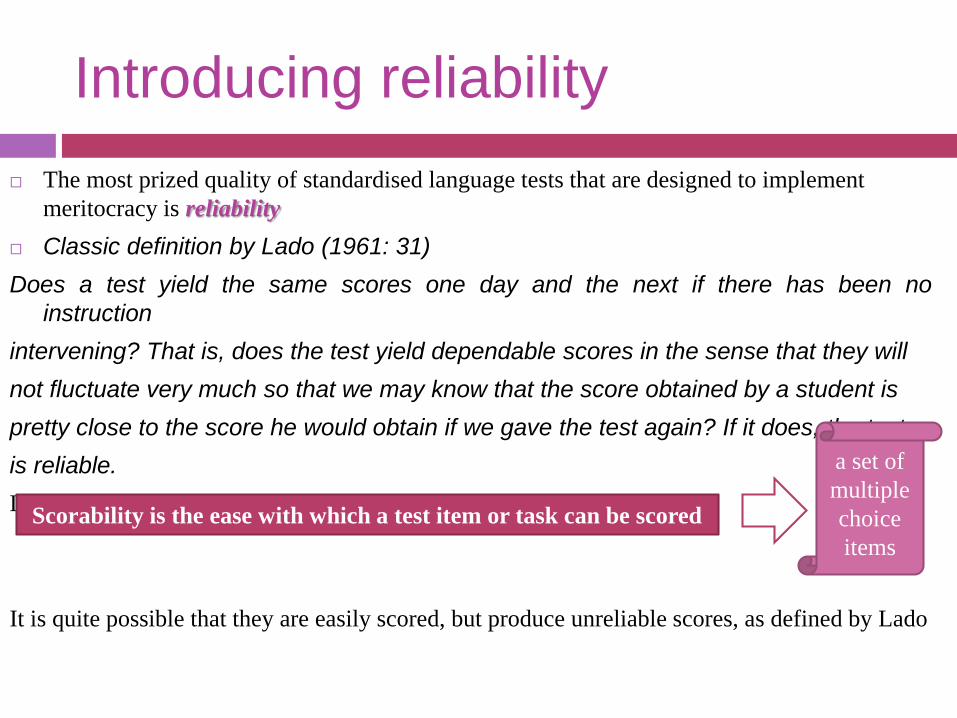
Introducing reliability
The most prized quality of standardised language tests that are designed to implement
meritocracy is reliability
Classic definition by Lado (1961: 31)
Does a test yield the same scores one day and the next if there has been no
instruction
intervening? That is, does the test yield dependable scores in the sense that they will
not fluctuate very much so that we may know that the score obtained by a student is
pretty close to the score he would obtain if we gave the test again? If it does, the test
is reliable.
Lado specifically separated the quality of reliability from scorability.Scorability is the ease with which a test item or task can be scored
a set of
multiple
choice
items
It is quite possible that they are easily scored, but produce unreliable scores, as defined by Lado
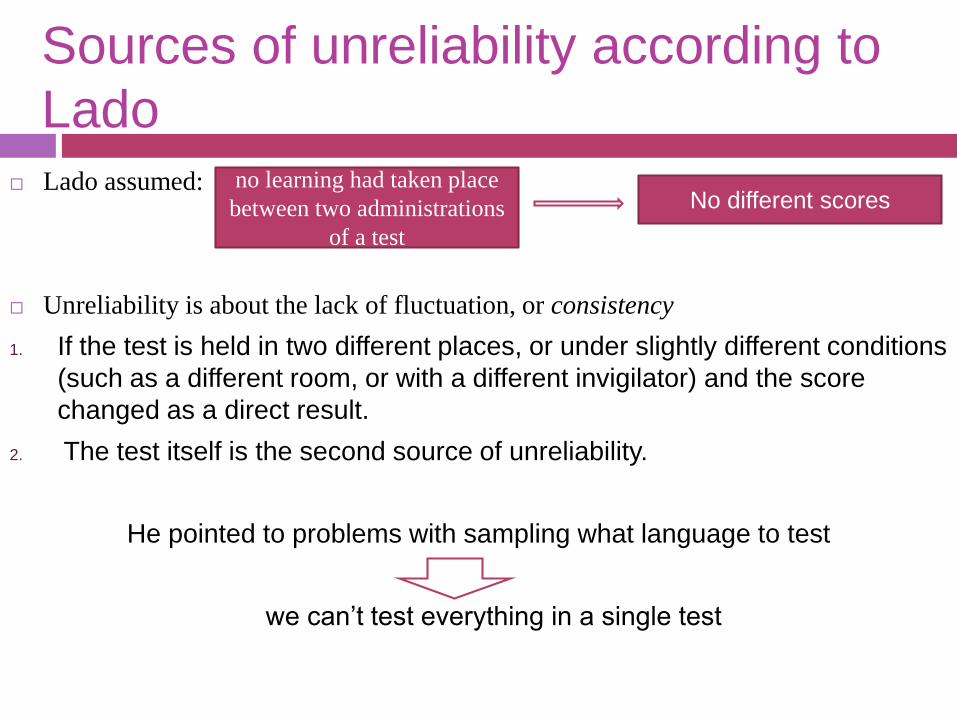
Sources of unreliability according to
Lado
Lado assumed:
Unreliability is about the lack of fluctuation, or consistency
1. If the test is held in two different places, or under slightly different conditions
(such as a different room, or with a different invigilator) and the score
changed as a direct result.
2. The test itself is the second source of unreliability.
He pointed to problems with sampling what language to test
we can’t test everything in a single test
no learning had taken place
between two administrations
of a test
No different scores
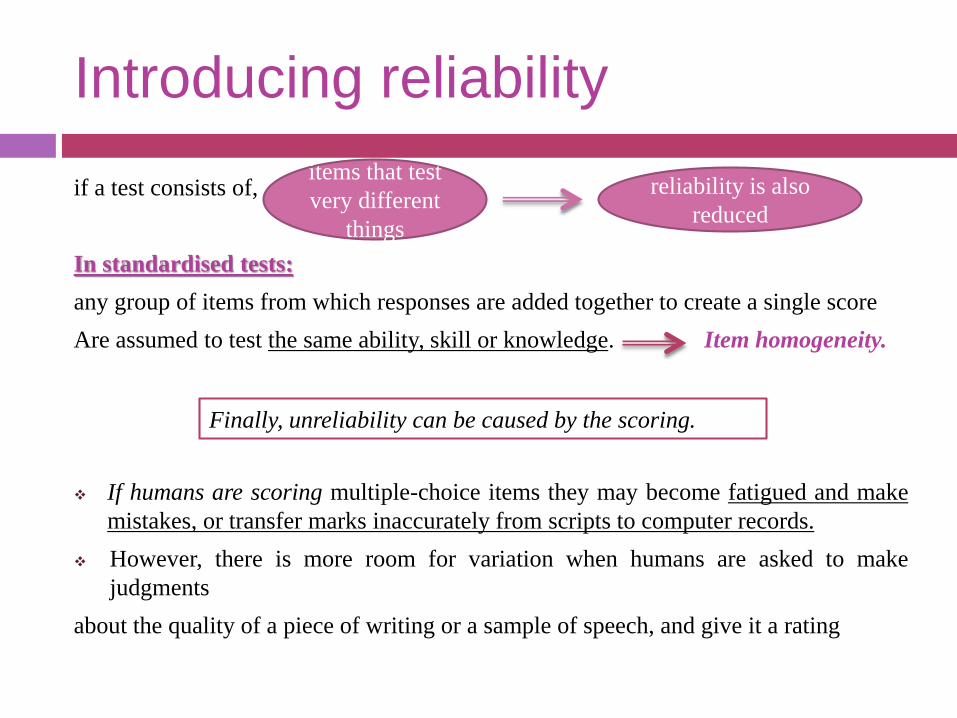
Introducing reliability
if a test consists of,
In standardised tests:
any group of items from which responses are added together to create a single score
Are assumed to test the same ability, skill or knowledge. Item homogeneity.
If humans are scoring multiple-choice items they may become fatigued and make
mistakes, or transfer marks inaccurately from scripts to computer records.
However, there is more room for variation when humans are asked to make
judgments
about the quality of a piece of writing or a sample of speech, and give it a rating
items that test
very different
things
reliability is also
reduced
Finally, unreliability can be caused by the scoring.
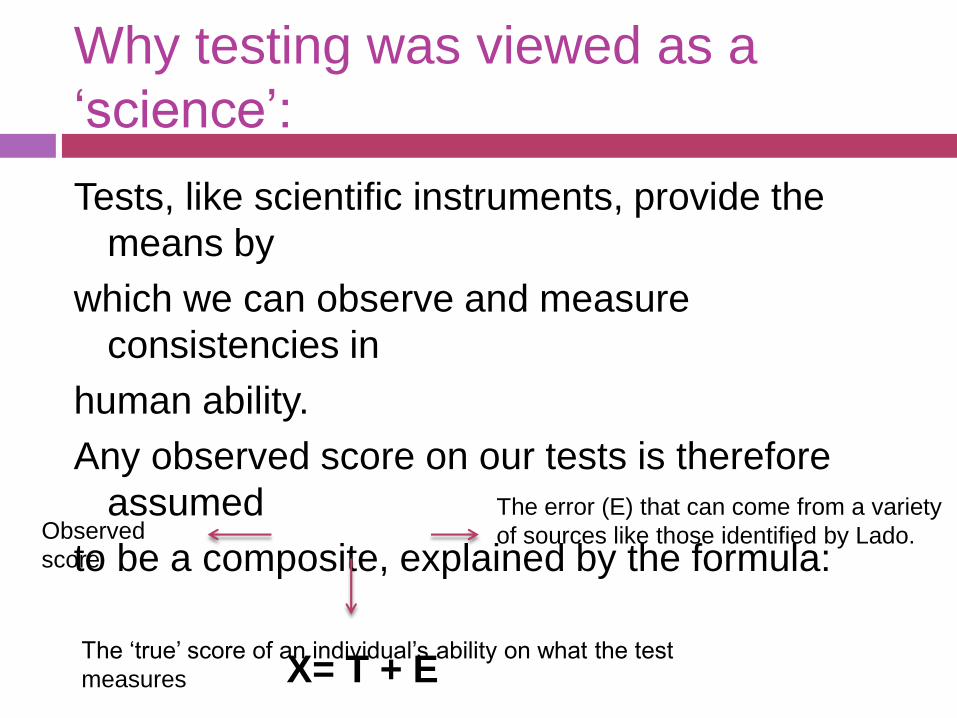
Why testing was viewed as a
‘science’:
Tests, like scientific instruments, provide the
means by
which we can observe and measure
consistencies in
human ability.
Any observed score on our tests is therefore
assumed
to be a composite, explained by the formula:
X= T + E
Observed
score
The ‘true’ score of an individual’s ability on what the test
measures
The error (E) that can come from a variety
of sources like those identified by Lado.
Calculating reliability
It depends upon what kind of error we wish to focus on
a reliability coefficient is calculated that ranges from 0 to 1
No test is ‘perfectly’ reliable. There is always error.
Three areas identified by Lado
Test administrations
The test itself
Marking or rating
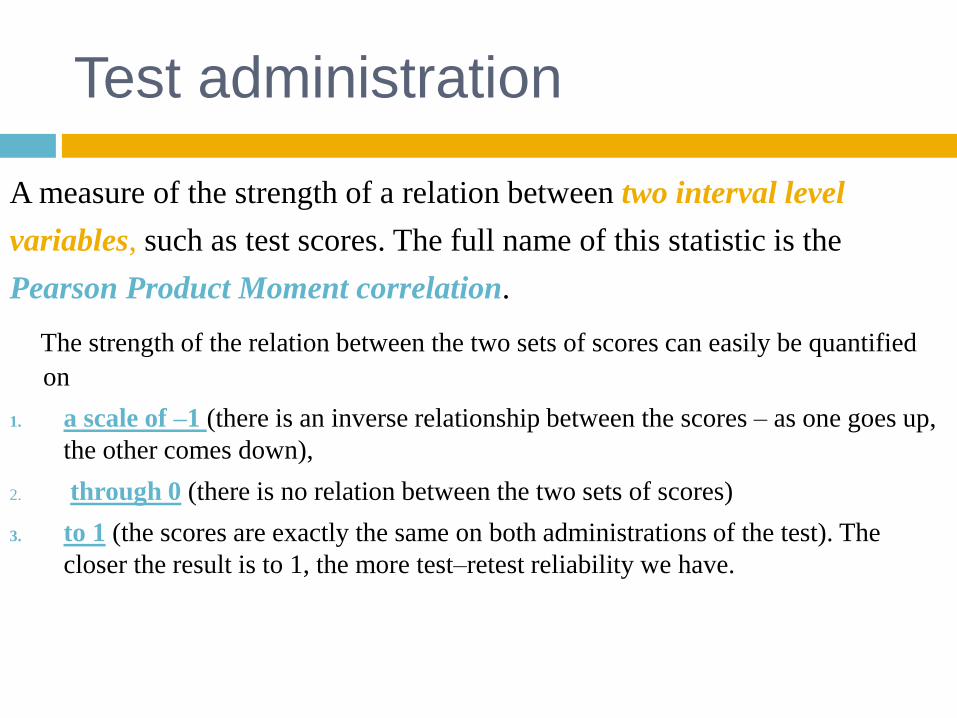
Test administration
A measure of the strength of a relation between two interval level
variables, such as test scores. The full name of this statistic is the
Pearson Product Moment correlation.
The strength of the relation between the two sets of scores can easily be quantified
on
1. a scale of –1 (there is an inverse relationship between the scores – as one goes up,
the other comes down),
2. through 0 (there is no relation between the two sets of scores)
3. to 1 (the scores are exactly the same on both administrations of the test). The
closer the result is to 1, the more test–retest reliability we have.
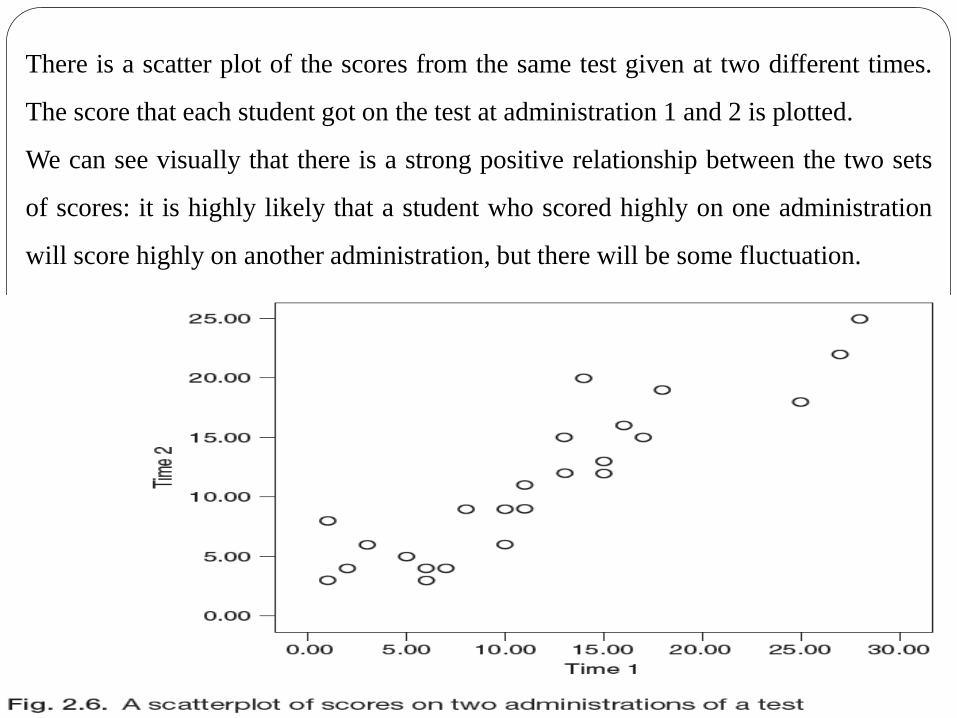
There is a scatter plot of the scores from the same test given at two different times.
The score that each student got on the test at administration 1 and 2 is plotted.
We can see visually that there is a strong positive relationship between the two sets
of scores: it is highly likely that a student who scored highly on one administration
will score highly on another administration, but there will be some fluctuation.
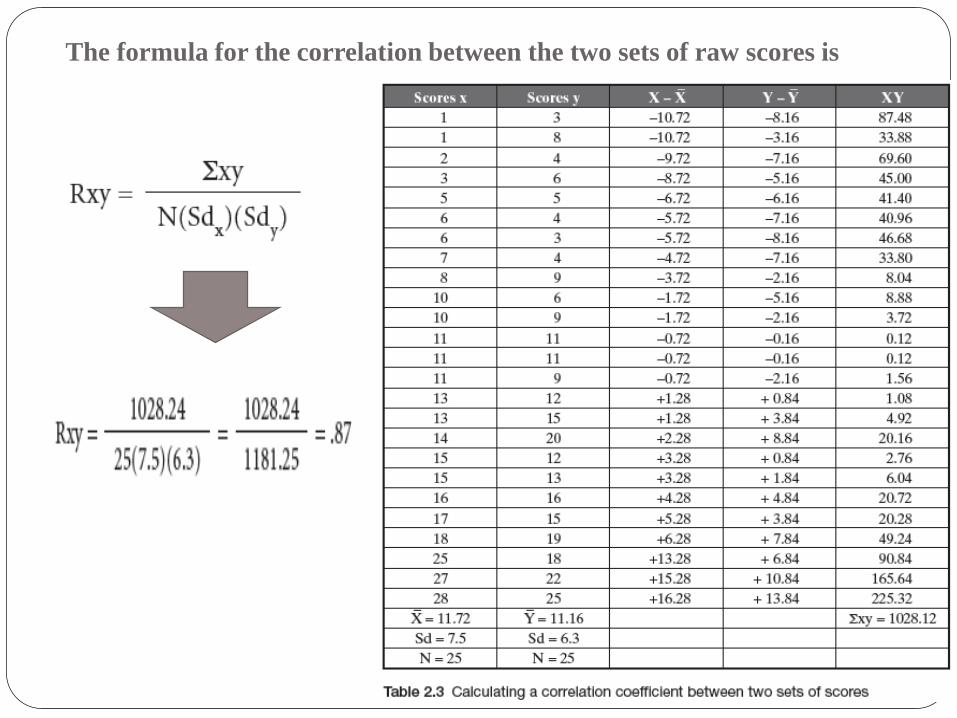
The formula for the correlation between the two sets of raw scores is
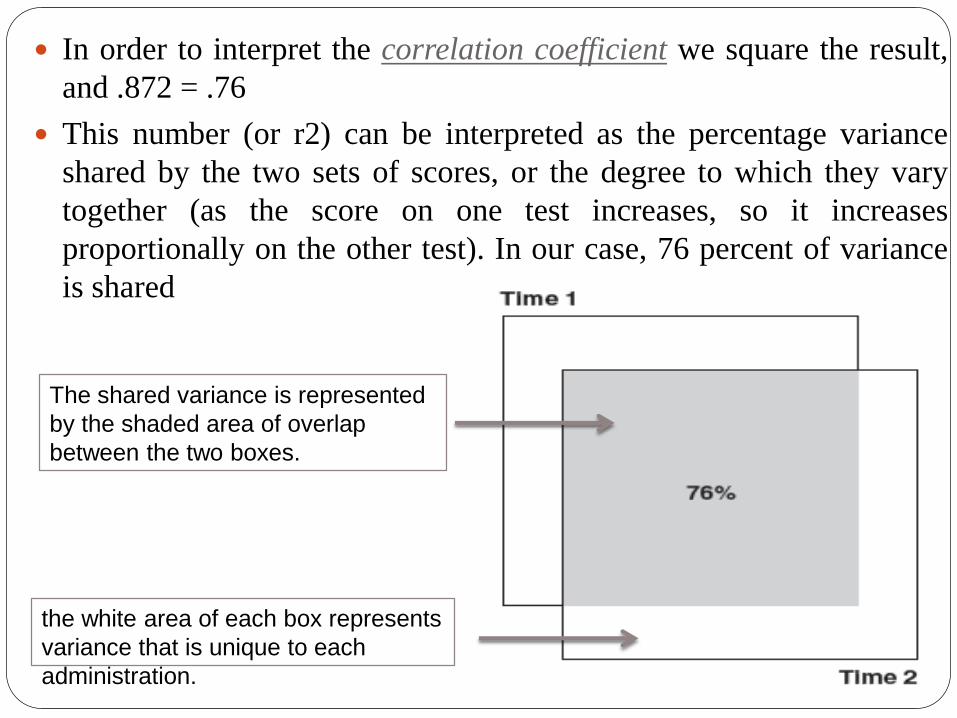
In order to interpret the correlation coefficient we square the result,
and .872 = .76
This number (or r2) can be interpreted as the percentage variance
shared by the two sets of scores, or the degree to which they vary
together (as the score on one test increases, so it increases
proportionally on the other test). In our case, 76 percent of variance
is shared
The shared variance is represented
by the shaded area of overlap
between the two boxes.
the white area of each box represents
variance that is unique to each
administration.
The test itself
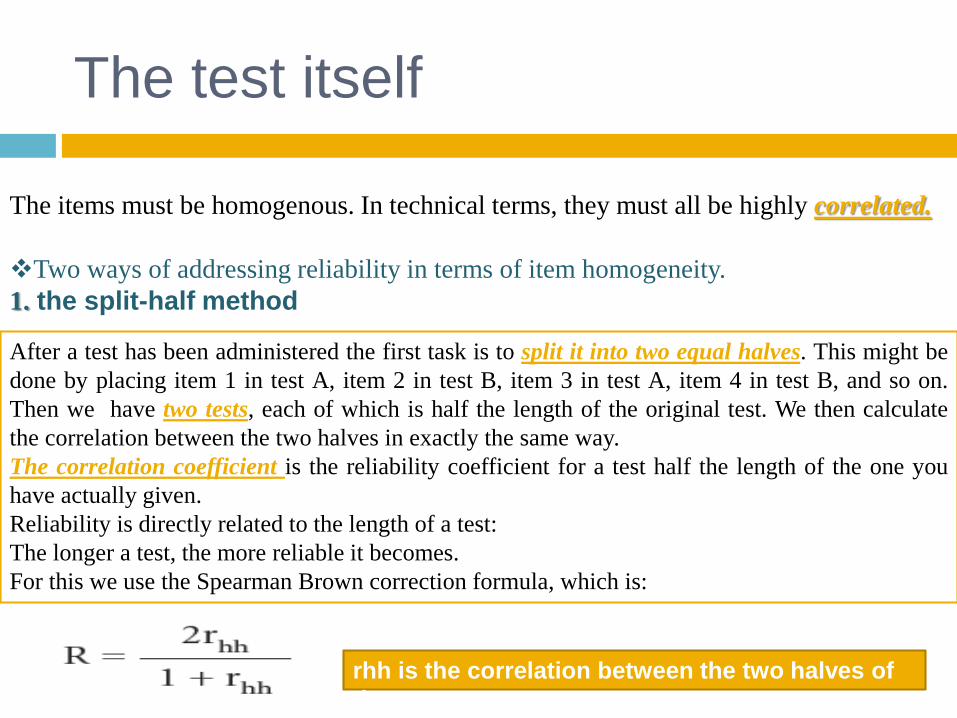
The items must be homogenous. In technical terms, they must all be highly correlated.
Two ways of addressing reliability in terms of item homogeneity.
1. the split-half method
After a test has been administered the first task is to split it into two equal halves. This might be
done by placing item 1 in test A, item 2 in test B, item 3 in test A, item 4 in test B, and so on.
Then we have two tests, each of which is half the length of the original test. We then calculate
the correlation between the two halves in exactly the same way.
The correlation coefficient is the reliability coefficient for a test half the length of the one you
have actually given.
Reliability is directly related to the length of a test:
The longer a test, the more reliable it becomes.
For this we use the Spearman Brown correction formula, which is:
rhh is the correlation between the two halves of
the test.
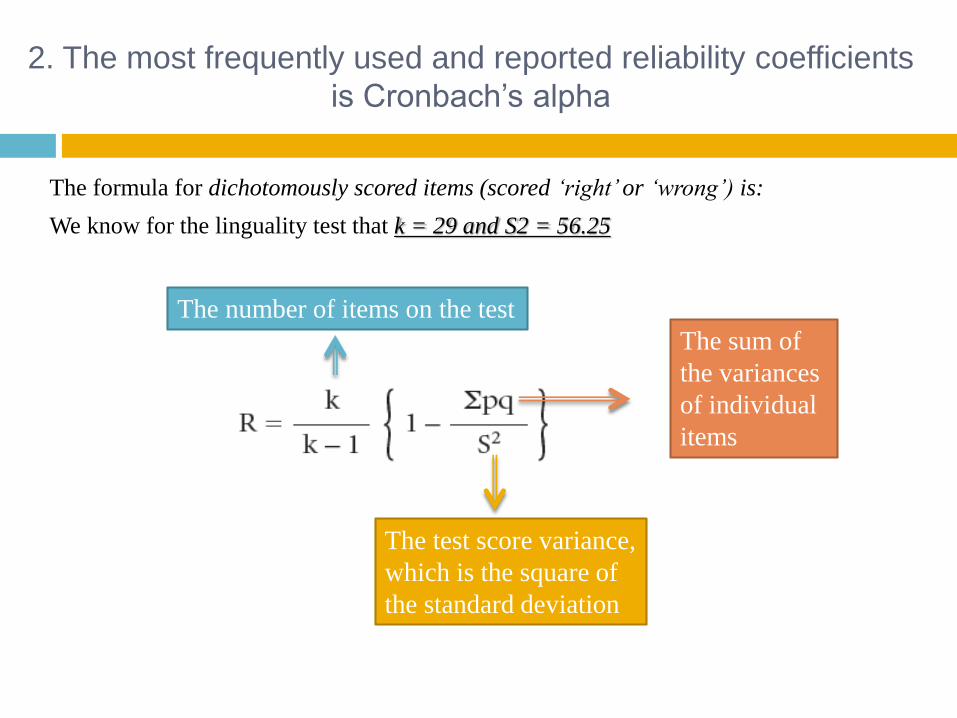
2. The most frequently used and reported reliability coefficients
is Cronbach’s alpha
The formula for dichotomously scored items (scored ‘right’or ‘wrong’) is:
We know for the linguality test that k = 29 and S2 = 56.25
The number of items on the test
The test score variance,
which is the square of
the standard deviation
The sum of
the variances
of individual
items
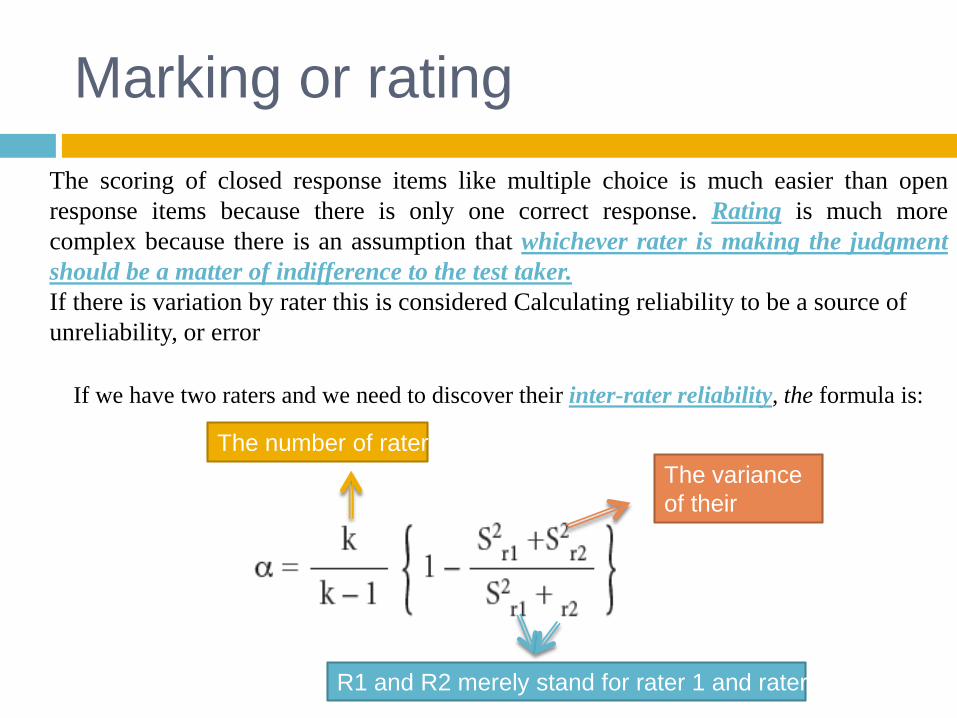
Marking or rating
If we have two raters and we need to discover their inter-rater reliability, the formula is:
The number of raters
The variance
of their
scores
R1 and R2 merely stand for rater 1 and rater 2
The scoring of closed response items like multiple choice is much easier than open
response items because there is only one correct response. Rating is much more
complex because there is an assumption that whichever rater is making the judgment
should be a matter of indifference to the test taker.
If there is variation by rater this is considered Calculating reliability to be a source of
unreliability, or error
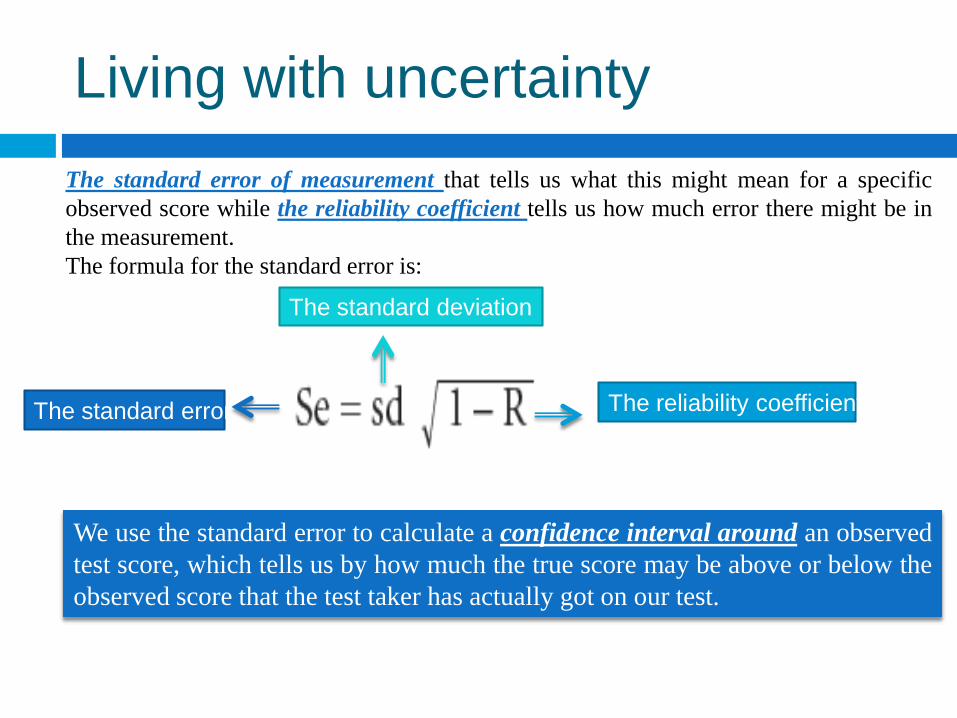
Living with uncertainty
The standard error of measurement that tells us what this might mean for a specific
observed score while the reliability coefficient tells us how much error there might be in
the measurement.
The formula for the standard error is:
The standard error The reliability coefficient
The standard deviation
We use the standard error to calculate a confidence interval around an observed
test score, which tells us by how much the true score may be above or below the
observed score that the test taker has actually got on our test.
Reliability and test length
The reliability of a test is determined mostly by the quality of the items
and by the length of the test.
In standardised tests with many items, each item provides a piece of
information about the ability of the test taker.
If you were to increase the value of k in the α formula you would see that
reliability would steadily increase.
The more independent pieces of information we collect, the more reliable
the measurement becomes. So the response to any specific item must be
independent of the response to any other item, The technical term for this
is the stochastic independence of items.
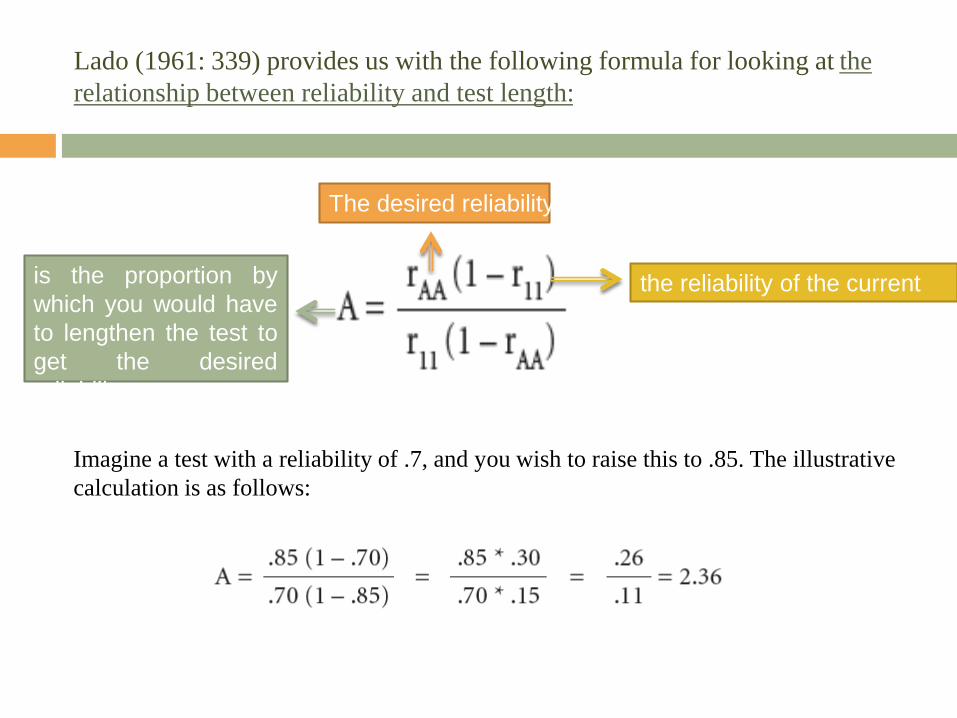
Lado (1961: 339) provides us with the following formula for looking at the
relationship between reliability and test length:
is the proportion by
which you would have
to lengthen the test to
get the desired
reliability
The desired reliability
the reliability of the current
test
Imagine a test with a reliability of .7, and you wish to raise this to .85. The illustrative
calculation is as follows:
Relationships with other
measures The comparison of two measures of the same construct was key part of
standardised testing.
It has been assumed in Galton’s time that if two different measures were
highly correlated this provided evidence of validity (Pearson, 1920).
This aspect of external validity is criterion-related evidence, or evidence that
shows the scores on two measures are highly correlated, or that one test is
highly correlated with a criterion that is already known to be a valid measure
of its construct.
It is also sometimes called evidence for convergent validity
Measurement
Up to here we talked about measurement as understood in Classical Test Theory. All
test theory assumes that scores are normally distributed. The measurement theory
described in this chapter is therefore central to understanding how all standardised
tests are built, and how they work. Content analysis also played a role. Yerkes
(1921:355), for example, comments on the content of the linguality test in this way:
A fairly accurate individual directions test was arranged, and a less accurate but
usable group test, modelled after examination beta. The group test is too difficult at
the start and is extended to an unnecessarily high level for purposes of calibration.
The individual test is preferable, not only on the score of accuracy and level, but also
because of its military nature.
Measurement
Deciding what to test is now seen as just as important as how
to test it. However, we must acknowledge that the basic
technology of language testing and assessment is drawn from
measurement theory, which in turn models itself upon the
measurement tools of the physical sciences.

Thanks for your attention