FUGRO N.V. Annual Report 2010 -...
188
Annual Report 2010 FUGRO N.V.
Transcript of FUGRO N.V. Annual Report 2010 -...

GEOTECHNIEK
MILIEU ONDERZOEK
MARINER
AN
NU
AL
RE
PO
RT
20
10
FU
GR
O N
.V
.
Annua l Re p o r t 2010F U G RO N .V.

Fugro N.V.
Veurse Achterweg 10
P.O. Box 41
2260 AA Leidschendam
The Netherlands
Telephone: +31 (0)70 3111422
Fax: +31 (0)70 3202703
E-mail: [email protected]
www.fugro.com
Trade Register number 27120091
VAT number 00 56 21 409 B01
C o l o p h o n
Fugro N.V.
Veurse Achterweg 10
2264 SG Leidschendam
The Netherlands
Telephone: +31 (0)70 3111422
Fax: +31 (0)70 3202703
Concept and realisation:
C&F Report Amsterdam B.V.
Photography and images:
Fugro N.V.
Fugro has endeavoured to fulfil all legal requirements
related to copyright. Anyone who, despite this, is of
the opinion that other copyright regulations could
be applicable should contact Fugro.
This annual report is a translation of the official
report published in the Dutch language.
This annual report is also available on www.fugro.com.
For complete information, see www.fugro.com.
Cautionary Statement regarding Forward-Looking Statements
This annual report may contain forward-looking statements. Forward-looking statements are statements that are not historical facts, including
(but not limited to) statements expressing or implying Fugro N.V.’s beliefs, expectations, intentions, forecasts, estimates or predictions (and the
assumptions underlying them). Forward-looking statements necessarily involve risks and uncertainties. The actual future results and situations
may therefore differ materially from those expressed or implied in any forward-looking statements. Such differences may be caused by various
factors (including, but not limited to, developments in the oil and gas industry and related markets, currency risks and unexpected operational
setbacks). Any forward-looking statements contained in this annual report are based on information currently available to Fugro N.V.’s manage-
ment. Fugro N.V. assumes no obligation to make a public announcement in each case where there are changes in information related to,
or if there are otherwise changes or developments in respect of, the forward-looking statements in this annual report.

C o n t e n t s
A n n u a l R e p o r t 2 0 1 0
■ Preface from the President
and Chief Executive Officer 2
■ Fugro at a glance 3
Major developments in 2010 3
Key fi gures 4
Mission and profi le 6
Fugro’s activities 7
Financial targets and strategy 8
Information for shareholders 10
■ Report of the Supervisory Board 15
■ Report of the Board of Management 21
General 21
Acquisitions 22
Employees 22
Capacity planning 23
Financial 24
Dividend proposal 29
Market developments and trends 30
Backlog 32
Post balance sheet date events 32
Outlook 33
Important and interesting contracts 36
Geotechnical division 38
Survey division 40
Geoscience division 42
■ Theme: Deepwater Challenges 45
■ Corporate Social Responsibility 58
■ Risk management 71
■ Corporate governance 77
■ Annual Accounts 2010 87
1 Consolidated statement of comprehensive income 88
2 Consolidated statement of fi nancial position 90
3 Consolidated statement of changes in equity 91
4 Consolidated statement of cash fl ows 94
5 Notes to the consolidated fi nancial statements 96
6 Subsidiaries and investments of Fugro N.V.
accounted for using the equity method 166
7 Company balance sheet 169
8 Company income statement 170
9 Notes to the company fi nancial statements 171
10 Other information 176
Report of Stichting Administratiekantoor Fugro
(‘Fugro Trust Offi ce’) 180
Historical review 182
Glossary 184

2
■ P r e f a c e f r o m t h e P r e s i d e n t
a n d C h i e f E x e c u t i v e O f f i c e r
D e a r s h a r e h o l d e r s a n d o t h e r s t a ke h o l d e r s ,
Signs of improving economic circumstances in the course
of 2010 were refl ected in the growth of our revenues in the
second part of the year. After a decline of E&P investments
of the oil and gas industry in 2009, double digit growth is
indicated for last year as well as for 2011, bringing these
investments back to pre-fi nancial crisis levels. This turn-
around bodes well for this market segment, which is
important for Fugro.
Other sectors in which we are active, like mining and
large infrastructure, also show positive signs in some
regions, like in the Far East.
Cost saving measures that were taken to respond to
rapidly changing market circumstances after the
fi nancial crisis started, have helped us to ride it out
without major impact on revenues and results.
Revenue increased by 11.1% compared to 2009, to nearly
EUR 2.3 billion and net profi t went up by 3.3% to
EUR 272.2 million.
At the same time we were able to continue our investment
plans for future growth and to acquire a number of
companies to support this. The recently announced
acquisition of TSMarine emphasises this approach.
Training of hundreds of staff continues through the
Fugro Academy, which now also entails various on-line
training modules. The set-up of the Academy has proven
to be very successful and is now attracting interest from
external parties in the industry.
Also, our efforts to create a safe and healthy working
environment for our employees is bearing fruit as safety
performance continues to improve.
Notwithstanding indications of improving economic
circumstances, one has to be aware of volatilities that may
have an impact on our business, like last year’s Macondo
oil spill in the Gulf of Mexico and, more recently, political
changes in the Middle East and North Africa, like in
Tunisia, Egypt and Libya.
Fugro’s strategy is to focus on enhancing our activities
through organic growth and acquisitions where and
when the opportunities arise, while at the same time
maintaining fl exibility to deal with possible surprises on
the road to future growth. Deepwater development is an
area in which Fugro has been successful in implementing
this strategy over many years. Our involvement in this
challenging market is outlined in a special section of this
report.
With a workforce of some 13,500 highly professional staff
and equipped with state-of-the-art technology we are in an
excellent position to grow our business in the coming
years to the benefi t of all stakeholders.
Yours faithfully,
Fugro N.V.
K.S. Wester
President and Chief Executive Offi cer

3Fugro at a glance
■ F u g r o a t a g l a n c e
■ M A J O R D E V E L O P M E N T S I N 2 0 1 0
• It is proposed to maintain the dividend for 2010
at EUR 1.50 per (certifi cate of a) share (2009: EUR
1.50), to be to be paid at the option of the holder in
cash or in (certifi cates of) shares. If no choice is
made, the dividend will be paid in (certifi cates of)
shares.
• Investments for capacity renewal and expansion
continued according to plan and amounted tot EUR
362.6 million in 2010.
• Annual revenue of the acquired companies in 2010
amounts to EUR 44 million.
• Backlog at the beginning of 2011 amounted to
EUR 1,553.2 million. This is 13.9% higher than at
the beginning of 2010 (EUR 1,364.0 million). The
order backlog of work to be carried out equals
about eight months revenue.
• Early March 2011, Fugro has acquired 100% of the
shares in TSmarine Group Holdings Pty Ltd (TSM)
and its subsidiaries. TSM, with its headquarters in
Perth, Australia and subsidiaries in Singapore,
Labuan (Malaysia) and Aberdeen (United Kingdom),
is a specialist provider of subsea construction, IRM
(inspection, repair and maintenance) and light well
intervention. TSM’s revenue amounts at present to
over EUR 90 million per annum. The purchase price
amounts to EUR 77 million.
• In 2010 Fugro’s revenue increased by 11.1% to
EUR 2,280.4 million (2009: EUR 2,053.0 million).
Revenue increased organically by 6.0% and by 0.4%
as a result of acquisitions. The foreign currency
effect was positive 4.7%.
• Net result increased by 3.3% to EUR 272.2 million
(2009: EUR 263.4 million).
• Net profi t margin decreased to 11.9% (2009: 12.8%).
• Earnings before interest, taxes, depreciation and
amortisation (EBITDA) increased by 1.8% to
EUR 561.1 million (2009: EUR 551.1 million).
• Results from operating activities (EBIT) decreased
by 4.3% to EUR 351.5 million (2009: EUR 367.4 mil-
lion).
• All three divisions showed growth in revenue and
were profi table.
• Earnings per share increased by 0.3% to
EUR 3.47 (2009: EUR 3.46). Cash fl ow per share was
4.3% higher at EUR 6.25 (2009: 5.99).
The term ‘shares’ as used in this Annual Report should, with respect to ordinary shares issued by Fugro N.V., be construed to include certificates of shares
(also referred to as ‘share certificates’ or ‘depositary receipts’ for shares) issued by Stichting Administratiekantoor Fugro (also referred to as ‘Fugro Trust
Office’ or ‘Trust Office’), unless the context otherwise requires or unless it is clear from the context that this is not the case. For further information please
refer to page 81.
In this Annual Report, Fugro N.V. is also referred to as ‘the Company’ or ‘Fugro’. Fugro N.V. and its subsidiary companies are together referred to as
‘the Group’.

4
■ K E Y F I G U R E S 2010
Change
in % 2009 2008
R e s u l t (x EUR million)
Revenue 2,280.4 11.1 2,053.0 2,154.5
Gross profi t (net revenue own services) 1,514.8 6.0 1,428.6 1,432.2
Results from operating activities (EBIT) 351.5 (4.3) 367.4 385.7
Earnings before interest, tax, depreciation and amortisation (EBITDA) 561.1 1.8 551.1 535.2
Cash fl ow 489.8 7.2 456.8 438.9
Net result 272.2 3.3 263.4 283.4
Net margin (%) 11.9 12.8 13.2
Interest cover (factor) 29.0 47.8 14.1
C a p i t a l (x EUR million)
Balance sheet total 3,090.0 30.6 2,366.3 2,123.3
Total equity 1,523.2 27.0 1,199.5 935.8
Solvency (%) 48.8 50.2 43.7
Return on shareholders’ equity (%) 20.2 24.9 35.9
Return on invested capital (%) 19.0 23.5 29.7
A s s e t s (x EUR million)
Tangible fi xed assets 1,291.3 23.8 1,043.2 859.1
Investments (including acquisitions and assets under construction) 401.9 11.8 359.6 394.4
Of which: assets of acquisitions 2.9 (70.7) 9.9 14.4
investments 443.8 320.4 323.0
assets under construction (44.8) 29.3 57.0
Depreciation of tangible fi xed assets 201.5 173.6 140.4
D a t a p e r s h a r e (x EUR 1.–) 1)
Capital and reserves 18.79 24.6 15.08 12.12
Result from operating activities (EBIT) 4.49 (6.8) 4.82 5.29
Cash fl ow 6.25 4.3 5.99 6.01
Net result 3.47 0.3 3.46 3.88
Dividend for the year under review 1.50 1.50 1.50
Share price: year-end 61.50 40.26 20.485
Share price: highest 62.06 41.85 59.95
Share price: lowest 37.095 19.085 19.32
Average price/earnings ratio 14.3 8.8 10.2
Average dividend yield (%) 2) 3.0 4.9 3.8
I s s u e o f n o m i n a l s h a r e s (in thousands)
At year-end 80,270 78,772 76,608
Entitled to dividend at year-end 79,387 77,554 75,138
Entitled to dividend average for the year 78,357 76,210 73,048
N u m b e r o f e m p l oy e e s
At year-end 13,463 (0.1) 13,482 13,627

5Fugro at a glance
0
500
1,000
1,500
2,000
2,500
20102009200820072006
R e ve n u e
(x EUR 1 mln.)
0
350
700
1,050
1,400
1,750
20102009200820072006
Gross p ro f i t (net revenue
own ser v ices ) (x EUR 1 mln.)
0
120
240
360
480
600
20102009200820072006
C a s h f l ow
(x EUR 1 mln.)
0
60
120
180
240
300
20102009200820072006
N e t r e s u l t
(x EUR 1 mln.)
0
0.9
1.8
2.7
3.6
4.5
20102009200820072006
N e t r e s u l t p e r s h a r e
(x EUR 1.–)
0
120
240
360
480
600
20102009200820072006
Earnings before interest, taxes,
depreciation and amor tisation
(EBITDA) (x EUR 1 mln.)
2007 2006
1,802.7 1,434.3
1,197.9 931.2
324.8 211.6
439.6 295.9
337.1 226.1
216.2 141.0
12.0 9.8
13.1 10.9
1,700.1 1,405.7
707.0 565.8
41.2 40.0
35.4 28.6
30.0 23.7
599.3 412.2
341.1 245.9
8.7 21.0
291.0 182.9
41.4 42.0
107.7 78.2
9.94 8.08
4.67 3.08
4.84 3.29
3.11 2.05
1.25 0.83
52.80 36.20
62.00 36.64
34.91 27.13
15.6 15.5
2.6 2.6
70,421 69,582
69,879 68,839
69,614 68,761
11,472 9,837
1) More data regarding the basic earnings per share can be found in note 5.45 to the annual accounts (page 140).
2) Dividend for the year, to be paid the following year, divided by the average of the highest and lowest share price
during the year.
6
■ M I S S I O N A N D P RO F I L E
M i s s i o n
Fugro’s mission is to be the world’s leading service
provider for the collection and interpretation of data
relating to the earth’s surface and sub-surface and for
associated services and advice in support of infrastructure
development on land, along the coast and on the seabed.
Fugro’s activities are carried out across the world,
onshore, offshore and from the air, and are primarily
aimed at the:
• oil and gas industry
• construction industry
• mining sector
• governments
Fugro achieves this mission through:
• customer focus
• the provision of high-quality, innovative services
• professional, specialised employees
• advanced, unique technologies and systems
• a worldwide presence in which the exchange of
knowledge and expertise, both internally and
externally with the client, plays a central role
P r o f i l e
Fugro provides the people, equipment, expertise and
technology that support the exploration, development,
production and transportation of the world’s natural
resources. Fugro also provides its clients with the
technical data and information required to design,
construct and maintain structures and infrastructure
in a safe, reliable and effi cient manner.
Services that are provided locally, are supported by a
global knowledge base and resource pool of experienced
personnel. The services are often offered in combination
in order to achieve the optimum results for the clients.
Fugro operates as an independent service provider and
has no commercial or other direct interests in the projects
of its clients. As Fugro is often involved in the early
exploration and development phase of (potential)
projects, confi dentiality about Fugro’s engagements is
essential in many cases.
Fugro’s clients operate in many locations and under
different conditions. To be able to meet their needs in the
best possible way, Fugro’s organisational structure is
decentralised and client-oriented, delivering a wide range
13,500 employees
60 aircraft
29 jack-up platforms
278 offices
55 vessels
250 land-based drillrigs
15 offshore drillrigs
75 CPT trucks
135 ROVs
27 laboratories
8 AUVs

7Fugro at a glance
of services in a variety of operating environments and
conditions. Fugro delivers these services from a global
network of offi ces and facilities.
Fugro strives to achieve strong market positions based on
(in-house developed) technologies, high-value services and
a strong international or regional presence.
Fugro was founded in the Netherlands in 1962 and is
listed on the Amsterdam stock exchange of NYSE Euronext
since 1992. Fugro was included in the AEX-index as of
September 2008.
Fugro grows organically and through acquisitions, and by
the end of 2010 employed some 13,500 staff in more than
50 countries.
■ F U G RO ’ S A C T I V I T I E S
Fugro provides a unique range of services and activities
worldwide. These are organised in three divisions:
Geotechnical, Survey and Geoscience.
G e o t e c h n i c a l
The Geotechnical division investigates the engineering
properties and geological characteristics of near-surface
soils and rocks using (in-house developed) proprietary
technologies, advises on foundation design and provides
construction materials testing, pavement assessment and
construction support services. These services support
clients’ projects worldwide in the onshore, near shore and
offshore environments, including deep water. Typical
projects include support of infrastructure development
and maintenance, large construction projects, fl ood
protection and support of the design and installation of
oil and gas facilities.
S u r vey
The Survey division provides a range of services to support
the activities of the oil and gas industry and a broad range
of commercial and civil industries as well as governments
and other organisations. Offshore services include
geophysical investigation for geohazards, pipeline and
cable route surveys, inspection and construction support
services, hydrographic charting and meteorology and
oceanographic studies. Subsea services revolve around the
use of remotely operated vehicles (ROVs) to support subsea
inspection, construction and drilling while geospatial
services are focused on land survey and aerial/satellite
mapping services for a wide range of clients. In addition,
Fugro’s global positioning systems (which augment GPS
and Glonass signals to provide precise positioning in real-
time world-wide) are employed not only to support the
above services, but are also provided on a subscription
basis to other industries such as agriculture.
G e o s c i e n c e
The Geoscience division provides services and products
associated with collecting, processing, interpreting,
managing and storing geophysical and geological data.
These data sets are used for evaluating the presence of
natural resources, including oil, gas, water and minerals,
and for optimising the exploration, appraisal,
development and production of those resources. A broad
range of geophysical data sets are collected including
marine seismic, gravity, magnetics and electromagnetics.
The data sets are collected at sea, from the air and on land
using vessels, low fl ying airplanes and helicopters. Clients
are oil and gas companies, mining companies and
governmental organisations.

8
■ F I N A N C I A L TA R G E T S A N D S T R AT E G Y
F i n a n c i a l t a r ge t s
Fugro’s target is to achieve, under comparable economic
circumstances, a structural increase in earnings per share
for its shareholders. Fugro’s long-term policy is aimed at
generating a steady growth in net result based on
increasing revenue.
Important fi nancial targets are:
• growth in earnings per share averaging 10% per
annum
• strong cash fl ow with an average annual growth per
share of 10%
• maintaining a healthy balance sheet and solvency
(30 – 35%)
• interest cover (EBIT/Interest) of more than 5
Fugro’s fi nancial strategy is aimed at the utilisation and/
or optimisation of:
• the ratio between risk and return of the various
business activities
• the ratio between shareholders’ equity and short-term/
long-term borrowings
• the use of both public and private capital markets
• the duration and phasing of the different fi nancing
components
S t r a t e g y
Fugro aims at achieving equilibrium between its various
activities in order to be able to meet its targets. Fugro
strives for a balance between services related to
exploration, development and production activities
for the oil and gas industry, and those related to other
markets, such as mining and construction. This also
results in a combination of offshore and onshore
activities. Moreover, Fugro strives for a good geographical
spread. The diverse range of related activities reduces
Fugro’s sensitivity to market fl uctuations in a particular
sector. As an independent service provider, Fugro provides
a broad spread of services to its clients. This also
contributes to a good control of business risks.
Fugro strives for growth, both organically and through
acquisitions. To achieve organic growth Fugro invests in
equipment and human capital. Organic growth is also
achieved by actively developing new technologies and
services.
In the most important market sector – oil and gas –
the spread of Fugro’s services across the exploration,
development and production phases is a key factor.
This means Fugro provides services in many phases of the
(20 – 30 year) life-cycle of an oil or gas fi eld. Avoiding
dependence on one phase of this market or single group
of clients is an essential component of Fugro’s strategy.
The result is a business that is less cyclical.
Profi t margins vary per service and activity depending on
the specifi c market circumstances. For the more risky or
capital intensive activities a higher profi t margin is aimed
for than the overall company average.
The long-term aim is to achieve robust but controlled
profi t growth through:
• a broad but cohesive services portfolio
• the manner in which Fugro is fi nanced
• the market-oriented international organisational
structure
• continuous development and training of employees
• specifi c investments in equipment and technology
• management focus on increasing net result
Fugro strives to improve profi tability with a focus on core
activities and niche markets by:
• increasing operational scale
• building strong market positions
• continuing research and development
• cooperation and development for and with clients
• being selective about the projects that are taken on
• acquiring companies with a high added-value
Over the period 2005 – 2008 revenues doubled and the net
profi t margin increased from 8.6% to 13.2%. As from late
2008 the market situation has been negatively infl uenced
by the global economic downturn, resulting in a slight
reduction in both revenue and net profi t in 2009. In the
course of second half of 2010 revenue growth was
resumed, but price pressure still remained in some
segments, resulting in a moderate profi t increase
compared to the previous year. For 2011 a further prudent
improvement of market conditions is expected on the
basis of increasing investments of the oil and gas industry
and a further global economic recovery.

9Fugro at a glance
Cone Penetration Test with a mini-crawler, Weesp,
The Netherlands.
Market positions
Fugro’s strategy is based primarily on securing and, where
possible, expanding strong market positions.
Complementing and broadening its package of closely
related services is a primary objective. Growth in adjacent
sectors, by responding actively and fl exibly to market
developments and client needs, is also an important
component of the strategy.
On land, Fugro’s major clients are governments, industry
and construction companies in local and regional
markets. In these markets Fugro holds strong regional
positions.
At sea, the major clients are oil and gas companies, and
offshore contractors that operate in a global market.
Fugro has a leading position in offshore survey and
offshore geotechnical activities. In other market
segments, like mining and precise positioning, Fugro
holds leading market positions in niche markets with
a large variety of clients.
Acquisitions
To broaden its base and ensure continued sustainable
growth, Fugro usually completes a number of acquisitions
each year. Generally these serve to strengthen or achieve
good market positions or to obtain special technologies.
Because acquisitions always involve an element of risk, a
thorough and extensive due diligence is carried out before
the decision to acquire a company is taken. This limits the
risks considerably. Acquisition evaluation is based not
only on fi nancial criteria but also on:
• added-value for Fugro
• cohesion with Fugro’s activities and services
• match with Fugro’s culture
• growth potential
• a good position in a niche market or region
• technical and management qualities
• risk profi le
Research and development
Research and its application thereof is of strategic
importance to Fugro. The search for ways to expand and
improve services to clients is unceasing and cooperation
with clients plays a major role in this. Many new ideas are
generated through joint development projects and often
developments take place in close cooperation with a
client because the client is interested in solving a specifi c
problem. Research relating to special measuring
equipment and analytical methods also plays an
important role in Fugro’s services provision. Its global
market position is, to a great extent, dependent on high-
value equipment, technologies and software.
Measurements are becoming more and more detailed and
even the most complex data can be interpreted. To this
end, increasingly knowledge is exchanged or combined
within the company in order to arrive at solutions or new
developments. Part of this research and development
expense is incurred as part of the execution of projects.
Cooperation and scale advantages
Effective cooperation between Fugro’s business units is
promoted at various levels. Critical mass is also a key
factor for the successful execution of large assignments.
Capacity utilisation and cooperation are optimised
through the exchange of equipment, employees and
expertise between the various activities and by extensive
employee training. Fugro promotes technological renewal
by clustering the knowledge available within and outside
the Group. The integration of information systems and
the utilisation of scale advantages enhance the service
provided to clients.

10
■ I N F O R M AT I O N F O R S H A R E H O L D E R S
L i s t i n g o n t h e s t o c k e x c h a n ge
Fugro is listed on the Amsterdam stock exchange of NYSE
Euronext (Euronext Amsterdam) since 1992. The share is
included in the AEX-index as of September 2008 (symbol:
FUR/ISIN code: NL0000352565). Trading in options on
Fugro shares is also possible via Euronext Amsterdam.
As at 28 february 2011 Fugro’s market capitalisation
amounted to EUR 4.9 billion – an increase of 44%
compared with the end of February 2010 (EUR 3.4 billion).
As far as is known, approximately 70% of the (certifi cates
of) shares are held by foreign investors, mainly from the
United Kingdom and the United States. Information on
the shares can be found on pages 4 and 5 (key fi gures) and
on pages 79, 140 and 141.
D i v i d e n d p o l i c y
Fugro strives for a pay-out ratio of 35 to 55% of the net
result. The shareholder (or certifi cate holder) may choose
between a dividend entirely in cash or entirely in
(certifi cates of) shares charged to the reserves. In 2010
about 52% of the holders of (certifi cates of) shares chose
to receive the dividend for 2009 in (certifi cate of) shares
(2009: 54%). In 2010, 1,497,206 new shares were issued
for this purpose.
D i v i d e n d fo r 2 0 1 0
It is proposed that the dividend for 2010 be maintained at
EUR 1.50 per share (2009: EUR 1.50), to be paid at the
option of the holder:
• in cash, or
• in (certifi cates of) shares.
F i n a n c i a l a ge n d a
10 March 2011 Publication of 2010 annual fi gures (before trading hours), press conference and
analysts’ meeting with webcast
29 March 2011 Notice for Annual General Meeting of Shareholders
12 April 2011 Record date for registration to attend the Annual General Meeting of Shareholders
10 May 2011 Trading update business developments fi rst quarter 2011 (before trading hours)
10 May 2011 Annual General Meeting of Shareholders in The Hague at 14.00 hours, Crowne Plaza
– Promenade Hotel, dual language webcast (Dutch and English)
12 May 2011 Quotation ex-dividend
16 May 2011 Record date dividend entitlement (after trading hours)
17 – 27 May 2011 Dividend option period (cash or (certifi cates of) shares)
1 June 2011 Determination and publication (after trading hours) of the amount of the dividend in
(certifi cates of) shares based upon the volume weighted average price of the traded
shares Fugro at Euronext Amsterdam on 30 and 31 May and 1 June 2011
6 June 2011 Payment of the dividend related to the fi nancial year 2010
12 August 2011 Publication of half-yearly fi gures 2011 and announcement of the profi t forecast for 2011
(before trading hours), press conference and analysts’ meeting with webcast
17 November 2011 Trading update business developments third quarter 2011 (after trading hours)
9 March 2012 Publication of 2011 annual fi gures (before trading hours), press conference and
analysts’ meeting with webcast
D a t a p e r s h a r e
(x EUR 1.–) 2010 2009 2008 2007 2006
Cash fl ow 6.25 5.99 6.01 4.84 3.29
Net result 3.47 3.46 3.88 3.11 2.05
Dividend paid out in the year under review 1.50 1.50 1.25 0.83 0.60
Proposed dividend over the year under review 1.50 1.50 1.50 1.25 0.83

11Fugro at a glance
In case no choice is made, the dividend will be paid in
(certifi cates of) shares. The proposed dividend equates to a
pay-out percentage of 43.7% of the net result.
Holders of (certifi cates of) shares have until Friday 27 May
2011 to make their dividend preference known.
The determination of the number of (certifi cates of)
shares that entitles the holder to one new (certifi cate of a)
share will take place on Wednesday 1 June 2011 (after
trading hours) based upon the volume weighted average
price of the traded shares Fugro at Euronext Amsterdam
on 30 and 31 May and 1 June 2011. To arrive at a whole
number a deviation of a maximum of 5% of the calculated
value may be applied. The dividend will be made payable
on 6 June 2011. No trading will take place on Euronext
Amsterdam in dividend rights.
The percentage of (certifi cates of) shares that was
represented in person or by proxy in the shareholders’
meetings over the past three years was as follows:
A ge n d a o f t h e ge n e r a l m e e t i n g
a n d r e c o r d d a t e
The agenda, including explanatory notes, of the general
meeting is posted on Fugro’s website (www.fugro.com) at
least 42 days prior to the meeting. The agenda shows
which items are for discussion and which items are to be
voted upon. The record date for registration to attend the
general meeting is 28 days before the day of the meeting.
R e m o t e e l e c t r o n i c v o t i n g
Depending on experience with the use of electronic
means of communication to follow the course of a general
meeting and to cast votes during the meeting without
being present in person or by proxy, Fugro will evaluate
whether to facilitate this. Fugro offers the possibility to
grant proxies, whether or not with voting instructions,
by electronic means of communication. Fugro also offers
certifi cate holders the possibility to issue voting
instructions to an independent third party by using
an internet e-voting system: https://evoting.rbs.com/
evoting/go.
S h a r e / c e r t i f i c a t e h o l d i n g s o f 5 % o r m o r e
Under the Dutch Financial Market Supervision Act,
shareholdings of 5% or more in any Dutch listed company
must be disclosed to the Netherlands Authority for the
Financial Markets (AFM). According to the register of the
AFM the following holders of (certifi cates of) shares have
disclosed an interest of more than 5% in Fugro’s share
capital on 1 March 2011:
ING Groep N.V. 9.64%
Ameriprise Financial Inc. 5.86%
Mr. G-J. Kramer 1) 5.58%
WAM Acquisitions GP, Inc. 5.26%
1) Directly and indirectly.
As stated on page 81, only certifi cates of shares are listed
on Euronext Amsterdam. These certifi cates are issued by
the Trust Offi ce, which carries out the administration
of the underlying shares (for which it has issued the
certifi cates). On 1 March 2011 the Trust Offi ce held 90.9%
of the issued (underlying) shares.
C h a n ge i n i s s u e d
s h a r e s 2010 2009
Issued on 1/1 78,772,478 76,607,958
Stock dividend 1,497,206 2,164,520
Issued on 31/12 80,269,684 78,772,478
Balance purchased for
option scheme (31/12) 882,796 1,218,776
Entitled to dividend
as of 31/12 79,386,898 77,553,702
Average number of
outstanding shares entitled
to dividend 78,357,020 76,210,346
Certifi -
cates and
shares
(ex Trust
Offi ce)
Shares
held by
Trust
Offi ce*
% of the
issued
capital
AGM 2010 35.7 63.5 99.2
EGM 2009 36.3 62.8 99.1
AGM 2009 35.2 64.0 99.2
AGM 2008 34.3 64.9 99.2
* Stichting Administratiekantoor Fugro (‘Fugro Trust Office
Foundation’ or ‘Trust Office’) votes on the shares for which
certificates have been issued and on which shares the
certificate holders do not vote themselves as representative
of the Trust Office.

12
Options are granted in such way that at any moment the
maximum number of outstanding options to acquire
ordinary shares in Fugro will not exceed 7.5% of the issued
ordinary share capital. In order to mitigate dilution, it is
Fugro’s policy to purchase own certifi cates of shares to
satisfy the options granted with the result that no new
(certifi cates of) shares are issued when options are
exercised.
In 2010 Fugro purchased 800,000 certifi cates of shares at
an average price of EUR 44.70 per certifi cate. On 31
December 2010 a total of 882,796 own certifi cates
of shares was held. These certifi cates are not entitled to
dividend and there are no voting rights attached to the
underlying shares. The exercise of all outstanding options
as of 31 December 2010, including the options granted on
this date, could – after having used the purchased
certifi cates of shares – lead to an increase of the issued
share capital by a maximum of 6.7%. Since the beginning
of 2011, 106,700 options were exercised.
I n ve s t o r r e l a t i o n s
Fugro offers comprehensive information regarding the
company on its website. Meetings with analysts,
presentations to analysts, presentations to (institutional)
investors and press conferences are announced in advance
on the website or by means of press releases. Shareholders
and certifi cate holders are able to follow most of these
meetings and presentations in real time, for example by
means of webcasting or telephone. After the meetings, the
presentations are posted on the website. The
presentations are given particularly during the periods
March/April and August/September. During these
presentations Fugro’s strategy and activities are further
explained in detail by members of the Board of
Management. Roadshows are held in amongst others the
United States, United Kingdom, The Netherlands and
Germany. Individual and collective personal contact with
investors and analysts is also maintained annually via
around three hundred ‘one-on-one’-meetings,
presentations and telephone conferences.
Fugro has formulated a policy on bilateral contacts with
shareholders and certifi cate holders. This policy is posted
on the website.
Pa r t i c i p a t i o n s a n d e m p l oy e e o p t i o n s
As far as is known, on 31 December 2010 around one
percent of Fugro’s share capital was held by members of
the Board of Management and other employees within
the Group. Of the total number of employee options
granted during the past years, 5,172,750 options
(excluding the option grants as per 31 December 2010)
were still outstanding on 31 December 2010.
A total number of 1,107,350 new options, with an exercise
price of EUR 61.50, were granted to a total of 663
employees on 31 December 2010. Of these options, 26.3%
was granted to the fi ve members of the Board of
Management (see also page 162).
Options on Fugro shares are granted to a broad group of
employees. The granting of options is dependent on the
achievement of the targets of the Group as a whole and
of the individual operating companies as well as on the
contribution of the relevant employee to the long term
development of the company. Option grants to members
of the Board of Management are based upon the
remuneration policy and the option scheme that were
adopted and approved respectively by the Annual General
Meeting on 14 May 2008.
Options are granted annually on 31 December and
the option exercise price is equal to the price of the
certifi cates of shares at the closing of Euronext
Amsterdam on the last trading day of the year. The vesting
period for the granted options is three years starting at
the fi rst of January of the year following the grant date.
The option period is six years. The options granted are
unconditional and are not subject to any further
conditions of exercise, except that the option holder is
still employed by Fugro or one of its operating companies.
Standard exceptions apply to the latter rule in connection
with retirement, long-term disability and death.
M o ve m e n t i n n u m b e r o f s h a r e s p u r c h a s e d
t o c o ve r t h e o p t i o n s c h e m e
2010 2009
Situation on 1/1 1,218,776 1,469,696
Purchased 800,000 550,000
Sold in connection with
option exercise (1,135,980) (800,920)
Situation on 31/12 882,796 1,218,776
Granted, not exercised
options as of 31/12 6,280,100 6,334,430

13Fugro at a glance
Fugro jack-up with crew change boat near the EDF Power
station, Dieppe-Penly in France.
0
15
30
45
60
75
0
6,000
12,000
18,000
24,000
30,000
201020092008200720062005
P r e ve n t i o n o f t h e m i s u s e o f i n s i d e
i n fo r m a t i o n
Fugro considers prevention of the misuse of inside
information when trading in securities to be essential for
its relationship with the outside world. Fugro has issued
internal guidelines on the holding of and effecting
transactions in Fugro securities (certifi cates, shares,
options) which apply to the members of the Supervisory
Board, the Board of Management, the other members of
the Executive Committee and other designated persons
(among which staff, management of operating companies
and a number of external advisors). A record is kept of all
so-called ‘insiders’. Fugro has appointed a Compliance
Offi cer. Dealings in securities by the members of the
Supervisory Board, the Board of Management and the
other members of the Executive Committee are notifi ed
to the Netherlands Authority for the Financial Markets
(AFM). The public database of the AFM can be consulted
on the website of the AFM: www.afm.nl.
O t h e r i n fo r m a t i o n
Further information about Fugro which is relevant to the
shareholders and certifi cate holders is available on the
website. Fugro can be contacted by telephone (+31(0)70 –
311 14 22) or by e-mail ([email protected]).
D i s t r i b u t i o n o f s h a r e h o l d e r s
(x 1,000 shares)
Closing price (scale left).
Share trade volume per month (x 1,000), (scale right).
Source: Euronext
C e r t i f i c a t e p r i c e a n d v o l u m e t r e n d
(January 2005 – December 2010)
0
16,500
33,000
49,500
66,000
82,500
End 2010End 2009 End 2008End 2007End 2006End 2005
United Kingdom
United States
Luxembourg
Germany
Switzerland
Belgium
France
Other
The Netherlands
14
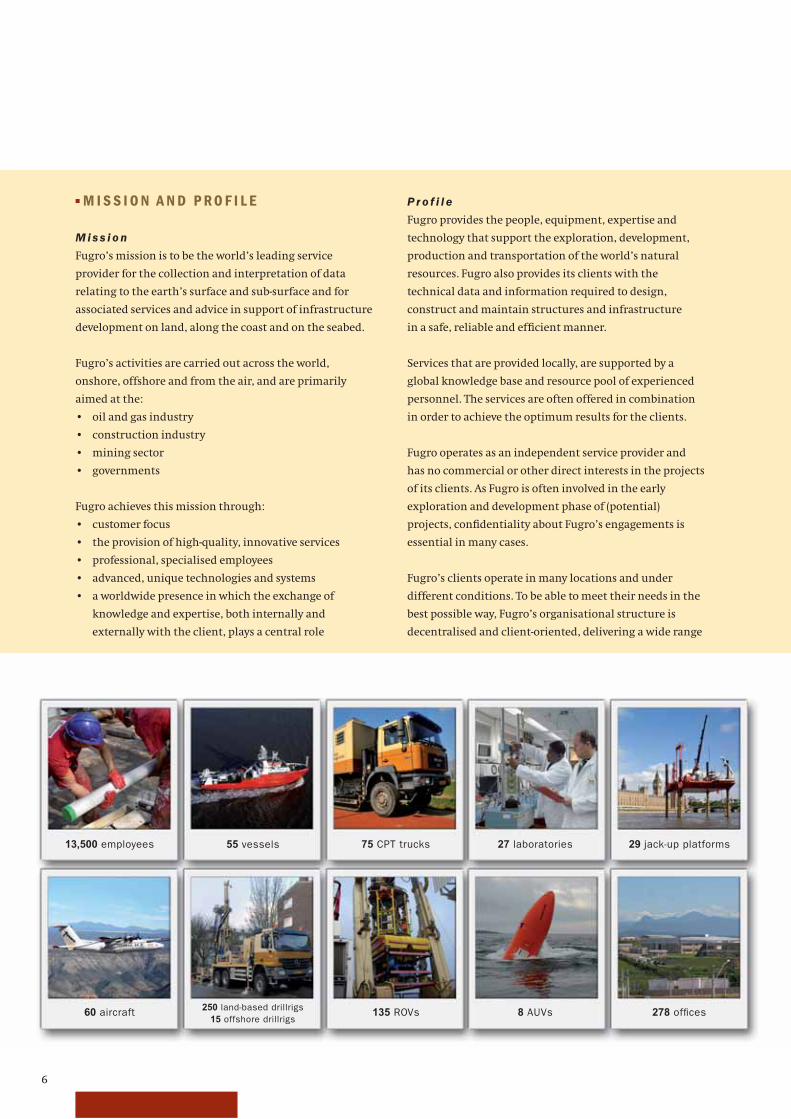
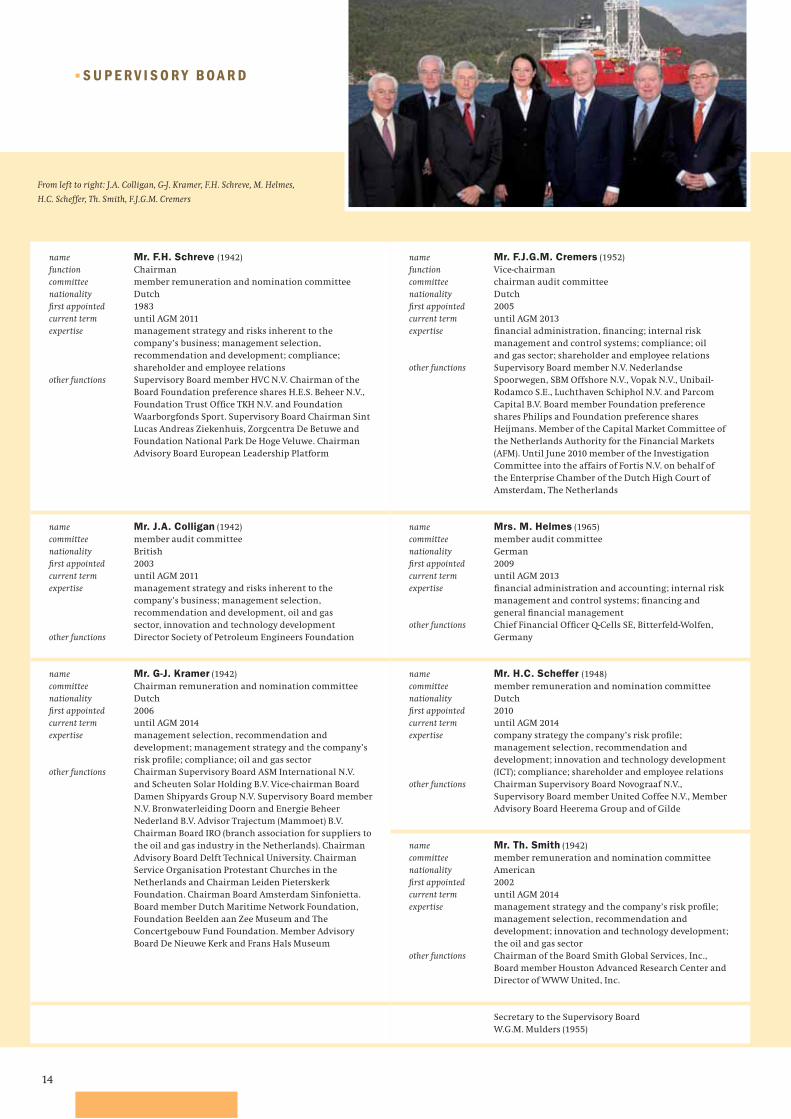
From left to right: J.A. Colligan, G-J. Kramer, F.H. Schreve, M. Helmes,
H.C. Scheffer, Th. Smith, F.J.G.M. Cremers
name Mr. F.H. Schreve (1942)
function Chairman
committee member remuneration and nomination committee
nationality Dutch
fi rst appointed 1983
current term until AGM 2011
expertise management strategy and risks inherent to the
company’s business; management selection,
recommendation and development; compliance;
shareholder and employee relations
other functions Supervisory Board member HVC N.V. Chairman of the
Board Foundation preference shares H.E.S. Beheer N.V.,
Foundation Trust Offi ce TKH N.V. and Foundation
Waarborgfonds Sport. Supervisory Board Chairman Sint
Lucas Andreas Ziekenhuis, Zorgcentra De Betuwe and
Foundation National Park De Hoge Veluwe. Chairman
Advisory Board European Leadership Platform
name Mr. J.A. Colligan (1942)
committee member audit committee
nationality British
fi rst appointed 2003
current term until AGM 2011
expertise management strategy and risks inherent to the
company’s business; management selection,
recommendation and development, oil and gas
sector, innovation and technology development
other functions Director Society of Petroleum Engineers Foundation
name Mr. G-J. Kramer (1942)
committee Chairman remuneration and nomination committee
nationality Dutch
fi rst appointed 2006
current term until AGM 2014
expertise management selection, recommendation and
development; management strategy and the company’s
risk profi le; compliance; oil and gas sector
other functions Chairman Supervisory Board ASM International N.V.
and Scheuten Solar Holding B.V. Vice-chairman Board
Damen Shipyards Group N.V. Supervisory Board member
N.V. Bronwaterleiding Doorn and Energie Beheer
Nederland B.V. Advisor Trajectum (Mammoet) B.V.
Chairman Board IRO (branch association for suppliers to
the oil and gas industry in the Netherlands). Chairman
Advisory Board Delft Technical University. Chairman
Service Organisation Protestant Churches in the
Netherlands and Chairman Leiden Pieterskerk
Foundation. Chairman Board Amsterdam Sinfonietta.
Board member Dutch Maritime Network Foundation,
Foundation Beelden aan Zee Museum and The
Concertgebouw Fund Foundation. Member Advisory
Board De Nieuwe Kerk and Frans Hals Museum
name Mr. F.J.G.M. Cremers (1952)
function Vice-chairman
committee chairman audit committee
nationality Dutch
fi rst appointed 2005
current term until AGM 2013
expertise fi nancial administration, fi nancing; internal risk
management and control systems; compliance; oil
and gas sector; shareholder and employee relations
other functions Supervisory Board member N.V. Nederlandse
Spoorwegen, SBM Offshore N.V., Vopak N.V., Unibail-
Rodamco S.E., Luchthaven Schiphol N.V. and Parcom
Capital B.V. Board member Foundation preference
shares Philips and Foundation preference shares
Heijmans. Member of the Capital Market Committee of
the Netherlands Authority for the Financial Markets
(AFM). Until June 2010 member of the Investigation
Committee into the affairs of Fortis N.V. on behalf of
the Enterprise Chamber of the Dutch High Court of
Amsterdam, The Netherlands
name Mrs. M. Helmes (1965)
committee member audit committee
nationality German
fi rst appointed 2009
current term until AGM 2013
expertise fi nancial administration and accounting; internal risk
management and control systems; fi nancing and
general fi nancial management
other functions Chief Financial Offi cer Q-Cells SE, Bitterfeld-Wolfen,
Germany
name Mr. H.C. Scheffer (1948)
committee member remuneration and nomination committee
nationality Dutch
fi rst appointed 2010
current term until AGM 2014
expertise company strategy the company’s risk profi le;
management selection, recommendation and
development; innovation and technology development
(ICT); compliance; shareholder and employee relations
other functions Chairman Supervisory Board Novograaf N.V.,
Supervisory Board member United Coffee N.V., Member
Advisory Board Heerema Group and of Gilde
name Mr. Th. Smith (1942)
committee member remuneration and nomination committee
nationality American
fi rst appointed 2002
current term until AGM 2014
expertise management strategy and the company’s risk profi le;
management selection, recommendation and
development; innovation and technology development;
the oil and gas sector
other functions Chairman of the Board Smith Global Services, Inc.,
Board member Houston Advanced Research Center and
Director of WWW United, Inc.
Secretary to the Supervisory Board
W.G.M. Mulders (1955)
■ S U P E R V I S O R Y BO A R D
15Report of the Supervisory Board
Although the rate of recovery of the global economy was
generally slow, 2010 was a solid year for Fugro. It was not
only dominated by the worldwide economic recession but
also by the Macondo oil spill in the Gulf of Mexico. Also in
2010, the Board of Management took measures necessary
to manage the effects of the recession and utilised
opportunities which came along.
Fugro’s solid structure made it possible to continue with
the investments necessary to support continued growth
for future years.
A n n u a l a c c o u n t s a n d d i v i d e n d p r o p o s a l
This Annual Report includes the 2010 Annual Accounts,
which are accompanied by an unqualifi ed independent
auditor’s report of the external auditor, KPMG
Accountants N.V. (KPMG). These Annual Accounts were
prepared in accordance with International Financial
Reporting Standards (IFRS) as adopted by the European
Union and section 9 of Book 2 of the Dutch Civil Code.
We have discussed the Annual Accounts with the Board of
Management in the presence of KPMG. We are of the
opinion that the Annual Accounts and the report by the
Board of Management provide a true and fair view of the
state of affairs within Fugro and form a good basis on
which to hold the Board of Management accountable for
the management policies pursued and the Supervisory
Board accountable for its supervision of the management
policies pursued.
We propose that the shareholders adopt the 2010 Annual
Accounts and discharge the Board of Management for its
management and the Supervisory Board for its
supervision. We endorse the proposal of the Board of
Management to maintain the dividend for 2010 at EUR
1.50 per share, to be paid at the option of the holder in
cash or in (certifi cates of) shares. The amount of the
dividend in (certifi cates of) shares will be determined and
published on Wednesday 1 June 2011 after trading hours.
If no choice is made, the dividend will be paid in
(certifi cates of) shares. The proposed dividend equates to a
pay-out percentage of 43.7% of the net result.
C o m p o s i t i o n a n d p r o f i l e
o f t h e S u p e r v i s o r y B o a r d
The Supervisory Board comprises of persons with Dutch,
British, American and German nationality. Information
about each member of the Supervisory Board is included
on page 14 of this Annual Report. The Supervisory Board
has prepared a profi le of its size and composition, taking
account of the nature of the company, its activities and
the desired experience and background of the
Supervisory Board members. This profi le is available on
Fugro’s website: www.fugro.com. The composition and
qualities of the Supervisory Board as a whole should be
in line with Fugro’s size, activities, nature, culture,
geographical spread and its status as a listed company.
When a proposal is made for the (re)appointment of
a (new) supervisory director, the Supervisory Board
primarily looks at the expertise, experience and
independence of the candidate. The Supervisory Board
aims for a diverse composition in terms of such factors
as gender and nationality.
The division of duties within the Supervisory Board and
the procedure of the Supervisory Board are laid down in
terms of reference. The terms of reference of the Super-
visory Board (including the terms of reference of the
Audit Committee and the Remuneration and Nomination
Committee) are available on Fugro’s website.
All Supervisory Board members are independent under
the terms of the Dutch Corporate Governance Code
(‘Code’).
Supervisory Board members do not carry out any other
functions that could jeopardise their independence.
With the exception of Mr. Kramer who, as the former CEO
of Fugro, owns employee options awarded to him at that
time in that capacity, none of the other Supervisory Board
members hold any (options on) shares or certifi cates of
shares in Fugro. Furthermore Mr. Kramer holds a sub-
stantial interest in Fugro (see page 11 of this Annual
Report and pages 163 and 164 of the Annual Accounts for
more details).
Both the composition of the Supervisory Board and
the expertise and experience of its individual members
comply with all corporate governance rules and
requirements.
P l e n a r y a c t i v i t i e s
In the year under review fi ve scheduled two-day meetings
were convened by the Supervisory Board and the Board of
■ R e p o r t o f t h e S u p e r v i s o r y B o a r d

16
The evaluation of the functioning of the Board of Manage-
ment and its individual members was prepared by a
discussion of each individual member of the Board of
Management with the Remuneration and Nomination
Committee and also based on the reports of the various
business lines. The results were discussed in the entire
Supervisory Board. The evaluation of the functioning of
the Supervisory Board, its separate Committees and its
individual members was prepared by input from
individual members of the Supervisory Board to the
Chairman, which discussions were followed by a plenary
discussion. It was concluded that the Supervisory Board is
adequately staffed and is functioning satisfactorily to
perform its responsibilities and tasks.
The fi ndings of the external audit were discussed with
KPMG. There were several regular contacts outside the
scheduled meetings between individual Supervisory
Directors and members of the Board of Manage ment and
the other members of the Executive Committee on
matters relating to Fugro. In particular there were regular
discussions between the Chairman of the Supervisory
Board and the CEO.
Prior to meetings in April and September of the Board of
the Fugro Trust Offi ce (Trust Offi ce), the Chairman of
the Supervisory Board and the CEO discussed with the
Board of the Trust Offi ce the activities and performance of
Fugro on the basis of the Annual Report 2009 and the
Half-yearly report 2010 respectively.
Au d i t C o m m i t t e e
In 2010 the members of the Audit Committee were
Messrs. F.J.G.M. Cremers (chairman) and J.A. Colligan and
Mrs. M. Helmes. The composition of the Audit Committee
is in accordance with the requirements of the Code.
Collectively the members possess the required experience
and fi nancial expertise. Mr. Cremers and Mrs. Helmes
were acting as fi nancial expert within the meaning of
the Code.
The terms of reference of the Audit Committee are
included in the terms of reference of the Supervisory
Board and are available on Fugro’s website.
In 2010 the Audit Committee met three times.
The external auditor (KPMG) attended all three meetings.
The annual accounts and half-yearly results were
discussed during the relevant meetings. Topics such as
taxation, claims and disputes, compliance and the
fi nancial crisis were discussed in depth. Risk areas, such
as hedging, fl uctuations in currency exchange rates,
impairment and insurance were also discussed as was
Management. Supervisory Board members attended
nearly all these meetings. Only once, one Supervisory
Board member was absent during one of the meetings.
The Board of Management attended all these meetings
and most of the meetings were also attended by the other
members of the Executive Committee. Occasionally part
of a meeting was held in the absence of the Board of
Management. In November a meeting was combined with
visits to operating companies in Rio de Janeiro and Macae
in Brazil. In Rio de Janeiro the Supervisory Board also
visited Petrobras, which is an important client of Fugro.
Every year such (extensive) company visits take place.
These annual visits also form part of the (annual) training,
education and, if applicable, induction programme of
supervisory directors.
The major issues discussed during the meetings included
amongst others the operational and fi nancial targets;
the general strategy designed to achieve the targets as well
as the strategies for the various business lines; market
developments; the annual budget; the fi nancial results;
share price development; intended acquisitions and
divestments; post acquisition analysis; corporate social
responsibility (CSR); health, safety and environment
(HSE); important investments; management development
and the fi lling of various senior management positions;
human resources management (HRM); information and
communication technology (ICT); the main risks inherent
to the company’s activities as well as the Board of Manage-
ment’s opinion regarding the set-up and functioning of
the internal risk management and control system;
the updated Dutch Corporate Governance Code; Fugro’s
corporate governance structure and the amendment of
the articles of association proposed to the Annual General
Meeting (AGM).
The reports of the Audit Committee and of the
Remuneration and Nomination Committee were also
discussed. Much attention was paid to the worldwide
economic recession and to the possible consequences
for Fugro of the Macondo oil spill. The reappointment of
KPMG as external auditor was also discussed and it was
decided to propose KPMG for reappointment at the AGM
on 6 May 2010. In addition to the scheduled meetings,
a few interim meetings took place via conference call
during which important issues were discussed.
The composition, among which diversity, as well as the
functioning of the Board of Management, the Supervisory
Board (and its separate Committees) and its individual
members were discussed in absence of the Board of
Management as well was the general business progress.

17Report of the Supervisory Board
Principal points of the Remuneration Report 2010
concerning the remuneration policy
The objective of the remuneration policy is to provide
a remuneration system such that:
• performance that is pursuant to the results and
strategy of Fugro is rewarded;
• top managers can be attracted and retained as
members of the Board of Management of Fugro.
The key elements are:
• fi xed (base) salary is determined at the median level
of a peer group of comparable companies (local and
international);
• variable income (annual bonus or short-term
incentive) depends on targets determined in advance
with a maximum of twelve months (100%) of annual
fi xed salary. On-target performance will result in a
bonus of eight months of annual fi xed salary.
The bonus is related to quantifi ed fi nancial targets
and accounts for 2/3 of the annual bonus and the other
part of the bonus is related to non-fi nancial / personal
targets and will account for 1/3 of the annual bonus;
• fi nancial targets and the weighing given to the
individual fi nancial elements are as follows: earnings
per share 60%, net profi t margin 20% and ROCE (return
on capital employed) 20%. These fi nancial elements are
based on Fugro’s annual budget;
• non-fi nancial targets are determined prior to the start
of the relevant year. These targets are based on Fugro’s
strategic agenda. These are qualitative individual
targets and/or collective targets that are the
responsibility of one or more directors and that can
be infl uenced by them. These targets could include,
among other things, health safety and environment
(HSE), corporate social responsibility (CSR), personal
development, etc.;
• stock options (long-term incentive). The stock options
for the Board of Management form part of a broad
option scheme that is in existence already many years
and that is applicable to more than 600 managers
worldwide. Options are granted on the basis of the
contribution to the long term development of the
Company, among which the development of the long
term strategy, on the basis of measurable targets such
as the (growth) targets in the strategic plan and in the
annual budget. This part of the income of members of
the Board of Management (and other senior manage-
ment) also depends on the Fugro share price and is
therefore linked to the value of Fugro.
Another objective of the stock options is to provide an
incentive for members of the Board of Management
(and other senior management) to continue their
employment relationship with Fugro;
the functioning of the internal risk management and
control system and the 2011 audit plan of the internal
audit function. Attention was also paid to the fi nancing
structure of Fugro. The Audit Committee was informed of
important fi ndings from the internal audit visits. KPMG
was given the opportunity to discuss issues with members
of the Audit Committee in the absence of Fugro’s Board of
Management and staff.
R e m u n e r a t i o n a n d N o m i n a t i o n C o m m i t t e e
In 2010 the members of the Remuneration and
Nomination Committee were Messrs. G-J. Kramer
(chairman), F.H. Schreve, H.C. Scheffer (following his
appointment as Supervisory Director on 6 May 2010) and
Th. Smith. In 2010 the Committee met formally three
times but also met informally on a number of occasions.
The terms of reference of the Remuneration and
Nomination Committee are included in the terms of
reference of the Supervisory Board and are available on
Fugro’s website.
R e m u n e r a t i o n
As far as remuneration is concerned, the topics discussed
included the remuneration policy, the remuneration of
the members of the Board of Management, the stock
option scheme and the remuneration of the members
of the Supervisory Board. The Supervisory Board has
determined the remuneration of the members of the
Board of Management on a proposal by the Remuneration
and Nomination Committee, within the scope of the
remuneration policy adopted by the AGM on 14 May 2008.
The Supervisory Board also decided, on a proposal by the
Remuneration and Nomination Committee, to propose to
the AGM on 10 May 2011 to increase the remuneration of
the members of the Supervisory Board. Further details on
this proposal will be included in the agenda for the AGM.
This agenda will be available on Fugro’s website on 29
March at the latest.
The Remuneration Report for the year 2010 was prepared
by the Remuneration and Nomination Committee in
accordance with best practice provision II.2.12 of the
Code, and has been approved by the Supervisory Board.
This Report contains an account of the manner in which
the remuneration policy has been implemented in 2010.
Both the Remuneration Report and the present
remuneration policy are available on Fugro’s website.

18
the Supervisory Board has established the extent to which
the targets for 2009 were achieved. Both the fi nancial
targets relating to the Group’s fi nancial performance as
the non-fi nancial targets were all met and even exceeded.
As a result the Supervisory Board has decided to award to
each of the members of the Board of Management an
annual bonus of 10 months annual fi xed salary over the
year 2009. The bonus was paid in 2010. As mentioned
above, the actual targets are not disclosed because they
qualify as competition-sensitive and hence commercially
confi dential and potentially price sensitive information.
As per 31 December 2010 a total of 291,000 options on
ordinary shares of Fugro were granted to the members of
the Board of Management (based upon the option scheme
as approved by the AGM on 14 May 2008). The exercise
price of these options is EUR 61.50 (the closing price of the
certifi cates of the shares at Euronext Amsterdam on 31
December 2010). The option period is six years and the
options can only be exercised after 1 January 2014 (vesting
period is three years).
Further details of Fugro’s remuneration policy and of the
remuneration of the individual members of the Board of
Management, broken down into its various components,
is presented in the Annual Accounts on page 160 and in
the Remuneration Report 2010.
The present remuneration policy for the members of the
Board of Management will continue to apply in 2011.
N o m i n a t i o n
As far as nomination is concerned, the topics discussed
included the composition of the Supervisory Board, the
Board of Management and of the Executive Committee.
In particular the succession and the reappointment of the
Chairman and the composition and succession planning
of the Executive Committee were discussed.
C o m p o s i t i o n o f t h e S u p e r v i s o r y B o a r d ,
t h e B o a r d o f M a n a ge m e n t a n d
( r e ) a p p o i n t m e n t s
Supervisory Board
In the AGM held on 6 May 2010, Messrs. F.H. Schreve,
G-J. Kramer and Th. Smith were reappointed and
Mr. H.C. Scheffer was appointed as member of the
Supervisory Board.
The Supervisory Board was aware that the reappointment
of Mr. Schreve exceeded the maximum appointment
period according to the Code. The Supervisory Board
intends to appoint Mr. Scheffer as new Chairman in May
2011. As a result, the appointment period of Mr. Schreve
was limited to one year. The Supervisory Board considered
• Pension provisions and fringe benefi ts. The pension
provisions of the members of the Board of Manage-
ment are based upon a customary pension scheme and
on an available premium system. The fringe benefi ts
are commensurate with the position held.
The actual (fi nancial and non-fi nancial) targets are not
disclosed because they qualify as competition-sensitive
and hence commercially confi dential and potentially
price sensitive information.
Before determining the remuneration of individual
members of the Board of Management, the Supervisory
Board analyses the possible outcomes of the variable
remuneration components and how they may affect
the remuneration of the members of the Board of
Management. The remuneration policy within the Fugro
Group is also taken into account.
The Supervisory Board may recover from the members
of the Board of Management any variable remuneration
awarded on the basis of incorrect fi nancial or other data.
Payment of variable remuneration to the members of
the Board of Management is subject to the correctness of
the relevant (fi nancial) data for the relevant year.
Under circumstances, for instance if the predetermined
targets/performance criteria would produce an unfair
result due to extraordinary circumstances, the Super-
visory Board has the discretionary authority to make
adjustments (upward or downward) to the amount of
the annual bonus. If the Supervisory Board would during
the year decide on the payment of severance pay or other
special remuneration to one or more members of the
Board of Management, an account and an explanation of
this remuneration shall be included in the remuneration
report. Until now, the amount of an annual bonus has
never been adjusted nor has a special remuneration been
paid.
Remunera t ion Boar d o f Management in 2010
and annua l bonus 2009
In 2009 the Board of Management, in view of the
economic situation, instructed management of the
operating companies that strict cost control should be
maintained and that salary increases for 2010 should be
limited. As a result the Board of Management decided not
to wish any possible salary increases for their own
members for 2010 and the Supervisory Board decided
accordingly.
At the beginning of 2010 the Committee has evaluated
the predetermined 2009 annual bonus targets. Based on
the results for the non-fi nancial and fi nancial targets,

19Report of the Supervisory Board
it to be in the best interest of Fugro that continuation of
the current chairmanship was maintained.
Board of Management
In the AGM held on 6 May 2010, Messrs. P. van Riel and
A. Steenbakker were reappointed as members of the Board
of Management.
( R e ) a p p o i n t m e n t s AG M 1 0 M a y 2 0 1 1
On 10 May 2011 the four-year appointment period of
Mr. J.A. Colligan ends. Mr. Colligan is nominated by the
Supervisory Board for reappointment as member of the
Supervisory Board for a period of four years.
The Supervisory Board has nominated Mr. W.S. Rainey for
appointment as a member of the Board of Management
for a period of four years. Mr. Rainey joined Fugro in 1981.
He is the President of Fugro, Inc. in the United States
and Chief Operating Offi cer (COO) of the business line
Offshore Geotechnical Services since 2006.
The Supervisory Board considers this appointment to be
in the interest of Fugro in view of Mr. Rainey’s extensive
knowledge and experience with respect to Offshore
Geotechnical services and activities related to deepwater
in particular.
Further information on Messrs. Colligan and Rainey can
be found on page 14 and page 20 of this Annual Report.
The main elements of the employment contract of
Mr. Rainey, as applicable after his appointment, will be
published on Fugro’s website.
I n c o n c l u s i o n
We are grateful to the Board of Management, the
Executive Committee and all Fugro employees for their
dedication throughout 2010 and the results achieved in
this challenging year. We wish them all continuing
success in dealing with the opportunities and challenges
which 2011 will bring.
Leidschendam, 9 March 2011
F.H. Schreve, Chairman
F.J.G.M. Cremers, Vice-chairman
J.A. Colligan
M. Helmes
G-J. Kramer
H.C. Scheffer
Th. Smith

20
From left to right: O.M. Goodman, J.H. Sommerville, J. Rüegg, W.S. Rainey, K.S. Wester (President and CEO), A. Steenbakker, S.J. Thomson, P. van Riel, H.I. Meyer and A. Jonkman.
■ E X E C U T I V E C O M M I T T E E
Fugro is the holding company of a large number of operating
companies located throughout the world and with a range of
activities. To promote client-orientation and effi ciency, the
Group’s organisational structure is highly decentralised, but
cohesive.
The (statutory) Board of Management consists of fi ve
members of which three members also fi ll the function of
Chief Operating Offi cer (COO).
The Executive Committee comprises the members of the
Board of Management and fi ve COO’s. The management of
the operating companies reports directly to a member of
the Executive Committee.
B o a r d o f M a n a ge m e n t O t h e r m e m b e r s o f t h e E xe c u t i ve C o m m i t t e e
name K.S. Wester (1946)
function President and Chief Executive Offi cer
nationality Dutch
employed by Fugro since 1981
appointed to Board of Management 1996
(President and Chief Executive Offi cer 2005)
current term permanent appointment
other function Member Supervisory Board Iv-Groep B.V.
name A. Jonkman (1954)
function Chief Financial Offi cer
nationality Dutch
employed by Fugro since 1988
appointed to Board of Management 2004
(reappointed 2008)
current term until AGM 2012
other function Member Supervisory Board Dietsmann N.V.
name P. van Riel (1956)
function Director / COO Onshore Geotechnical Services
nationality Dutch
employed by Fugro since 2001
appointed to Board of Management 2006
(reappointed 2010)
current term until AGM 2014
name J. Rüegg (1944)
function Director / COO Offshore Survey Services
nationality Swiss
employed by Fugro since 1994
appointed to Board of Management 2009
current term until AGM 2012
name A. Steenbakker (1957)
function Director / COO Information Services
nationality Dutch
employed by Fugro since 2005
appointed to Board of Management 2006 (reappointed
2010)
current term until AGM 2014
name O.M. Goodman (1956)
function COO Geospatial Services
nationality Irish
employed by Fugro Since 1993
fi rst appointed to current position 2001
name H. I. Meyer (1957)
function COO Seismic Services
nationality Norwegian
employed by Fugro Since 2005
fi rst appointed to current position 2009
name W.S. Rainey (1954)
function COO Offshore Geotechnical Services
nationality American
employed by Fugro since 1981
fi rst appointed to current position 2006
name J.H. Sommerville (1949)
function COO Subsea Services
nationality British
employed by Fugro since 1994
fi rst appointed to current position 2009
name S.J. Thomson (1958)
function COO General Geophysical Services
nationality Australian
employed by Fugro since 1999
fi rst appointed to current position 2006
Company Secretary
W.G.M. Mulders (1955)

21Report of the Board of Management
■ R e p o r t o f t h e B o a r d o f M a n a g e m e n t
■ G E N E R A L
In the course of 2010 economic recovery gradually started
in some regions, in particular in the Far East, resulting in
an increasing demand for energy. This has led to a higher
price of oil and an increase in the global exploration and
production expenditure of the oil and gas industry. As a
large part of Fugro’s activities is related to this sector,
the effect of the foregoing was also noticeable in our
activities.
In the fi rst half of 2010 revenues were fl at compared to the
fi rst half of the previous year, but over the second half of
2010 growth was resumed and revenues increased by 22%
compared to the second half of 2009.
In other sectors where Fugro operates, there were regional
variations in the demand for our services, with Europe
showing stagnation in demand for services for large
infrastructure projects and a low interest for mining
related work in Africa. Elsewhere the demand for these
services held up reasonably well or showed gradual
recovery.
Price pressure continues in segments with an oversupply
of available capacity, such as in marine seismic and
offshore construction support. New capacity additions in
the marine seismic market still exceed the growth in
demand. For offshore construction related work the
hiatus of new project start-ups in late 2008 has lead to
fewer projects entering the construction phase in the
current period.
Under these market circumstances Fugro has continued
to focus on cost control and keeping the utilisation of
capacity up by means of competitive pricing in some
sectors.
This has resulted in a somewhat lower net profi t
margin of 11.9% in 2010 (2009: 12.8%). Revenue of
EUR 2,280.4 million exceeded that of any previous year.
All three divisions showed growth in revenue and were
profi table.
Fugro’s fi nancial position is solid and underpins plans for
further growth in the medium term, both organically and
through acquisitions. The fl eet renewal/expansion
program for marine seismic work was completed during
the year. Expansion and renewal plans for vessels are in
place for the Geotechnical and Survey divisions.
Fugro’s broad range of services enables the company to
offer one-stop-shopping solutions to clients for complex
projects. This applies for new oil and gas developments as
well as for large infrastructure projects such as harbour
extensions and offshore wind farms.
During the year several interesting projects were awarded
to Fugro. Some examples are described on pages 36 and 37.
In fi nancial terms, the year 2010 can be summarised as
follows:
• Fugro’s revenue increased by 11.1% to
EUR 2,280.4 million (2009: EUR 2,053.0 million).
Revenue increased organically by 6.0% and by 0.4% as a
result of acquisitions. The foreign currency effect was
positive 4.7%;
• Earnings before interest, taxes, depreciation and
amortisation (EBITDA) increased by 1.8% to
EUR 561.1 million (2009: EUR 551.1 million);
• The results from operating activities (EBIT) decreased
by 4.3% to EUR 351.5 million (2009: EUR 367.4 million);
• Net result increased by 3.3% to EUR 272.2 million
(2009: EUR 263.4 million);
• Earnings per share increased by 0.3% to EUR 3.47 (2009:
EUR 3.46).
It is proposed to maintain the dividend for 2010 at
EUR 1.50 per share (2009: EUR 1.50).

22
Offshore weather forecasting at Fugro GEOS,
Wallingford, UK.
• Fugro Jacques GeoSurveys Inc., Canada. Fugro acquired
the remaining minority interest of 30%. The company
will in future operate under the name of Fugro
GeoSurveys Inc. and has a long track record in offering
the complete range of Fugro’s marine survey and
marine geotechnical services to Canadian-based and
international clients.
Reasons for acquisitions include obtaining new or
additional technology or increasing market share.
The annual revenue of the acquired companies in 2010
amounts to EUR 44 million (excluding the minority
interest of 30% in Fugro Jacques GeoSurveys Inc.).
The total cost of the acquisitions completed in 2010
was EUR 63.0 million (including Fugro Jacques
GeoSurveys Inc.).
For more detailed information on acquisitions that took
place in 2010, reference is made to the Annual Accounts
on pages 120, 121 and 122.
■ E M P L OY E E S
N u m b e r o f e m p l oy e e s
At the end of 2010 the number of employees was 13,463
(2009: 13,482). In a number of business units reductions in
■ A C QU I S I T I O N S
In 2010 Fugro completed the following acquisitions:
A c q u i s i t i o n s w i t h i n t h e G e o t e c h n i c a l
d i v i s i o n
• ERT (Scotland) Ltd., United Kingdom, provides services
to the global oil and gas, renewable energy and other
industries. It conducts survey, monitoring, consulting
and reporting activities supported by in-house
chemical and biological laboratories.
• Geo Pannon Kft and related company Statnamic Kft,
Hungary, are service providers in the fi eld of onshore
geotechnical services. With these acquisitions Fugro
has strengthened its position in Central and South
East Europe.
A c q u i s i t i o n s w i t h i n t h e S u r vey d i v i s i o n
• Interra S.A., Chile and its sister company TerraLaser
S.A., Peru, are specialised in aerial mapping.
• Riise Underwater Engineering AS (RUE), Norway, is a
provider of subsea engineering, ROV (remotely
operated vehicle) and diving services offshore and
inshore to the oil and gas industry. RUE is specialised
in IRM (inspection, repair and maintenance) and
subsea construction support.
Pe r s o n n e l d a t a 2010 2009 2008 2007 2006
Average number of employees during the year 13,444 13,587 12,977 10,824 9,261
Revenue per employee (x EUR 1,000) 169.6 151.1 166.0 166.5 154.9
Net revenue own services per employee (x EUR 1,000) 112.7 105.1 110.4 110.7 100.6
Geographical distribution at year-end
The Netherlands 943 947 978 935 871
Europe other/Africa 4,461 4,369 4,311 3,595 3,126
Middle East/Asia/Australia 4,270 4,411 4,319 3,624 3,007
North and South America 3,789 3,755 4,019 3,318 2,833
Total at year-end 13,463 13,482 13,627 11,472 9,837

23Report of the Board of Management
In order to maintain fl exibility, part of the vessel fl eet
capacity is based on long and short term charters, in
particular for those activities that can be performed from
more standardised vessels.
The charter term of a number of vessels will expire in the
course of 2011. Extensions of charters will be considered
taking into account the backlog and prospects for future
work. Fugro also uses vessels that are chartered on a
project-by-project basis.
In the course of 2010 the following changes took place in
the vessel fl eet:
G e o t e c h n i c a l d i v i s i o n
At mid-year an eight year old DP vessel was bought and
renamed Fugro Adventurer. The vessel operates in the
Middle East region for geotechnical investigations, but is
also suitable for survey and ROV work.
An order was placed for two new build DP vessels for
geotechnical work in deepwater.
S u r vey d i v i s i o n
At the end of the fi rst quarter a new built survey vessel,
the Fugro Searcher, commenced service. A sister vessel,
the Fugro Galaxy, will be delivered in March 2011.
Furthermore, an order for two survey vessels was placed
in the course of the year, supplemented by a third vessel
towards the year end. These vessels will operate in various
regions, with one of them expected to be stationed in
Brazil.
At the start of 2010, one older chartered ROV support
vessel was replaced by a chartered new build. At year-end,
one chartered vessel was returned to the owners at the
expiry of the charter term.
Towards the year-end three ROV vessels were added to the
fl eet through the acquisition of RUE.
staff amounting to 132 were implemented during the
year. These reductions, in combination with the addition
of 113 staff through acquisitions and the hiring of staff in
business units where market circumstances were
favourable, resulted in a decline of 19 employees overall.
The average number of employees during the fi nancial
year was 13,444 (2009: 13,587), a decrease of 1.1%. Fugro
also works with a large group of experienced and long
serving freelance workers who are regularly deployed
on a project basis. The use of freelance workers provides
Fugro with the fl exibility to respond to variations in
manpower requirements. As a result of increasing
demand slightly more freelancers were used in 2010.
Fugro mainly employs local employees and deploys a
small number of expatriates.
Despite the global shortage of specialists, Fugro has been
successful when it comes to recruiting experienced and
professional employees. Increasingly, this is coordinated
on a global basis. Fugro’s recruitment success is helped by
the global spread of its activities and the opportunities
that Fugro can offer to innovative and entrepreneurial
staff.
Fugro continues to invest in training and education in
order to guarantee a high standard of services. Once
again, as in 2009, recruiting young talent was deemed
critical in 2010. In Fugro, new employees also get access to
knowledge and experience through on-the-job training
and by working together with experienced employees in
small teams on existing projects. Fugro also actively
invests in a healthy and safe work environment.
■ C A PA C I T Y P L A N N I N G
A large part of Fugro’s revenue is generated by offering
niche services in related markets by combining state-of-
the-art technology and knowledge on a global scale.
Over the years Fugro has achieved a leading position in
several niche markets, and in order to be able to maintain
such positions it requires continuous development,
upgrading and advancement of the technologies used.
To optimise effi ciency, Fugro uses a lot of equipment
that is developed in-house, based on the company’s
operational experience. Maintaining the ownership of
such equipment is part of Fugro’s strategy. This is
underpinned by an ongoing long term investment
program in key assets such as purpose-build vessels and
operational equipment.
F l e e t r e n e wa l / e x p a n s i o n
Name of the vessel Type of vessel
Expected
start of
delivery
Fugro Galaxy Survey Q1-2011
Fugro Symphony ROV-support Q2-2011
Fugro Equator Survey Q1-2012
Fugro Australis Survey Q2-2012
Fugro Voyager Geotechnical Q3-2012
Fugro Brasilis Survey Q4-2012
Fugro Scout Geotechnical Q1-2013

24
The analysis of the change in revenue is shown in the
table above. The average revenue growth over a ten year
period is about two thirds organic growth, with one third
from acquisitions. The foreign currency effect over the
same period is not material.
Also in 2010, Fugro spent much attention to optimising
business effi ciency and reducing costs as much as
possible. One of the key related decision points is that of
continuation or termination of charter agreements.
Third party costs amounted to EUR 765.6 million in 2010
(2009: EUR 624.4 million). This represents an increase of
EUR 141.2 million. Third party costs as a percentage of
revenue were 33.6% (2009: 30.4%) and include
EUR 88.8 million expenses associated with seismic and
geologic data libraries (2009: EUR 64.0 million).
As in 2009, managing the workforce was a focus in 2010.
The size of the workforce was carefully evaluated and
actively adapted to the demand in services. This meant
that in some activities the number of employees was
reduced and that in case of growth in activities more staff
was hired, as was the case in Brazil.
The average cost per employee was EUR 53,789, an
increase of 12.0% compared to 2009 (EUR 48,046). The
majority of this increase is related to foreign currency
effects. Total personnel expenses in the year amounted to
EUR 723.1 million (2009: EUR 652.8 million), an increase
of 10.8%. This is 31.7% as a percentage of revenue, which is
almost the same as in 2009 (31.8%).
G e o s c i e n c e d i v i s i o n
With the delivery of the new build seismic vessels
Geo Caspian (chartered) and Geo Coral (owned) the
expansion of the seismic fl eet was completed. Fugro
bought the Geo Celtic, which already was under long term
charter. The Seisquest was chartered for a limited period
starting at the end of the fi rst quarter in 2010.
S c h e d u l e d f l e e t e x p a n s i o n
Fugro has placed orders for new build vessels to become
operational in the period 2011 through 2013 as shown
above. All vessels will be owned and are designed to
Fugro’s specifi cations. The fi nancing is covered by existing
facilities and expected future operating cash fl ows.
■ F I N A N C I A L
R e ve n u e a n d c o s t d e ve l o p m e n t
In 2010 revenue reached EUR 2,280.4 million, an increase
of 11.1% compared to the EUR 2,053.0 million in 2009.
Revenue increased 6.0% due to organic growth and by
0.4% as a result of acquisitions. The foreign currency
effect was positive 4.7%.
Organic growth of 6.0% was achieved despite the fact that
Fugro continued to face price pressure in a number of
market segments where there is more capacity in the
market than demand can absorb. The marine seismic
activities (division Geoscience) and the subsea activities
(division Survey) suffered the most from this.
R e ve n u e g r ow t h
(in percentages)
Organic Acquisitions Disposals
Exchange
rate differen-
ces Total
2010 6.0 0.4 – 4.7 11.1
2009 (5.6) 1.1 – (0.2) (4.7)
2008 23.4 4.0 – (7.9) 19.5
2007 22.9 6.4 ( 0.1) (3.5) 25.7
2006 18.9 6.8 (0.3) (1.8) 23.6
2005 12.0 1.4 (1.1) 2.8 15.1
2004 9.7 16.2 (0.6) (2.7) 22.6
2003 (8.6) 4.9 – (9.4) (13.1)
2002 3.4 4.0 – (3.4) 4.0
2001 18.4 8.6 – 0.6 27.6
Average (2001 – 2010) 10.1 5.4 (0.2) (2.1) 13.2

25Report of the Board of Management
EUR 22.3 million before tax. This change is largely caused
by the strong increase of the share price of EMGS in the
last few days of December 2010. The net effect after tax is
EUR 16 million.
Except for the above-mentioned item, there are no non-
recurring items that signifi cantly impacted the net result.
R e s u l t s f r o m o p e r a t i n g a c t i v i t i e s ( E B I T )
The result from operating activities (EBIT) amounted to
EUR 351.5 million (2009: EUR 367.4 million), a decrease of
4.3%. The EBIT as a percentage of revenue clearly improved
in the second half of 2010 resulting in an EBIT of 15.4%
over the full year (2009: 17.9%). This means that the
decline in EBIT with more than twenty per cent over the
fi rst six months, caused by, amongst others, bad weather
conditions in early 2010, was largely mitigated.
Depreciation of tangible fi xed assets increased from
EUR 173.6 million to EUR 201.5 million in 2010, an
increase of 16.1%, which is a result of capacity expansion
and concerns mainly the vessel fl eet (including related
operational equipment) and ROVs.
The depreciation of tangible fi xed assets is 8.8% of revenue
(2009: 8.5%).
Other expenses amounted to EUR 252.5 million in 2010
(2009: EUR 249.1 million), an increase of 1.4%. As a
percentage of revenue these costs are 11.1% (2009: 12.1%).
Other expenses include a variety of different costs, which
cannot be allocated directly to projects, such as repair and
maintenance, occupancy, insurances, etc. As a result of
strict cost control of these items Fugro was able to
continue savings realised in 2009 into 2010.
N e t r e s u l t
The net result increased by 3.3% to EUR 272.2 million
(2009: EUR 263.4 million). The basic earnings per share
amounts to EUR 3.47 (2009: EUR 3.46). Measured over the
last fi ve years, the fi nancial objective of an average
increase of earnings per share of 10% per annum was
exceeded.
The net result includes a change in the fair value of
the conversion feature attached to the convertible loan
to Electro Magnetic GeoServices ASA (EMGS) of
G e og r a p h i c a l d i s t r i b u t i o n o f r e ve n u e *
(on 31 December, x EUR 1 mln.) 2010 2009 2008 2007 2006
The Netherlands 133 134 145 124 114
Europe other/Africa 1,111 985 1,082 857 610
Middle East/Asia/Australia 432 420 426 351 288
North and South America 604 514 502 471 422
Total 2,280 2,053 2,155 1,803 1,434
* Based on the place of business of the operating company that executes the project.
R e ve n u e d i s t r i b u t i o n p e r d i v i s i o n
(on 31 December, x EUR 1 mln.) 2010 2009 2008 2007 2006
Geotechnical 664 536 541 443 371
Survey 1,009 956 960 852 709
Geoscience 607 561 654 508 354
Total 2,280 2,053 2,155 1,803 1,434

26
C a s h f l ow
In 2010, the cash fl ow amounted to EUR 489.8 million
(2009: EUR 456.8 million), an increase of 7.2%. Cash fl ow is
defi ned as the profi t for the period plus depreciation and
amortisation. The expected future cash fl ow will enable
the company to remain within the current fi nancing
covenants and to fi nance the committed investments. The
cash fl ow per share equates to EUR 6.25 (2009: EUR 5.99),
an increase of 4.3%. The fi nancial growth target for the
cash fl ow of on average 10% per annum was amply
achieved measured over the last fi ve years.
I n ve s t m e n t s
In the past years, Fugro has invested considerably in the
expansion of seismic capacity. In 2010, this program was
concluded with the introduction of the Geo Caspian and
the Geo Coral into service. As indicated before, Fugro will
continue to invest in its vessel fl eet in the coming years to
support future growth. This will predominantly be done
in the Geotechnical and Survey divisions. Here, older
vessels will be replaced and capacity will be added if
market conditions allow. In particular deep water market
opportunities will be considered in this decision-making.
E B I T DA
The earnings before interest, tax, depreciation and
amortisation amounted to EUR 561.1 million (2009:
EUR 551.1 million), an increase of 1.8%.
Fo r e i g n c u r r e n c y
During 2010, the average US dollar exchange rate
increased to EUR 0.76 (2009: 0.72), the average exchange
rate of the British pound increased to EUR 1.17 (2009:
EUR 1.13) and the average exchange rate of the Norwegian
kroner increased to EUR 0.125 (2009: EUR 0.115). As a
result of the various fl uctuations, the net foreign
exchange effect in the profi t and loss account in 2010 was
negative EUR 5.1 million (2009: negative EUR 13.4
million). Exchange losses were largely caused by the
difference in exchange rates between the entry date of
trade receivables and the moment of receipt.
In the balance sheet, valuations were infl uenced by
foreign currency effects at year-end. The US dollar and
the British pound played an important role. However, also
currencies like the Australian dollar and the Canadian
dollar had a higher value at the end of 2010 compared to
the end of 2009.
The foreign currency effect was EUR 108 million positive
on the equity per 31 December 2010 (2009: positive EUR 48
million). See page 73 of the report under risk manage-
ment and page 155 of the annual accounts under cur-
rency risk.
E x c h a n ge r a t e s ( i n E U R ) 2010 2010 2009 2009 2008 2008
Year-end Average Year-end Average Year-end Average
US dollar 0.75 0.76 0.69 0.72 0.71 0.68
British pound 1.16 1.17 1.13 1.13 1.05 1.25
Norwegian kroner 0.128 0.125 0.121 0.115 0.102 0.121
0
90
180
270
360
450
20102009200820072006
R e s u l t s f r o m o p e r a t i n g a c -
t i v i t i e s ( E B I T ) (x EUR 1 mln.)
0
60
120
180
240
300
20102009200820072006
N e t r e s u l t
(x EUR 1 mln.)
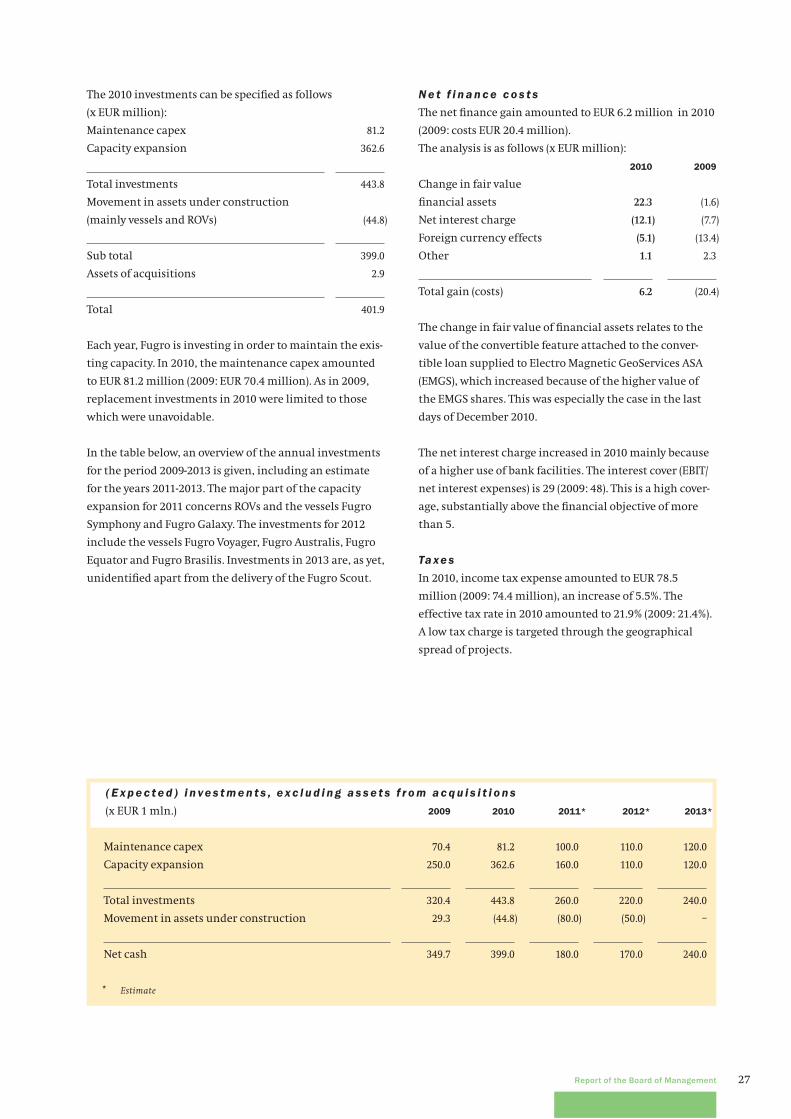
27Report of the Board of Management
N e t f i n a n c e c o s t s
The net fi nance gain amounted to EUR 6.2 million in 2010
(2009: costs EUR 20.4 million).
The analysis is as follows (x EUR million):
2010 2009
Change in fair value
fi nancial assets 22.3 (1.6)
Net interest charge (12.1) (7.7)
Foreign currency effects (5.1) (13.4)
Other 1.1 2.3
Total gain (costs) 6.2 (20.4)
The change in fair value of fi nancial assets relates to the
value of the convertible feature attached to the conver-
tible loan supplied to Electro Magnetic GeoServices ASA
(EMGS), which increased because of the higher value of
the EMGS shares. This was especially the case in the last
days of December 2010.
The net interest charge increased in 2010 mainly because
of a higher use of bank facilities. The interest cover (EBIT/
net interest expenses) is 29 (2009: 48). This is a high cover-
age, substantially above the fi nancial objective of more
than 5.
Ta xe s
In 2010, income tax expense amounted to EUR 78.5
million (2009: 74.4 million), an increase of 5.5%. The
effective tax rate in 2010 amounted to 21.9% (2009: 21.4%).
A low tax charge is targeted through the geographical
spread of projects.
The 2010 investments can be specifi ed as follows
(x EUR million):
Maintenance capex 81.2
Capacity expansion 362.6
Total investments 443.8
Movement in assets under construction
(mainly vessels and ROVs) (44.8)
Sub total 399.0
Assets of acquisitions 2.9
Total 401.9
Each year, Fugro is investing in order to maintain the exis-
ting capacity. In 2010, the maintenance capex amounted
to EUR 81.2 million (2009: EUR 70.4 million). As in 2009,
replacement investments in 2010 were limited to those
which were unavoidable.
In the table below, an overview of the annual investments
for the period 2009-2013 is given, including an estimate
for the years 2011-2013. The major part of the capacity
expansion for 2011 concerns ROVs and the vessels Fugro
Symphony and Fugro Galaxy. The investments for 2012
include the vessels Fugro Voyager, Fugro Australis, Fugro
Equator and Fugro Brasilis. Investments in 2013 are, as yet,
unidentifi ed apart from the delivery of the Fugro Scout.
( E x p e c t e d ) i n ve s t m e n t s , e x c l u d i n g a s s e t s f r o m a c q u i s i t i o n s
(x EUR 1 mln.) 2009 2010 2011* 2012* 2013*
Maintenance capex 70.4 81.2 100.0 110.0 120.0
Capacity expansion 250.0 362.6 160.0 110.0 120.0
Total investments 320.4 443.8 260.0 220.0 240.0
Movement in assets under construction 29.3 (44.8) (80.0) (50.0) –
Net cash 349.7 399.0 180.0 170.0 240.0
* Estimate
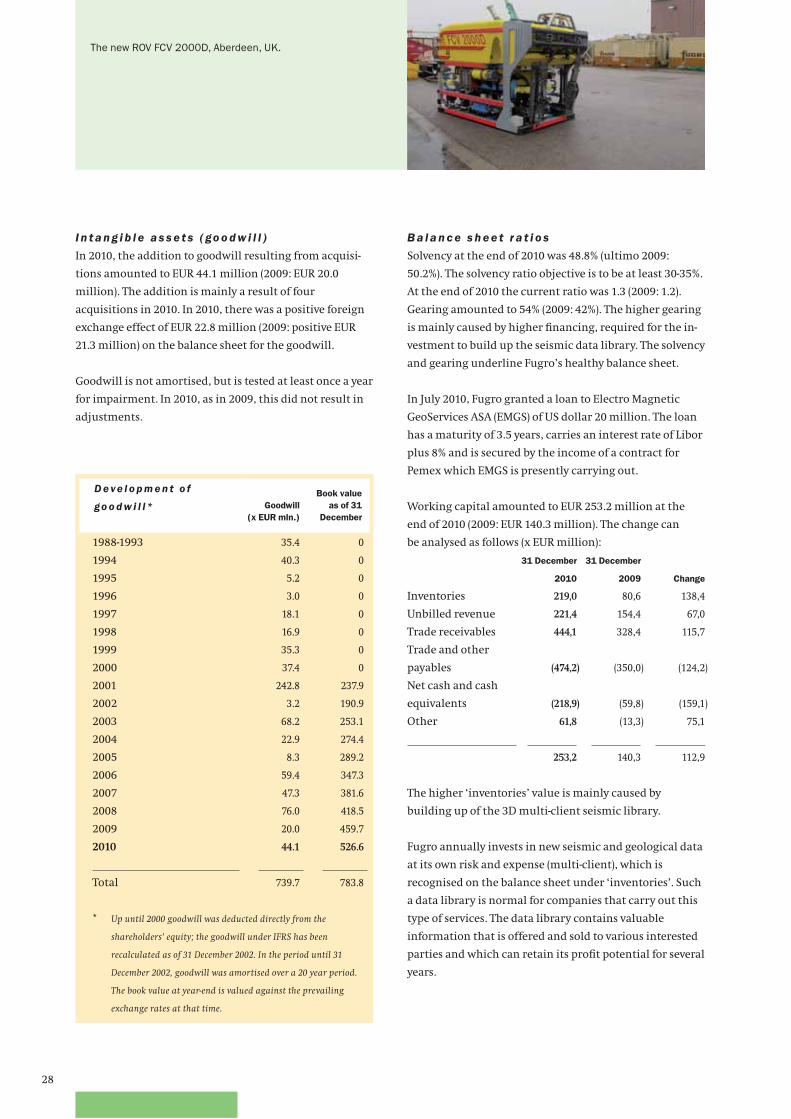
28
The new ROV FCV 2000D, Aberdeen, UK.
B a l a n c e s h e e t r a t i o s
Solvency at the end of 2010 was 48.8% (ultimo 2009:
50.2%). The solvency ratio objective is to be at least 30-35%.
At the end of 2010 the current ratio was 1.3 (2009: 1.2).
Gearing amounted to 54% (2009: 42%). The higher gearing
is mainly caused by higher fi nancing, required for the in-
vestment to build up the seismic data library. The solvency
and gearing underline Fugro’s healthy balance sheet.
In July 2010, Fugro granted a loan to Electro Magnetic
GeoServices ASA (EMGS) of US dollar 20 million. The loan
has a maturity of 3.5 years, carries an interest rate of Libor
plus 8% and is secured by the income of a contract for
Pemex which EMGS is presently carrying out.
Working capital amounted to EUR 253.2 million at the
end of 2010 (2009: EUR 140.3 million). The change can
be analysed as follows (x EUR million):
31 December
2010
31 December
2009 Change
Inventories 219,0 80,6 138,4
Unbilled revenue 221,4 154,4 67,0
Trade receivables 444,1 328,4 115,7
Trade and other
payables (474,2) (350,0) (124,2)
Net cash and cash
equivalents (218,9) (59,8) (159,1)
Other 61,8 (13,3) 75,1
253,2 140,3 112,9
The higher ‘inventories’ value is mainly caused by
building up of the 3D multi-client seismic library.
Fugro annually invests in new seismic and geological data
at its own risk and expense (multi-client), which is
recognised on the balance sheet under ‘inventories’. Such
a data library is normal for companies that carry out this
type of services. The data library contains valuable
information that is offered and sold to various interested
parties and which can retain its profi t potential for several
years.
I n t a n g i b l e a s s e t s ( go o d w i l l )
In 2010, the addition to goodwill resulting from acquisi-
tions amounted to EUR 44.1 million (2009: EUR 20.0
million). The addition is mainly a result of four
acquisitions in 2010. In 2010, there was a positive foreign
exchange effect of EUR 22.8 million (2009: positive EUR
21.3 million) on the balance sheet for the goodwill.
Goodwill is not amortised, but is tested at least once a year
for impairment. In 2010, as in 2009, this did not result in
adjustments.
D e ve l o p m e n t o f
go o d w i l l * Goodwill
(x EUR mln.)
Book value
as of 31
December
1988-1993 35.4 0
1994 40.3 0
1995 5.2 0
1996 3.0 0
1997 18.1 0
1998 16.9 0
1999 35.3 0
2000 37.4 0
2001 242.8 237.9
2002 3.2 190.9
2003 68.2 253.1
2004 22.9 274.4
2005 8.3 289.2
2006 59.4 347.3
2007 47.3 381.6
2008 76.0 418.5
2009 20.0 459.7
2010 44.1 526.6
Total 739.7 783.8
* Up until 2000 goodwill was deducted directly from the
shareholders’ equity; the goodwill under IFRS has been
recalculated as of 31 December 2002. In the period until 31
December 2002, goodwill was amortised over a 20 year period.
The book value at year-end is valued against the prevailing
exchange rates at that time.

29Report of the Board of Management
F i n a n c i n g
During 2010, Fugro reached agreement with BNP Paribas
to increase the existing credit facility by EUR 50 million to
EUR 100 million under the same terms and conditions.
The total committed long-term bank fi nancing as per
31 December 2010 amounts to EUR 500 million, of which
EUR 8 million was not yet used. The committed bank
fi nancing is available till April 2012. The total of the
available uncommitted overdraft facilities at the end of
2010 amounted to EUR 525 million, of which EUR 255
million was not yet used.
Early 2011 agreement was reached with ABN AMRO to
increase the existing credit facility by EUR 50 million to
EUR 100 million under the same terms and conditions.
Private Placement loans were concluded in 2002 for EUR
20 million and for US dollar 120 million. The US dollar
loans are held in the original currency to hedge
investments in foreign operations denominated in US
dollars. Interest on the private placement loans varies
between 6.45% and 7.10%. These private placement loans
will have to be repaid in parts in 2012, 2014 and 2017.
■ D I V I D E N D P RO P O S A L
It is proposed that the dividend for 2010 be maintained at
EUR 1.50 per share (2009: EUR 1.50), to be paid at the
option of the holder:
• in cash, or
• in (certifi cates of) shares
If no choice is made, the dividend will be paid in
(certifi cates of) shares.
The proposed dividend equates to a pay-out percentage
of 43.7% of the net result. For more details see page 10
and 11.
With the launch of the seismic vessel the Geo Coral, Fugro
concluded a multi-year program to build up a ‘state of the
art’ 3D seismic fl eet. Following the increasing interest for
multi-client 3D projects Fugro started late 2009 to use part
of the newly available capacity to build up a 3D library in
addition to the 2D library. The fi rst 3D multi-client
projects were completed in the course of 2010.
The seismic and geological data libraries are measured at
the lower of cost and net realisable value. As it is expected
that sales lead to a lower net realisable value of the
seismic and geological data, the expected decrease in
value is taken into account at the moment of each sale
transaction in the fi nancial year. Fugro evaluates the net
realisable value on a regular basis and reassesses the net
realisable value at each reporting date. Based on historical
as well as forecasted sales of data, management currently
assesses that 3D data sets will no longer generate sales
after a fi ve year period (2D data sets: three year period).
Virtually no data acquired during or before 2008 is valued
on the balance sheet. At the year end, the total net book
value of the library amounted to EUR 204.5 million
(2009: EUR 68.5 million) of which EUR 199 million is
related to marine seismic (2009: EUR 62 million).
The current market situation for multi-client data and the
selective attitude of potential customers concerning
geographic location of the collected data has been taken
into account in the valuations of the data library.
The data library’s balance sheet valuation has increased
compared to the end of 2009, mainly because of a number
of large projects carried out offshore Australia, for which
good pre-commitments were received. This underlines the
interest of oil and gas companies in this specifi c data.
In 2010, some EUR 218 million new data was added to the
libraries. About EUR 186 million of sales of seismic data
was recognised as revenue.
At the end of 2008, Fugro recognised a EUR 25 million
impairment allowance in respect of, amongst others,
trade receivables and unbilled revenue as a consequence
of the fi nancial crisis. In respect of trade receivables and
unbilled revenues about EUR 4 million was charged
against the allowance in the years 2009 and 2010. At the
end of 2010 an evaluation of remaining potential risks
was done. A total amount of EUR 15 million for specifi cally
identifi ed issues has been maintained.

30
Many of the exploration and development activities,
especially those related to deepwater projects, take place
in the Gulf of Mexico, West Africa and Brazil. Other
regions that continue to be very active are the Middle
East, the northern part of the North Sea and parts of Asia,
India and Australia. There is also a continuing interest in
detailed reservoir information from existing fi elds to
enable production levels to be maintained for as long as
possible, and to extract the maximum volume of available
oil and gas.
The Macondo oil spill in the Gulf of Mexico delayed
ongoing developments in that area and it is still unclear
what the effects for the near future will be, as new
regulations for future development are still under review.
Demand for gas is creating a global growth market. The
demand is increasingly met by production of liquefi ed
natural gas (LNG), which can be transported over sea as
well as local shale gas production onshore. High energy
prices are helping to make the development of gas fi elds
located at considerable distance from the user markets
more attractive. This is especially applicable in the Middle
East where there are considerable gas reserves within
transportation distance of India, China, Japan and
Europe. Large-scale developments are also taking place in
countries that have been exporting gas for some time,
such as Australia, Nigeria and Indonesia.
External publications indicate that oil companies base
their economic viability calculations for most of their
larger projects on a price of oil well below the current
price level. Considering the long duration from start to
fi nish of these kinds of projects and the current trend in
the oil price, Fugro anticipates that its services will
continue to be in demand in 2011 and the years beyond.
About 73% of Fugro’s activities is related to the oil and gas
industry.
T h e m a r ke t fo r i n f r a s t r u c t u r e p r o j e c t s
Infrastructure and construction related activities
accounted for approximately 19% of Fugro’s revenues in
2010. The uncertain economic situation is still noticeable
in a number of these market segments. The residential
market, for instance, has slowed down in several
countries. This market is less important to Fugro, as it
concentrates more on large infrastructure projects. In
times of economic stagnation, (local) governments often
accelerate such projects to boost the local economy. Fugro
provides several services in this part of the market such as
aerial surveying, water management, advice on
foundations and road maintenance. In order to be
involved in large infrastructure projects as early as
■ M A R K E T D E V E L O P M E N T S A N D T R E N D S
Tr e n d s
In 2010 the effects of the economic slowdown resulting
from the fi nancial crisis were still impacting most of the
markets in which Fugro is active. Nevertheless, in the
course of the year some positive changes became
noticeable in some sectors. In particular, the slowdown in
demand for oil and gas related activities bottomed out.
By way of its position in the international markets in
which it operates and the mix of its clients, Fugro was
reasonably protected against, but not immune to, the
consequences of the worldwide crisis. In particular, the
effects continued to be felt in the fi rst half of the year.
T h e o i l a n d ga s m a r ke t
From mid-year 2010 onwards the price of oil gradually
increased to over USD 90 per barrel (Brent) at the end of
the year. External reports indicate that on the basis of
growing global demand the price of oil is expected to stay
above USD 80 per barrel (Brent). This level seems to be
comfortable for the industry and in the course of 2010 oil
companies started to step up activities. This is refl ected in
recent external market reviews that indicate that after a
decline of about 15% in global investments in 2009, the oil
and gas industry stepped up expenditure by some 11% in
2010. Further double digit growth is expected for 2011.
It was largely national oil companies that kept up their
levels of investment during the economic recession.
In 2011 growth is expected to come, in particular, from
large international oil companies.
Increasingly, as a consequence of implementing the
strategy to provide a broad range of related services, Fugro
is involved throughout the life cycle of oil and gas fi elds.
This cycle can last for several decades. It starts with the
search for fi elds, continues with investigations and
surveys related to the design and construction of the
structures required to bring new fi elds into production,
to maintaining and improving production from existing
fi elds and, fi nally, decommissioning. Fugro will therefore
be able to benefi t from increases in investments by oil and
gas companies, irrespective of where they are being made
in the fi eld life cycle. In years to come, large investments
will be required to maintain suffi cient oil and gas
production in the longer term. The majority of these
investments will be for offshore fi elds.
31Report of the Board of Management
O t h e r m a r ke t s e g m e n t s
Fugro not only supplies services to the aforementioned
markets but also to a number of other niche markets.
These services include precise positioning for machine
guidance in agriculture, route surveys for offshore
telecommunication cables, and airborne mapping using
laser and radar technology for governmental authorities
and other public bodies. Approximately 5% of annual
revenue is generated by these segments. In general, these
activities are more region-specifi c and related to specifi c
economic activity.
possible, Fugro strives to make early contacts with the key
players in the development of these projects.
In some countries, like the USA, stimulus programs are
generating projects in which Fugro is participating. The
uncertainty remains as to how far general economic
developments will be able to support the activities by the
time stimulus programs expire.
Fugro undertakes contracts associated with airports, land
reclamation, (LNG) harbour expansions, levees, tunnels,
bridges and major building and construction works all
over the world. The company is strengthening its market
position in this segment, as it has increasingly positioned
itself as a supplier of integrated solutions. This fulfi ls
customer’s preference for handing over the
responsibilities for a broad range of data acquisition and
consultancy activities to a single, independent global
service provider.
M i n i n g
The majority of Fugro’s mining related revenue comes
from the exploration sector. This sector drastically
reduced the level of investment in 2009. The private sector
component is driven by the economic value of new
sources of minerals. This is affected by mineral prices and
by the planning assumptions and planning horizon of the
mining companies. As the fi nancial markets entered into
diffi culty during the fi nancial crisis, potential sources of
funding from equity and debt providers for explorers
came under severe pressure. As a result of this, a
signifi cant decrease was seen in the activity of mining
‘juniors’. On the basis of a better economic outlook,
activities recovered somewhat in the later part of 2010
and governmental and semi-governmental organisations
continued to carry out some projects. Such projects are
regional mapping of geology and earth structures which
are viewed as a strategic investment by governments and
semi-governmental organisations such as international
aid groups. These projects tend to be less dependent on
short-term fl uctuations in the price of minerals. Mining
related activities accounted for 3% of Fugro’s revenue in
2010.

32
■ P O S T B A L A N C E S H E E T DAT E E V E N T S
Early March 2011, Fugro has acquired 100% of the shares
in TSmarine Group Holdings Pty Ltd (TSM) and its
subsidiaries. TSM, with its headquarters in Perth Australia
and subsidiaries in Singapore, Labuan (Malaysia) and
Aberdeen (United Kingdom), is a specialist provider of
subsea construction, IRM (inspection, repair and
maintenance) and light well intervention. The company
operates ROVs (Remotely Operated Vehicle) and diving
services and has four high specifi cation chartered vessels
in its fl eet.
The combination of Fugro’s existing strength and its
global network with TSM’s business will lead to
substantial synergies and will enable Fugro to strengthen
its subsea services business in support of the offshore oil
and gas industry, with a particular focus on Asia-Pacifi c
and Europe-Africa.
TSM will be renamed Fugro-TSM and will be part of
Fugro’s Subsea Services Business Line. TSM management
will continue to work in Fugro.
■ B A C K L O G
At the beginning of 2011 the backlog of work to be carried
out during the year amounted to EUR 1,553.2 million
(beginning of 2010: EUR 1,364.0 million). The proportion
of defi nite orders is 58% (beginning 2010: 53%). The
backlog calculation is based on year-end exchange rates in
EUR and is 13.9% higher than at the beginning of 2010. Of
the increase in backlog, 8.7% is related to foreign currency
effects. The backlog has increased as a result of somewhat
improving market circumstances. Delays in the fi rm
commitment of new projects, last minute awards and
lower prices still have an effect on the volume of the
backlog. This is mainly the consequence of the generally
improved availability of service capacity, unlike in years
previous to the start of the economic downturn. This is in
particular the case for marine seismic activities.
The order backlog of work to be carried out equals about
eight months revenue.
B a c k l og a t s t a r t o f t h e y e a r
( fo r t h e n e x t t we l ve m o n t h s )
(x EUR 1 mln.) 2011 2010 2009 2008 2007
Geotechnical
Onshore Geotechnical 230.4 191.9 168.7 152.7 147.1
Offshore Geotechnical 205.7 199.3 174.6 142.6 98.3
436.1 391.2 343.3 295.3 245.4
Survey
Offshore Survey 431.2 388.3 436.0 354.7 334.9
Subsea Services 255.9 244.5 273.0 207.5 168.6
Geospatial Services 96.2 83.6 95.8 85.9 40.5
783.3 716.4 804.8 648.1 544.0
Geoscience
Seismic Services 222.8 164.1 356.8 399.6 256.3
Information Services 49.4 45.5 34.7 53.1 37.7
General Geophysical Services 61.6 46.8 60.8 62.4 63.0
333.8 256.4 452.3 515.1 357.0
Total 1,553.2 1,364.0 1,600.4 1,458.5 1,146.4
Backlog comprises revenue for work to be carried out in the coming twelve months and includes uncompleted parts
of on-going projects and contracts awarded but not yet started (approximately 58% of the total) and projects that have
been identifi ed and are highly likely to be awarded (approximately 42% of the total).

33Report of the Board of Management
new fi elds into production, the need for continuous
investment in production capacity is less sensitive to
short term economic developments. Fugro’s involvement
in the subsea servicing of installations (inspection, repair
and maintenance or IRM) has gradually increased over the
last few years and these activities are less sensitive to oil
price fl uctuations, as maintenance on producing fi elds is,
in any case, a necessity.
The majority of Fugro’s services to the oil and gas industry
are provided by Offshore Geotechnics, Offshore Survey,
Subsea Services, Information Services and Seismic
Services.
In other segments where Fugro is active, like larger
infrastructure projects, there are indications of a further
recovery during the course of the coming year in a
number of regions. These activities include transportation
projects (such as roads and ports), coastal protection,
pipelines and water management. The onshore and
nearshore geotechnical activities, as well as aerial
mapping activities in Geospatial, are involved in this.
Fugro’s decentralised organisational structure, with local
operating companies, enables the company to respond
quickly to changes in demand for infrastructure services
that have a national or regional character.
Due to the sharp fall in prices for minerals and the heavy
dependence of smaller clients on external fi nancing for
projects, a strong decline in the demand for mineral
exploration services occurred in 2009. During the second
half of 2010 a gradual improvement in the demand for
these services took place.
In addition to the infl uence of market demand, the
exchange rates of the US dollar, the Norwegian kroner
and the British pound compared to the Euro are
important. The majority of Fugro’s revenue corresponds
to costs in the same currency. However, the translation to
Euros can be of infl uence in the reporting of results,
which is in Euros. In addition to currency exchange
fl uctuations, another factor which creates uncertainty is
political instability, which can lead to the stagnation of
projects.
Economic developments over the last two years have
resulted in less tension in the labour market and more
manageable costs of services from third parties, such as
the transport of equipment and the short-term charter of
vessels.
TSM’s revenue amounts at present to over EUR 90 million
per annum. The company has 70 permanent offi ce-based
professional staff and has up to 100 contract staff at any
one time. The purchase price amounts to EUR 77 million.
Quantitative information on the fair value of assets and
liabilities acquired are not yet available and are therefore
not disclosed at this stage.
■ O U T L O O K
Most of Fugro’s revenues derive from the oil and gas
industry. Such services are provided throughout the life
cycle of oil and gas fi elds and contribute 73% of annual
revenue. As a service provider, the price of oil, as such, has
no direct impact on Fugro’s income, but energy prices can
certainly affect the behaviour of Fugro’s clients with
regard to their investments. Investments for exploration
and new developments are driven by expectations
regarding future demand and the price of oil and gas.
With an improving economic situation in several regions
of the world, the demand for oil and gas is increasing,
which is also refl ected in the recovery of the price of oil
from below USD 40 per barrel (Brent) at the start of 2009
to over USD 90 per barrel in early 2011. The oil price
recently further infl ated due to the political turmoil in
North Africa and the Middle East.
According to external reports, global E&P investments are
expected to have increased by around 11% in the year
2010. Further increases of 12-15% are projected for 2011,
bringing the global total investment budgets to a record
high of USD 490 billion. These projections are based on an
expected average oil price of USD 77 per barrel (Brent) for
2011. The average oil price was USD 58 in 2009 and USD 70
in 2010. The indications are that NOCs (National Oil
Companies) will continue their high level of investment
and that, in particular, the large international oil
companies will increase their expenditure in 2011.
Worldwide, the decrease in production from existing
fi elds through depletion is 6 to 8% annually. This means
that even without growth in demand, there is a conti-
nuous need for exploration and new developments.
The investment horizon is an important issue and must
take account of the fact that for new larger offshore oil
and gas fi elds, the time that passes between the decision
to develop a fi eld and the actual start of production is
several years. Considering the lead time required to put

34
B o a r d o f M a n a ge m e n t d e c l a r a t i o n p u r s u a n t
t o a r t i c l e 5 : 2 5 c o f t h e F i n a n c i a l M a r ke t s
S u p e r v i s i o n A c t i n t h e N e t h e r l a n d s
To the best of the Board of Management’s knowledge the
annual accounts (pages 88 to 175) give a true and fair view
of the assets, liabilities, fi nancial position and profi t or
loss of Fugro N.V. and the companies included jointly in
the consolidation, and the annual report gives a true and
fair view of the situation on the balance sheet date and
the business development during the fi nancial year of
Fugro N.V. and the Group companies for which the
fi nancial information is recognised in its annual
accounts. The principal risks and uncertainties with
which Fugro N.V. is confronted, are described in this
annual report.
Leidschendam, 9 March 2011
K.S. Wester, President and Chief Executive Offi cer
A. Jonkman, Chief Financial Offi cer
P. van Riel, Director
J. Rüegg, Director
A. Steenbakker, Director
In 2010 Fugro benefi ted from the cost reduction measures
taken in 2009 and several measures will continue to
control cost such as:
• restrictions on new investments, unless profi table in
the short term or strategically important;
• fl exibility in hired capacity, such as chartered vessels
and freelance staff;
• further optimisation of operational effi ciency.
As the recovery of the world economy seems to gain
further momentum, the sectors on which Fugro focuses,
particularly energy, construction, transport, minerals and
water, should offer good opportunities for further growth.
The expansion and broadening of activities through
acquisitions will also remain part of the strategy. More
realistic company valuations than have been the case in
some sectors in recent years, may enhance these
opportunities.
Fugro is expecting a gradual further improvement in a
number of market sectors in which it is active. This is
supported by good tender activity in several sectors and an
improving backlog compared to the situation a year ago.
Nevertheless, a tighter pricing environment is likely to
linger on for a while in sectors like marine seismic. The
relatively harsh winter in the northern hemisphere has
also delayed onshore construction related work in some
countries, such as the USA.
Revenues began to increase in the second half of 2010,
resulting in the highest revenue on a half year basis so
far achieved by Fugro in such period. Partly on basis of
this, further growth in revenue is expected for 2011 in
comparison to the previous year. It looks that demand
for our services will gradually further recover in the
course of the year. This will create room to optimise
utilisation of available capacity and possibly some
price recovery in sectors under pressure.
In view of the uncertainties and volatility in market
developments and given the short-term nature of a
number of our projects, as in previous years, we will fi rst
publish a quantitative forecast for the entire year in
August 2011, at the time of the publication of the 2011
half-yearly report.

35Report of the Board of Management

36
A Remotely Operated Crawler (ROC) being deployed for
subsea inspection to locate, track and perform inspections
of submarine cables, pipelines and other structures,
North Sea.
• Alaska – Fugro-Geoteam successfully completed a large 3D survey, offshore Alaska in the Chukchi Sea. The project
was conducted for Statoil E&P USA Inc. by the ‘‘M/V Geo Celtic’’ during the relatively brief ice-free season and
resulted in the recording of data over 2,600 square kilometres in 40 days. This high level of production combined
with minimal loss of time, zero infi ll and no environmental incidents, was the result of extensive planning and
close-cooperation between all parties. Fugro’s personnel and facilities located in Anchorage provided local
support.
• Australia – Fugro Seacore was awarded a contract that involves specialist drilling and marine support services to
the John Holland Group as part of their contract to construct a 1.4 km long access jetty and wharf which forms
part of the early works for the construction of an iron ore terminal at Cape Lambert, Australia for Rio Tinto. The
contract, which has a value of USD 20 million to Fugro, involves providing assistance to install 300 piles,
deploying one of Fugro’s self elevating platforms.
• Brazil – Fugro Brasil was awarded a long term diving contract by Otto Candies for Petrobras in Brazil. The contract
has a value for Fugro of approximately USD 100 million, involving ROV and diving services. Otto Candies is
providing the diving support vessel and the contract will be managed jointly. It is a 5-year contract with an
additional 5-year option, with operations commencing mid 2011. The vessel will be engaged in Inspection Repair
and Maintenance (IRM) activities along the Brazilian coast.
• Brazil – In partnership with vessel owners Greatship and Farstad, Fugro Brasil has been awarded 3 long-term
contracts for ROV support vessels by Petrobras. The value of the contracts for Fugro is approximately USD 140
million and will involve ROV services and positioning. Greatship will be providing the vessels Greatship Rohini
and Greatship Ramya and Farstad will be providing the vessel Far Scotia. The contract is for fi ve years, with an
option for an additional 5 years and the operations will commence early 2011.
• India – The state owned Oil and National Gas Corporation Limited (ONGC) awarded Fugro a contract for acoustic
inspection of all subsea pipelines in the West Coast of India offshore Mumbai. The project comprises inspection
of some 5,400 km of pipelines and has a value of some EUR 5 million.
• Japan – Fugro Seacore was awarded a contract to provide a marine drill coring system to the Japan Oil, Gas and
Metals National Corporation (JOGMEC), for installation on their new marine survey vessel as part of their
research investigations of seabed resources. The marine drilling system will be designed and built at Fugro
Seacore’s facilities in Cornwall, United Kingdom. Fugro expects the value of the contract to exceed USD 30
million.
• Mexico – Pemex awarded Fugro, in cooperation with Constructora Subacuatica Diavaz, S.A. de C.V., a geophysical
and geotechnical site investigation project in deep water. The project also requires the deployment of one of
Fugro’s AUVs. The contract value is about USD 26 million.
■ I M P O R TA N T A N D I N T E R E S T I N G C O N T R A C T S

37Report of the Board of Management
• Sierra Leone – African Minerals UK ltd. awarded a contract to Fugro for site investigation related to the
development of Freetown Port in Sierra Leone. The project comprises near shore and onshore geotechnical
surveys and geotechnical laboratory testing associated with the development of the Tonkolili iron ore deposit
near Freetown. The contract value is about USD 5 million.
• United States – The California, Oklahoma and New York Departments of Transportation have each awarded
multi-year pavement data collection and analysis projects to Fugro Roadware. The three contracts represent
collection of over 124,000 miles of data and have a total value of over USD 10 million.
• United States – Fugro LADS, has been selected by the National Oceanic and Atmospheric Administration (NOAA)
to provide Light Detection and Ranging (LiDAR) hydrographic survey services to support nautical charting and
related products anywhere in the United States. The contract was awarded for a three year period, and has a
maximum value of USD 30 million. The contract involves acquiring bathymetric and near-shore topographic
LiDAR data that will be delivered to NOAA for use in nautical charts and associated hydrographic products.
• United States – Fugro Roadware has been awarded a contract with the State of Louisiana Department of
Transportation and Development, with a potential value of USD 20 million over six years. The initial task order is
for a network level pavement condition evaluation and videolog across 57,600 km of Louisiana roads, to be
completed by June 30, 2012. This task has a value of USD 6.2 million. The contract will provide the State of
Louisiana accurate and reliable information which enables them to strategically focus investment in road
maintenance and safety in the most effi cient manner.
■ R E C E N T LY A W A R D E D I M P O R TA N T A N D I N T E R E S T I N G C O N T R A C T S
• Brazil – Fugro Brasil, along with consortium partner IPEX, has been awarded a deep water drop coring project by
the (ANP) National Oil & Gas Agency for the Ceará Basin development plan in the north-east of Brazil, in order to
increase knowledge of the equatorial margin basins. The project, valued at approximately EUR 6 million, requires
satellite imagery acquisition, processing and interpretation; review of 3D seismic profi les; selection of
geochemical sampling stations; recovery of 1,000 drop cores in water depths up to 3,000 metres; laboratory
testing and interpretation. The total project duration is twelve months with fi eld work anticipated to take about
four months. This award follows similar campaigns previously completed for ANP in the Pernambuco/Paraíba,
Pelotas and Jacuípe basins as well as several other sampling projects for different clients.
• Norway – Interaction, which forms part of the Fugro group, has signed an agreement to supply OHM Rock Solid
Images (OHMRSI) with next generation marine electromagnetic processing and quality control software systems.
The software will be built upon Interaction’s existing ‘InPro’ system, but will include a number of new features
and functions specifi ed by OHMRSI. The agreement includes options for further sales and is meant to help
OHMRSI increase the effi ciency and quality of their data processing workfl ows. Interaction also provides software
and services for the management of marine electromagnetic data through their ‘InStore’ software product.
• Norway – Fugro GEOS has secured two large metocean (meteorological and oceanographic) measurement studies
for Statoil in the Norwegian and North Seas. These highlight the importance of accurate metocean data at the
design stage of development of offshore fi elds, and for life extension of existing fi elds. The fi rst contract is for a
fi ve year metocean measurement programme with associated routine data analyses for Statoil. Current profi le,
wave and seawater property data will be collected at fi ve offshore fi elds in the Northern North Sea: Kvitebjørn,
Oseberg Sør, Brage, Heimdal and Grane Fields. For the second contract, Fugro will be measuring a twelve month
current dataset at Dompap, Fossekall, Asterix and at several locations along the northern part of the Norwegian
Sea Gas Infrastructure (NSGI) pipeline. At these locations current measurements, also provided in real-time, will
support the planning of effective operations.

38
An emerging trend in the geotechnical markets is for
large clients to spend more effort on mitigating
construction and long term maintenance risks. As a result
they are increasingly letting larger and more complex
multi-disciplinary geotechnical projects. Being able to
win and execute such projects is a key element of Fugro’s
strategy in geotechnics. Accordingly, in 2010 a start has
been made to form larger regional entities that have the
resources to handle such large project opportunities. In
addition, specialty services in, for example, pile testing,
engineering geophysics and geomonitoring are being
globalised from their current more localised bases.
The offshore oil and gas market has continued in 2010 to
provide the basis for the success of offshore geotechnical
operations. Growth was concentrated in the areas of wind
farm development activity and global geo-consulting
markets.
The Macondo oil spill did not signifi cantly affect our
scheduled activities in the Gulf of Mexico, but there is still
some concern for the future over the permitting process
and the subsequent regional safety changes which will be
forced on clients.
Deepwater development and related services continued to
be buoyant in all regions. In 2010, deepwater projects were
conducted in all major global oil and gas provinces and,
based on external forecasts of expenditures for 2011, this
trend is expected to continue. A signifi cant portion of the
backlog for 2011 is related to deepwater development
projects.
The market for oil and gas projects in shallower water
showed differences on a regional basis. The market in the
Asia-Pacifi c region was weak in 2010 due to fewer projects
than normal. Markets elsewhere were steady.
■ G E OT E C H N I C A L D I V I S I O N
The Geotechnical division’s revenue increased by 24% to
EUR 664 million (2009: EUR 536 million). Results from
operating activities (EBIT) was EUR 104 million (2009: EUR
94 million) corresponding to 16% EBIT margin (2009: 18%).
In comparison to 2009, the division experienced good
revenue growth albeit with some reduction in margins.
This was primarily due to some start-up issues with a new
specialised geotechnical vessel, the Fugro Synergy, severe
winter weather early in the year and increased work
volumes in the wind farm market at lower margins.
In the onshore and near shore markets, the majority of
the work is related to large infrastructure, oil and gas,
energy, mining and water management projects.
Developments in these geotechnical markets largely
followed trends of the global economy. In the Asia-Pacifi c
region the geotechnical markets picked up, led by a strong
recovery in Hong Kong on the back of major spending on
large infrastructure projects. In the Middle East local
differences from country to country continued to exist,
but generally the market in this region was good in 2010.
Thanks to coordinated efforts throughout this region
Fugro was able to capitalise on opportunities while
optimising the utilisation of regional resources,
equipment and personnel. In Europe we anticipated a
tough year and pre-emptive steps were taken to ensure the
region contributed positively to the results. In Africa, the
operation in Nigeria benefi ted from some political
stabilisation in the Niger Delta. In addition, near shore/
onshore multi-discipline projects were carried out in
some other African countries. In North America the
organisational structure was streamlined in support of
further growth and good results were achieved. The South
American operations are concentrated in Brazil where
revenues showed rapid growth, with room for further
improvement of the results.
Key f i g u r e s G e o t e c h n i c a l (amounts x EUR 1 mln.) 2010 2009 2008 2007 2006
Revenue 664 536 541 443 371
Results from operating activities (EBIT) 104 94 95 78 58
Average invested capital 447 358 254 173 129
Depreciation of tangible fi xed assets 35 29 24 19 14
Results from operating activities (EBIT)
as a % of revenue 16 18 18 18 16

39Report of the Board of Management
SMARTSURF fi eld trials from vessel Bavenit,
offshore Flushing, the Netherlands.
As in 2009, offshore wind farm work supplemented the
mainstay oil and gas work. In 2010 we experienced more
competition in shallow water work which has resulted in
lower margins in this segment. This was partially
compensated by a larger work volume.
In terms of development, a key objective in 2010 was to
introduce the Fugro Synergy in the well services market,
which has taken more time than originally planned.
However, in the second half-year the vessel performed well
on two complex projects offshore South Korea and
Australia.
In 2010 two acquisitions were completed.
ERT (Scotland) Ltd. (United Kingdom) provides services to
the global oil and gas, renewable energy and other
industries. It conducts survey, monitoring, consulting and
reporting activities supported by in-house chemical and
biological laboratories.
Geo Pannon Kft and related company Statnamic Kft
(Hungary) are service providers in the fi eld of onshore
geotechnical services. With these acquisitions the
position in Cental and South East Europe has been
strengthened.

40
applications that require sound knowledge of the marine
environment. Offshore Survey had a good year in spite of
the continued uncertainty in its primary industry.
The traditional Offshore Survey activities started
somewhat slowly following 2009’s global fi nancial crisis,
but soon made up for lost ground. The oil and gas business
was dominated by the Macondo well accident in April,
which raised uncertainty in the industry for most of the
year and in some cases, prevails to this day. The impact for
Offshore Survey turned out to be negligible thanks to a
broad range of business segments covered on a global
scale. With the tightening of oil company’s budgets it was,
however, noticeable that price pressures on part of
services tendered continued. Vessel utilisation across the
globe turned out to be strong as did the Autonomous
Underwater Vehicle (AUV) fl eet employed primarily in
deep water developments.
The Subsea Services business performance varied around
the world and between market sectors. A hiatus in the
approval of offshore construction contracts in 2009 had
an impact on the construction support market resulting
in a shortage of new projects starting up in 2010. This had
the effect of increasing the seasonality of activities with
lower activity in the northern hemisphere winter seasons
in particular. On the other hand there was a modest
recovery in drill support activities compared to 2009 and
inspection, repair and maintenance work held up well.
Brazil achieved a strong performance but Europe and
Africa fell behind expectations. Middle East showed a
signifi cant improvement towards the end of the year after
a slow start, but the Asia Pacifi c operations had a diffi cult
year. For the fi rst part of the year in particular, ROV
investments were concentrated on fl eet upgrades and
improvements with only a modest expansion. In the latter
part of the year, a new build programme was started to
bring systems to the market for anticipated growth,
especially in Brazil. Construction of the new vessel Fugro
Symphony is in progress and it will be delivered in May
■ S U R V E Y D I V I S I O N
In the year under review the revenue of the Survey
division increased by 5% to EUR 1,009 million (2009: EUR
956 million). The result from operating activities (EBIT)
amounted to EUR 228 million (2009: EUR 246 million)
equating to an EBIT margin of 23% (2009: 26%).
The Survey division’s activities are largely dominated by
the oil and gas industry, and the oil price and the
prevailing investment climate are therefore key factors in
the business. Much of the division’s activities are related
to work offshore, increasingly in deep water, as well as
subsea services and intervention in support of the
development of natural resources. The geospatial segment
concentrates primarily on land and airborne surveys
principally driven by government and infrastructure
developments, but also includes an oil and gas related
component.
Offshore Survey operates predominantly in the
hydrocarbon resource industry with a small percentage of
its activities in the telecommunication, the wind farm
(renewables) and hydrographic charting markets. Broadly,
the business line specialises in offshore and near shore
survey solutions. A fi rm basis for all activities is the Fugro
network of Global Positioning System (GPS) reference
stations operated globally, forming the nucleus of
positioning needed for survey activities, at sea, as well as
on land and in the air. Safe and successful offshore
construction operations for fi eld developments, as well as
pure exploration, rely on precise and reliable data
concerning surface and subsurface locations. These are
provided through detailed geophysical surveys and
assessments, increasingly in collaboration with the
Geotechnical division, offering coherent site assessments
to industry. Coupled with these services, meteorological
and oceanographic studies form an integral part. Using
the expertise gained in the oil and gas business, Offshore
Survey is using its knowledge in a variety of other
Key f i g u r e s S u r vey (amounts x EUR 1 mln.) 2010 2009 2008 2007 2006
Revenue 1,009 956 960 852 709
Results from operating activities (EBIT) 228 246 235 205 146
Average invested capital 710 578 497 423 332
Depreciation of tangible fi xed assets 51 49 43 37 29
Results from operating activities (EBIT)
as a % of revenue 23 26 24 24 21

41Report of the Board of Management
Offshore survey vessel Fugro Galaxy launched in Bremen,
Germany.
Two aerial mapping companies, Interra S.A. in Chile and
its sister company Terralaser S.A. in Peru, were acquired by
Fugro. These acquisitions provide a stepping stone into
the South American market for all geospatial services,
notably in the mining, energy and infrastructure sectors.
At the end of the year Fugro acquired Riise Underwater
Engineering AS (RUE), based in Norway, a provider of
subsea engineering, ROV and diving services offshore and
inshore to the oil and gas industry. The company operates
two specially designed vessels in West Africa and one
inshore vessel in Norway with both work class and
observation class ROVs and a number of modular diving
systems.
In Canada the remaining 30% minority interest in Fugro
Jacques GeoSurveys Inc. was acquired. The company will
be renamed to Fugro GeoSurveys Inc. and offers services
for marine survey and geotechnical projects.
2011. In advance of that, the oldest (chartered) North Sea
based vessel was demobilised at the end of 2010 during
the winter lull.
Subsea Services also operates predominantly in the oil
and gas market providing a wide range of subsea services
using a comprehensive fl eet of ROVs and specialist ROV
support vessels. Subsea market sectors covered are
inspection, repair and maintenance of subsea structures,
support of construction activities and support of
hydrocarbon drilling operations. As with Offshore Survey,
there has been an increase in activity in support of
offshore wind farm installations. The services are
supported by extensive in-house engineering capabilities
which include provision and use of advanced engineering
simulation technology.
Geospatial Services provides terrestrial (ground based)
survey services and a range of airborne mapping
solutions. The portfolio of services includes satellite based
remote sensing capabilities using imagery from third
party satellite operators. While much of Fugro’s
Geospatial business is project-based data acquisition and
fi eld services, the provision of valued added geospatial
solutions is a rapidly expanding market sector and a
growth opportunity for Fugro as well.
In general, market conditions for Geospatial Services were
challenging throughout 2010 and particularly so in
Northwest Europe. Spending on general mapping
services, engineering and infrastructure projects was
adversely impacted by the global economic downturn,
with project cancellations and cutbacks in both the
public and private sectors. In Australia, the survey
business benefi ted from a number of contract awards in
the resource and infrastructure sectors and the outlook
for the business in Australia remains good. Activity levels
in the Middle East also started to recover in 2010.
Furthermore, Fugro’s Geospatial companies in the USA
did benefi t from stimulus spending by the federal
government which included a major coastal mapping
project along the West coast, both on- and offshore.
Furthermore an increasingly amount of survey work is
carried out for shale gas projests in Texas and Louisiana.
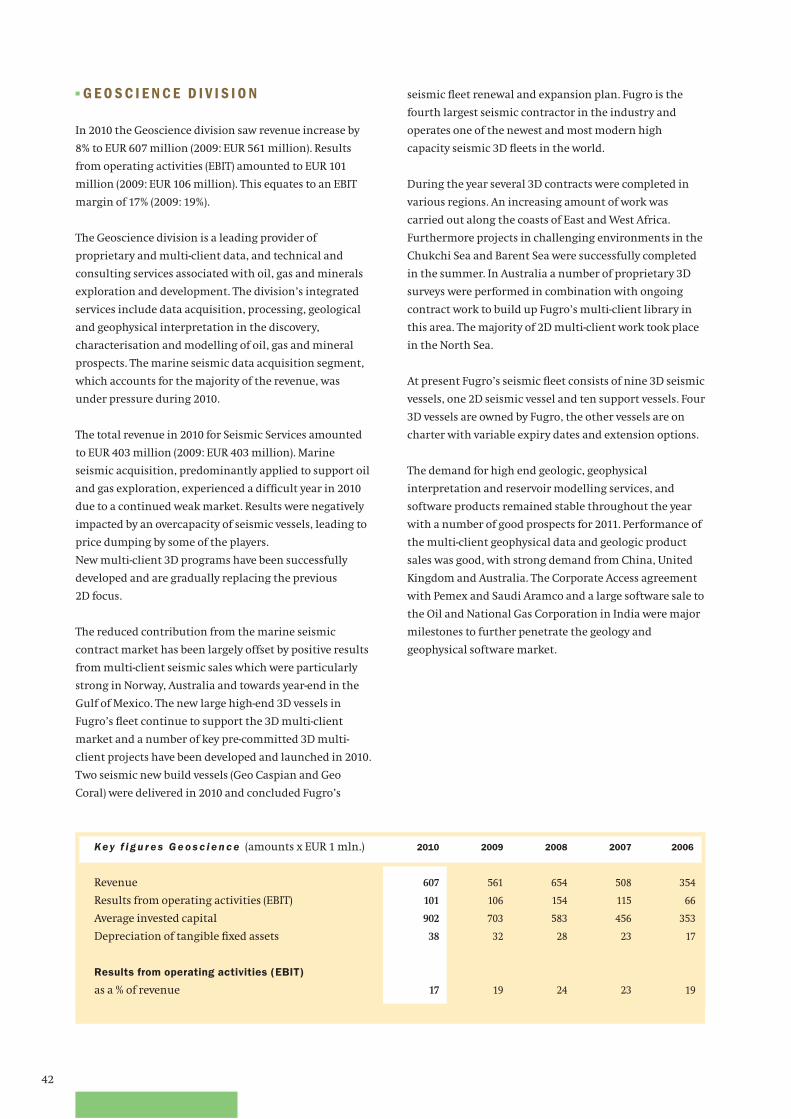
42
seismic fl eet renewal and expansion plan. Fugro is the
fourth largest seismic contractor in the industry and
operates one of the newest and most modern high
capacity seismic 3D fl eets in the world.
During the year several 3D contracts were completed in
various regions. An increasing amount of work was
carried out along the coasts of East and West Africa.
Furthermore projects in challenging environments in the
Chukchi Sea and Barent Sea were successfully completed
in the summer. In Australia a number of proprietary 3D
surveys were performed in combination with ongoing
contract work to build up Fugro’s multi-client library in
this area. The majority of 2D multi-client work took place
in the North Sea.
At present Fugro’s seismic fl eet consists of nine 3D seismic
vessels, one 2D seismic vessel and ten support vessels. Four
3D vessels are owned by Fugro, the other vessels are on
charter with variable expiry dates and extension options.
The demand for high end geologic, geophysical
interpretation and reservoir modelling services, and
software products remained stable throughout the year
with a number of good prospects for 2011. Performance of
the multi-client geophysical data and geologic product
sales was good, with strong demand from China, United
Kingdom and Australia. The Corporate Access agreement
with Pemex and Saudi Aramco and a large software sale to
the Oil and National Gas Corporation in India were major
milestones to further penetrate the geology and
geophysical software market.
■ G E O S C I E N C E D I V I S I O N
In 2010 the Geoscience division saw revenue increase by
8% to EUR 607 million (2009: EUR 561 million). Results
from operating activities (EBIT) amounted to EUR 101
million (2009: EUR 106 million). This equates to an EBIT
margin of 17% (2009: 19%).
The Geoscience division is a leading provider of
proprietary and multi-client data, and technical and
consulting services associated with oil, gas and minerals
exploration and development. The division’s integrated
services include data acquisition, processing, geological
and geophysical interpretation in the discovery,
characterisation and modelling of oil, gas and mineral
prospects. The marine seismic data acquisition segment,
which accounts for the majority of the revenue, was
under pressure during 2010.
The total revenue in 2010 for Seismic Services amounted
to EUR 403 million (2009: EUR 403 million). Marine
seismic acquisition, predominantly applied to support oil
and gas exploration, experienced a diffi cult year in 2010
due to a continued weak market. Results were negatively
impacted by an overcapacity of seismic vessels, leading to
price dumping by some of the players.
New multi-client 3D programs have been successfully
developed and are gradually replacing the previous
2D focus.
The reduced contribution from the marine seismic
contract market has been largely offset by positive results
from multi-client seismic sales which were particularly
strong in Norway, Australia and towards year-end in the
Gulf of Mexico. The new large high-end 3D vessels in
Fugro’s fl eet continue to support the 3D multi-client
market and a number of key pre-committed 3D multi-
client projects have been developed and launched in 2010.
Two seismic new build vessels (Geo Caspian and Geo
Coral) were delivered in 2010 and concluded Fugro’s
Key f i g u r e s G e o s c i e n c e (amounts x EUR 1 mln.) 2010 2009 2008 2007 2006
Revenue 607 561 654 508 354
Results from operating activities (EBIT) 101 106 154 115 66
Average invested capital 902 703 583 456 353
Depreciation of tangible fi xed assets 38 32 28 23 17
Results from operating activities (EBIT)
as a % of revenue 17 19 24 23 19

43Report of the Board of Management
Geo Celtic in operation on the Eendracht 3D multi-client
survey in the Carnarvon Basin, Australia.
The market for General Geophysical Services recovered
somewhat from the lows of 2009. Demand was well
distributed across all major client groups: oil and gas,
mining and government.
Although major commodity prices recovered through the
year, exploration activity for mining did not reach pre-
fi nancial crisis levels due to continued tightness in capital
markets. In some parts of the world there were
encouraging signs of a return to capital availability for
mining exploration, but it is expected this will be subject
to some volatility in the future depending on the macro-
economic outlook. Demand for services covered the whole
spectrum of techniques offered and utilisation of the
aircraft fl eet was generally good.
The year was used for consolidation and improvement of
operational effi ciency. As part of this effort, new aircraft
to upgrade the fl eet commenced operations. The
cooperation for marine electromagnetic work with EMGS,
resulted in the fi rst surveys carried out under the
partnership.

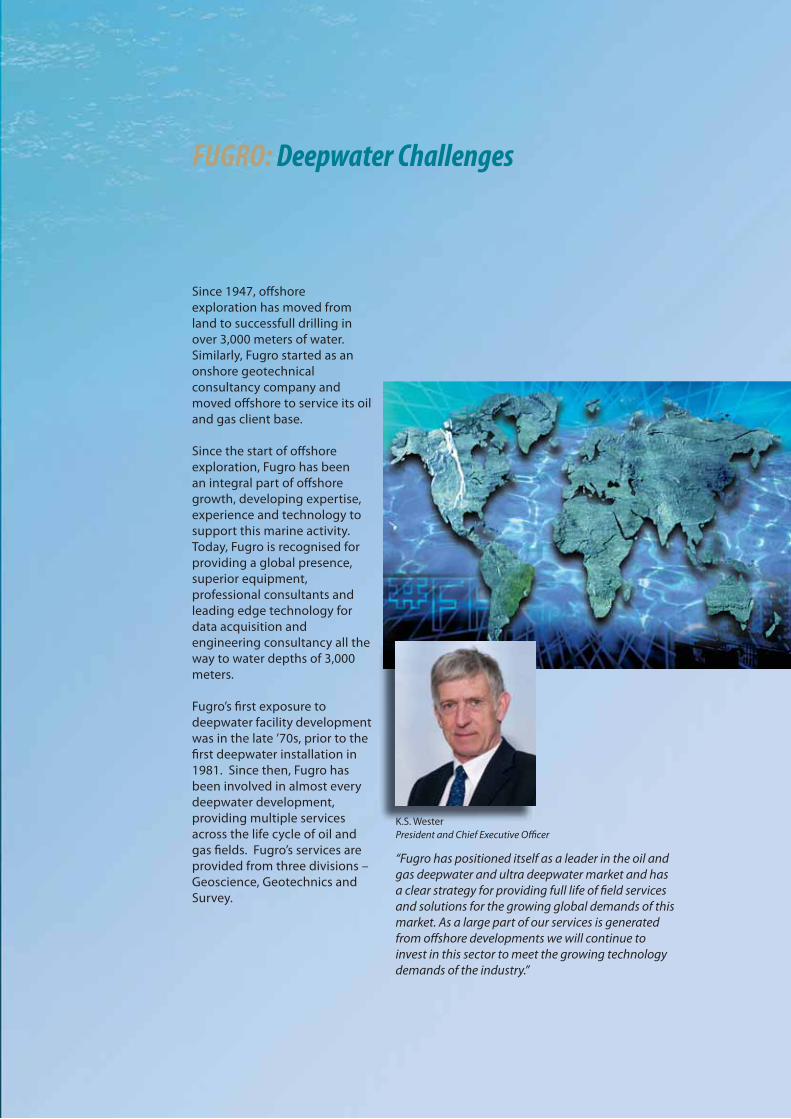
FUGRO: Deepwater Challenges
Since 1947, off shore
exploration has moved from
land to successfull drilling in
over 3,000 meters of water.
Similarly, Fugro started as an
onshore geotechnical
consultancy company and
moved off shore to service its oil
and gas client base.
Since the start of off shore
exploration, Fugro has been
an integral part of off shore
growth, developing expertise,
experience and technology to
support this marine activity.
Today, Fugro is recognised for
providing a global presence,
superior equipment,
professional consultants and
leading edge technology for
data acquisition and
engineering consultancy all the
way to water depths of 3,000
meters.
Fugro’s fi rst exposure to
deepwater facility development
was in the late ’70s, prior to the
fi rst deepwater installation in
1981. Since then, Fugro has
been involved in almost every
deepwater development,
providing multiple services
across the life cycle of oil and
gas fi elds. Fugro’s services are
provided from three divisions –
Geoscience, Geotechnics and
Survey.
“Fugro has positioned itself as a leader in the oil and gas deepwater and ultra deepwater market and has a clear strategy for providing full life of fi eld services and solutions for the growing global demands of this market. As a large part of our services is generated from off shore developments we will continue to invest in this sector to meet the growing technology demands of the industry.”
K.S. Wester
President and Chief Executive Offi cer

42b
Seventy-three percent of Fugro’s
revenues are generated from
off shore projects and activities
and the company has a clear
strategy for this market,
providing unique services and
solutions to each client. Every
client has diff erent needs and
each project has its own
characteristics. That is why
Fugro has multi-disciplinary
professionals in three operating
segments to provide multi-
discipline solutions for our
clients.
Fugro’s Geoscience division
collects, processes, interprets,
manages and stores geophysical
and geological data. A broad
range of geophysical data sets
are collected, including marine
seismic, gravity, magnetics and
electromagnetics for deepwater
basins all over the world.
The Geotechnical division
provides data on the
engineering properties and
geological characteristics of the
seabed for design and
construction of off shore oil and
gas installations.
The Survey division’s off shore
services include precise
positioning, hazard and
pipeline/cable route surveys,
construction support and
metocean studies. Subsea
services include a fl eet of
remotely operated vehicles
(ROVs) to support subsea
inspection, construction and
drilling.
Integrated Deepwater Solutions
2b
1
2a
4
3
1. Seismic vessel Geo Celtic 2a. and 2b. Perdido fold belt (Gulf of Mexico) in water
depths of up to 3,000 meters 3. A 3D Reservoir model 4. ROV 5. Deepwater
structure 6. AUV 7. Geoscientists checking deepwater geohazards data
8. Pipelaying monitoring 9. Multi purpose drilling vessel Fugro Synergy

9
6
8
9
5
The off shore waters of the Gulf of Mexico, Brazil and West
Africa are considered the “golden triangle” of deepwater
developments and generate the majority of the
worldwide deepwater exploration and production
opportunities. Fugro has offi ces, equipment and
resources in each of these regions.
The “Golden Triangle” encompasses signifi cant new
ultra deepwater developments, which have become a
growing proportion of the off shore oil and gas reserves.
Oil companies continue to explore in frontier areas in
these regions and are successful with signifi cant
discoveries.
The Golden Triangle
7

The challenging deepwater
environment off ers tremendous
upside opportunities but also an
equally large variety of
technological challenges and
risks. The fi rst Fugro group to
identify these opportunities and
risks is the Geoscience Division
which delivers integrated
exploration solutions for
deepwater provinces on every
continent.
Fugro acquires, processes and
interprets seismic, gravity and
magnetic data sets and also
off ers marine electro-magnetic
services. The industry-leading
multi-client geologic product
Tellus™ provides detailed, off -the
shelf, critical geologic
information for more than 300
basins around the world.
Fugro Jason software and
services enable clients to
understand reservoir geometry
for drilling, as well as to
understand the behaviour of the
reservoir during production.
Fugro’s well-site services,
including bio-steering and
Mag-CUBE™, provide
geophysical and geologic
solutions, enabling clients to drill
wells accurately and steer the
well while drilling. Fugro
provides long-term storage
facilities, as well as data
enhancement services, for all of
the rock, paper documents and
digital information generated.
Deepwater Exploration Advances
Present day
50 million
years ago
125 million
years ago
1
1. Streamer deployment 2. Reconstruction of ancient plate confi gurations
3. Deepwater structure data 4. Marine seismic equipment in operation
5. Processing seismic data
2

Many studies have been undertaken to better understand
the nature of the area beneath the salt canopy in the Gulf
of Mexico and its potential for hydrocarbons. For
deepwater, using seismic imaging alone to understand the
makeup of this sub-salt area remains a barrier to its
geologic interpretation and subsequent exploration. In
the Keathley Canyon and Walker Ridge sub-salt areas,
Fugro provided a multi-disciplined, integrated approach to
solving this imaging issue.
Fugro generated seismic data from a 10-km off set seismic
survey which was calibrated with Fugro aeromagnetic and
marine gravity data. The fi nal result was an integrated
basement model created by incorporating seismic,
magnetic and gravity data elements.
The models are being used to examine and test various
hypotheses, such as the location of the continental and
oceanic crust boundary, presence of the original salt
bodies and regional-to-local variation in area density and
susceptibility. Multi-discipline results provide a better
understanding of potential geologic targets in areas which
at one time were diffi cult to explore and develop.
Gulf of Mexico
CASE STUDY:
3
4
5
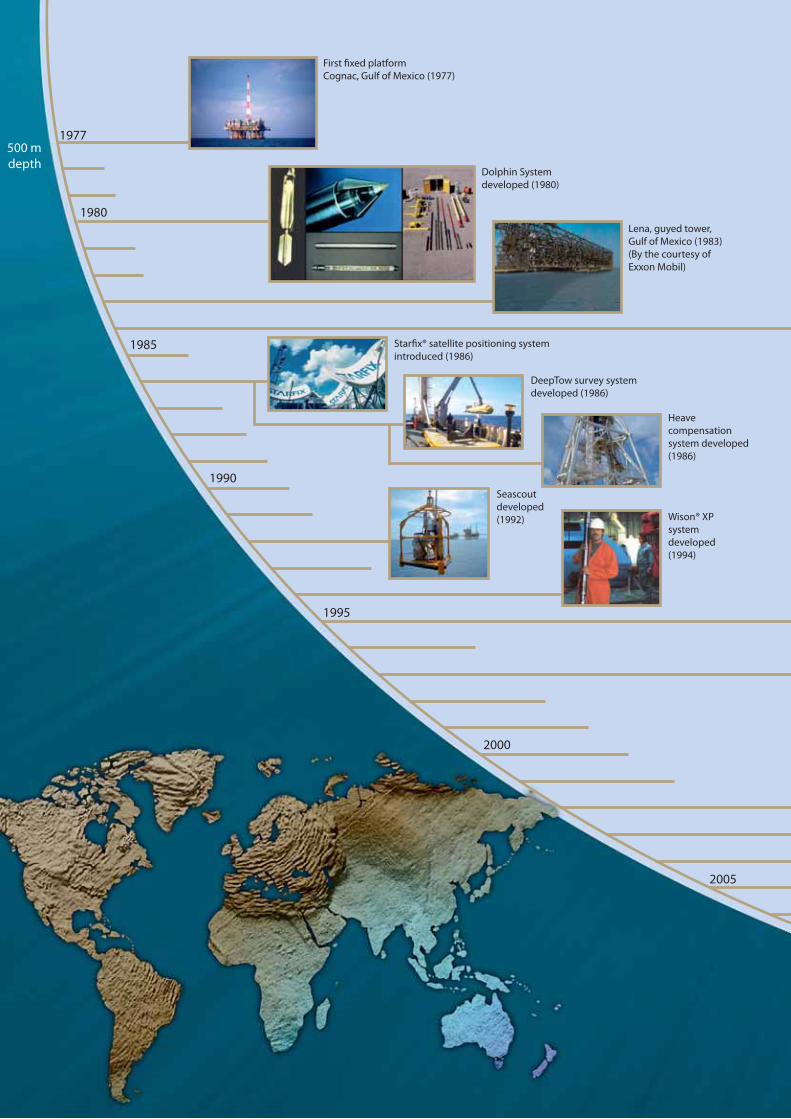
1977
1980
1985
1990
500 m
depth
2000
2005
1995
First fi xed platform
Cognac, Gulf of Mexico (1977)
Dolphin System
developed (1980)
Starfi x® satellite positioning system
introduced (1986)
DeepTow survey system
developed (1986)
Heave
compensation
system developed
(1986)
Seascout
developed
(1992) Wison® XP
system
developed
(1994)
Lena, guyed tower,
Gulf of Mexico (1983)
(By the courtesy of
Exxon Mobil)

3,000 m
depth
3,000 m
depth
2010
3D Seismic fi rst used
for GeoHazards (1995)
Pressure corer system
developed (2002)
Autonomous Underwater Vehicle
(AUV) introduced (2003)
Starfi xMoor®
introduced (2005)
Smartpipe®
developed (2006)
Optima risers management
introduced (2008)
First tension leg platform (TLP)
Hutton, UK North Sea (1984)
First SPAR- Classic Neptune
Gulf of Mexico (1997)
Wheeldrive CPT system
developed (1984)
Mud pressure and memory unit
developed (1984)
FUGRO Technological Deepwater Advances
As drilling has accelerated into
ultra deepwater, the
technological advances needed
to drill and produce in this
challenging environment has
been a learning process. Fugro
has been a major player in this
technological shift since the
beginning and continues to
develop new technology for
the future.

Deepwater Site Development
The term “integrated studies” fi rst
gained prominence in the
off shore oil and gas industry
following the loss of several
platforms in the Gulf of Mexico
during Hurricane Camille in 1969
when it was discovered that
these facilities were not lost to
wind and waves, but, rather, the
platforms were swept away by
huge, massive mudslides.
Thus, future designs for
structures in mudslide-prone
areas and deeper waters
required a broader scope for site
investigations that included the
integration of high-resolution
geophysical survey information,
geotechnical borings and in-situ
soil data collected over the
potential area of infl uence rather
than just the immediate platform
site.
The number and types of data
sets expanded beyond
geophysical and geotechnical
data to also include metocean
data, geochemical data,
biological and environmental
data and other previously
collected data of various types.
Considering the overall cost of a
facility and the data required to
properly assess the drilling and
production risks, collection and
integration of this data is vitally
important. Fugro is the leader in
providing these site investigation
services.
1
2
3
1. Geophysical survey with AUV 2. Surface data in 2D 3. Metocean data
4. Environmental image 5. Geotechnical vessel Fugro Explorer
6. Analysing geotechnical cores 7. Positioning deepwater rig 8. Soil testing
4

Since 2003, Fugro has played an integral role in the
develop ment of Angola Blocks 18 & 31 for BP – as a
meteorological/oceanographic and geological/
geotechnical consultant, a key player on the project’s
integrated geohazard assessment team (GAT) and as a site
investigation contractor.
Meteorological and oceanographic (Metocean) studies
supported initial exploration drilling and deepwater
development for both blocks. A full year of current profi le
data was collected for Block 18. The Metocean data is used
to develop the design criteria for the production facilities.
The geohazards on these deepwater sites were identifi ed,
mapped and managed through a ground model approach.
Established at the earliest stage using seismic data, the
ground model was refi ned and calibrated through a series
of data collection programmes for high resolution
geophysical data, geological information and geotechnical
properties of the foundation soils. This information forms
the basis for the location and design of the facilities.
West Africa
CASE STUDY:
5
6
7
8

3
Fugro’s deepwater construction
support and maintenance
services include marine
installation, construction and
maintenance activities across
the entire life of the fi eld.
Fugro provides precise
positioning, survey support and
monitoring during the tow-out
of off shore structures and
pre-fabricated pipeline bundles;
the installation of platforms and
jackets; the placement of subsea
infrastructure and the trenching
of pipelines and cables.
During the life of the fi eld, Fugro
provides inspection and
maintenance of the platforms,
pipelines and loading facilities
to ensure any underwater
repairs can be done with
minimal eff ect on the fi eld
production.
With a world-class fl eet of
remotely operated vehicles
(ROVs) and highly trained and
respected technicians and
engineers, Fugro provides
ground-breaking technology in
underwater acoustic positioning
and in ROV control and
metrology. In eff ect, Fugro can
fulfi l all requirements from
installation through
decommissioning.
Deepwater Construction Support & IRM (Inspection, Repair & Maintenance)
1
2
3
1. ROV 2. ROV operator in control room 3. Underwater acoustic positioning set up
4. Support vessel Fugro Saltire 5. AUV post installation survey 6. Pin pile installation
7. Deep water installation using Side Scan Sonar 8. Off shore structure installation
9. Inspection with ROV
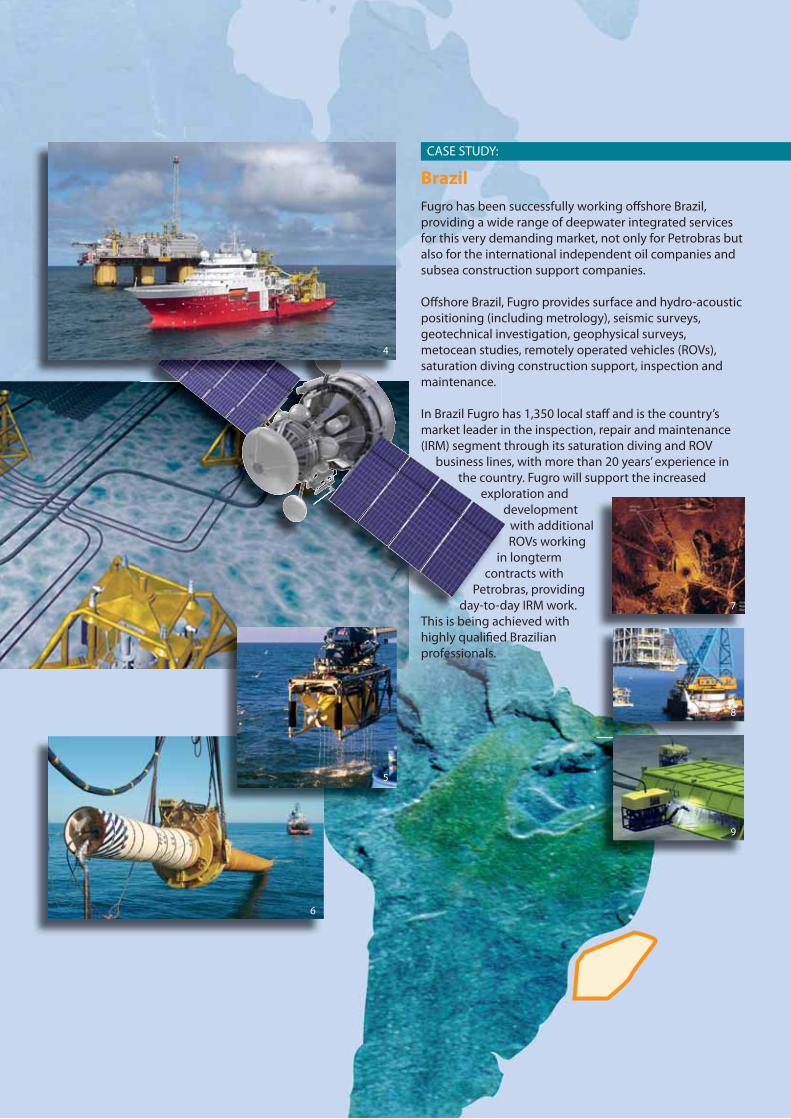
Fugro has been successfully working off shore Brazil,
providing a wide range of deepwater integrated services
for this very demanding market, not only for Petrobras but
also for the international independent oil companies and
subsea construction support companies.
Off shore Brazil, Fugro provides surface and hydro-acoustic
positioning (including metrology), seismic surveys,
geotechnical investigation, geophysical surveys,
metocean studies, remotely operated vehicles (ROVs),
saturation diving construction support, inspection and
maintenance.
In Brazil Fugro has 1,350 local staff and is the country’s
market leader in the inspection, repair and maintenance
(IRM) segment through its saturation diving and ROV
business lines, with more than 20 years’ experience in
the country. Fugro will support the increased
exploration and
development
with additional
ROVs working
in longterm
contracts with
Petrobras, providing
day-to-day IRM work.
This is being achieved with
highly qualifi ed Brazilian
professionals.
Brazil
CASE STUDY:
6
5
4
8
7
9
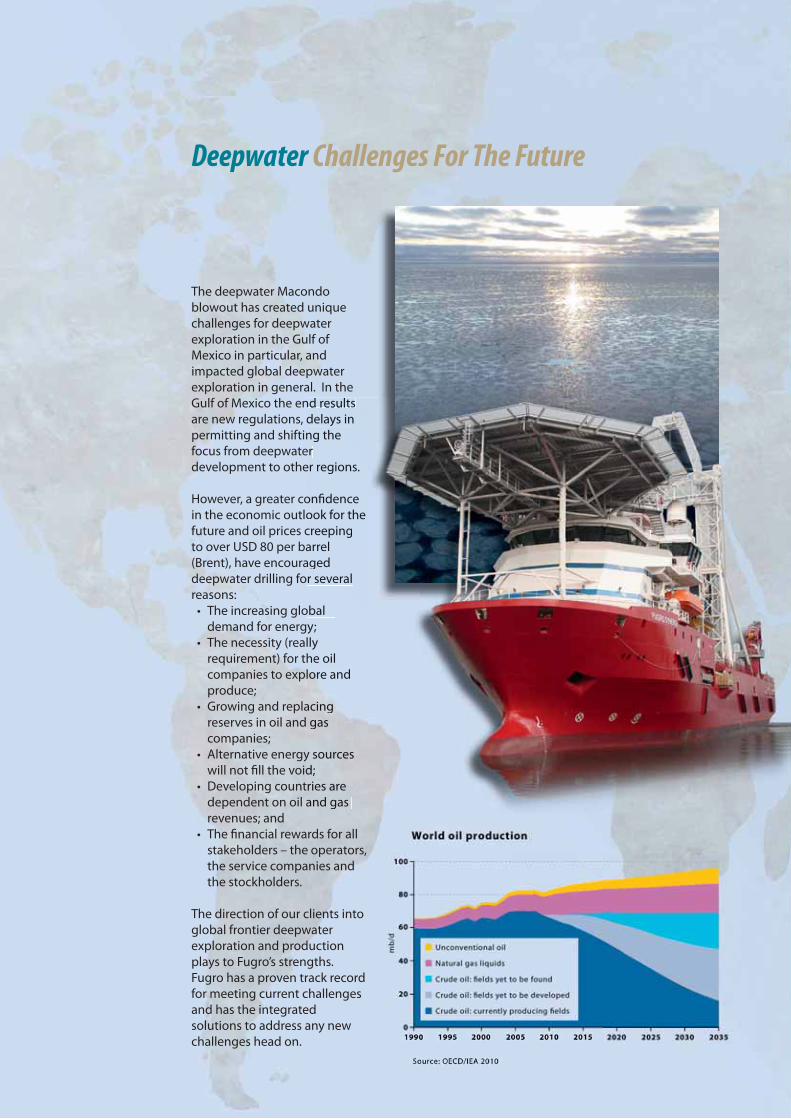
The deepwater Macondo
blowout has created unique
challenges for deepwater
exploration in the Gulf of
Mexico in particular, and
impacted global deepwater
exploration in general. In the
Gulf of Mexico the end results
are new regulations, delays in
permitting and shifting the
focus from deepwater
development to other regions.
However, a greater confi dence
in the economic outlook for the
future and oil prices creeping
to over USD 80 per barrel
(Brent), have encouraged
deepwater drilling for several
reasons:
• The increasing global
demand for energy;
• The necessity (really
requirement) for the oil
companies to explore and
produce;
• Growing and replacing
reserves in oil and gas
companies;
• Alternative energy sources
will not fi ll the void;
• Developing countries are
dependent on oil and gas
revenues; and
• The fi nancial rewards for all
stakeholders – the operators,
the service companies and
the stockholders.
The direction of our clients into
global frontier deepwater
exploration and production
plays to Fugro’s strengths.
Fugro has a proven track record
for meeting current challenges
and has the integrated
solutions to address any new
challenges head on.
Deepwater Challenges For The Future
nd results
delays in
ng the
er
er regions.
onfi dence
ook for the
creeping
arrel
aged
r several
obal
y;
lly
he oil
lllllororooo e and
acaccininninggg
ggasas
yyyyy s s s ssouououououououurcrcesess
d;d;d;d;d;dd
riririrriririesesesseseses a a a arerererere
ananannd d d dd gagagagaas ss sss
1

CapEx Breakdown Average Discovery Size (2005 - 2009)
Subsea Hardware 5%
Pipes & Risers 16%
Drilling 42%
Seismic 6%
Fixed Production Systems 15%
Floating Production Systems 16%
Source: Douglas Westwood Limited
150
175
125
100
50
25
0
Onshore
Source: IHS CERA
Shelf DeepwaterUltra
Deepwater
Mil
lion
Barre
ls of
Oil
Equiva
lent
75
30
40
20
10
70
80
60
50
0
2004
Source: Douglas Westwood Limited
2005 2006 2007 2008 2009 2010 2011 2012 2013
Dee
pwater
Ca
pEx
($
Bil
lion
)
20.1 25.8 33.8 44.8 48.7 47.6 46.3 55.0 63.2 73.0
25
30
35
40
20
15
10
5
45
0
2004
Source: Douglas Westwood Limited
2005 2006 2007 2008 2009 2010 2011 2012 2013
Dee
pwater
Op
Ex
($
Bil
lion
)
7.5 9.3 12.8 16.7 20.4 22.9 26.7 31.1 37.1 43.8
CapEx
OpEx

58
■ C o r p o r a t e S o c i a l R e s p o n s i b i l i t y
V i s i o n a n d a m b i t i o n
Fugro strives for strong but controlled growth in revenue
and net result. The organisation aims for an optimised
and balanced synergy between its various activities in
order to realise its goals while maintaining a broad
activity portfolio on a geographic and product basis.
Fugro aims to deliver improved added value to its clients
by a combination of specialised staff and technologies,
and associated high-quality services. In addition to growth
in revenue and net result, the organisation’s policies on
human resources, health, safety and the environment are
also of great importance. Sustainability, transparency and
reliability are the key themes of Fugro’s central policy.
It is realised that the impacts of Fugro’s specifi c local
activities and the international nature of its services place
great demands on its staff. The organisation is aware of its
role in society, particularly in an international and
multicultural environment, and understands the
importance of paying constant attention to corporate
social responsibility (CSR). Fugro strives to meet the
expectations of all the stakeholders in the company by
balancing regard for the environment, social awareness
and fi nancial results.
Resulting from a continuously developing CSR policy,
Fugro operating companies and employees put the
principles of CSR into daily practice in a wide range of
areas. Fugro’s CSR policy is inextricably linked with the
course of business and should, therefore, be considered
to be an integral part of other corporate aspects.
Fugro strives towards growth, both organically and
through acquisition. Geographical expansion is a
component of Fugro’s ability to continue to capitalise
on the world’s rising prosperity. Growth also means
attracting more local staff, and it enables the organisation
to offer opportunities for training and education to its
employees. The presence of local operating companies
and a focus on maximising local content is an important
spearhead for the integration of Fugro’s services within
communities in general.
The growing demand for energy is partly offset by the use
of alternative energy sources such as solar, wind, bio fuels,
tidal and nuclear energy. This presents Fugro with
opportunities in new markets. For instance in the North
Sea wind farm market, where Fugro is involved in
offshore geotechnical and offshore survey activities.
When managing its investments, the organisation
considers the balance between improving the quality of
its equipment and the issues of fuel use, emissions and
cost management. Good examples are the latest additions
to the seismic fl eet, the Geo Caspian and the Geo Coral,
which are designed in accordance with DNV ‘Clean Class’
standards.
Fugro aims to strengthen the coherence of its CSR policy
by providing a framework to its subsidiaries on how to
implement the various aspects of CSR. This framework
will be based on the ISO 26000 guidance standard on
corporate social responsibility, which was published in
November 2010.

59Corporate Social Responsibility
O r ga n i s a t i o n a l s t r u c t u r e
The organisation is divided into three divisions:
Geotechnical, Survey and Geoscience. These divisions
work together worldwide in focusing on the right
solution for the relevant market. The Board of Manage-
ment is responsible for Group policies, including
corporate social responsibility, strategy, acquisitions,
investments, risk management, fi nance and internal
coordination. This includes matters that are best handled
centrally, for reasons such as effi ciency, advanced
specialisation or fi nancing.
Fugro’s philosophy is that the operating companies in
the divisions should be able to operate autonomously as
much as possible within the framework of the Group’s
policy, business principles and internal risk management
systems. This enhances the quality of the operating
companies’ management and the development
opportunities available for employees. Delegation is
closely entwined in the corporate culture. The increasing
cooperation between or within the different divisions
creates synergy, especially for complex and integrated
projects, which increases earning capacity. Thus creativity
and involvement within the whole organisation are
increased while employees’ opportunities for professional
challenges and career development are considerably
enhanced.
M a n a ge m e n t a p p r o a c h
Market presence
The Fugro decentralised organisational structure
facilitates a strong regional market presence, which leads
to the use of local suppliers and procedures for the
recruitment and training of local staff.
Human resource policy
The organisation’s decentralised nature is also refl ected in
its staff policy. The operating companies are responsible
for local staff policies, which take into account local
customs and regulations, within the guidelines set out
by Fugro in areas such as salaries, pensions, safety and
health and the general business principles. Most of the
employees in Fugro’s worldwide network of offi ces are
nationals, including the managerial staff.
Energy
By increasing the awareness of the use of energy and
sustainable materials, the impact on the environment can
be minimised. Fugro considers this when purchasing or
ordering new equipment, and when expanding its fl eet
of vessels and airplanes.
Transfer of knowledge
A shortage of well-trained (technical) staff has led Fugro
to adopt internal training as much as possible, despite
the fact that some of the staff trained may move to
competitor companies. Social prosperity is largely
dependent on the extent to which knowledge and
innovation processes thrive within an economy. This
necessitates investment in classroom and e-learning
training and education.
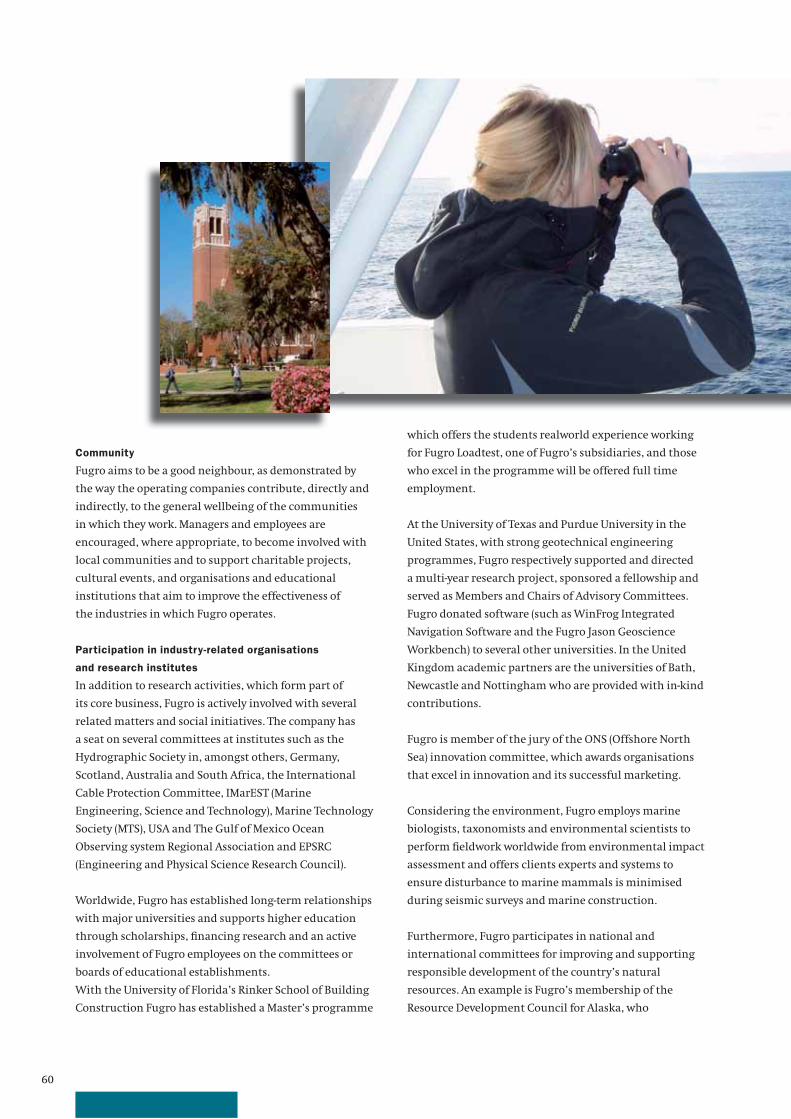
60
Community
Fugro aims to be a good neighbour, as demonstrated by
the way the operating companies contribute, directly and
indirectly, to the general wellbeing of the communities
in which they work. Managers and employees are
encouraged, where appropriate, to become involved with
local communities and to support charitable projects,
cultural events, and organisations and educational
institutions that aim to improve the effectiveness of
the industries in which Fugro operates.
Participation in industry-related organisations
and research institutes
In addition to research activities, which form part of
its core business, Fugro is actively involved with several
related matters and social initiatives. The company has
a seat on several committees at institutes such as the
Hydrographic Society in, amongst others, Germany,
Scotland, Australia and South Africa, the International
Cable Protection Committee, IMarEST (Marine
Engineering, Science and Technology), Marine Technology
Society (MTS), USA and The Gulf of Mexico Ocean
Observing system Regional Association and EPSRC
(Engineering and Physical Science Research Council).
Worldwide, Fugro has established long-term relationships
with major universities and supports higher education
through scholarships, fi nancing research and an active
involvement of Fugro employees on the committees or
boards of educational establishments.
With the University of Florida’s Rinker School of Building
Construction Fugro has established a Master’s programme
which offers the students realworld experience working
for Fugro Loadtest, one of Fugro’s subsidiaries, and those
who excel in the programme will be offered full time
employment.
At the University of Texas and Purdue University in the
United States, with strong geotechnical engineering
programmes, Fugro respectively supported and directed
a multi-year research project, sponsored a fellowship and
served as Members and Chairs of Advisory Committees.
Fugro donated software (such as WinFrog Integrated
Navigation Software and the Fugro Jason Geoscience
Workbench) to several other universities. In the United
Kingdom academic partners are the universities of Bath,
Newcastle and Nottingham who are provided with in-kind
contributions.
Fugro is member of the jury of the ONS (Offshore North
Sea) innovation committee, which awards organisations
that excel in innovation and its successful marketing.
Considering the environment, Fugro employs marine
biologists, taxonomists and environmental scientists to
perform fi eldwork worldwide from environmental impact
assessment and offers clients experts and systems to
ensure disturbance to marine mammals is minimised
during seismic surveys and marine construction.
Furthermore, Fugro participates in national and
international committees for improving and supporting
responsible development of the country’s natural
resources. An example is Fugro’s membership of the
Resource Development Council for Alaska, who

61Corporate Social Responsibility
may confl ict with their responsibilities towards the
company. Fugro has a whistleblowing procedure which
encourages employees to report any (suspected) violation
of the Business Principles and other relevant policies and
standards.
Responsibility for compliance rests principally with the
management of each company. Fugro has requested its
(senior) managers to confi rm awareness and compliance
with the Business Principles and to report non-
compliance.
Since 2009, Fugro has instituted the Business Partner
Code, which requires suppliers and subcontractors to
comply with this code. Fugro recognises that the way it
conducts business towards clients, partners and the
environment has an impact on the organisation’s
productivity and success. The Business Principles and the
Business Partner Code are available on Fugro’s website.
In 2011, the Business Principles, the Business Partner Code
and other relevant policies and standards will be inte-
grated in a Corporate Social Responsibility Management
System.
Health and safety policy
Providing its employees with a safe and healthy working
environment is one of Fugro’s highest priorities.
The vision for the health and safety policy is maintained
by the holding company. Fugro aims to create safe and
healthy working conditions for all its employees and
subcontractors. Because the organisation attaches such
great importance to safety, this subject is reported in
more detail in a separate section.
accomplishes their efforts through education and
advocacy on all resources in Alaska, including oil and
gas, mining, fi shing, forestry and tourism.
Fugro’s general business principles
Fugro works on the principle that every employee shares
responsibility for the company’s reputation. For all staff,
this means that it is not enough to just do the right thing;
things must also be done correctly. Fugro’s employees
support the social values of reliability, integrity,
openness, and respect for fellow employees and the
environment. These common values form the foundation
of Fugro’s general business principles (Business
Principles), which apply to all operating companies and
thus to all employees. Application of these values in
Fugro’s business conduct creates a sense of trust between
the organisation and its partners. The local management,
under supervision of the Board of Management, has
responsibility for ensuring that all employees at all levels
of the company adhere to these Business Principles. These
requirements determine the way in which Fugro’s staff
treat each other, its customers and subcontractors, and
anyone else who may be affected by its activities. Fugro
believes in free and fair competition based on value
for money and suitability for purpose. It supports free
enterprise within the framework of applicable laws,
and works closely with those companies that endorse
comparable Business Principles.
All employees are expected to report any breach of the
Business Principles or any suspicion thereof to the Board
of Management or senior management and are required
to avoid any personal activities or fi nancial interests that
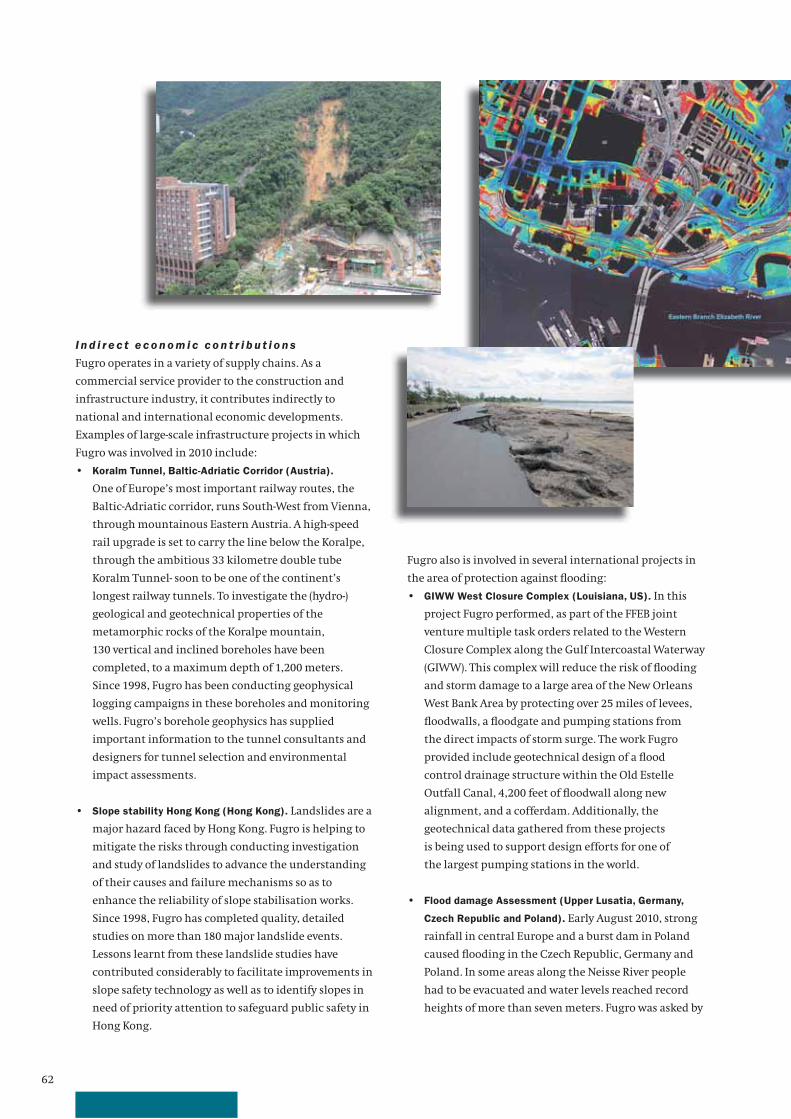
62
Fugro also is involved in several international projects in
the area of protection against fl ooding:
• GIWW West Closure Complex (Louisiana, US). In this
project Fugro performed, as part of the FFEB joint
venture multiple task orders related to the Western
Closure Complex along the Gulf Intercoastal Waterway
(GIWW). This complex will reduce the risk of fl ooding
and storm damage to a large area of the New Orleans
West Bank Area by protecting over 25 miles of levees,
fl oodwalls, a fl oodgate and pumping stations from
the direct impacts of storm surge. The work Fugro
provided include geotechnical design of a fl ood
control drainage structure within the Old Estelle
Outfall Canal, 4,200 feet of fl oodwall along new
alignment, and a cofferdam. Additionally, the
geotechnical data gathered from these projects
is being used to support design efforts for one of
the largest pumping stations in the world.
• Flood damage Assessment (Upper Lusatia, Germany,
Czech Republic and Poland). Early August 2010, strong
rainfall in central Europe and a burst dam in Poland
caused fl ooding in the Czech Republic, Germany and
Poland. In some areas along the Neisse River people
had to be evacuated and water levels reached record
heights of more than seven meters. Fugro was asked by
I n d i r e c t e c o n o m i c c o n t r i b u t i o n s
Fugro operates in a variety of supply chains. As a
commercial service provider to the construction and
infrastructure industry, it contributes indirectly to
national and international economic developments.
Examples of large-scale infrastructure projects in which
Fugro was involved in 2010 include:
• Koralm Tunnel, Baltic-Adriatic Corridor (Austria).
One of Europe’s most important railway routes, the
Baltic-Adriatic corridor, runs South-West from Vienna,
through mountainous Eastern Austria. A high-speed
rail upgrade is set to carry the line below the Koralpe,
through the ambitious 33 kilometre double tube
Koralm Tunnel- soon to be one of the continent’s
longest railway tunnels. To investigate the (hydro-)
geological and geotechnical properties of the
metamorphic rocks of the Koralpe mountain,
130 vertical and inclined boreholes have been
completed, to a maximum depth of 1,200 meters.
Since 1998, Fugro has been conducting geophysical
logging campaigns in these boreholes and monitoring
wells. Fugro’s borehole geophysics has supplied
important information to the tunnel consultants and
designers for tunnel selection and environmental
impact assessments.
• Slope stability Hong Kong (Hong Kong). Landslides are a
major hazard faced by Hong Kong. Fugro is helping to
mitigate the risks through conducting investigation
and study of landslides to advance the understanding
of their causes and failure mechanisms so as to
enhance the reliability of slope stabilisation works.
Since 1998, Fugro has completed quality, detailed
studies on more than 180 major landslide events.
Lessons learnt from these landslide studies have
contributed considerably to facilitate improvements in
slope safety technology as well as to identify slopes in
need of priority attention to safeguard public safety in
Hong Kong.

63Corporate Social Responsibility
Pilbara Region of Western Australia. The aim of this
effort was to expand the understanding of aquifer
geometries and groundwater salinity distribution
within the region. Information of borehole logs and
publicly available data were integrated to provide a
regional overview of the hydrogeology. It is anticipated
that this study will provide invaluable information for
future groundwater studies in the region.
• Public digital groundwater information system (Berlin).
In the German federal state of Berlin, Fugro has
successfully installed a public digital groundwater
information system using Fugro’s GeODin 7 software
platform. Data from over 150,000 boreholes and
9,000 monitoring wells provide the basis for cross
sections and site plans, whilst monthly groundwater
isoline contour maps give valuable information on
the maximum and current groundwater levels.
The concept of GeODin Maps allows users a simple and
intuitive way to search for, analyse and present geo
information, which then can be universally accessed
through a GIS web portal.
I n d i r e c t e n v i r o n m e n t a l c o n t r i b u t i o n s
Sustainable energy
Demand for sustainable energy has been the driver for
the signifi cant expansion of wind farm developments in
Western Europe. Also in the years to come it is expected
that many more wind farms will be built. Fugro provides a
variety of services required to determine the best location,
both on and offshore. Examples include:
• Dogger Bank (North Sea, UK), a 9 Giga Watt offshore
wind farm, for which Fugro has provided geotechnical
site investigation and seabed sampling, Thanet Wind
farm (North Sea, UK), for which Fugro has carried out
cable inspections and has provided support to cable
and meteorological mast installations and EON
Amrumbank (North Sea, Germany), for which Fugro
used three geotechnical vessels and a jackup to
complete seabed CPTs and data sampling for around 70
turbine locations.
Biodiversity
• St. Lucia Coastal Mapping (St. Lucia). Thanks to its rich
biodiversity and natural beauty – from tropical rain
forests in the interior mountain to mangrove forests
and coral reefs along the coast- tourism on the
Caribbean island of St-Lucia is booming. The resulting
rise of population and coastal development over the
past several decades was beginning to take a toll on the
island’s fragile coastal ecosystems. In 2009 and 2010,
Fugro completed a series of geospatial projects for the
the Saxonian Reservoir Authority to assess the damage
of the fl oods along the 70 km Weisser Schöps River and
provide advice on fl ood measures and costs for
reconstruction.
• Coastal flooding Evaluation, City of Norfolk (USA).
The City of Norfolk, Virginia was founded in the early
17th century on the lowlands, near the mouth of
Chesapeake Bay. Because much of the City is situated/
located just above sea level and drainage gradients are
limited, it is susceptible to various levels and severities
of fl ooding from high tides, north eastern storms,
hurricanes, and other storm events. Fugro initiated
the city-wide fl ood evaluation by installing tide gauges
to measure water levels and provide a basis for
predicting tides throughout the City.
Fugro’s evaluations of coastal fl ooding within the City
are being used to refi ne and update project design
criteria, prioritise areas for fl ood defence improve-
ments, and conduct alternatives analyses for fl ood
migration approach. In addition, the predictions are
being used for redevelopment planning studies and
emergency response plans within the City.
In 2010, Fugro carried out projects relating to quality and
quantity of water, including:
• Airborne electromagnetics for groundwater Pilbara
Coast (Western Australia). In 2010 Fugro was
contracted by the Department of Water of the
Government of Western Australia to acquire and
interpret TEMPEST® airborne electromagnetic data
over the lowest reaches of four river systems in the

64
S o c i a l c o n t r i b u t i o n s
Sustainable development
One aspect of the general business principles (GBP) is
Fugro’s continuing commitment to sustainable
development. This requires the organisation to make
a balanced consideration of its short and long-term
business interests and the integration of social, economic
and environmental considerations during the
commercial decision making process. Because of its global
presence and decentralised structure, Fugro endeavours
to keep in balance the limited or lack of local regulation
and legislation in some countries and the high standards
the organisation wishes to pursue.
Project participation
Integral to Fugro’s value system is its support for social
initiatives. As a participant in the National Science
Foundation-funded Geo-engineering Extreme Events
Reconnaissance (NSF-GEER) team and in partnership with
University of Texas at Austin, Fugro developed the fi rst
detailed post-quake geologic map of Port-au-Prince (Haiti).
This involved key participation in UN-funded training
workshops in Haiti to provide technology transfer for use
of resulting microsonation maps for reconstruction and
input/training for improved building code and practice.
Fugro has become a participant in the Greendriver
Challenge in the Netherlands, a competition to save fuel
en reduce CO2-emissions, which stimulates environ-
mentally friendly driving and improvement of
environmental performance.
government of St. Lucia that will inform a new land
management policy designed to promote sustainable
development and to protect these vital coastal
resources. The effort involved airborne acquisition and
processing of high resolution multispectral imagery
and ground surveying to develop detailed terrain and
habitat maps.
• U.S. West Coast Mapping (USA). Extending nearly
1,500 miles from Mexico to Canada, the West coast of
the U.S. contains unique and dynamic natural
resources and includes some of the most productive
waters in the world. Today, this area is faced with an
increasing number of challenges from declining fi sh
and marine life populations to the impacts of sea-level
rise and issues related to climate change. Since 2009,
Fugro has deployed high resolution airborne LiDAR
and digital imaging systems to develop an accurate
map of coastal zone, seafl oor substrate, marine habitat
types and bathymetry along the coast. This important
coastal mapping program is designed to support
research and policy decisions at the state and federal
level for a variety of needs, including: coastal and
marine spatial planning, land use management,
coastal erosion, marine fi sheries management,
transportation and shipping coordination, and fl ood
risk mitigation.

65Corporate Social Responsibility
The Azerbaijan Symphony Orchestra was supported by
Fugro Caspian. Through participation in the Egyptian
Oilman’s Golf Society, Fugro provides essential items in
local orphanages. In Scotland local junior soccer and
hockey teams are receiving support from Fugro in
Aberdeen, and in Lafayette, United States, Fugro sponsors
the Academia Center for Arts to introduce children to
a wide variety of performing arts experiences.
Several Fugro operating companies are involved in sports
and charity events to raise money for (international)
cancer organisations: Fugro Oceansismica in Italy and
Fugro Consultants in the United States for the Susan
Kamen organisation, Fugro Pelagos in California for the
American Cancer Society and Fugro Survey in Scotland for
Macmillian Cancer.
These are just some examples of Fugro’s contribution to
local communities, which vary from large projects to
small contributions such as a talk by a Fugro geologist in a
local Café Scientifi c Forum on ‘The Tropics of Wallingford’
(in the UK) or the participation of Fugro Hong Kong in the
Sowers Action marathon event to raise money to support
students of poor families.
Sponsorships
Fugro seeks to help preserve and promote accessibility to
valuable cultural heritage and the organisation supports
a large number of initiatives worldwide, notably in the
fi elds of the arts, culture and sport. As sponsor of the
Concertgebouw Amsterdam, Fugro contributes to their
mission to offer as many people as possible the
opportunity to experience high quality classical music.
Fugro’s support to Stichting Hermitage, national park
‘De Hoge Veluwe’, the sea tugboat ‘Holland’ and MS150
(Houston-Austin cycling tour by US Multiple Sclerosis
Society) is ongoing. In 2010 Fugro supported the Beagle
Project, a project in which Darwin’s 5-year long voyage on
the HMS Beagle was reconstructed in the course of one
year, and in which an attempt was made to assess where
the world stands today in light of Darwin’s evolution
theory.
Worldwide, operating companies regularly assist in local
environmental projects such as cleaning up beaches, with
some extending this to ‘adoption’ of part of the beach.
Fugro Brazil contributes to the revitalisation of the
Santana Archipelago in Macao, by providing diving
equipment and supervising the diving operations
involved in the cleaning campaign of the coastal area.
In South Africa, Fugro contributes to The Homestead,
a project to support street children. In California, each
year Fugro participates in a charity event to provide toys
to children of underprivileged families. Australian-based
charity ‘Hannah’s House’ is accommodating disabled
children and their families with help from Fugro in Perth.
TM

66
Fugro’s vessel recycling, safe and environmentally sound
Fugro is not only committed to provide a healthy and safe workplace for
all people at each work location but is also committed to protect the
environment in accordance with applicable laws and its own environ-
mental policy. Fugro continues to address the environmental and health
impact of its operations by handling waste responsibly.
As a vessel owner, Fugro has developed a policy for safe and environmentally
responsible vessel recycling based on the Hong Kong International
Convention for the Safe and Environmentally Sound Recycling of Ships
(2009) and required standards for health and safety. These standards include
the minimum requirements with regards to: e.g. tank cleaning, asbestos
removal, refrigerant recovery, removal of hazardous materials, stripping
and removing insulating materials, removal of all electric cables and
wiring, and removal of PVC piping and other plastics. In line with the
Convention guidelines a vessel is rigorously checked for harmful substances
before it is delivered to the recycling facility. As a minimum,
this involves conducting a radiation survey, auditing hazardous materials
and highlighting any parts of the vessel which require particular care
during the processes of dismantlement.
The overall objective of vessel recycling is to recover components and
materials for reprocessing and re-use. Steel vessel components can be
recycled to produce new steel, reducing the energy required for processing
by two-thirds. Copper cables and aluminium parts are also recycled.
The recycling facility takes care of the (re-)processing and disposal of waste.
Fugro desires to use only state-of-the-art recycling facilities and have chosen
a facility in China, where it monitors the recycling process and receives
daily reports from its own on-site supervisor in China. The selected yard
is ISO 14001 and OHSAS 18001 accredited and works in accordance with
the Hong Kong Convention guidelines.
In the past three years Fugro has successfully recycled older owned vessels
in China without a single incident and in line with Fugro’s fl eet renewal
program, more vessels are likely to follow this process of safe and sound
dismantlement.
Fugro has made it its goal that by the end of 2011 all large,
operational subsidiaries will have a certifi ed environ-
mental management system according to ISO 14001
or equivalent. By the end of 2010 some 60% of these
subsidiaries were certifi ed.
Environment
Fugro’s services are aimed at effi ciently deploying
personnel and equipment for the collection and
interpretation of data. The organisation also acts as an
advisory body. Fugro does not own or operate large-scale
production facilities that might have an impact on the
environment. Its main focus is on environmental aspects
associated with the deployment of the equipment and
offi ces from which Fugro operates.

67Corporate Social Responsibility
staff across the group. These technical training
programmes support Fugro’s aims to use common
systems and processes across many of its areas of
operation, with the goal of establishing global standards
of staff competence within business lines. Dedicated
teams of trainers deliver standard courses to staff in
the local operating companies. This approach develops
local staff to the same international standards, thereby
facilitating both short term and long term staff
secondments.
Furthermore the Fugro Academy provides online training
and education resources with an e-learning catalogue of
over 2000 modules available to staff. Due to the special-
ised nature of Fugro’s business, a large investment in
e-learning is towards development of modules specifi c to
Fugro systems, processes and business activities. As well as
the benefi ts of delivering a consistent message, e-learning
allows delivery of courses to a global workforce and trans-
lation into local languages. E-learning courses have been
used to support technical, project management, health &
safety and human resource initiatives during 2010.
E-learning is also used to support classroom training,
with pre- and post-classroom assignments for many
programmes, giving a blended approach to learning.
Diversity and opportunities
In Fugro’s business structure, local operating companies
operate autonomously within the framework of the
group’s policy, business principles and internal risk
management systems. As a global organisation, operating
in more than 50 countries, diversity is inextricably part
of Fugro’s business. Whenever possible, staff is recruited
locally, and is offered local training and development
opportunities. In this way, a balanced refl ection of the
countries in which Fugro operates is realised which
contributes to successful operations because Fugro
benefi ts from the local expertise in understanding
business practices, laws and customs.
As an example in Brasil, one of Fugro’s key developing
markets, Fugro has a staff of about 1,350 people who all
but four have Brazilian nationality. In Hong Kong, out of
Wo r k i n g e n v i r o n m e n t
Education
Fugro’s range of high-quality services provides a strong
foundation for further growth, and supports long-term
development of higher standards of service. Fugro’s global
presence and innovative capabilities are utilised to
further these goals. A suitable internal personal
development and career policy is important in order to
retain and benefi t from competent employees and those
with specifi c expertise relevant to the organisation. The
education policy is aimed at: employees who demonstrate
management potential; the development of in-house
experts; and at employees who can be deployed fl exibly on
a project-by-project basis.
Flexibility through exchangeability of staff is an
important aspect of Fugro’s education policy. To facilitate
this, the same technical systems are used throughout the
Group whenever possible, and both short- and long-term
employee exchange programmes have been developed
enabling people to gain experience through overseas
postings. To foster the recruitment of new, young talent,
Fugro has built-up good contacts with universities and
the organisation supports both management and
professional development through the Fugro Academy.
The Fugro Academy is the core of Fugro’s corporate
training and education. Having been established in
late 2006 as an internal training organisation, the Fugro
Academy operates on a global level for the development
and delivery of education and training to support group-
wide initiatives. Courses are delivered locally and
regionally covering a range of topics such as management,
leadership and project management. Since 2006,
60 management courses have been delivered in
20 countries to over 1,200 staff (see table), thus allowing
Fugro to develop its staff locally in different languages
where appropriate.
The Fugro Academy also operates at a business line level
with specialised technical programmes for professional
M a n a ge m e n t d e ve l o p m e n t ( 2 0 0 6 – 2 0 1 0 )
12 senior management
development programmes 230 attendees
19 middle management develop
programmes 460 attendees
29 project management courses 560 attendees
E - l e a r n i n g ( 2 0 0 8 – 2 0 1 0 )
Active users 4,200
Modules available Over 2.000
Modules created by Fugro 150
Modules enrolments Over 69,000
Modules completed Over 40,000
68
600 staff only 10 are of non Hong Kong/Chinese
nationality.
In Kazakhstan operations on the Kashagan oil fi eld, one
of the largest oil fi elds in the world, located in the very
shallow waters of the North-East Caspian Sea, started with
a team of four expatriate employees. Over time, as
activities increased, Fugro has been successful in
recruiting and training local employees. Now, the
business is dominated by Kazak nationals, and the
involvement of expatriates has been signifi cantly reduced.
At the same time, being a global employer, Fugro offers
career opportunities worldwide which naturally results in
diversity because of the many different ethnicities within
the workplace. Though working with people from various
cultural backgrounds is at times challenging, it adds
value in that it provides a learning environment where
people have an open mind and appreciate and respect
Partnership for Growth
In 2010 Fugro has launched a human resource
strategic initiative, called ‘Partnership For Growth’,
that will add structure and consistency to the
existing relationship between Fugro and its
employees, where both have a role to play in
ensuring growth through achievement of personal
and business goals.
The human resources strategy, built to function
within Fugro’s decentralised organisation, is
comprised of modular elements and is initially
focused on the Induction of new employees and the
Performance and Personal Development (PPD) cycle.
The Induction programme will ensure that the fi rst
few weeks of employment for all new hires are a
welcoming and learning event. Built within a
common structure and allowing for local variance,
the induction programme is aimed at providing a
consistent message across the group about Fugro
and key foundational knowledge such as safety and
career focused learning and development. As a
result of this process all new employees will feel
connected with Fugro and will be able to contribute
in a safe and competent manner.
The Performance and Development cycle will ensure
that all employees receive regular feedback and
recognition from their managers about the work
that they do, and have the opportunity to discuss
career aspirations for the future. PPD requires that
performance is measured against pre agreed
targets, and core competences. A complimentary
training programme has been developed with the
Fugro Academy to ensure that both sides of the
partnership know what is expected of them, and
that managers gain the core skills required to carry
out this process effectively.
As a result of ‘Partnership for Growth’, Fugro will
have the framework it needs to develop a global
workforce that is able to meet its clients’ needs
now and in the future.
Fugro is equally proud of the fact that they are able
to attract, retain and promote a signifi cant number
of female employees into engineering, survey and
geosciences businesses, which are traditionally male
dominated. Some examples:
• Ms. Anna Faithful graduated with a BSc in
Oceanography and a Postgraduate qualifi cation
in Hydrography from the University of Plymouth in
2006. She started as a Trainee Surveyor in the Survey
Positioning Division, was promoted a year later to
Surveyor and fi nally again in 2010 to Project
Manager for Fugro Survey Limited.
• At Fugro Aviation Australia, Ms. Toni Feaver is a
Licensed Aircraft Maintenance Engineer covering
both airframes and engines, and is in charge of
the component shop where she overhauls and repairs
a range of aircraft parts for the Fugro fl eet.
• Ms. Fionnuala Richard started her career with Fugro as
a fi eld surveyor working offshore in Fugro Chance’s
Marine Construction group in Houston and now leads
the offshore survey operations group and supervises
eight project managers and 120 offshore surveyors.
• Ms. Mathilde Scholtes joined Fugro Survey in the
Netherlands in 1995, where she took the post of
Managing Director in 2001 responsible for offshore
survey activities in the Netherlands and West Africa.
Since 2009, Mathilde is Managing Director of Fugro’s
survey operation in Brazil, which is, with more than
850 employees, one of the largest operations of
Fugro worldwide.

69Corporate Social Responsibility
resulting from its activities and minimises them as far as
is reasonably possible. By observing and encouraging this
policy, the company contributes to protecting the
environment and the general wellbeing of all interested
parties, including staff, customers, suppliers,
subcontractors and local communities.
Fugro applies a safety management system that outlines a
framework for safety at all levels within the organisation.
The management system is designed to promote
consistent reporting, to keep safety related risks under
control, and to identify the ways in which the company
can continue to improve safety in the workplace. In recent
years, several corporate standards and a dedicated
information management system have been developed
and implemented to support this process.
A proactive approach to the creation of a safe working
environment for all staff is a priority for Fugro.
The management of the operating companies are
responsible for promoting safety training for all staff;
assigning responsibility for all aspects of the safety policy;
identifying potential areas for improvement; and carrying
out comprehensive evaluations of all incidents and near
misses. This system ties in with Fugro’s business princi-
ples, which state that the operating companies will carry
out their activities independently in accordance with
instructions and supervision from Fugro. The operating
companies are supported by a dedicated team of HSE
advisors.
In 2010 the Golden SAM (Safety Always Matters) was
awarded to Fugro Survey Nigeria Ltd. and Fugro Survey
Ltd. in Aberdeen for best overall and consistent HSE
performance.
each others qualities. In this way constructive cooperation
between professionals leads to innovation and global
quality solutions for Fugro’s clients. Leadership and
direction comes from Fugro’s Executive Committee which
is itself an example of global diversity and comprises
seven nationalities. Also the members of the Global HR
Team and the global HSE Team originate from different
countries and backgrounds, and involve men as well as
women.
With an ongoing focus on demonstrating our commit-
ment to our shareholders for sustainable global growth,
diversity will always be a natural business outcome for
Fugro.
Employment benefits
Fugro promotes commitment and rewards effort and
results; for this reason fl exible reward systems and an
option plan have been in place for many years.
Employee pension schemes and other such benefi ts are
maintained on behalf of the company’s staff, taking into
account local customs and regulations.
H e a l t h a n d s a f e t y
Fugro’s responsibilities towards HSE issues are integral to
the way it conducts business. The organisation strives for
a safe and healthy workplace for everyone at each of its
establishments. Its commitment is based on the belief
that accidents can be prevented. To achieve this goal of
prevention, the company identifi es the safety risks

70
The lagging indicators for 2010 show that Fugro’s safety
program has resulted in signifi cant improvements.
The incidence rate and lost workday rate (per 1 million
manhours worked) have been reduced by more than 50%
over the past fi ve years.
Fugro strives to achieve safety ratio’s which are in line
with the benchmarks that are appropriate for the
industries in which Fugro works, such as to achieve an
LTIF (Lost Time Injury Frequency) of less than 0.5 per
1 million work hours (benchmark set by the International
Association of Oil and Gas Producers). The part of Fugro’s
services that relates to this segment showed a LTIF close to
0.5 in 2010.
In 2010 Fugro has engaged a team of safety-experts from a
leading industrial company to assist with the execution of
an Employee Safety Perception Survey. The results of this
survey will be benchmarked against companies that have
achieved a ‘world class safety’ status and will provide
management with input to decide on the next steps to
become one of the top quartile performers in safety.
Health campaign
In the fi rm believe that health awareness
contributes to the well being of both her employees
and the company, Fugro has launched a wellness
campaign in 2010, called ‘Fit for the job’.
This campaign, built on the character of SAM (Safety
Always Matters), aims to encourage employees to
continue or start personal wellness activities while
on the job. In 2011 the operating companies are
encouraged to give substance to this initiative.

71Risk management
■ R i s k M a n a g e m e n t
G e n e r a l
Fugro’s risk management policy is aimed at the long-term
sustainable management of its business activities and the
limiting or, where meaningful, hedging of the associated
risks. Due to the wide diversity of markets, clients and
regions and its broad portfolio of activities, quantifying
all the existing risks relevant to the Group as a whole is
virtually impossible. Risks are, however, quantifi ed
wherever possible and useful. This applies amongst others
to the infl uence of the exchange rate of the US dollar, the
Norwegian kroner and the British pound. See page 26.
Strengths
• Consistent execution of strategy as an independent
service provider
• Good market position in many niche markets
worldwide
• Professional employees who receive continuous
additional training
• High-quality technology and services provision
• Well functioning fi nancial systems and risk
management systems
• Cooperation between business units
• Healthy fi nancial position
Weaknesses
• Sensitivity to rapid, sharp fl uctuations in, amongst
others, the exchange rate of the US dollar, the
Norwegian kroner and the British pound
• Much of the revenue depends on investment by the oil
and gas industry
Opportunities
• Increased investment by the oil and gas industry,
amongst others related to depletion of existing fi elds
• Increasing demand for oil and gas as the world
economy recovery continues
• Optimisation of existing oil and gas fi elds
• More and larger infrastructure projects, including
coastline protection
• Increasing demand for mineral exploration as the
demand for minerals recovers
• Upcoming markets such as Brazil, Russia, India and
China and Eastern European countries
• Increasing demand for non-fossil energy sources
Threats
• Economic stagnation, which may lead to project
deferrals and/or cancellations
• Collapse of the demand for oil, gas and/or minerals
• Political instability in countries and/or regions
important to Fugro
• Payment risk of clients with low fi nancial strength
• Pressure on prices by clients as a result of lower
demand and/or overcapacity in certain market
segments
• Signifi cant foreign currency fl uctuations (amongst
others US dollar, Norwegain kroner and British pound)
• Strong decrease of the oil price compared to the
present level over USD 100 per barrel (Brent), leading to
lower investments by the oil and gas industry
• A disaster such as the oil spill in the Gulf of Mexico
that could have the effect that planned and ongoing
activities are (partly) cancelled or reduced
F u g r o ’s l o n g - t e r m r i s k s a r e l i m i t e d d u e t o :
• The diversity of activities in more than one
international market segment
• No clients with contracts accounting for more
than around 4% of Fugro’s total annual revenue
• Use of own modern technologies and
professional employees
• The ability to adjust quickly to exchange rate
and price changes as most contracts are of short
duration
• Geographical spread of the activities
• A balanced and fl exible vessel fl eet composition
(owned and chartered)
• Current liabilities (EUR 880 million) amount to
28% of the balance sheet total
• Limited risk related to pension obligations
• Good internal risk management and control sys-
tems
• Part of the (manpower) capacity being hired-in
on a fl exible basis, among which free lance staff
• Strong fi nancial position to support future
growth

72
50%
14%
26%
10%
Other
USD
GBP
EUR
B r e a k d ow n r e ve n u e p e r
c u r r e n c y (for the year 2010)
5%
73%
3%
19%
Oil and gas
Infrastructure
Mining
Other
B r e a k d ow n r e ve n u e p e r
s e c t o r (for the year 2010)
Fugro’s budgets are, to a great extent, based on the
expected investments by the oil and gas industry. Unless
there is a structural drop in the oil price to less than USD
70 – 80 per barrel (Brent), it is not anticipated that
substantial (up or down) fl uctuations in oil prices will lead
to a rapid change in these investments.
Capacity management
Fugro is constantly alert for signals that indicate changes
in market conditions so it can react quickly and
appropriately. Sudden and unexpected changes in market
conditions are, however, always possible. Some of Fugro’s
survey activities can precede investment by clients and
generally take place at the start of project or investment-
cycles of clients. This means Fugro’s activities can be the
fi rst to be affected by changes in market conditions.
Postponement and interruption to the fl ow of orders
can lead to temporary losses due to under-utilisation
of capacity.
The weather and the availability of vessels are key factors
for offshore activities in particular. Weather infl uences
are calculated into the budgets and tend to average out
over the year and the regions in which Fugro is active.
As far as vessels are concerned, Fugro’s objective is a
balanced fl eet in which around 45% of the vessels are
owned and around 40% are on mid-term or long-term
charter basis. A number of vessels (approximately 15% of
the fl eet) are chartered on a project basis. The fact that
Fugro is deploying heavy and specialist equipment does
mean that the risk of capacity under-utilisation will
increase. At the same time, the exchange of manpower
and equipment between the various business units can
improve capacity utilisation. The deployment of expensive
(marine) equipment also leads to risks with regard to loss
of revenue due to equipment break downs. Part of the
staff is appointed on a temporary basis or works on a
freelance basis, providing Fugro a certain fl exibility to
respond to variations in manpower needs.
O p e r a t i o n a l
Activity portfolio
Although the core activities show a high degree of
cohesion, they also target highly diverse markets, clients
and regions. A high proportion of the activities is related
to the oil and gas industry. Fugro’s dependence on the
more cyclic investment in oil and gas exploration and
development is balanced by its involvement in the more
stable investments in oil and gas production. The other
activities are dependent on developments in markets
that include infrastructure, construction and mining.
The infl uence of positive and negative economic effects
is further moderated by:
• Cohesion between a broad range of services
• Good geographical spread
• Being an independent service provider to a diverse
base of clients
• Strong market positions
• Size of the Group
Contract flow and price changes
Some of Fugro’s contracts are awarded on the basis of
long-term preferred supplier agreements. In the course of
a year Fugro often carries out several projects for the same
client. The projects carried out for any single client do
not, however, account for more than around 4% of the
total annual revenue. Having a large number of clients
supports Fugro’s independence and improves its stability.
To carry out its projects Fugro has at its disposal highly
trained employees and many technically advanced and
therefore expensive equipment. Much of Fugro’s work
involves short-term contracts. Fugro is, to a degree,
sensitive to price changes and sudden changes in
exchange rates, although it can adapt relatively quick due
to the general short term duration of projects.

73Risk management
assets and liabilities in foreign currencies. Rapid and
radical changes in exchange rates can also infl uence
the balance sheet and profi t and loss account, partly due
to the length of time between tenders being submitted
and orders being awarded or delayed, during which
period forward exchange contracts would not be
appropriate. This creates an additional foreign currency
risk that cannot be quantifi ed in advance. At the
Group’s current structure and size, a rate difference of
10% on the USD would affect profi t by EUR 5.1 million
and revenue by approximately EUR 95 million. A rate
difference of 10% on the GBP would affect profi t by
EUR 1.5 million and revenue by approxi-mately
EUR 40 million.
Pension provisions
Fugro maintains pension schemes for its employees in
accordance with regulations and customs which prevail
in each of the countries in which the Company operates.
Since 1 January 2005 Fugro operates an average salary
based pension scheme in the Netherlands. This is clas-
sifi ed as a ‘defi ned benefi t’ scheme. The pension commi-
tments in the Netherlands are fully re-insured on the
basis of a guarantee contract. The accrued benefi ts are
fully fi nanced.
In the United States Fugro has a 401K system for its
employees. Fugro contributes towards the deposits of its
employees in accordance with agreed rules and taking
the regulations of the Internal Revenue Service (IRS), the
American federal tax authority, into account. This system
is free of risk for Fugro.
F i n a n c i a l
Balance sheet
Fugro follows an active policy to optimise its balance
sheet ratios and thus limit fi nancial risks and maintain its
long-term solvency. Being quoted on the stock exchange
provides a worthwhile contribution towards achieving
the (fi nancial) targets and it enables Fugro to make a well
considered selection of the optimum fi nancing mix when
considering larger investments and acquisitions.
Future interest rate risks are limited to bank loans.
Fugro’s objective is to limit the effect of interest rate
changes on the results.
Research costs are charged directly to the results.
Fugro has evaluated the book value of its assets, including
goodwill, within the framework of its normal balance
sheet evaluation. This has shown that no impairment of
any tangible or intangible asset is necessary.
Currency exchange rate conversion
Fugro limits its susceptibility to changes in foreign
currency variances, but is not immune to exchange rate
variances caused by rapid changes to the rates versus the
Eur (which is the reporting currency). Besides that,
changes in exchange rates will result in translation
differences. As most of Fugro’s revenue in local currencies
is used for local payments, the effect of negative or
positive currency movements on operational activities at
a local level is minimal. Fugro’s international monetary
streams are limited and mainly in US dollars, US dollar
related currencies, Euro, the Norwegian kroner and the
British pound. Where possible and desirable, forward
exchange contracts are executed. Fugro strives to match
E x c h a n ge r a t e s
(in EUR)
USD
end of
period
USD
average
GBP
end of
period
GBP
average
NOK
end of
period
NOK
average
31 December 2010 0.75 0.76 1.16 1.17 0.128 0.125
30 June 2010 0.81 0.76 1.22 1.16 0.126 0.125
31 December 2009 0.69 0.72 1.13 1.13 0.121 0.115
30 June 2009 0.71 0.75 1.17 1.12 0.111 0.112
31 December 2008 0.71 0.68 1.05 1.25 0.102 0.125
30 June 2008 0.63 0.65 1.26 1.28 0.125 0.121
31 December 2007 0.68 0.73 1.36 1.46 0.126 0.125
30 June 2007 0.74 0.75 1.49 1.48 0.126 0.124

74
Dash 7 fl ying a MEGATEM electromagnetic survey,
Arizona, USA.
Fugro endeavours to mitigate the risks associated with
ICT systems through a variety of measures:
• Fugro maintains a dedicated ICT security team
consisting of a global ICT security offi cer and six
regional ICT security personnel. This team is
responsible for maintaining and monitoring the
security aspects of Fugro’s ICT infrastructure, such as
access to the internet, e-mail and intranet
applications. The ICT security team is independent
from the ICT support staff in the operating companies.
• The adoption of new third party software and software
upgrades (such as that used in the offi ce environment)
is generally delayed until suffi cient time has passed to
prove that the software is stable and does not pose a
security risk. Once adopted for use, critical ‘patches’ to
fi x software bugs are applied as they become available.
• Proprietary software is subject to comprehensive
testing procedures before operational use.
• Access to client data and other confi dential
information is restricted to specifi c people in the
operating company concerned, who have a legitimate
reason for such access.
• Data communications within Fugro’s global wide area
network (WAN) are channelled over a virtual private
network (VPN), the security of which is monitored
around the clock.
• Fugro’s ICT systems are constantly monitored for
evidence of contamination by viruses or
‘malware’using a variety of independent means.
• Access from Fugro’s WAN to ‘social network’ sites is
restricted for security reasons.
Insurance and legal risks
Fugro is insured against a number of risks. Risks related to
professional indemnity and general liability are covered
at a Group level. Equipment is insured locally and local
cover is arranged for risks associated with normal
business operations, such as insurance for the vehicle
fl eet, the buildings and for employees.
In the United Kingdom Fugro operates a number of
pension schemes. All the schemes available to new
employees are defi ned contribution schemes. There is one
defi ned benefi t scheme open for long-serving employees
and there are other defi ned benefi t schemes which have
been closed but which have on-going obligations to their
members. Measures have been taken to ensure these
obligations can be paid when required.
In the other countries where Fugro has organised
retirement provisions for its employees, obligations
arising from these provisions are covered by items
recognised in the balance sheet of the relevant operating
company.
Information and communication technology (ICT)
Fugro relies on a range of ICT systems (including
hardware, software, computer networks and
communication links) to manage its business, support
operations and to deliver many of the advanced
technological solutions which help to differentiate the
company in the marketplace. While much of the
hardware and software used by Fugro is purchased from
reputable suppliers, Fugro also develops proprietary
hardware and software in order to facilitate its range of
specialist services and to strengthen its market position.
Fugro’s ICT infrastructure is designed to effectively
support the needs of a decentralised global organisation
in a reliable and secure manner. The ICT needs of
individual Fugro companies vary considerably, so
companies typically have local responsibility for their
Local Area Network (LAN) infrastructure including its
support. At a local or regional level, operating companies
are encouraged to share ICT knowhow and support
services in order to generate effi ciencies of scale. At a
global level, the interface between each operating
company’s LAN and that of another Fugro company or
the ‘outside world’ is secured by ‘Firewall’ devices and
other security related systems which are monitored by
a dedicated team of ICT security specialists.

75Risk management
Project Management handbook
This handbook provides procedures in preparation to and
for the execution of projects. This handbook is used by
project managers. The latest update was issued in October
2007.
Planning
The business plans of every Fugro unit are translated into
budgets. Adherence to the budgets is checked on a
monthly basis. Any unforeseen circumstances that arise,
or any substantial deviation from the budgets, must be
reported immediately by the operating company
managements to the relevant responsible Executive
Committee member and to the Board of Management.
The monthly reports submitted by the operational
management to Fugro include an analysis of the
achievements versus the approved plans and a forecast
for the coming period.
Authorisation level
Managers are bound by clear authorisation restrictions
regarding representation. Projects and contracts with a
value or risk that exceeds a specifi ed amount must be
approved by either regional managers or the appropriate
member of the Executive Committee.
Letter of representation
Every six months all managers and controllers of
operating companies and the responsible member of the
Executive Committee sign a detailed statement regarding
the fi nancial reporting and internal control.
Internal Audit
Regular and frequent internal audits of the various
operating companies are carried out. The fi ndings are
reported directly to the (relevant members of the)
Executive Committee. The fi ndings are also shared with
the Audit Committee.
Peer reviews
‘Peer reviews’ are also carried out on a regular basis.
A peer review involves a review of an operating company
by a team from other operating companies. The results
are reported directly to the (relevant members of the)
Executive Committee.
Audit Committee
The Audit Committee comprises three members of the
Supervisory Board and it ensures an independent
monitoring of the risk management process from the
perspective of its supervisory role. The Audit Committee
focuses on the quality of the internal and external
Some operating companies are involved in claims, either
as the claimant or the defendant, within the context of
normal business operations. Where necessary proper
provisions have been accounted for in the annual
accounts. Based on developments thus far, it is not
anticipated that Fugro’s fi nancial position will be
noticeably affected by any of these proceedings.
With regard to items included in the annual report
adjustments to estimates are possible.
I n t e r n a l s y s t e m s
Due to the generally short-term nature of its assignments,
constant monitoring of its markets and its operating and
fi nancial results is intrinsic to Fugro’s modus operandi.
Clarity and transparency are an absolute must for
assessing and evaluating risks. These are fundamental
characteristics of the Fugro culture. Due to the wide
variety of markets, clients and regions and Fugro’s
extensive activity portfolio, the management of the
operating companies is responsible for the application
and monitoring of and compliance with the internal
control systems. The monitoring systems consist of the
internal control framework described below.
Corporate handbook
Fugro’s corporate handbook contains mandatory
instructions regarding many business aspects, including
risk management. This handbook is for the senior
management members responsible for further
application within the operating companies. The latest
update was issued in November 2009.
Financial handbook
This handbook contains detailed guidelines for the
fi nancial reporting. The fi nancial handbook is for the
senior management and the controllers of all operating
companies. The latest update was issued in December
2010.
Insurance manual
The insurance manual contains detailed guidelines with
respect to risks to be insured. The insurance manual is
distributed to managers of all operating companies and
their employees who are responsible for insurances at the
subsidiaries. The latest update was issued in September
2009.
Information and communication technology (ICT)
Fugro endeavours to mitigate the risks associated with
ICT systems through a variety of measures. These are
described above on page 74.
76
reporting, the effectiveness of the internal audits and the
functioning of the external auditor. Further information
on the Audit Committee is available on pages 16 and 17
and in the terms of reference of the Audit Committee.
These terms of reference are available on Fugro’s website:
www.fugro.com.
External audit
The annual accounts of Fugro and most of its subsidiaries
are audited annually by external auditors. These audits
take place on the basis of generally accepted auditing
standards.
Advisory roles
If necessary, professional external advice is sought of
third parties. The external auditor does not act in an
advisory capacity, except for occasionally due diligence as
part of mergers and acquisitions and activities relating to
the annual accounts.
Safety
Subsidiaries are externally certifi ed in accordance with
OHSAS 18001 or equivalent. Compliance audits are done
by internal specialists and by external agencies when
re-certifi cation has to take place. The last update was
issued in May 2009.
Quality
Where required Fugro operating companies work in
accordance with the relevant certifi cates such as ISO 9001
or equivalent. Compliance audits are carried out
internally, by clients and by external agencies.
Whistle-blower’s regulation
Fugro operates a ‘whistle-blower’s charter’ to ensure that
any possible infringement of the Group’s policy and
procedures can be reported without this act of submitting
such a report having any adverse consequences for the
‘whistle-blower’.
D e c l a r a t i o n r e ga r d i n g r i s k m a n a ge m e n t
Taking the above into account, to the best knowledge of
and in the opinion of the Board of Management, Fugro’s
internal risk management and control systems as
described in this annual report provide a reasonable
assurance that the fi nancial reporting does not contain
any errors of material importance and these systems
worked properly in the year under review.

77Corporate Governance
■ C o r p o r a t e G o v e r n a n c e
G e n e r a l
Fugro subscribes from the outset that the Dutch
Corporate Governance Code is based on the principle
accepted in the Netherlands that a company is a long-term
alliance between the various parties involved in the
company. The stakeholders are the groups and individuals
who, directly or indirectly, infl uence – or are infl uenced
by – the attainment of the company’s objects: i.e.
employees, shareholders and other lenders, suppliers,
clients, the public sector and civil society. The Board of
Management and the Supervisory Board have overall
responsibility for weighing up these interests, generally
with a view to ensuring the continuity of the enterprise,
while the company endeavours to create long-term
shareholder value.
It is very important for Fugro to achieve a balance between
the interests of its various stakeholders. Good
entrepreneurship, integrity, openness and transparent
management as well as good supervision of the
management are the starting points for Fugro’s corporate
governance structure.
D u t c h C o r p o r a t e G o ve r n a n c e C o d e
The Dutch Corporate Governance Code was initially set up
by the Tabaksblat Committee in December 2003 (Code
Tabaksblat). Fugro’s corporate governance structure was
approved by the Annual General Meeting (AGM) in May
2004. The Code Tabaksblat was revised by the Corporate
Governance Code Monitoring Committee (Frijns
Committee) in December 2008. On 10 December 2009 the
Dutch legislator designated the revised Code by decree as
the new corporate governance code as defi ned by article
2:391 Dutch Civil Code. For Fugro the Code became
effective retrospectively as per 1 January 2009 and had
hardly any consequences for Fugro’s corporate governance
structure. The full text of the Code is available at www.
commissiecorporategovernance.nl.
In accordance with the recommendations of the Frijns
Committee, the broad outline of Fugro’s corporate
governance structure and compliance with the principles
and best practices of the Code – including explanation of
a few deviations – was discussed in the AGM held on 6 May
2010. Since that date no changes have been made to the
corporate governance structure.
B r o a d o u t l i n e C o r p o r a t e G o ve r n a n c e
s t r u c t u r e a n d c o m p l i a n c e w i t h t h e C o d e
The broad outline of Fugro’s corporate governance
structure is explained in this chapter and also on Fugro’s
website: www.fugro.com. All underlying documentation
is available on the website.
Fugro’s corporate governance structure, its supervision
and the way it is reported are in line with the Code.
The Code contains principles and best practice
provisions that regulate relations between the Board of
Management, the Supervisory Board and the General
Meeting. The principles may be regarded as refl ecting the
general views on good corporate governance, which enjoy
wide support. They have been elaborated in the form of
specifi c best practice provisions. Companies may depart
from the best practice provisions. Departures may be
justifi ed in certain circumstances. Each year Fugro
indicates expressly in the annual report to what extent it
has applied the best practice provisions in the Code and, if
it did not do so, why and to what extent it did not apply
them.
Any future substantial changes in Fugro’s corporate
governance structure and its compliance with the Code
will be submitted to shareholders for discussion under a
separate agenda item.
Fugro takes the view that shareholders and certifi cate
holders, the media, corporate governance ‘rating
agencies’ and proxy advisors should carefully assess the
reason for each and every departure from the Code’s
provisions and they should avoid a ‘tick-a-box’ mentality.
A shareholder or certifi cate holders shall vote as he sees
fi t. A shareholder or certifi cate holder who makes use of
the voting advice of a third party is expected to form his
own judgment on the voting policy of this adviser and the
voting advice provided by him.
Compliance with the Code in 2010
A full overview (‘Comply or Explain’- report) of Fugro’s
compliance with the Code in 2010 is available on the
website. Fugro’s corporate governance structure is fully in
line with the recommendations in the Code except for the
points below. It should be noted that all deviations were
approved earlier by the AGM.

78
remuneration committee) is not fi lled by a former
member of the Board of Management.
Principle IV.2
Maintaining its operational independence is crucial for
Fugro (see page 80 for a further explanation). One of the
ways to safeguard this independence is share certifi cation.
Although the Code provides that the certifi cation
structure is not meant as a protective measure, Fugro has
chosen, in the interest of its clients, to also view the
certifi cation structure as part of its protective measures.
During the performance of its assignments Fugro often
receives extremely confi dential information. Fugro can
only perform its assignments if it can secure the
confi dential nature of such information towards its
clients.
The second reason for the certifi cation structure is the
prevention of possible harmful effects as a result of
absenteeism in the shareholders meetings of Fugro. Fugro
considers it not to be in the interest of its stakeholders in
general that through absenteeism an accidental majority
can, based only on its own interest, force through its
opinion. To prevent this, ties in with this Principle IV.2.
Best practice provision IV.2.1
In accordance with this provision the Board of the Trust
Offi ce enjoys the confi dence of the certifi cate holders and
operates independently of Fugro. One deviation from this
provision is that the terms of administration of the Trust
Offi ce do not stipulate the instances in which and the
conditions under which certifi cate holders may ask the
Trust Offi ce to convene a meeting, except with respect of
the right to nominate a candidate for appointment to the
Board of the Trust Offi ce (see further the explanation on
best practice provision IV.2.2).
Best practice provision IV.2.2
According to this provision the meeting of certifi cate
holders may make recommendations to the Board of the
Trust Offi ce for the appointment of a member to the
Board. The Board of the Trust Offi ce has decided that
certifi cate holders representing at least 15% of the issued
share capital in the form of certifi cates may request that
a meeting of certifi cate holders is convened in order to
make recommendations for the appointment of a
member to the Board of the Trust Offi ce.
Best practice provision II.1.1
The term of appointment (indefi nite period) of one of the
fi ve members of the Board of Management, Mr. K.S.
Wester, deviates from this provision. Mr. Wester was
appointed to the Board of Management in 1996 before the
Code came into force. Fugro cannot rescind rights that
have been granted and Fugro respects agreements made
before the introduction of the Code in 2004.
Best practice provision II.2.8
The employment agreement with Mr. Wester does not
provide for a specifi c severance pay on termination of
employment. This agreement was entered into in 1981
before the Code came into force. Fugro cannot rescind
rights that have been granted and Fugro respects
agreements made before the introduction of the Code
in 2004.
Best practice provision III.3.5
The term of the appointment of Mr. F.H. Schreve deviates
from this provision because he has already served as a
member of Fugro’s Supervisory Board for longer than
twelve years. He was reappointed as Supervisory Director
by the AGM in May 2010 for a period of one year and he
will retire at the end of the AGM on 10 May 2011. Mr.
Schreve is the Chairman of the Supervisory Board. The
Supervisory Board intends to appoint Mr. H.C. Scheffer
(who was appointed as Supervisory Director by the AGM in
May 2010) as successor to Mr. Schreve as Chairman of the
Supervisory Board in May 2011. The reappointment of
Mr. Schreve in May 2010 was considered to be in the best
interest of Fugro in order to maintain continuation in the
chairmanship until the time that a successor is
appointed.
Principle III.5 and best practice provision III.5.11
The Supervisory Board does not have a separate
remuneration committee and nomination committee. In
May 2005 the at that time separate remuneration
committee and nomination committee were, with the
approval of the AGM, amalgamated into one committee
that carries out the tasks in both areas. The reason for the
amalgamation was that a separate remuneration
committee and nomination committee (with separate
meetings) had proven impractical due to the fact that the
Supervisory Board is small and three of its members are
not resident in the Netherlands. The chairman of the
Remuneration and Nomination Committee is
Mr. G-J. Kramer who was a member of Fugro’s Board of
Management until the end of 2005. This is not fully in
compliance with the provision that the chairmanship of
the remuneration committee (but there is no separate

79Corporate Governance
■ C O R P O R AT E I N F O R M AT I O N
C a p i t a l s t r u c t u r e
The authorised capital of Fugro amounts to
EUR 16,000,000 and is divided into:
(i) 96,000,000 ordinary shares, with a nominal value of
EUR 0.05 each;
(ii) 160,000,000 cumulative protective preference shares,
with a nominal value of EUR 0.05 each;
(iii) 32,000,000 cumulative fi nancing preference shares,
with a nominal value of EUR 0.05 each, which can be
sub-divided into two series of 16,000,000 cumulative
fi nancing preference shares; and
(iv) 32,000,000 cumulative convertible fi nancing
preference shares, with a nominal value of EUR 0.05
each, which can be sub-divided into two series of
16,000,000 cumulative convertible fi nancing
preference shares.
On 31 December 2010 the issued capital amounted to
EUR 4,013,484.20. As of this date, 83.6% of the ordinary
shares (80,269,684 shares) were issued. No preference
shares have been issued.
R e s t r i c t i o n s t o t h e t r a n s f e r o f s h a r e s
The Board of Management’s approval is required for each
transfer of protective preference shares, fi nancing
preference shares and convertible fi nancing preference
shares. The approval has to be requested in writing stating
the name of the intended acquirer of the shares in
question.
Ordinary shares may be transferred only to natural
persons. Notwithstanding the provisions of the preceding
sentence, the transfer of ordinary shares shall not be
possible if and insofar as the acquirer, either alone or
under a mutual collaboration scheme jointly with one or
more others, natural persons and/or legal entities, either
directly or – otherwise than as a holder of certifi cates of
shares issued with the cooperation of Fugro – indirectly:
(i) is the holder of ordinary shares to a nominal amount
of one percent or more of the total capital of
Fugro issued in the form of ordinary shares (as of
31 December 2010 one percent equalled 802,697
shares); or
(ii) through such transfer would acquire more than one
percent of the total capital of Fugro issued in the
form of ordinary shares.
Best practice provision IV.2.5
According to this provision the Trust Offi ce, in exercising
its voting rights, should be guided ‘primarily by the
interests of the certifi cate holders, taking the interests of
the company and its affi liated enterprise into account’.
The articles of association and the terms of
administration of the Trust Offi ce provide that if the Trust
Offi ce exercises the voting rights, the Trust Offi ce will do
this in such manner that the interest of Fugro and its
enterprise, as well as the interests of all stakeholders, will
be safeguarded as best as possible (article 2 of the articles
of association and article 4 of the terms of
administration). The interests of some stakeholders need
not necessarily at all times run parallel with that of other
stakeholders. For example, some will have a short term
focus whilst others have a long term focus. It is up to the
Board of the Trust Offi ce to, after balancing the interests,
come to a well considered decision on the exercise of the
voting rights. In addition, when considering the exercise
of voting rights the Board of the Trust Offi ce in any case
takes into consideration the (Dutch) law as well as the
articles of association and the terms of administration of
the Trust Offi ce. The Board can (also) opt, for reasons of its
own, to not exercise the voting rights on the shares held
by the Trust Offi ce.
Best practice provision IV.2.8
Based on the provisions of article 2:118a Dutch Civil Code
and article 18.2 of the terms of administration, the Trust
Offi ce will provide a power of attorney to any holder of
certifi cates of shares who so requests, to exercise the
voting rights on the shares corresponding to the
certifi cates held by the holder in a shareholders meeting
of Fugro. Holders of certifi cates can (also) choose to have
themselves represented in the shareholders meeting by a
written power of attorney. In specifi c situations the Trust
Offi ce can opt not to provide a requested power of
attorney, limit the power of attorney or withdraw a power
of attorney. This applies for example in case a public offer
for the (certifi cates of) shares in the share capital of Fugro
is announced or is already made, but it applies also in
(other) circumstances in which granting a power of
attorney in the view of the Trust Offi ce substantially
confl icts with the interest of Fugro and its enterprise
(article 18.3 terms of administration and article 2:118a
Dutch Civil Code). Therefore the deviation of this
provision of the Code is that proxies to vote are not issued
without any limitation and in all circumstances.
This deviation is of course the consequence of the fact
that the structure of share certifi cation is also meant as
a protective measure.

80
If article 17 of the articles of association of Fugro is not
applicable, then article 11, sub 1 of the terms of
administration of the Trust Offi ce is applicable.
In accordance with article 11, sub 1, a holder of certifi cates
of shares who as a result of conversion acquires ordinary
shares in the capital of Fugro may only transfer these
ordinary shares to a third party if he or she has fi rst
offered these shares to the Trust Offi ce. Also true that
the holder of certifi cates who as a result of conversion
acquires ordinary shares in the capital of Fugro, during
the period that article 11, sub 1 is applicable shall:
(i) not encumber the acquired shares with a right of lien
or a right of usufruct, whereby the voting right on
these shares shall be granted to the holder of the
right of lien or the usufructuary; and
(ii) not grant a proxy to vote on the acquired shares nor
accept any voting instructions from third parties
regarding the manner in which he exercises the
voting rights on these shares.
S u b s t a n t i a l i n t e r e s t s i n F u g r o
As far as Fugro is aware of, the holders of (certifi cate of)
shares with an interest in Fugro’s share capital of more
than 5% are reported on page 11.
P r o t e c t i ve m e a s u r e s ( e x t r a o r d i n a r y c o n t r o l
r i g h t s ; l i m i t a t i o n o f v o t i n g r i g h t s )
When carrying out assignments Fugro can have access to
clients’ extremely confi dential information. For this
reason Fugro can only carry out its activities if it can
safeguard its independence in relation to its clients.
The main point of Fugro’s protection against a hostile
takeover depends on the one hand on certifi cation of the
ordinary shares and, on the other hand, on the possibility
of Fugro to issue cumulative protective preference shares.
In addition to this, protective preference shares may also
be issued by the Fugro subsidiaries Fugro Consultants
International N.V. and Fugro Financial International N.V.
to Stichting (“Foundation”) Continuïteit Fugro (see page
81). The primary aim of the protective measures is to
safeguard Fugro’s independence in relation to its clients.
The restrictions to the transfer of ordinary shares stated
above are not applicable to:
(a) the transfer of ordinary shares to Fugro itself or
to a subsidiary of Fugro;
(b) the transfer or issue of ordinary shares to, or the
exercise of a right to subscribe for ordinary shares by,
a trust offi ce or to another legal person, if in respect
of such a trust offi ce or other legal person the Board
of Management with the approval of the Supervisory
Board has by an irrevocable resolution wholly or
partially lifted the restrictions limiting the transfer
or issue of ordinary shares, to which lifting of
restrictions conditions may be attached; in respect of
another legal person as referred to above, such
restrictions may be lifted only to the extent that such
may be required to permit that legal person to avail
itself of the facility of the participation exemption, as
at present provided for in section 13 of the
Corporation Tax Act 1969;
(c) the transfer of ordinary shares acquired by Fugro
itself or the issue by Fugro of ordinary shares, if such
a transfer or issue takes place within the framework
of either a collaborative arrangement with or the
acquisition of another enterprise, or a legal merger,
or the acquisition of a participating interest or the
expansion thereof, in respect of which the Board of
Management with the approval of the Supervisory
Board by an irrevocable resolution has wholly or
partially lifted the restrictions limiting the transfer
or issue of ordinary shares, to which lifting of
restrictions conditions may be attached;
(d) the transfer or transmission of ordinary shares to
shareholders who on 31 March 1992 were recorded as
shareholders in the shareholders’ register of Fugro, if
in respect of such a transfer or transmission the
Board of Management, with the approval of the
Supervisory Board, by an irrevocable resolution
wholly or partially lifted the restrictions limiting the
transfer of ordinary shares, to which lifting of
restrictions conditions may be attached;
(e) the transfer or transmission of ordinary shares to
group companies of legal person-shareholders who
on 31 March 1992 were recorded as shareholders in
the shareholders’ register of Fugro, if in respect of
such a transfer or transmission the Board of
Management, with the approval of the Supervisory
Board, by an irrevocable resolution wholly or partially
lifted the restrictions limiting the transfer of
ordinary shares, to which lifting of restrictions
conditions may be attached.

81Corporate Governance
The objective of Stichting Beschermingspreferente
aandelen Fugro is to represent the interests of Fugro and
its enterprise, as well as the entities within the Fugro
Group, in such a way that the interests of Fugro as well as
the interests of all stakeholders, will be safeguarded as
best as possible. Any infl uences which could damage the
independence and/or continuity and/or identity of Fugro
and its associated companies to the detriment of those
interests are to be prevented as far as possible, as is the
execution of anything that is related to or could be
benefi cial to the above.
(The Board of) Stichting Beschermingspreferente
aandelen Fugro operates completely independent of
Fugro.
The (call) option on protective preference shares granted
by Fugro Consultants International N.V. and Fugro
Financial International N.V. to Stichting Continuïteit
Fugro has been approved by the AGM in 1999. The
objective of Stichting Continuïteit Fugro corresponds to
that of Stichting Beschermingspreferente aandelen Fugro.
The protective measures described above shall be put up,
especially in a takeover situation, when this is in the
interest of Fugro to protect its independence and also in
defi ning Fugro’s position in relation to that of the raider
and the raider’s plans and it creates the possibility, when
necessary, to look for alternatives. The protective
measures will not be put up to protect the Board of
Management’s own position. Due to the uncertainty
regarding the situations with which Fugro could be
confronted, the use of protective measures in
circumstances other than those described above cannot
be discounted.
Only (non-voting) certifi cates of shares are listed and
traded on Euronext Amsterdam. These exchangeable
certifi cates are issued by the Trust Offi ce and the Board of
the Trust Offi ce exercises the voting rights on the
underlying shares in such manner that the interests of
Fugro and its enterprise, as well as the interests of all
stakeholders, are safeguarded as best possible. For the
composition of the Board of the Trust Offi ce see page 178.
The (Board of the) Trust Offi ce operates completely
independent of Fugro.
Certifi cate holders (and their authorised proxies):
• may, after timely written notifi cation, attend and
speak at shareholders’ meetings;
• are entitled to request from the Trust Offi ce a proxy to
exercise the voting rights on the (underlying) shares
corresponding to their certifi cates. The Trust Offi ce
may solely limit, exclude or revoke this proxy if:
a) a public offer has been announced or made on the
(certifi cates of) shares of Fugro or if a justifi able
expectation prevails that such an offer shall be
made, without agreement thereon having
necessarily been reached with Fugro;
b) a holder of certifi cates or a number of holders of
certifi cates, in accordance with an agreement
between and among them to co-operate, together
or not, with subsidiaries, acquire at least twenty
fi ve per cent (25%) of the issued capital of Fugro; or
c) in the opinion of the Trust Offi ce, the exercise of
voting rights by a holder of certifi cates constitutes
a real confl ict of interests with those of Fugro;
• may, provided they are natural persons and they have
not entered into an agreement between and among
them to co-operate, exchange their certifi cates for
ordinary shares entitled to vote up to a maximum of
1% of the issued share capital of Fugro per shareholder.
A possible issue by Fugro of protective preference shares
will be to Stichting (‘Foundation’) Beschermings-
preferente aandelen Fugro. Fugro and Stichting
Beschermingspreferente aandelen Fugro have not entered
into an (call or put) option agreement with respect to the
cumulative protective preference shares. When a threat of
an unwanted takeover is such that an immediate issue of
protective preference shares to Stichting Beschermings-
preferente aandelen Fugro is desirable, the Board of
Management of Fugro should resolve on the issue of –
and/or on the granting of rights to subscribe for –
protective preference shares (see for details on the
authorisation to issue and to grant rights to subscribe for
shares page 83).

82
At least one (Annual) General Meeting is convened each
year. Extraordinary General Meetings are convened
as often as the Supervisory Board or the Board of
Management deems this necessary. The General Meeting
is chaired by the Chairman of the Supervisory Board.
The Supervisory Board and the Board of Management
provide the General Meeting with all the information
requested, unless there is a very good reason why
providing the information would not be in the interests of
Fugro.
A p p o i n t m e n t a n d d i s m i s s a l o f m e m b e r s o f
t h e B o a r d o f M a n a ge m e n t a n d S u p e r v i s o r y
B o a r d
The members of both the Board of Management and the
Supervisory Board are appointed by the General Meeting
for a maximum period of four years on a binding
nomination of the Supervisory Board. The binding nature
of such a nomination may, however, be overruled by a
resolution adopted by an absolute majority of the votes
cast by the General Meeting. This majority must represent
more than one third of the issued capital. If this
proportion of the capital is not represented at the
meeting, but an absolute majority of the votes cast is in
favour of a resolution to overrule the binding nature of
the nomination, a new meeting may be convened at
which the resolution may be passed by an absolute
majority of votes, regardless of the proportion of the
capital represented at the meeting.
Unless the resolution is proposed by the Supervisory
Board, the General Meeting may only pass a resolution
to suspend or dismiss a member of the Board of
Management or Supervisory Board with a majority of two-
thirds of the votes cast, which majority represents more
than one half of the issued capital. With regard to the
overruling of the binding nature of a nomination by the
Supervisory Board and the decision to suspend or dismiss
a member of the Board of Management or Supervisory
Board, convening a second General Meeting pursuant to
section 2:120, subsection 3, of the Dutch Civil Code shall
not be permitted.
O p t i o n s c h e m e
Fugro has an option scheme that was approved by the
AGM on 14 May 2008. Details of the option scheme are
described on page 12 of this Annual Report. Employee
options on ordinary shares are granted to the members of
the Board of Management and other employees in such
way that at any moment the maximum number of
outstanding options to acquire ordinary shares in Fugro
will not exceed 7.5% of the issued ordinary share capital.
In order to mitigate dilution, it is Fugro’s policy to
purchase own certifi cates of shares to cover the stock
option scheme with the result that no new (certifi cates of)
shares are issued when options are exercised. The total
number of options to be granted is subject to the approval
of the Supervisory Board as is the grant of options to
members of the Board of Management itself.
A g r e e m e n t s w i t h a s h a r e h o l d e r t h a t c o u l d
p r o v i d e a r e a s o n fo r l i m i t a t i o n o f t h e
t r a n s f e r o f ( c e r t i f i c a t e s o f ) s h a r e s
If article 11, sub 1 of the terms of administration of the
Trust Offi ce is applicable (see also above), exchange of
certifi cates into ordinary shares is only possible if the
holder of certifi cates who acquires ordinary shares in the
capital of Fugro as a result of the exchange, shall accept
the stipulations pursuant to article 11, sub 1 of the terms
of administration.
F u n c t i o n i n g o f t h e G e n e r a l M e e t i n g
The powers of the (Annual) General Meeting are stipulated
in legislation and in the articles of association of Fugro
and can be stated concisely as follows: approval of
decisions that would cause a major change to the identity
or character of Fugro or its business; appointment and
dismissal of members of the Board of Management and
of the Supervisory Board; adoption of the remuneration
policy for the members of the Board of Management;
approval of the stock option scheme for the members
of the Board of Management; determination of the
remuneration of members of the Supervisory Board;
adoption of the annual accounts; discharge of members
of the Board of Management and of the Supervisory
Board; approval of the profi t appropriation; authorisation
to acquire own shares, to issue shares (or to grant rights to
subscribe for shares) and to restrict or exclude pre-emptive
rights in respect of shares; and approval of decisions to
amend the articles of association or to dissolve Fugro.
In addition, the following is discussed in the (Annual)
General Meeting: the annual report, changes to the profi le
of the Supervisory Board, the dividend policy and
substantial changes in the corporate governance structure
of Fugro and in the compliance with the Code.

83Corporate Governance
Also on 6 May 2010 the AGM designated the Board
of Management as the corporate body which is
authorised for a period of 18 months as of 6 May 2010
until 6 November 2011, to, subject to the approval of
the Supervisory Board,
(a) resolve on the issue of – and/or on the granting of
rights to subscribe for – all preference shares –
including both the cumulative protective preference
shares and the different kinds of fi nancing preference
shares – and ordinary shares in which the authorised
capital is divided at the date of the relevant resolution;
(b) restrict and/or to exclude pre-emption rights that
accrue to shareholders upon issue of (grant of rights
to subscribe for) ordinary shares and/or fi nancing
preference shares.
The authorisation of the Board of Management with
respect to the issue of ordinary shares and /or to grant
rights to subscribe for ordinary shares was limited to 10%
of the issued share capital of Fugro at the time of the issue
plus an additional 10% of the issued capital of Fugro at the
time of the issue in connection with or on the occasion
of mergers and acquisitions.
Obviously the authorisation with respect to the issue of
preference shares and/or to grant rights to subscribe for
preference shares was not limited due to the objective
of these shares when they would be issued.
The Board of Management may resolve, with the approval
of the Supervisory Board, to dispose of (certifi cates of)
shares acquired by Fugro in its own capital.
C o n s e q u e n c e s o f p u b l i c b i d fo r m a j o r
a g r e e m e n t s
Fugro N.V. differentiates three categories of agreements
as referred to in the Decree on Article 10 EU Takeover
Directive:
a) Credit facility with The Royal Bank of Scotland Plc of
EUR 100 million for three years. This agreement was
implemented in 2009 and the facility has been fully
utilised. The facility may be cancelled in the event of
a ‘change of ownership’ of Fugro whereupon all or
part of the loans may become immediately due and
payable.
Credit facility with Rabobank of EUR 100 million for
fi ve years. This agreement was implemented in 2008
and the facility has been fully utilised. The facility may
be cancelled in the event of a ‘change of ownership’ of
Fugro whereupon all or part of the loans may become
immediately due and payable.
A m e n d m e n t o f t h e a r t i c l e s o f a s s o c i a t i o n
A resolution to amend the articles of association of Fugro
may be passed only on a proposal thereto of the Board of
Management with the prior approval of the Supervisory
Board and by a majority of at least two-thirds of the votes
cast at a General Meeting at which at least one-half of the
issued capital is represented. If at a meeting at which the
proposal to amend the articles of association is to be
considered, the required part of the capital is not
represented, then a second meeting may be convened to
be held at most twenty-eight days after the fi rst meeting,
at which second meeting the resolution to amend the
articles of association may be passed, irrespective of the
part of the capital represented at such meeting, provided
such resolution is adopted by a majority of at least two-
thirds of the votes cast.
Insofar as a resolution to amend the articles of association
brings about a change in the rights vested in the holders
of protective preference shares or the holders of fi nancing
preference shares or the holders of convertible fi nancing
preference shares, such a resolution shall require the
approval of the meeting of holders of protective
preference shares or the meeting of holders of fi nancing
preference shares or the meeting of the holders of
convertible fi nancing preference shares, as the case may
be.
Fugro’s articles of association were last amended on
28 June 2010 and are available on the website.
Au t h o r i s a t i o n o f t h e B o a r d o f M a n a ge m e n t
w i t h r e ga r d t o t h e a c q u i s i t i o n ( p u r c h a s e )
o f ow n s h a r e s a n d t h e i s s u e o f s h a r e s
Fugro regularly proposes to its shareholders to authorise
the Board of Management to acquire and to issue
(certifi cates of) shares.
On 6 May 2010 the AGM authorised the Board of
Management for a period of 18 months as from 6 May 2010
until 6 November 2011, to, subject to the approval of the
Supervisory Board, cause Fugro to purchase its own
(certifi cates of) shares, within the limits set by the then
articles of association (10% of the issued capital), either
through purchase on a stock exchange or otherwise, at a
price, excluding expenses, not lower than the nominal
value of the shares and not higher than 10% above the
average of the closing price of the certifi cates of the shares
on Euronext Amsterdam for the fi ve business days before
the day on which the purchase is made.

84
is entitled for every option to such securities, cash or
other property as to which a shareholder of Fugro is
entitled per share immediately prior to the
restructuring or merger, unless the option period is
shortened by Fugro. In the event of a restructuring of
its share capital or merger with another company,
Fugro may shorten the option period so as to
terminate immediately prior to the time at which the
restructuring or merger is effectuated. In the event
that a public offer is considered hostile and such offer
is declared unconditional, all options become
immediately exercisable.
Pa y m e n t t o m e m b e r s o f t h e B o a r d o f
M a n a ge m e n t o n t e r m i n a t i o n o f e m p l oy m e n t
r e s u l t i n g f r o m a p u b l i c b i d
Fugro has not entered into any agreements with members
of the Board of Management or employees that provide for
a specifi c severance pay on termination of employment as
a result of a public bid within the meaning of article 5:70
or 5:74 of the Dutch Financial Market Supervision Act. The
employment agreements with Messrs. Jonkman, Van Riel,
Rüegg and Steenbakker do – in accordance with the Code
– provide for a general severance pay amounting to a
maximum of one year’s salary which in principle is
applicable in the event of termination or annulment of
the employment agreement. These severance payments
are also applicable in the event that said persons in
reasonableness cannot continue to perform their
function any longer as result of a change in circumstances
such that continuing to fulfi l their function can no longer
be asked of them. This could be the case if Fugro is
wound-up, merged or taken over, or undergoes a far-
reaching restructuring or a fundamental change of policy.
The agreement with Mr. Wester does not provide for a
specifi c severance pay on termination of employment or
change of circumstances. This agreement was entered
into in 1981 (Mr. Wester was appointed to the Board of
Management in 1996) long before the Code came into
force. Fugro cannot rescind rights that have been granted
and Fugro respects agreements made before the
introduction of the Code in 2004.
C o r p o r a t e G o ve r n a n c e s t a t e m e n t
This is a statement concerning corporate governance as
referred to in article 2a of the decree on additional
requirements for annual reports (Vaststellingsbesluit
nadere voorschriften inhoud jaarverslag) effective as of
1 January 2010 (the ‘Decree’). The information required to
be included in this corporate governance statement as
described in articles 3, 3a and 3b of the Decree can be
found in the following chapters, sections and pages of this
Credit facility with Rabobank of EUR 100 million for
three years. This agreement was implemented in 2009
and the facility has been fully utilised. The facility may
be cancelled in the event of a ‘change of ownership’ of
Fugro whereupon all or part of the loans may become
immediately due and payable.
Credit facility with ING Bank N.V. of EUR 100 million
for three years. This agreement was implemented in
2009. The facility has almost been fully utilised. The
facility may be cancelled in the event of a ‘change of
ownership’ of Fugro whereupon all or part of the loans
may become immediately due and payable.
Credit facility with BNP Paribas S.A. of EUR 100 million
for three years. This agreement was implemented in
2009 and the facility has been fully utilised.
The facility may be cancelled in the event of a ‘change
of ownership’ of Fugro.
Credit facility with ABNAMRO Bank N.V. of EUR 50
million for two years. This agreement was
implemented in 2010 and the facility has been fully
utilised. The facility may be cancelled in the event of
a ‘change of ownership’ of Fugro.
b) Private Placement USD loans. As described in
paragraph 5.46.2 of the Annual Accounts, Fugro has
concluded long term loans with American and British
institutional investors. The terms and conditions of
these loans provide that Fugro may consolidate or
merge with any other person or legal entity if either a)
Fugro shall be the surviving or continuing person, or
b) the surviving, continuing or resulting person or
legal entity that purchases, acquires or otherwise
acquires all or substantially all of the assets of the
company i) is a solvent entity organised under the laws
of any approved jurisdiction (any of the following
jurisdictions: the Netherlands, The United States,
Canada and any country which is a member of the EU
(other than Greece) at the time of the date of the
agreement, ii) is engaged in any similar line of
business as Fugro and iii) expressly assumes the
obligations of Fugro under this agreement in a writing
which is in form and substance reasonably satisfactory
to the holders of at least 51% of the outstanding
principal amount of the notes.
c) Employee option agreements. The employee option
agreements stipulate that in the event of a
restructuring of the share capital of Fugro or a merger
of Fugro with any other legal entity, the option holder

85Corporate Governance
Annual Report 2010 and are deemed to be included and
repeated in this statement:
• the information concerning compliance with the
Dutch Corporate Governance Code, as required by
article 3 of the Decree, can be found in the chapter on
‘Corporate governance’;
• the information concerning Fugro’s main features of
the internal risk management and control systems
relating to the fi nancial reporting process, as required
by article 3a sub a of the Decree, can be found in the
chapter on ‘Risk management’;
• the information regarding the functioning of Fugro’s
General Meeting, and the authority and rights of
Fugro’s shareholders and holders of certifi cates of
shares, as required by article 3a sub b of the Decree,
can be found in the chapter on ‘Corporate governance’;
• the information regarding the composition and
functioning of Fugro’s Board of Management, the
Supervisory Board and its Committees, as required by
article 3a sub c of the Decree, can be found in the
relevant sections of the chapter on ‘Corporate
Governance’, the Report of the Supervisory Board and
on pages 14 and 20;
• the information concerning the disclosure of the
information required by the Decree on Article 10 EU
Takeover Directive, as required by article 3b of the
Decree, may be found in the chapter on ‘Corporate
Governance’.
This corporate governance statement is also available on
Fugro’s website.

86

1 Consolidated statement of comprehensive income 88
2 Consolidated statement of fi nancial position 90
3 Consolidated statement of changes in equity 91
4 Consolidated statement of cash fl ows 94
5 Notes to the consolidated fi nancial statements 96
6 Subsidiaries and investments of Fugro N.V.
accounted for using the equity method 166
7 Company balance sheet 169
8 Company income statement 170
9 Notes to the company fi nancial statements 171
10 Other information 176
10.1 Independent Auditor’s report 176
10.2 Subsequent events 178
10.3 Foundation Boards 178
10.4 Profi t appropriation 178
10.5 Proposal regarding the appropriation of profi t 179
Report of Stichting Administratiekantoor
Fugro (‘Fugro Trust Offi ce’) 180
Historic review 182
Glossary 184
F U G R O N . V.
A n n u a l a c c o u n t s 2 0 1 0

88
1 C o n s o l i d a t e d s t a t e m e n t o f c o m p r e h e n s i v e i n c o m eFor the year ended 31 December
(EUR x 1,000) 2010 2009
(5.25) Revenue 2,280,391 2,052,988
(5.28) Third party costs (765,587) (624,413)
Net revenue own services (revenue less third party costs) 1,514,804 1,428,575
(5.29) Other income 21,902 24,440
(5.30) Personnel expenses (723,141) (652,807)
(5.35) Depreciation (201,493) (173,593)
(5.36) Amortisation of intangible assets (8,111) (10,115)
(5.31) Other expenses (252,482) (249,078)
Results from operating activities (EBIT) 351,479 367,422
Finance income 28,239 7,174
Finance expenses (22,065) (27,541)
(5.32) Net fi nance income/(costs) 6,174 (20,367)
(5.38) Share of profi t of equity-accounted investees (net of income tax) 1,018 422
Profit before income tax 358,671 347,477
(5.33) Income tax expense (78,518) (74,412)
Profit for the period 280,153 273,065
Attributable to:
Owners of the Company 272,219 263,410
Non-controlling interests 7,934 9,655
Profit for the period 280,153 273,065
(5.45) Basic earnings per share (EUR) 3.47 3.46
(5.45) Diluted earnings per share (EUR) 3.42 3.42
The notes on pages 96 to 165 are an integral part of these consolidated fi nancial statements.

89Fugro Annual accounts 2010
1 C o n s o l i d a t e d s t a t e m e n t o f c o m p r e h e n s i v e i n c o m e ( c o n t i n u e d )For the year ended 31 December
(EUR x 1,000) 2010 2009
Profi t for the period 280,153 273,065
Other comprehensive income
(5.32) Foreign currency translation differences of foreign operations 108,638 47,517
(5.32) Foreign currency translation differences of equity-accounted investees 121 –
(5.32) Net change in fair value of hedge of net investment in foreign operations 864 1,788
(5.33) Defi ned benefi t plan actuarial gains (losses) 735 (10,449)
(5.32) Net change in fair value of cash fl ow hedges transferred to profi t or loss 1,034 1,034
(5.32) Net change in fair value of available-for-sale fi nancial assets (438) 1,879
Total other comprehensive income for the period (net of tax) 110,954 41,769
Total comprehensive income for the period 391,107 314,834
Attributable to:
Owners of the Company 382,289 305,342
Non-controlling interests 8,818 9,492
Total comprehensive income for the period 391,107 314,834
The notes on pages 96 to 165 are an integral part of these consolidated fi nancial statements.

90
2 C o n s o l i d a t e d s t a t e m e n t o f f i n a n c i a l p o s i t i o nAs at 31 December
(EUR x 1,000) 2010 2009
A s s e t s
(5.35) Property, plant and equipment 1,291,314 1,043,227
(5.36) Intangible assets 576,433 492,690
(5.38) Investments in equity-accounted investees 7,836 1,359
(5.39) Other investments 62,533 23,541
(5.40) Deferred tax assets 18,891 25,677
Total non-current assets 1,957,007 1,586,494
(5.41) Inventories 219,028 80,634
(5.42) Trade and other receivables 803,241 572,010
(5.34) Current tax assets 29,352 19,384
(5.43) Cash and cash equivalents 81,363 107,795
Total current assets 1,132,984 779,823
Total assets 3,089,991 2,366,317
E q u i t y
Share capital 4,014 3,939
Share premium 431,441 431,441
Reserves 800,644 488,941
Unappropriated result 272,219 263,410
Total equity attributable to owners of the Company 1,508,318 1,187,731
Non-controlling interests 14,929 11,779
(5.44) Total equity 1,523,247 1,199,510
L i a b i l i t i e s
(5.46) Loans and borrowings 590,862 441,339
(5.47) Employee benefi ts 76,100 72,582
(5.48) Provisions 5,204 6,240
(5.40) Deferred tax liabilities 14,780 7,124
Total non-current liabilities 686,946 527,285
(5.43) Bank overdraft 300,301 167,556
(5.46) Loans and borrowings 23,658 25,826
(5.49) Trade and other payables 474,208 350,043
Other taxes and social security charges 45,222 40,513
(5.34) Current tax liabilities 36,409 55,584
Total current liabilities 879,798 639,522
Total liabilities 1,566,744 1,166,807
Total equity and liabilities 3,089,991 2,366,317
The notes on pages 96 to 165 are an integral part of these consolidated fi nancial statements.

91Fugro Annual accounts 2010
3 C o n s o l i d a t e d s t a t e m e n t o f c h a n g e s i n e q u i t y
(EUR x 1,000) 2010
Share
capital
Share
premium
Trans-
lation
reserve
Hedging
reserve
Other
reserves
Reserve
for own
shares
Unappro-
priated
result Total
Non-con-
trolling
interest
Total
equity
Balance at 1 January 2010 3,939 431,441 (115,821) (4,545) 721,907 (112,600) 263,410 1,187,731 11,779 1,199,510
Total comprehensive income
for the period:
Profi t or (loss) 272,219 272,219 7,934 280,153
Other comprehensive income
(5.32) Foreign currency translation
differences of foreign operations 107,754 107,754 884 108,638
(5.32) Foreign currency translation
differences of equity-accounted
investees 121 121 121
(5.32) Net change in fair value of hedge
of net investment in foreign
operations 864 864 864
(5.33) Defi ned benefi t plan actuarial
gains (losses) 735 735 735
(5.32) Net change in fair value of
cash fl ow hedges transferred
to profi t or loss 1,034 1,034 1,034
(5.32) Net change in fair value of
available-for-sale fi nancial assets (438) (438) (438)
Total other comprehensive
income (net of tax) – – 108,739 1,034 297 – – 110,070 884 110,954
The notes on pages 96 to 165 are an integral part of these consolidated fi nancial statements.

92
3 C o n s o l i d a t e d s t a t e m e n t o f c h a n g e s i n e q u i t y ( c o n t i n u e d )
(EUR x 1,000) 2010
Share
capital
Share
premium
Trans-
lation
reserve
Hedging
reserve
Other
reserves
Reserve
for own
shares
Unappro-
priated
result Total
Non-con-
trolling
interest
Total
equity
Total comprehensive income
for the period – – 108,739 1,034 297 – 272,219 382,289 8,818 391,107
Transactions with owners
recognised directly in equity
Contributions by and
distributions to owners
(5.30) Share-based payments 12,654 12,654 12,654
Share options exercised 25,280 25,280 25,280
Addition to reserves 206,129 (206,129) – –
(5.44) Own shares acquired and stock
dividend 75 (35,760) (35,685) (35,685)
(5.44) Dividends to shareholders (57,281) (57,281) (4,499) (61,780)
Total contributions by and
distribution to owners 75 – – – 218,783 (10,480) (263,410) (55,032) (4,499) (59,531)
Changes in ownership interests
in subsidiaries
(5.26) Acquisition of non-controlling
interests without a change in
control (6,670) (6,670) (1,169) (7,839)
Total transactions with
owners of the Company 75 – – – 212,113 (10,480) (263,410) (61,702) (5,668) (67,370)
Balance at 31 December 2010 4,014 431,441 (7,082) (3,511) 934,317 (123,080) 272,219 1,508,318 14,929 1,523,247
The notes on pages 96 to 165 are an integral part of these consolidated fi nancial statements.
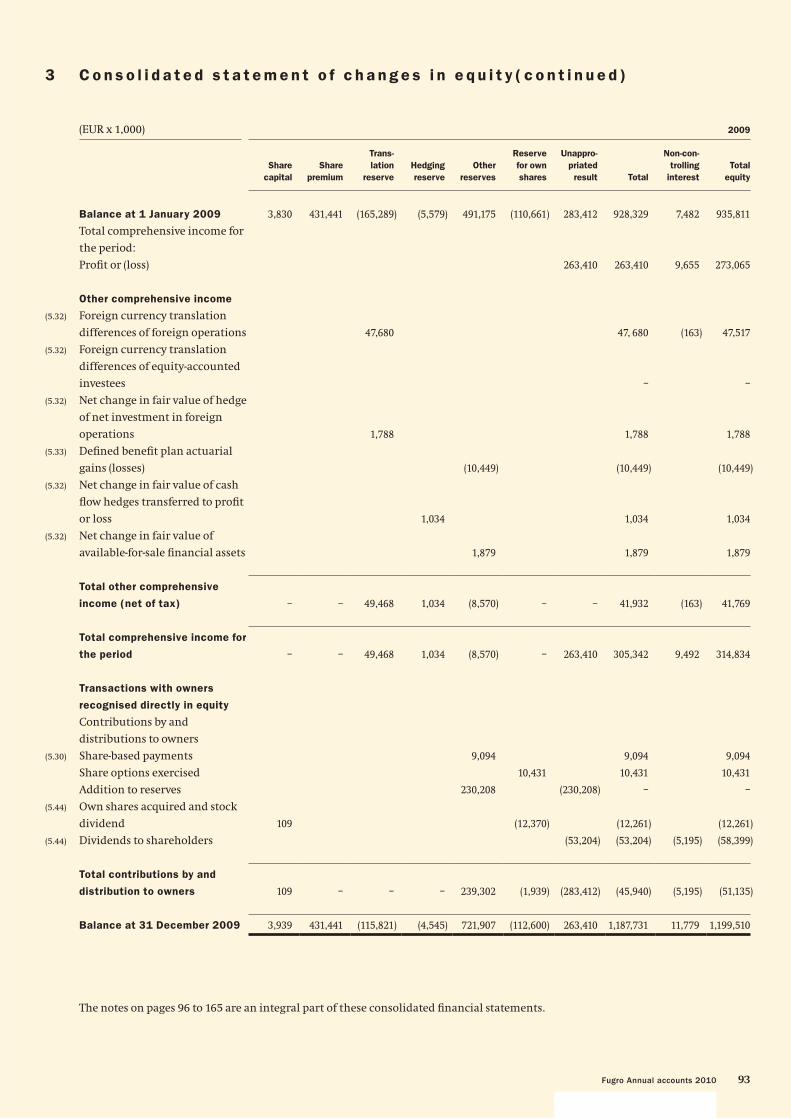
93Fugro Annual accounts 2010
3 C o n s o l i d a t e d s t a t e m e n t o f c h a n g e s i n e q u i t y ( c o n t i n u e d )
(EUR x 1,000) 2009
Share
capital
Share
premium
Trans-
lation
reserve
Hedging
reserve
Other
reserves
Reserve
for own
shares
Unappro-
priated
result Total
Non-con-
trolling
interest
Total
equity
Balance at 1 January 2009 3,830 431,441 (165,289) (5,579) 491,175 (110,661) 283,412 928,329 7,482 935,811
Total comprehensive income for
the period:
Profi t or (loss) 263,410 263,410 9,655 273,065
Other comprehensive income
(5.32) Foreign currency translation
differences of foreign operations 47,680 47, 680 (163) 47,517
(5.32) Foreign currency translation
differences of equity-accounted
investees – –
(5.32) Net change in fair value of hedge
of net investment in foreign
operations 1,788 1,788 1,788
(5.33) Defi ned benefi t plan actuarial
gains (losses) (10,449) (10,449) (10,449)
(5.32) Net change in fair value of cash
fl ow hedges transferred to profi t
or loss 1,034 1,034 1,034
(5.32) Net change in fair value of
available-for-sale fi nancial assets 1,879 1,879 1,879
Total other comprehensive
income (net of tax) – – 49,468 1,034 (8,570) – – 41,932 (163) 41,769
Total comprehensive income for
the period – – 49,468 1,034 (8,570) – 263,410 305,342 9,492 314,834
Transactions with owners
recognised directly in equity
Contributions by and
distributions to owners
(5.30) Share-based payments 9,094 9,094 9,094
Share options exercised 10,431 10,431 10,431
Addition to reserves 230,208 (230,208) – –
(5.44) Own shares acquired and stock
dividend 109 (12,370) (12,261) (12,261)
(5.44) Dividends to shareholders (53,204) (53,204) (5,195) (58,399)
Total contributions by and
distribution to owners 109 – – – 239,302 (1,939) (283,412) (45,940) (5,195) (51,135)
Balance at 31 December 2009 3,939 431,441 (115,821) (4,545) 721,907 (112,600) 263,410 1,187,731 11,779 1,199,510
The notes on pages 96 to 165 are an integral part of these consolidated fi nancial statements.

94
4 C o n s o l i d a t e d s t a t e m e n t o f c a s h f l o w sFor the year ended 31 December
(EUR x 1,000) 2010 2009
C a s h f l ow s f r o m o p e r a t i n g a c t i v i t i e s
Profi t for the period 280,153 273,065
Adjustments for:
(5.35) Depreciation 201,493 173,593
(5.36) Amortisation of intangible assets 8,111 10,115
Amortisation of transaction costs related to loans and borrowings 838 322
(5.32) Net fi nance costs (excluding net foreign exchange variance and net
change in fair value of fi nancial assets at fair value through profi t or loss) 11,058 5,370
(5.38) Share of profi t of equity-accounted investees (1,018) (422)
(5.32) Net change in fair value of fi nancial assets at fair value through
profi t or loss (22,337) 1,639
Gain on sale of property, plant and equipment (3,050) (2,932)
(5.30) Equity-settled share-based payments 12,654 9,094
(5.33) Income tax expense 78,518 74,412
Operating cash flows before changes in working capital and provisions 566,420 544,256
Change in inventories (124,464) (37,990)
Change in trade and other receivables (177,915) 26,867
Change in trade and other payables 77,286 (7,156)
Change in provisions and employee benefi ts 1,107 3,867
342,434 529,844
Interest paid (17,330) (13,883)
Income tax paid (97,987) (92,328)
Net cash from operating activities 227,117 423,633
C a s h f l ow s f r o m i n ve s t i n g a c t i v i t i e s
Proceeds from sale of property, plant and equipment 25,945 14,951
Proceeds from sale of other investments 436 98
(5.32) Interest received 4,853 4,862
(5.32) Dividends received 1,049 2,312
(5.26) Acquisition of subsidiaries, net of cash acquired (53,634) (31,923)
(5.26) Acquisition of non-controlling interest (7,839) –
(5.35) Acquisition of property, plant and equipment (443,824) (320,362)
(5.35) Change in assets under construction 44,803 (29,340)
(5.36) Acquisition of intangible assets (13,742) (694)
(5.36) Internal developed intangible assets (8,486) (5,893)
Investment in equity-accounted investees (69) –
(5.39) Acquisition of other investments (14,091) (20,490)
Net cash from investing activities (464,599) (386,479)
The notes on pages 96 to 165 are an integral part of these consolidated fi nancial statements.
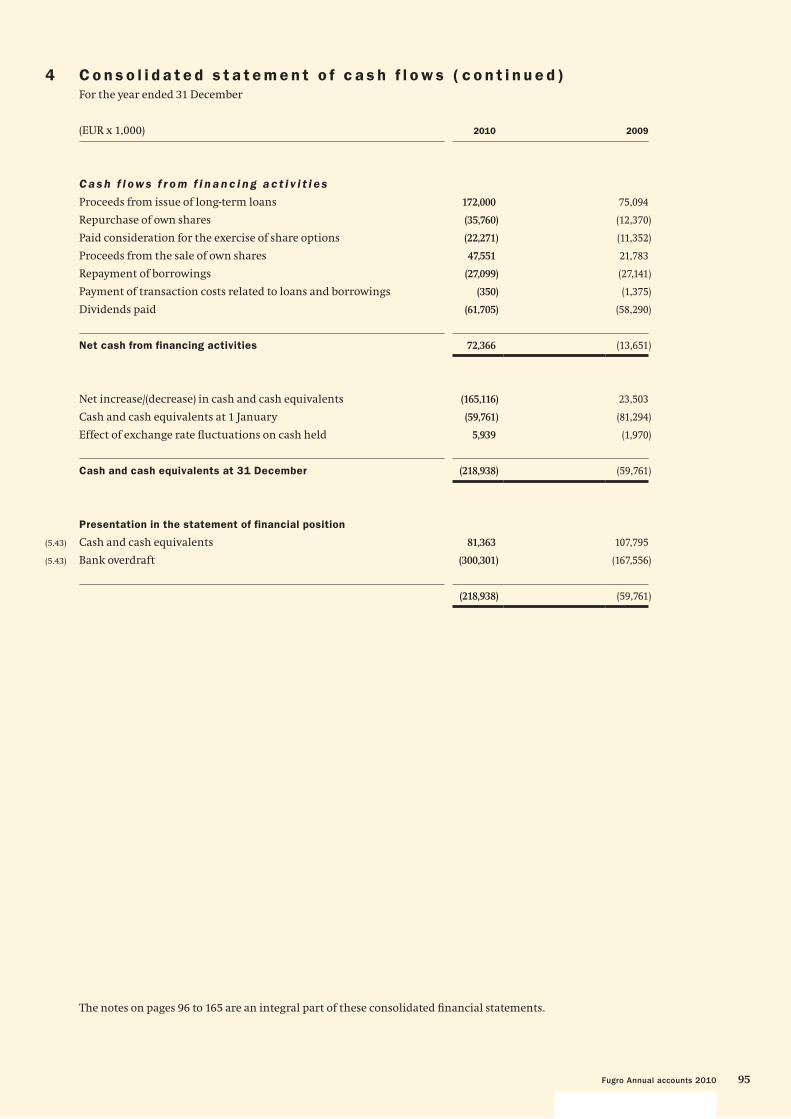
95Fugro Annual accounts 2010
4 C o n s o l i d a t e d s t a t e m e n t o f c a s h f l o w s ( c o n t i n u e d )For the year ended 31 December
The notes on pages 96 to 165 are an integral part of these consolidated fi nancial statements.
(EUR x 1,000) 2010 2009
C a s h f l ow s f r o m f i n a n c i n g a c t i v i t i e s
Proceeds from issue of long-term loans 172,000 75,094
Repurchase of own shares (35,760) (12,370)
Paid consideration for the exercise of share options (22,271) (11,352)
Proceeds from the sale of own shares 47,551 21,783
Repayment of borrowings (27,099) (27,141)
Payment of transaction costs related to loans and borrowings (350) (1,375)
Dividends paid (61,705) (58,290)
Net cash from financing activities 72,366 (13,651)
Net increase/(decrease) in cash and cash equivalents (165,116) 23,503
Cash and cash equivalents at 1 January (59,761) (81,294)
Effect of exchange rate fl uctuations on cash held 5,939 (1,970)
Cash and cash equivalents at 31 December (218,938) (59,761)
Presentation in the statement of financial position
(5.43) Cash and cash equivalents 81,363 107,795
(5.43) Bank overdraft (300,301) (167,556)
(218,938) (59,761)

96
5.1 G e n e r a l
Fugro N.V., hereinafter to be referred to as ‘Fugro’ or ‘the Company’, has its corporate seat in Leidschendam,
the Netherlands. The consolidated fi nancial statements of Fugro as at and for the year ended 31 December 2010
include Fugro and its subsidiaries (together referred to as the ‘Group’) and the Group’s interests in equity-
accounted investees. A summary of the main subsidiaries is included in chapter 6. The annual accounts have
been prepared by the Board of Management and have been authorised for publication by the Supervisory Board
on 9 March 2011. Publication will take place on 10 March 2011. The annual accounts will be submitted for
adoption to the Annual General Meeting of Shareholders on 10 May 2011. The offi cial annual accounts are
prepared in the Dutch language. With reference to the Company income statement of Fugro N.V., use has been
made of the exemption pursuant to Article 2:402 Netherlands Civil Code.
5.2 S t a t e m e n t o f c o m p l i a n c e
The consolidated fi nancial statements have been prepared in accordance with International Financial Reporting
Standards (IFRS) as adopted by the European Union (EU-IFRS) and with Part 9 of Book 2 of the Netherlands Civil
Code.
5.3 B a s i s o f p r e p a r a t i o n
5.3.1 Functional and presentation currency
The fi nancial statements are presented in EUR x 1,000, unless mentioned otherwise. The Euro is the functional
and presentation currency of the Company.
5.3.2 Basis of measurement
The fi nancial statements have been prepared on the basis of historical cost, except that the following assets and
liabilities are stated at their fair value: derivative fi nancial instruments, fi nancial instruments at fair value
through profi t or loss, available-for-sale fi nancial assets and plan assets associated with defi ned benefi t plans.
5.3.3 Use of estimates and judgements
The preparation of the consolidated fi nancial statements requires management to make judgements, estimates
and assumptions that affect the application of accounting policies and the reported amounts of assets,
liabilities, income and expenses. Actual results may differ materially from these estimates. The estimates and
associated assumptions are based on historical experience and various other factors that are believed to be
reasonable under the circumstances, the result of which form the basis of making the judgements about the
carrying values of the assets and liabilities that are not readily apparent from other sources. The estimates and
the underlying assumptions are reviewed on an ongoing basis. Revisions to accounting estimates are recognised
in the period in which the estimates are revised, if the revision affects only that period, or in the period of the
revision and future periods if the revision affects both current and future periods.
Key sources of estimation uncertainty and references to the notes which include information about assumptions
and estimation uncertainties that have a signifi cant risk of resulting in a material adjustment within the next
fi nancial year are included in note 5.60.
5.3.4 Changes in accounting policies
5.3.4.1 Accounting for business combinations
From 1 January 2010 the Group has applied IFRS 3 Business Combinations (2008) in accounting for business
combinations. The change in accounting policy has been applied prospectively and has had no material impact
on earnings per share.
5 N o t e s t o t h e c o n s o l i d a t e d f i n a n c i a l s t a t e m e n t s

97Fugro Annual accounts 2010
Business combinations are accounted for using the acquisition method as at the acquisition date, which is the
date on which control is transferred to the Group. Control is the power to govern the fi nancial and operating
policies of an entity so as to obtain benefi ts from its activities. In assessing control, the Group takes into
consideration potential voting rights that currently are exercisable.
Acquisitions on or after 1 January 2010
For acquisitions on or after 1 January 2010, the Group measures goodwill at the acquisition date as:
– the fair value of the consideration transferred; plus
– the recognised amount of any non-controlling interests in the acquiree; plus
the fair value of the existing equity interest in the acquiree, if the business combination is in stages; less
– the net recognised amount (generally fair value) of the identifi able assets acquired and liabilities assumed.
When the excess is negative, a bargain purchase gain is recognised immediately in profi t or loss.
The consideration transferred does not include amounts related to the settlement of pre-existing relationships.
Such amounts are generally recognised in profi t or loss.
Costs related to the acquisition, other than those associated with the issue of debt or equity securities, that the
Group incurs in connection with a business combination are expensed as incurred.
Any contingent consideration payable is recognised at fair value at the acquisition date. If the contingent
consideration is classifi ed as equity, it is not re-measured and settlement is accounted for within equity.
Otherwise, subsequent changes to the fair value of the contingent consideration are recognised in profi t or loss.
When share-based payment awards (replacement awards) are required to be exchanged for awards held by the
acquiree’s employees (acquiree’s awards) and relate to past services, then all or a portion of the amount of the
acquirer’s replacement awards is included in measuring the consideration transferred in the business
combination. This determination is based on the market-based value of the replacement awards compared with
the market-based value of the acquiree’s awards and the extent to which the replacement awards relate to past
and/or future service.
Acquisitions between 1 January 2003 and 1 January 2010
For acquisitions between 1 January 2003 and 1 January 2010, goodwill represents the excess of the cost of the
acquisition over the Group’s interest in the recognised amount (generally fair value) of the identifi able assets,
liabilities and contingent liabilities of the acquiree. When the excess was negative, a bargain purchase gain was
recognised immediately in profi t or loss.
Transaction costs, other than those associated with the issue of debt or equity securities, that the Group incurred
in connection with business combinations were capitalised as part of the cost of the acquisition.
Acquisitions prior to 1 January 2003 (date of transition to IFRS)
As part of its transition to IFRS, the Group elected to restate only those business combinations that occurred on
or after 1 January 2003. In respect of acquisitions prior to 1 January 2003, goodwill represents the amount
recognised under the Group’s previous accounting framework, Dutch GAAP.

98
5.3.4.2 Accounting for acquisitions of non-controlling interests
From 1 January 2010 the Group has applied IAS 27 Consolidated and Separate Financial Statements (2008) in
accounting for acquisitions of non-controlling interests. The change in accounting policy has been applied
prospectively and has had no impact on earnings per share.
Under the new accounting policy, acquisitions of non-controlling interests are accounted for as transactions
with owners in their capacity as owners and therefore no goodwill is recognised as a result of such transactions.
The adjustments to non-controlling interests are based on a proportionate amount of the net assets of the
subsidiary.
Previously, goodwill was recognised on the acquisition of non-controlling interests in a subsidiary, which
represented the excess of the cost of the additional investment over the carrying amount of the interest in the
net assets acquired at the date of the transaction.
5.3.5 New standards and interpretations not yet adopted
A number of new standards, amendments to standards and interpretations are effective for annual periods
beginning after 1 January 2010, and have not been applied in preparing these consolidated fi nancial statements.
None of these is expected to have a signifi cant effect on the consolidated fi nancial statements of Fugro, except for
IFRS 9 Financial Instruments, which becomes mandatory for the 2013 consolidated fi nancial statements and
could change the classifi cation and measurement of fi nancial assets. Fugro does not plan to adopt this standard
early and the extent of the impact has not been determined.
5.4 S i g n i f i c a n t a c c o u n t i n g p o l i c i e s
The accounting policies set out below have been consistently applied by all subsidiaries and equity-accounted
investees to all periods presented in these consolidated fi nancial statements, except as explained in note 5.3.4,
which addresses changes in accounting policies. Some comparative information is restated for comparison
purposes, including among others the presentation of fair value of acquired property, plant and equipment and
intangible assets through business combinations (net presentation of fair value instead of presenting historical
cost and cumulative amortisation/depreciation), furthermore, a footnote explaining the nature of any
differences between the reportable segments assets and liabilities and the Group’s assets and liabilities and a
footnote explaining total assets, liabilities, revenues and profi t (loss) of the equity-accounted investees have been
included.
5.4.1 Basis of consolidation
5.4.1.1 Business combinations
The Group has changed its accounting policy with respect to accounting for business combinations. Refer to note
5.3.4.1 for further details.
5.4.1.2 Subsidiaries
Subsidiaries are those entities controlled by the Group, taking into account the impact of potential voting rights
that are presently exercisable. Control exists when the Group has the power, directly or indirectly, to govern the
fi nancial and operating policies of an entity so as to obtain benefi ts from its activities. The fi nancial statements
of subsidiaries are included in the consolidated fi nancial statements from the date that control commences
until the date that control ceases.
The accounting policies of subsidiaries have been changed when necessary to align them with the policies
adopted by the Group. Losses applicable to the non-controlling interests in a subsidiary are allocated to the non-
controlling interests even if doing so causes the non-controlling interests to have a defi cit balance.

99Fugro Annual accounts 2010
5.4.2 Equity-accounted investees
Equity-accounted investees are those entities in which the Group has signifi cant infl uence, but not control, over
the fi nancial and operating policies. Signifi cant infl uence is presumed to exist when the Group holds between
20% and 50% of the voting power of another entity. Refer to note 5.10 for the accounting policy for equity-
accounted investees.
5.4.3 Other investments
Other investments are those entities in whose activities the Group holds a non-controlling interest and has no
control or signifi cant infl uence. Refer to note 5.11 for the accounting policy for other investments.
5.4.4 Transactions eliminated on consolidation
Intra-group balances and transactions, and any unrealised income and expenses arising from intra-group
transactions, are eliminated in preparing the consolidated fi nancial statements. Unrealised gains arising from
transactions with equity-accounted investees are eliminated against the investment to the extent of the Group’s
interest in the investee. Unrealised losses are eliminated in the same way as unrealised gains, but only to the
extent that there is no evidence of impairment.
5.5 Fo r e i g n c u r r e n c y
5.5.1 Foreign currency transactions and translation
Transactions in foreign currencies are translated to the respective functional currencies of Group entities at
exchange rates at the dates of the transactions.
Monetary assets and liabilities denominated in foreign currencies at the reporting date are retranslated to the
respective functional currency at the foreign exchange rate at that date. The foreign currency gain or loss on
monetary items is the difference between amortised cost in the functional currency at the beginning of the year,
adjusted for effective interest and payments during the year, and the amortised cost in foreign currency
translated at the exchange rate at the end of the year.
Non-monetary assets and liabilities that are measured in terms of historical cost in a foreign currency are
translated using the exchange rate at the date of the transaction. Non-monetary assets and liabilities
denominated in foreign currencies that are measured at fair value are retranslated to the functional currency at
foreign exchange rates effective at the date the fair value was determined. Foreign currency differences arising
on retranslation are recognised in profi t or loss, except for differences arising on the retranslation of available-
for-sale equity investments, a fi nancial liability designated as a hedge of the net investment in a foreign
operation that is effective, or qualifying cash fl ow hedges, which are recognised in other comprehensive income.

100
A summary of the main currency exchange rates applied in the year under review and the preceding years reads
as follows:
USD at
year-end
USD
average
GBP at
year-end
GBP
average
NOK at
year-end
NOK
average
2010 0.75 0.76 1.16 1.17 0.128 0.125
2009 0.69 0.72 1.13 1.13 0.121 0.115
2008 0.71 0.68 1.05 1.25 0.102 0.121
2007 0.68 0.73 1.36 1.46 0.126 0.125
2006 0.76 0.79 1.49 1.47 0.121 0.124
5.5.2 Foreign operations
The assets and liabilities of foreign operations, including goodwill and fair value adjustments arising on
acquisition, are translated to EUR at foreign exchange rates effective at the reporting date. The income and
expenses of foreign operations are translated to EUR at exchange rates effective at the dates of the transactions.
Foreign currency differences are recognised in other comprehensive income, and presented in the foreign
currency translation reserve for foreign operations (Translation reserve) in equity. However, if the operation is a
non-wholly-owned subsidiary, then the relevant proportionate share of the translation difference is allocated to
the non-controlling interests. When a foreign operation is disposed of, such that control, signifi cant infl uence or
joint control is lost, the cumulative amount in the translation reserve related to that foreign operation is
reclassifi ed to profi t or loss as part of the gain or loss on disposal. When the Group disposes of only part of its
interest in a subsidiary that includes a foreign operation while retaining control, the relevant proportion of the
cumulative amount is reattributed to non-controlling interests. If the Group disposes of only part of its
investment in an equity-accounted investee that includes a foreign operation while retaining signifi cant
infl uence or joint control, the relevant proportion of the cumulative amount is reclassifi ed to profi t or loss.
If the settlement of a monetary item, receivable from or payable to a foreign operation, is neither planned nor
likely in the foreseeable future, foreign exchange gains and losses arising from such a monetary item are
considered to form part of a net investment in a foreign operation and are recognised in other comprehensive
income, and presented in the Translation reserve in equity.
5.5.3 Hedge of a net investment in foreign operations
The Group applies hedge accounting to foreign currency differences arising between the functional currency of
the foreign operation and the functional currency of Fugro (EUR), regardless of whether the net investment is
held directly or through an intermediate parent.
Foreign currency differences arising on the (re-)translation of a fi nancial liability designated as a hedge of a net
investment in a foreign operation are recognised in other comprehensive income to the extent that the hedge is
effective, and are presented within equity in the Translation reserve. To the extent that the hedge is ineffective,
such differences are recognised in profi t or loss. When the hedged part of a net investment is disposed of,
the relevant amount in the Translation reserve is transferred to profi t or loss as part of the profi t or loss on
disposal.

101Fugro Annual accounts 2010
5.6 D e t e r m i n a t i o n o f f a i r va l u e s
Some of the Group’s accounting policies and disclosures require the determination of fair values, for both
fi nancial and non-fi nancial assets and liabilities. Fair values have been determined for measurement and/or
disclosure purposes based on the following methods. When applicable, additional information on the
determination of fair values is disclosed in the notes of the specifi c asset or liability.
5.6.1 Property, plant and equipment
The fair value of property, plant and equipment recognised as a result of a business combination is the estimated
amount for which a property could be exchanged on the date of acquisition between a willing buyer and a
willing seller in an arm’s length transaction after proper marketing wherein the parties had each acted
knowledgeably, prudently and without compulsion. The fair value of items of plant, equipment, fi xtures and
fi ttings is based on the market approach and cost approach using quoted market prices for similar items when
available and replacement cost when appropriate. Depreciated replacement cost estimates refl ect adjustments
for physical deterioration as well as functional and economic obsolescence.
5.6.2 Intangible assets
The fair value of patents and trademarks acquired in a business combination is based on the discounted
estimated royalty payments that have been avoided as a result of the patent or trademark being owned. The fair
value of customer relationships acquired in a business combination is determined using the multi-period excess
earnings method, whereby the subject asset is valued after deducting a fair return on all other assets that are
part of creating the related cash fl ows. The fair value of other intangible assets is based on the discounted cash
fl ows expected to be derived from the use and eventual sale of the assets.
5.6.3 Inventories
The fair value of inventories (including seismic and geological libraries) acquired in a business combination is
determined based on the estimated selling price in the ordinary course of business less the estimated costs of
completion and sale, and a reasonable profi t margin based on the effort required to complete and sell the
inventories.
5.6.4 Investments in equity and debt securities
The fair value of equity and debt securities is determined by reference to their quoted closing bid price at the
reporting date, or if unquoted, determined using a valuation technique. Valuation techniques applied include
market multiples and discounted cash fl ow analysis using expected future cash fl ows and a market-related
discount rate. The fair value of held to maturity investments is determined for disclosure purposes only.
5.6.5 Trade and other receivables
The fair value of trade and other receivables, is estimated at the present value of future cash fl ows, discounted at
the market rate of interest at the reporting date. This fair value is determined for disclosure purposes or when
acquired in a business combination.
102
5.6.6 Derivatives
The fair value of forward exchange contracts is based on their quoted price, if available. If a quoted price is not
available, then fair value is estimated by discounting the difference between the contractual forward price and
the current forward price for the residual maturity of the contract using a risk-free interest rate (based on
government bonds).
Fair values refl ect the credit risk of the instrument and include adjustments to take account of the credit risk of
the Group entity and counterparty when appropriate.
5.6.7 Non-derivative financial liabilities
Fair value, which is determined for disclosure purposes, is calculated based on the present value of future
principal and interest cash fl ows, discounted at the market rate of interest at the reporting date.
5.6.8 Share-based payment transactions
The fair value of the employee share options are measured using a binomial model. Measurement inputs include
the share price on the measurement date (year-end date of the year of granting), the exercise price of the
instrument, expected volatility (based on an evaluation of the historic volatility of Fugro’s (certifi cates of) shares,
particularly over the historic period commensurate with the expected term), expected term of the instruments
(based on historical experience and general option holder behaviour), expected dividends, and the risk-free
interest rate (based on government bonds). Service and non-market performance conditions attached to the
transactions are not taken into account in determining fair value.
5.7 F i n a n c i a l i n s t r u m e n t s
5.7.1 Non-derivative financial assets
The Group initially recognises loans and receivables and deposits on the date that they are originated. All other
fi nancial assets (including assets designated at fair value through profi t or loss) are recognised initially on the
trade date, which is the date that the Group becomes a party to the contractual provisions of the instrument.
The Group derecognises a fi nancial asset when the contractual rights to the cash fl ows from the asset expire,
or it transfers the rights to receive the contractual cash fl ows on the fi nancial asset in a transaction in which
substantially all the risks and rewards of ownership of the fi nancial asset are transferred. Any interest in
transferred fi nancial assets that is created or retained by the Group is recognised as a separate asset or liability.
Financial assets and liabilities are offset and the net amount presented in the statement of fi nancial position
when, and only when, the Group has a legal right to offset the amounts and intends either to settle on a net basis
or to realise the asset and settle the liability simultaneously.
The Group classifi es non-derivative fi nancial assets into the following categories: fi nancial assets at fair value
through profi t or loss, held-to-maturity fi nancial assets, loans and receivables and available-for-sale fi nancial
assets. Reference is made to note 5.11.
5.7.2 Non-derivative financial liabilities
The Group initially recognises debt securities issued and subordinated liabilities on the date that they are
originated. All other fi nancial liabilities (including liabilities designated at fair value through profi t or loss) are
recognised initially on the trade date, which is the date that the Group becomes a party to the contractual
provisions of the instrument.

103Fugro Annual accounts 2010
The Group derecognises a fi nancial liability when its contractual obligations are discharged, cancelled or expire.
Financial liabilities and assets are offset and the net amount presented in the statement of fi nancial position
when, and only when, the Group has a legal right to offset the amounts and intends either to settle on a net basis
or to realise the asset and settle the liability simultaneously.
Other fi nancial liabilities are recognised initially at fair value plus any directly attributable transaction costs.
Subsequent to initial recognition, these fi nancial liabilities are measured at amortised cost using the effective
interest method.
Other fi nancial liabilities comprise loans and borrowings, bank overdrafts, and trade and other payables.
Reference is made to note 5.14 cash and cash equivalents and note 5.20 Trade and other payables.
5.7.3 Derivative financial instruments, including hedge accounting
The Group holds derivative fi nancial instruments to hedge its exposure to foreign exchange risks arising from
operational and fi nancing activities. In accordance with its treasury policy, the Group does not hold or issue
derivative fi nancial instruments for trading purposes. Derivatives that do not qualify for hedge accounting are
accounted for as trading instruments.
Embedded derivatives are separated from the host contract and accounted for separately if the economic
characteristics and risks of the host contract and the embedded derivative are not closely related, a separate
instrument with the same terms as the embedded derivative would meet the defi nition of a derivative, and the
combined instrument is not measured at fair value through profi t or loss.
On initial designation of the derivative as the hedging instrument, the Group formally documents the
relationship between the hedging instrument and hedged item, including the risk management objectives and
strategy in undertaking the hedge transaction and the hedged risk, together with the methods that will be used
to assess the effectiveness of the hedging relationship. The Group makes an assessment, both at the inception of
the hedge relationship as well as on an ongoing basis, of whether the hedging instruments are expected to be
‘highly effective’ in offsetting the changes in the fair value or cash fl ows of the respective hedged items
attributable to the hedged risk, and whether the actual results of each hedge are within a range of 80-125 %.
For a cash fl ow hedge of a forecast transaction, the transaction should be highly probable to occur and should
present an exposure to variations in cash fl ows that could ultimately affect reported profi t or loss.
Derivatives are recognised initially at fair value; attributable transaction costs are recognised in profi t or loss as
incurred. Subsequent to initial recognition, derivatives are measured at fair value, and changes therein are
accounted for as described below.
5.7.3.1 Cash flow hedges
When a derivative is designated as the hedging instrument in a hedge of the variability in cash fl ows attributable
to a particular risk associated with a recognised asset or liability or a highly probable forecast transaction that
could affect profi t or loss, the effective portion of changes in the fair value of the derivative is recognised in other
comprehensive income and presented in the Hedging reserve in equity.
The amount recognised in the Hedging reserve is removed and included in profi t or loss in the same period as the
hedged cash fl ows affect profi t or loss under the same line item in the statement of comprehensive income as the
hedged item. Any ineffective portion of changes in the fair value of the derivative is recognised immediately in
profi t or loss.

104
If the hedging instrument no longer meets the criteria for hedge accounting, expires or is sold, terminated or
exercised, or the designation is revoked, then hedge accounting is discontinued prospectively. The cumulative
gain or loss previously recognised in other comprehensive income and presented in the Hedging reserve in
equity remains there until the forecast transaction affects profi t or loss. When the hedged item is a non-fi nancial
asset, the amount accumulated in equity is included in the carrying amount of the asset when the asset is
recognised. If the forecast transaction is no longer expected to occur, then the balance in equity is reclassifi ed in
profi t or loss.
5.7.3.2 Other non-trading derivatives
When a derivative fi nancial instrument is not designated in a hedge relationship that qualifi es for hedge
accounting, all changes in its fair value are recognised immediately in profi t or loss.
5.8 P r o p e r t y , p l a n t a n d e q u i p m e n t
5.8.1 Owned assets
Items of property, plant and equipment are measured at cost less accumulated depreciation and accumulated
impairment losses (refer accounting policy 5.15). The cost of property, plant and equipment includes expenditure
that is directly attributable to the acquisition of the asset. The cost of self-constructed assets includes the costs of
materials and direct labour, any other costs directly attributable to bringing the assets to a working condition for
their intended use, the costs of dismantling and removing the items and restoring the site on which they are
located, and capitalised borrowing costs. Cost also may include transfers from equity of any gain or loss on
qualifying cash fl ow hedges of foreign currency purchases of property, plant and equipment. Purchased software
that is integral to the functionality of the related equipment is capitalised as part of that equipment.
Property, plant and equipment that is being constructed or developed for future use is classifi ed as property,
plant and equipment under construction and stated at cost until construction or development is complete, at
which time it is reclassifi ed as land and buildings, plant and equipment, vessels or other property, plant and
equipment.
When parts of an item of property, plant and equipment have different useful lives, they are accounted for as
separate items (major components) of property, plant and equipment.
The gain or loss on disposal of an item of property, plant and equipment is determined by comparing the
proceeds from disposal with the carrying amount of the property, plant and equipment, and is recognised net
within ‘other income’ or ‘other expenses’ in profi t or loss.
5.8.2 Leased assets
Leases in terms of which the Group assumes substantially all the risks and rewards of ownership are classifi ed as
fi nance leases. Upon initial recognition the leased asset is measured at an amount equal to the lower of its fair
value and the present value of the minimum lease payments.
Subsequent to initial recognition, the asset is accounted for in accordance with the accounting policy applicable
to that asset. Other leases are operating leases and are not recognised in the Group’s statement of fi nancial
position. Lease payments are accounted for as described in accounting policy 5.22.2.
5.8.3 Subsequent cost
The cost of replacing a component of an item of property, plant and equipment is recognised in the carrying
amount of the item if it is probable that the future economic benefi ts embodied within the component will fl ow
to the Group, and its cost can be measured reliably. The carrying amount of the replaced component is
derecognised. The costs of the day-to-day servicing of property, plant and equipment are recognised in profi t or
loss as incurred.

105Fugro Annual accounts 2010
5.8.4 Depreciation
Depreciation is based on the cost of an asset less its residual value. Signifi cant components of individual assets
are assessed and if a component has a useful life that is different from the remainder of that asset, that
component is depreciated separately. Depreciation is recognised in profi t or loss on a straight-line basis over the
estimated useful lives of each component of an item of property, plant and equipment. Leased assets are
depreciated over the shorter of the lease term and their useful lives unless it is reasonably certain that the Group
will obtain ownership by the end of the lease term. Depreciation methods, useful lives and residual values are
reviewed at each reporting date and adjusted if appropriate. The estimated useful lives for the current and
comparative period of the different items of property, plant and equipment are as follows:
Category Years
Land and buildings
Land Infi nite
Buildings 20 – 40
Fixtures and fi ttings 5 – 10
Vessels
Vessels and jack-ups 2 – 25
Plant and equipment
Plant and equipment 4 – 10
Survey equipment 3 – 5
Aircraft 5 – 10
AUVs and ROVs 6 – 7
Computers and offi ce equipment 3 – 4
Transport equipment 4
Other
Maintenance 3 – 5
Used plant and machinery 1 – 2
5.9 I n t a n g i b l e a s s e t s
5.9.1 Goodwill
Goodwill that arises upon the acquisition of subsidiaries is included in intangible assets. For the measurement
of goodwill at initial recognition, refer to note 5.3.4.1 Accounting for business combinations.
Goodwill is measured at cost less accumulated impairment losses. Goodwill is allocated to cash generating units
and is not amortised but is tested for impairment annually or when there is an indication for impairment (refer
accounting policy 5.15). In respect of equity-accounted investees, the carrying amount of goodwill is included in
the carrying amount of the investment, and an impairment loss on such an investment is not allocated to any
asset, including goodwill, that forms part of the carrying amount of the equity-accounted investee.

106
5.9.2 Research and development
Expenditure on research activities, undertaken with the prospect of gaining new scientifi c or technical
knowledge and understanding, is recognised in profi t or loss as incurred.
Development activities involve a plan or design for the production of new or substantially improved products
and processes. Development expenditure is capitalised only if development costs can be measured reliably,
the product or process is technically and commercially feasible, future economic benefi ts are probable, and
the Group intends to and has suffi cient resources to complete development and to use or sell the asset.
The capitalised expenditure includes the cost of materials, direct labour, overhead costs that are directly
attributable to preparing the asset for its intended use, and capitalised borrowing costs. Other development
expenditure is recognised in profi t or loss as incurred. Capitalised development expenditure is measured at cost
less accumulated amortisation and accumulated impairment losses (refer accounting policy 5.15).
5.9.3 Software and other intangible assets
Software and other intangible assets acquired or developed by the Group are measured at cost less accumulated
amortisation and accumulated impairment losses (refer accounting policy 5.15).
5.9.4 Subsequent expenditure
Subsequent expenditure on capitalised intangible assets is capitalised only when it increases the future
economic benefi ts embodied in the specifi c asset to which it relates. All other expenditure, including
expenditure on internally generated goodwill, is recognised in profi t or loss as incurred.
5.9.5 Amortisation
Amortisation is based on the cost of an asset less its residual value. Amortisation is recognised in profi t or loss on
a straight-line basis over the estimated useful lives of intangible assets unless such lives are indefi nite. Goodwill
and intangibles assets with an indefi nite life are systematically tested for impairment annually or when there is
an indication for impairment (refer accounting policy 5.15). Other intangible assets and software are amortised
from the date they are available for use. The estimated useful life of software and other capitalised development
costs is fi ve years. Amortisation methods, useful lives and residual values are reviewed at each reporting date and
adjusted if appropriate.
5.10 I n ve s t m e n t s i n e q u i t y - a c c o u n t e d i n ve s t e e s
Investments in equity-accounted investees are accounted for using the equity method and are recognised
initially at cost. The Group’s investment includes goodwill identifi ed on acquisition, net of any accumulated
impairment losses (refer accounting policy 5.15). The consolidated fi nancial statements include the Group’s
share of the income and expenses and equity movements of equity-accounted investees, after adjustments to
align the accounting policies with those of the Group, from the date that signifi cant infl uence commences until
the date that signifi cant infl uence ceases. When the Group’s share of losses exceeds the carrying amount of the
equity-accounted investee, the carrying amount is reduced to nil and recognition of further losses is
discontinued except to the extent that the Group has incurred legal or constructive obligations or has made
payments on behalf of the investee.

107Fugro Annual accounts 2010
5.11 O t h e r i n ve s t m e n t s
5.11.1 Other investments in equity instruments
Other investments in equity instruments do not have a quoted market price in an active market. As the fair value
cannot be reliably measured the equity instruments are stated at cost. Dividends received are accounted for in
profi t or loss when these become due.
5.11.2 Financial assets at fair value through profit or loss
A fi nancial asset is classifi ed at fair value through profi t or loss if it is classifi ed as held for trading or is
designated as such upon initial recognition. Financial assets are designated at fair value through profi t or loss if
the Group manages such investments and makes purchase and sale decisions based on their fair value in
accordance with the Group’s documented risk management or investment strategy. Attributable transaction
costs are recognised in profi t or loss as incurred. Financial assets at fair value through profi t or loss are measured
at fair value, and changes therein are recognised in profi t or loss.
Financial assets designated at fair value through profi t or loss comprise equity securities that otherwise would
have been classifi ed as available for sale.
5.11.3 Long-term loans and other receivables
Long-term loans and other receivables are fi nancial assets with fi xed or determinable payments that are not
quoted in an active market. Such assets are recognised initially at fair value plus any directly attributable
transaction costs. Subsequent to initial recognition, loans and receivables are measured at amortised cost using
the effective interest method, less any impairment losses (refer to accounting policy 5.15).
Loans and receivables comprise cash and cash equivalents and trade and other receivables. Cash and cash
equivalents comprise cash balances and call deposits with original maturities of three months or less.
5.11.4 Available-for-sale financial assets
Available for sale fi nancial assets are non-derivative fi nancial assets that are designated as available for sale or are
not classifi ed in any of the above categories of fi nancial assets. Subsequent to initial recognition, they are
measured at fair value and changes therein, other than impairment losses (refer to note 5.15) and foreign
currency differences on available-for-sale debt instruments (refer to note 5.5.1), are recognised in other
comprehensive income and presented in the other reserves in equity. When an investment is derecognised, the
cumulative gain or loss accumulated in equity is reclassifi ed to profi t or loss.
Available-for-sale fi nancial assets comprise equity securities and debt securities.

108
5.12 I n ve n t o r i e s
5.12.1 Seismic and geological data libraries
The seismic and geological data libraries consist of completed and in progress collection of seismic and
geological data that can be sold non-exclusively to one or more clients. These seismic and geological data
libraries are measured at the lower of cost and net realisable value. Net realisable value is the estimated sales
value price in the ordinary course of business, less the estimated costs of completion and selling expenses. Costs
include direct costs and an attributable portion of direct overheads, but exclude a profi t element. As it is
expected that sales lead to a lower net realisable value of the seismic and geological data, these expected
decreases in value are taken into account at the moment of sale throughout the fi nancial year. The Group
evaluates the net realisable value on a regular basis and reassesses the net realisable value at each reporting date.
5.12.2 Other inventories
Other inventories are measured at the lower of cost or net realisable value. The cost of other inventories is based
on the fi rst-in fi rst-out principle, and includes expenditure incurred in acquiring the inventories and bringing
them to their existing location and condition.
5.13 Tr a d e a n d o t h e r r e c e i va b l e s
Services rendered on contract work completed but not yet billed to customers are included in trade and other
receivables as unbilled revenues on completed contracts.
Trade and other receivables are recognised initially at fair value plus any directly attributable transaction costs.
Subsequent to initial recognition they are measured at amortised cost using the effective interest method less,
any impairment losses (refer accounting policy 5.15).
5.14 C a s h a n d c a s h e q u i va l e n t s
Cash and cash equivalents, comprising cash balances and call deposits, are recognised initially at fair value plus
any directly attributable transaction costs. Subsequent to initial recognition they are measured at amortised cost
using the effective interest method less, any impairment losses (refer accounting policy 5.15). Bank overdrafts
that are repayable on demand and form an integral part of the Group’s cash management are included as a
component of cash and cash equivalents for the purpose of the consolidated statement of cash fl ows.
5.15 I m p a i r m e n t
5.15.1 Non-derivative financial assets
A fi nancial asset not carried at fair value through profi t or loss is assessed at each reporting date to determine
whether there is objective evidence that it is impaired. A fi nancial asset is impaired if objective evidence
indicates that a loss event has occurred after the initial recognition of the asset, and that the loss event had
a negative effect on the estimated future cash fl ows of that asset that can be estimated reliably.
The Group considers evidence of impairment for receivables at both a specifi c asset and collective level.
All individually signifi cant receivables are assessed for specifi c impairment. All individually signifi cant
receivables found not to be specifi cally impaired are then collectively assessed for any impairment that has been
incurred but not yet identifi ed. Receivables that are not individually signifi cant are collectively assessed for
impairment by grouping together receivables with similar risk characteristics. In assessing collective
impairment the Group uses historical trends of the probability of default, the timing of recoveries and the
amount of loss incurred, adjusted for management’s judgement as to whether current economic and credit
conditions are such that the actual losses are likely to be greater or less than suggested by historical trends.

109Fugro Annual accounts 2010
An impairment loss in respect of a fi nancial asset measured at amortised cost is calculated as the difference
between its carrying amount and the present value of the estimated future cash fl ows discounted at the asset’s
original effective interest rate. Losses are recognised in profi t or loss and refl ected in an allowance account
against receivables. Interest on the impaired asset continues to be recognised through the unwinding of the
discount. When a subsequent event causes the amount of impairment loss to decrease, the decrease in
impairment loss is reversed through profi t or loss.
Impairment losses on available-for-sale fi nancial assets are recognised by reclassifying the losses accumulated in
other comprehensive income, and presented in equity, to profi t or loss. The cumulative loss that is reclassifi ed
from other comprehensive income to profi t or loss is the difference between the acquisition cost, net of any
principal repayment and amortisation, and the current fair value, less any impairment loss recognised
previously in profi t or loss. Changes in impairment provisions attributable to application of the effective interest
method are refl ected as a component of interest income. If, in a subsequent period, the fair value of an impaired
available-for-sale debt security increases and the increase can be related objectively to an event occurring after
the impairment loss was recognised in profi t or loss, then the impairment loss is reversed, with the amount of
the reversal recognised in profi t or loss. Any subsequent recovery in the fair value of an impaired available-for-
sale equity security is recognised in other comprehensive income.
5.15.2 Non-financial assets
The carrying amounts of the Group’s non-fi nancial assets other than inventories, assets arising from employee
benefi ts and deferred tax assets (refer accounting policy 5.23), are reviewed at each reporting date to determine
whether there is any indication of impairment. If any such indication exists, then the asset’s recoverable amount
is estimated. For goodwill, and intangible assets that have indefi nite useful lives or that are not yet available for
use, the recoverable amount is estimated each year at the same time. An impairment loss is recognised if the
carrying amount of an asset or its related cash-generating unit exceeds its estimated recoverable amount.
Impairment losses are recognised in profi t or loss. Impairment losses recognised in respect of cash-generating
units are allocated fi rst to reduce the carrying amount of any goodwill allocated to the cash-generating unit
(group of cash-generating units) and then to reduce the carrying amount of the other assets in the cash-
generating unit (group of cash-generating units) on a pro rata basis.
The recoverable amount of an asset or cash-generating unit is the greater of its value in use and its fair value less
costs to sell. In assessing value in use, the estimated future cash fl ows are discounted to their present value using
a pre-tax discount rate that refl ects current market assessments of the time value of money and the risks specifi c
to the asset or cash-generating unit. For the purpose of impairment testing, assets that cannot be tested
individually are grouped together into the smallest group of assets that generates cash infl ows from continuing
use that are largely independent of the cash infl ows of other assets or cash-generating unit. Subject to an
operating segment ceiling test, for the purposes of goodwill impairment testing, CGUs to which goodwill has
been allocated, are aggregated so that the level at which impairment testing is performed refl ects the lowest level
at which goodwill is monitored for internal reporting purposes. Goodwill acquired in a business combination is
allocated to groups of cash generating units that are expected to benefi t from the synergies of the combination.

110
The Group’s corporate assets do not generate separate cash infl ows and are utilised by more than one cash-
generating unit. Corporate assets are allocated to cash-generating units on a reasonable and consistent basis and
tested for impairment as part of the testing of the cash generating units to which the corporate asset is allocated.
An impairment loss in respect of goodwill is not reversed. In respect of other assets, impairment losses
recognised in prior periods are reviewed at each reporting date for any indications that the loss has decreased or
no longer exists. An impairment loss is reversed if there has been a change in the estimates used to determine the
recoverable amount. An impairment loss is reversed only to the extent that the asset’s carrying amount does not
exceed the carrying amount that would have been determined, net of depreciation or amortisation, if no
impairment loss had been recognised.
5.16 S h a r e c a p i t a l
5.16.1 Share capital
Share capital is classifi ed as equity. The term ‘shares’ as used in the Annual Accounts should, with respect to
shares issued by Fugro, be construed to include certifi cates for shares (also referred to as depositary receipts for
shares) issued by ‘Stichting Administratiekantoor Fugro’ (also referred to as ‘Fugro Trust Offi ce’ or ‘Trust Offi ce’),
unless the context otherwise requires or unless it is clear from the context that this is not the case. Incremental
costs directly attributable to the issue of ordinary shares and share options are recognised as a deduction from
equity, net of any tax effects.
5.16.2 Repurchase and sale of shares
When shares are repurchased or sold, the amount of the consideration paid or received, including direct
attributable costs, net of any tax effects, is recognised as a change in equity. Repurchased shares and related
results are reported as reserve for own shares and presented separately as a component of total equity.
5.16.3 Dividends
Dividends are recognised as a liability in the period in which they are declared.
5.17 L o a n s a n d b o r r ow i n g s
Loans and borrowings are recognised initially at fair value, less attributable transaction costs. Subsequent to
initial recognition, borrowings are measured at amortised cost using the effective interest rate method.
5.18 E m p l oy e e b e n e f i t s
5.18.1 Defined contribution plans
A defi ned contribution plan is a post-employment benefi t plan under which an entity pays fi xed contributions
into a separate entity and will have no legal or constructive obligation to pay further amounts. Obligations for
contributions to defi ned contribution pension plans are recognised as an employee benefi t expense in profi t or
loss in the periods during which services are rendered by employees.

111Fugro Annual accounts 2010
5.18.2 Defined benefit plans
A defi ned benefi t plan is a post-employment benefi t plan other than a defi ned contribution plan. The Group’s net
obligation in respect of defi ned benefi t pension plans is calculated separately for each plan by estimating the
amount of future benefi t that employees have earned in return for their service in the current and prior periods;
that benefi t is discounted to determine the present value. Any unrecognised past service costs and the fair value
of plan assets are deducted. The discount rate is the yield at the reporting date on high quality corporate or
government bonds that have maturity dates approximating the terms of the Group’s obligations and that are
denominated in the same currency in which the benefi ts are expected to be paid. The calculation is performed by
qualifi ed actuaries using the projected unit credit method. When the calculation results in a benefi t to the
Group, the recognised asset is limited to the total of any unrecognised past service costs and the present value of
economic benefi ts available in the form of any future refunds from the plan or reductions in future
contributions to the plan. In order to calculate the present value of economic benefi ts, consideration is given to
any minimum funding requirements that apply to any plan in the Group. An economic benefi t is available to the
Group if it is realisable during the life of the plan, or on settlement of the plan liabilities.
When the benefi ts of a plan are improved, the portion of the increased benefi t related to past service by
employees is recognised in profi t or loss on a straight-line basis over the average period until the benefi ts become
vested. To the extent that the benefi ts vest immediately, the expense is recognised immediately in profi t or loss.
The Group recognises all actuarial gains and losses arising from defi ned benefi t plans in other comprehensive
income and all expenses related to defi ned benefi t plans in personnel expenses in profi t or loss.
The Group recognises gains and losses on the curtailment or settlement of a defi ned benefi t plan when the
curtailment or settlement occurs. The gain or loss on curtailment comprises any resulting change in the fair
value of plan assets, change in the present value of defi ned benefi t obligation and any related actuarial gains and
losses and past service cost that had not previously been recognised.
5.18.3 Other long-term employee benefits
The Group’s net obligation in respect of long-term employee benefi ts, other than pension plans, is the amount of
future benefi t that employees have earned in return for their service in the current and prior periods; that
benefi t is discounted to determine its present value, and the fair value of any assets is deducted. The discount
rate is the yield at the reporting date on high quality corporate or government bonds that have maturity dates
approximating the terms of the Group’s obligations and that are denominated in the same currency in which
the benefi ts are expected to be paid. The calculation is performed using the projected unit credit method.
Any actuarial gains or losses are recognised in profi t or loss in the period in which they arise.
5.18.4 Share-based payments
The share option scheme allows some assigned Group employees to acquire shares in Fugro. The fair value of
granted options is recognised as an employee expense, with a corresponding increase in equity. The fair value is
determined on the date of granting and is spread over the period during which the employees become
unconditionally entitled to the options. The amount recognised as an expense is adjusted to refl ect the number
of options for which the related service vesting conditions are expected to be met, such that the amount
ultimately recognised as an expense is based on the number of options that meet the related service conditions
at the vesting date.

112
5.19 P r o v i s i o n s
A provision is recognised if, as a result of a past event, the Group has a present legal or constructive obligation
that can be estimated reliably, and it is probable that an outfl ow of economic benefi ts will be required to settle
the obligation. If the effect is material, provisions are determined by discounting the expected future cash fl ows
at a pre-tax rate that refl ects current market assessments of the time value of money and, where appropriate,
the risks specifi c to the liability. The unwinding of the discount is recognised as fi nance cost.
5.19.1 Restructuring
A provision for restructuring is recognised when the Group has approved a detailed and formal restructuring
plan, and the restructuring either has commenced or has been announced publicly. Future operating losses are
not provided for.
5.19.2 Onerous contracts
A provision for onerous contracts is recognised when the expected benefi ts to be derived by the Group from
a contract are lower than the unavoidable cost of meeting its obligations under the contract. If material,
the provision is measured at the present value of the lower of the expected cost of terminating the contract and
the expected net cost of continuing with the contract. Before a provision is established, the Group recognises any
impairment loss on the assets associated with that contract.
5.20 Tr a d e a n d o t h e r p a ya b l e s
Trade and other payables are recognised initially at fair value plus any directly attributable transaction costs.
Subsequent to initial recognition they are measured at amortised cost using the effective interest method.
5.21 R e ve n u e
Revenue comprises the fair value of the consideration received or receivable for the sale of goods and services
rendered in the ordinary course of the Group’s activities. Revenue is shown net of value-added tax, rebates and
discounts and after eliminating sales within the Group.
The Group recognises revenue when persuasive evidence exists, usually in the form of an executed sales
agreement, the amount of revenue can be measured reliably, it is probable that future economic benefi ts will
fl ow to the entity and when specifi c criteria have been met for each of the Group’s activities as described below.
The Group bases its estimates on historical results, taking into consideration the type of customer, the type of
transaction and the specifi cs of each arrangement.
Revenue from Sales of goods, seismic and geological data, and software licences and subscription income do not
qualify as a signifi cant category of revenue as referred to in IAS 18.35 (b); however for completeness sake the
relating revenue recognition policies are set out in 5.21.2, 5.21.3 and 5.21.4.

113Fugro Annual accounts 2010
5.21.1 Services rendered
Revenue from services rendered to third parties relate to fi xed price contracts and ‘cost plus’ contracts (mainly
daily rates or rates per (square) kilometre). This revenue is recognised in profi t or loss in proportion to the stage of
completion of the transaction at the reporting date. The stage of completion is assessed using the proportion of
contract cost incurred for work performed to the reporting date, compared to total contract cost (as this method
is most appropriate for the majority of the services provided by the Group), which are mainly based on daily rates
for staff and equipment or rates per (square) kilometre for vessels and airplanes.
5.21.2 Sales of goods
Revenue from the sale of goods is recognised when the signifi cant risks and rewards of ownership have been
transferred to the buyer, recovery of the consideration is probable, the associated costs of goods can be estimated
reliably, and there is no continuing management involvement with the goods.
No revenue is recognised if there are signifi cant uncertainties regarding recovery of the consideration due or
associated costs. An expected loss on a contract is recognised immediately in profi t or loss.
5.21.3 Seismic and geological data
Revenue from the sale of non-exclusive seismic and geological data libraries is recognised in the period when the
data has been collected, processing has been completed and data has (substantially) been delivered to the client.
Pre-commitments on seismic and geological data library sales are recorded as advance instalments. When data
collection has commenced, revenue is recognised based on the stage of completion. Separate (service)
components/deliverables, such as annual maintenance fees or training fees, are accounted for over the period in
which these services have been delivered to the customer, using a straight line basis over the term of the contract.
5.21.4 Software licences and subscription income
Software licences and subscription income are recognised in the period during which the underlying services
have been provided, using a straight line basis over the term of the contract.
5.21.5 Net revenue own service (revenue less third party costs)
Net revenue own service comprise all revenue minus costs incurred with third parties related to the employment
of resources (in addition to the resources deployed by the Group) and other third party cost such as charter-lease
costs and other cost required for the execution of various projects.
5.21.6 Other income
Other income concerns income not related to the key business activities of the Group, such as income from the
sale of non-monetary assets and/or liabilities, exceptional and/or non-recurring income.
5.21.7 Government grants
Government grants are recognised initially as deferred income at fair value when there is reasonable assurance
that they will be received and the Group will comply with the conditions associated with the grant. Grants that
compensate the Group (partly) for expenses incurred are recognised in profi t or loss on a systematic basis in the
same periods in which the expenses are recognised. Grants that (partly) compensate the Group for the cost of an
asset are recognised in profi t or loss on a systematic basis over the useful life of the asset.

114
5.22 E x p e n s e s
5.22.1 Third party costs
Third party costs are matched with related revenues on contracts and accounted for on a historical cost basis.
5.22.2 Lease payments
Payments made under operating leases are recognised in profi t or loss on a straight-line basis over the term of the
lease. Lease incentives received are recognised as an integral part of the total lease expense, over the term of the
lease.
Minimum lease payments made under fi nance leases are apportioned between the fi nance expense and the
reduction of the outstanding liability. The fi nance expense is allocated to each period during the lease term
so as to produce a constant periodic rate of interest on the remaining balance of the liability.
At inception of an arrangement, the Group determines whether such an arrangement is or contains a lease.
A specifi c asset is the subject of a lease if fulfi lment of the arrangement is dependent on the use of that specifi ed
asset. An arrangement conveys the right to use the asset if the arrangement conveys to the Group the right to
control the use of the underlying asset.
At inception or upon reassessment of the arrangement, the Group separates payments and other consideration
required by such an arrangement into those for the lease and those for other elements on the basis of their
relative fair values. If the Group concludes for a fi nance lease that it is impracticable to separate the payments
reliably, then an asset and a liability are recognised at an amount equal to the fair value of the underlying asset.
Subsequently the liability is reduced as payments are made and an imputed fi nance charge on the liability is
recognised using the Group’s incremental borrowing rate.
5.22.3 Net finance costs
Net fi nance costs consist of fi nance costs, fi nance income and foreign currency gains and losses.
Finance costs comprise interest expense on borrowings, unwinding of the discount on provisions, losses on
disposal of available-for-sale fi nancial assets, fair value losses on fi nancial assets at fair value through profi t or
loss, impairment losses recognised on fi nancial assets (other than trade receivables), and losses on hedging
instruments that are recognised in profi t or loss.
Finance income comprises interest income on funds invested (including available-for-sale fi nancial assets),
dividend income, gains on the disposal of available-for-sale fi nancial assets, fair value gains on fi nancial assets at
fair value through profi t or loss, gains on the re-measurement to fair value of any pre-existing interest in an
acquiree, and gains on hedging instruments that are recognised in profi t or loss. Interest income is recognised in
profi t or loss as it accrues, using the effective interest method. Dividend income is recognised in profi t or loss on
the date the Group’s right to receive payment is established, which in the case of quoted shares is normally the
ex-dividend date.
Borrowing costs that are not directly attributable to the acquisition, construction or production of a qualifying
asset are recognised in profi t or loss using the effective interest method.
Foreign currency gains and losses are reported on a net basis as either fi nance income or fi nance cost depending
on whether foreign currency movements are in a net gain or net loss position.

115Fugro Annual accounts 2010
5.23 I n c o m e t a x
Income tax expense comprises current and deferred tax. Current tax and deferred tax is recognised in profi t or
loss except to the extent that it relates to a business combination, or items recognised directly in equity or in
other comprehensive income.
Current tax is the expected tax payable or receivable on the taxable income or loss for the year, using tax rates
enacted or substantively enacted at the reporting date, and any adjustment to tax payable in respect of previous
years. Current tax payable also includes any tax liability arising from the declaration of dividends.
Deferred tax is recognised in respect of temporary differences between the carrying amounts of assets and
liabilities for fi nancial reporting purposes and the amounts used for taxation purposes. Deferred tax is not
recognised for: taxable temporary differences arising on the initial recognition of goodwill; temporary
differences on the initial recognition of assets or liabilities in a transaction that is not a business combination
and that affects neither accounting nor taxable profi t or loss; and temporary differences related to investments
in subsidiaries and jointly controlled entities to the extent that it is probable that they will not reverse in the
foreseeable future. Deferred tax is measured at the tax rates that are expected to be applied to temporary
differences when they reverse, based on the laws that have been enacted or substantively enacted by the
reporting date. Deferred tax assets and liabilities are offset if there is a legally enforceable right to offset current
tax liabilities and assets, and they relate to income taxes levied by the same tax authority on the same taxable
entity, or on different tax entities, but they intend to settle current tax liabilities and assets on a net basis or
their tax assets and liabilities will be realised simultaneously.
A deferred tax asset is recognised for unused tax losses, tax credits and deductible temporary differences, to the
extent that it is probable that future taxable profi ts will be available against which the asset can be utilised.
Deferred tax assets are reviewed at each reporting date and are reduced to the extent that it is no longer probable
that the related tax benefi t will be realised.
Additional income taxes that arise from the distribution of dividends are recognised at the same time as the
liability to pay the related dividend.
5.24 S t a t e m e n t o f c a s h f l ow s
The consolidated statement of cash fl ows is prepared using the indirect method. The cash fl ow statement
distinguishes between operating, investing and fi nancing activities. Cash fl ows in foreign currencies are
converted at the exchange rate at the dates of the transactions. Currency exchange differences on cash held are
separately shown. Payments and receipts of corporate taxes are included as cash fl ow from operating activities
and interest paid is shown as cash fl ow from operating activities. Cash fl ows as a result from acquisition/
divestment of fi nancial interest in subsidiaries and equity accounted investees are included as cash fl ow from
investing activities, taking into account the available cash in these interests. Dividends paid are part of the cash
fl ow from fi nancing activities.
116
5.25 S e g m e n t r e p o r t i n g
An operating segment is a component of the Group that engages in business activities from which it may earn
revenues and incur expenses, including revenues and expenses that relate to transactions with any of the
Group’s other components. All operating segments’ operating results are reviewed regularly by the Group’s
Executive Committee to make decisions about resources to be allocated to the segment and to assess its
performance, and for which discrete fi nancial information is available.
Inter-segment pricing is determined on an arm’s length basis. Segment results, assets and liabilities include
items directly attributable to a segment as well as those that can be allocated on a reasonable basis. Unallocated
items comprise mainly income tax assets and liabilities, loans and borrowings and corporate assets and head
offi ce expenses. Segment capital expenditure is the total cost incurred during the year to acquire property, plant
and equipment, and intangible assets other than goodwill.
5.25.1 Operating segments
As an engineering fi rm with operations throughout the world, the Group delivers its services to clients located
all over the globe and collects and interprets data related to the earth’s surface and the soil and rock beneath. On
the basis of this data the Group provides advice, generally for purposes related to the oil and gas industry, the
mining industry and the construction industry. The Group has three reportable segments, which are the Group’s
divisions. The divisions offer different products and services, and are managed separately because they require
different technology and marketing strategies. For each of the divisions, the Executive Committee reviews
internal management reports on a monthly basis. The following summary describes the operations in each of
the Group’s reportable segments:
Geotechnical
The Geotechnical division investigates the engineering properties and geological characteristics of near-surface
soils and rocks using (in-house) developed proprietary technologies, advises on foundation design and provides
construction materials testing, pavement assessment and construction support services. These services support
clients’ projects worldwide in the onshore, near shore and offshore environments, including deep water.
Typical projects include support of infrastructure development and maintenance, large construction projects,
fl ood protection and support of the design and installation of oil and gas facilities.
Survey
The Survey division provides a range of services to support the activities of the oil and gas industry and a broad
range of commercial and civil industries as well as governments and non-governmental organisations. Offshore
services include geophysical investigation for geohazards, pipeline and cable route surveys, inspection and
construction support services, hydrographic charting and meteorology and oceanographic studies. Subsea
services revolve around the use of remotely operated vehicles (ROVs) to support subsea inspection, construction
and drilling while geospatial services are focused on land survey and aerial/satellite mapping services for a wide
range of clients. In addition, Fugro’s global positioning systems (which augment GPS and Glonass signals to
provide precise positioning in real-time world-wide) are employed not only to support the above services,
but are also provided on a subscription basis to other industries such as agriculture.

117Fugro Annual accounts 2010
Geoscience
The Geoscience division provides services and products associated with collecting, processing, interpreting,
managing and storing geophysical and geological data. These data sets are used for evaluating the presence of
natural resources, including oil, gas, water and minerals, and for optimising the exploration, appraisal,
development and production of those resources. A broad range of geophysical data sets are collected including
marine seismic, gravity, magnetics and electromagnetics. The data sets are collected at sea, from the air and on
land using vessels, low fl ying airplanes and helicopters. Clients are oil and gas companies, mining companies
and governmental organisations.
The segments are managed on a worldwide basis, and operate in four principal geographical areas, The
Netherlands, Europe other/Africa, Middle East/Asia/Australia and the Americas. In presenting information on
the basis of geographical segments, segment revenue is based on the geographical location of operating
companies. The allocation of segment assets is based on the geographical location of the assets.
Information regarding the results of each reportable segment is included below. Performance is measured based
on segment profi t before income tax, as included in the internal management reports that are reviewed by the
Group’s Executive Committee. Segment profi t is used to measure performance as management believes that
such information is the most relevant in evaluating the results of certain segments relative to other entities that
operate within these industries.

118
Operating segments
(EUR x 1,000) Geotechnical Survey Geoscience Total
2010 2009 2010 2009 2010 2009 2010 2009
Revenue 724,878 573,614 1,060,746 995,119 626,726 583,409 2,412,350 2,152,142
Of which inter-segment revenue 60,352 37,855 52,112 38,886 19,495 22,413 131,959 99,154
Segment result 138,962 122,987 278,831 295,734 145,733 146,649 563,526 565,370
Finance income 939 1,320 3,012 3,194 25,596 2,785 29,547 7,299
Finance expense (13,309) (4,737) (5,458) (6,020) (24,974) (18,932) (43,741) (29,689)
Share of profi t of equity-accounted investees 914 (35) – – 104 454 1,018 419
Depreciation (34,597) (28,678) (50,530) (48,854) (38,305) (32,080) (123,432) (109,612)
Amortisation intangible assets (658) (533) (676) (655) (6,654) (8,927) (7,988) (10,115)
Reportable segment profit or (loss)
before income tax 92,251 90,324 225,179 243,399 101,500 89,949 418,930 423,672
Reportable segment assets 608,239 523,271 1,051,920 845,056 1,312,309 914,789 2,972,468 2,283,116
Reportable segment liabilities 163,055 214,665 294,409 268,434 761,599 479,150 1,219,063 962,249
Capital expenditure, property, plant and equipment 54,413 192,226 96,775 82,244 288,809 38,382 439,997 312,852
Capital expenditure intangible assets 6,042 6,527 40,745 8,653 19,184 14,401 65,971 29,581
Additions to other investments (1) 5 – – 39,113 20,624 39,112 20,629
Geographical segments
(EUR x 1,000) Netherlands Europe other/Africa
Middle East/
Asia/Australia Americas Consolidated
2010 2009 2010 2009 2010 2009 2010 2009 2010 2009
Revenue from external
customers 133,233 133,776 1,110,685 985,074 432,105 419,948 604,368 514,190 2,280,391 2,052,988
Non-current assets 199,585 203,042 817,599 610,837 714,183 555,798 225,640 216,817 1,957,007 1,586,494

119Fugro Annual accounts 2010
Reconciliation of reportable segment revenues, profit or loss, assets and liabilities and other material items
(EUR x 1,000) 2010 2009
Revenues
Total revenue for reportable segments 2,412,350 2,152,142
Elimination of inter-segment revenue (131,959) (99,154)
Consolidated revenue 2,280,391 2,052,988
Profit or loss
Total profi t or (loss) for reportable segments before income tax 418,930 423,672
Unallocated amounts:
– Other corporate expenses (80,627) (78,221)
– Net fi nance income 20,368 2,023
Share of profi t of equity-accounted investees – 3
Consolidated profi t before income tax 358,671 347,477
Assets
Total assets for reportable segments 2,972,468 2,283,116
Other unallocated amounts 117,523 83,201
Consolidated assets 3,089,991 2,366,317
Liabilities
Total liabilities for reportable segments 1,219,063 962,249
Other unallocated amounts 347,681 204,558
Consolidated liabilities 1,566,744 1,166,807
Unallocated assets are assets that are used by more than one reporting segment, and principally comprise in
both 2010 and 2009 property, plant and equipment, equity-accounted investees and other investments, deferred
tax assets, current tax assets, derivative fi nancial instrument assets and cash and cash equivalents which are
used as part of the Group’s fi nancing offset arrangements. Unallocated liabilities are liabilities that relate to
more than one reporting segment, and comprise both in 2010 as in 2009 borrowings, derivative fi nancial
instruments liabilities, current and non-current tax liabilities, employee benefi t obligations and centrally held
accruals and provisions.
Other corporate expenses 2010 and 2009 include general (corporate) expenses, depreciation on corporate assets
and on certain items of property, plant and equipment that are used by operating segments but are managed as a
central pool.

120
Other material items 2010 in respect of elements of profit or loss
(EUR x 1,000)
Report-
able
segment
totals
Adjust-
ments and
other
unallo-
cated
amounts
Consoli-
dated
totals
Finance income 29,547 (1,308) 28,239
Finance expense (43,741) 21,676 (22,065)
Depreciation (123,432) (78,061) (201,493)
Amortisation intangible assets (7,988) (123) (8,111)
Other material items 2009 in respect of elements of profit or loss
(EUR x 1,000)
Report-
able
segment
totals
Adjust-
ments and
other
unallo-
cated
amounts
Consoli-
dated
totals
Finance income 7,299 (125) 7,174
Finance expense (29,689) 2,148 (27,541)
Depreciation (109,612) (63,981) (173,593)
Amortisation intangible assets (10,115) – (10,115)
5.26 A c q u i s i t i o n s a n d d i ve s t m e n t s o f s u b s i d i a r i e s
5.26.1 Acquisitions 2010
The Group acquired a 100% interest in the following companies, assets and activities:
(EUR x million) Price Goodwill Country Division
Annual
revenue
Number
of employ-
ees Consolidation per
Interra/Terralaser 2.8 2.5 Chile/Peru Survey 3.0 45 June
Statnamic/Geo Pannon 2.0 0.8 Hungary Geotechnical 3.0 18 July
ERT Scotland 5.9 4.2 United Kingdom Geotechnical 3.0 25 September
Riise Underwater Engineering 44.2 32.2 Norway Survey 35.0 25 December
Adjustments prior years (0.2) 4.4
Total 54.7 44.1 44.0 113
5.26.1.1 Interra/Terralaser
Interra S.A., Chile and its sister company TerraLaser S.A., Peru, are specialised in aerial mapping.
5.26.1.2 Statnamic/Geo Pannon
Geo Pannon Kft and related company Statnamic Kft, Hungary, are service providers in the fi eld of onshore
geotechnical services. With these acquisitions Fugro has strengthened its position in South East Europe.
5.26.1.3 ERT Scotland
ERT (Scotland) Ltd., United Kingdom, provides services to the global oil and gas, renewable energy and other
industries. It conducts survey, monitoring, consulting and reporting activities supported by in-house chemical
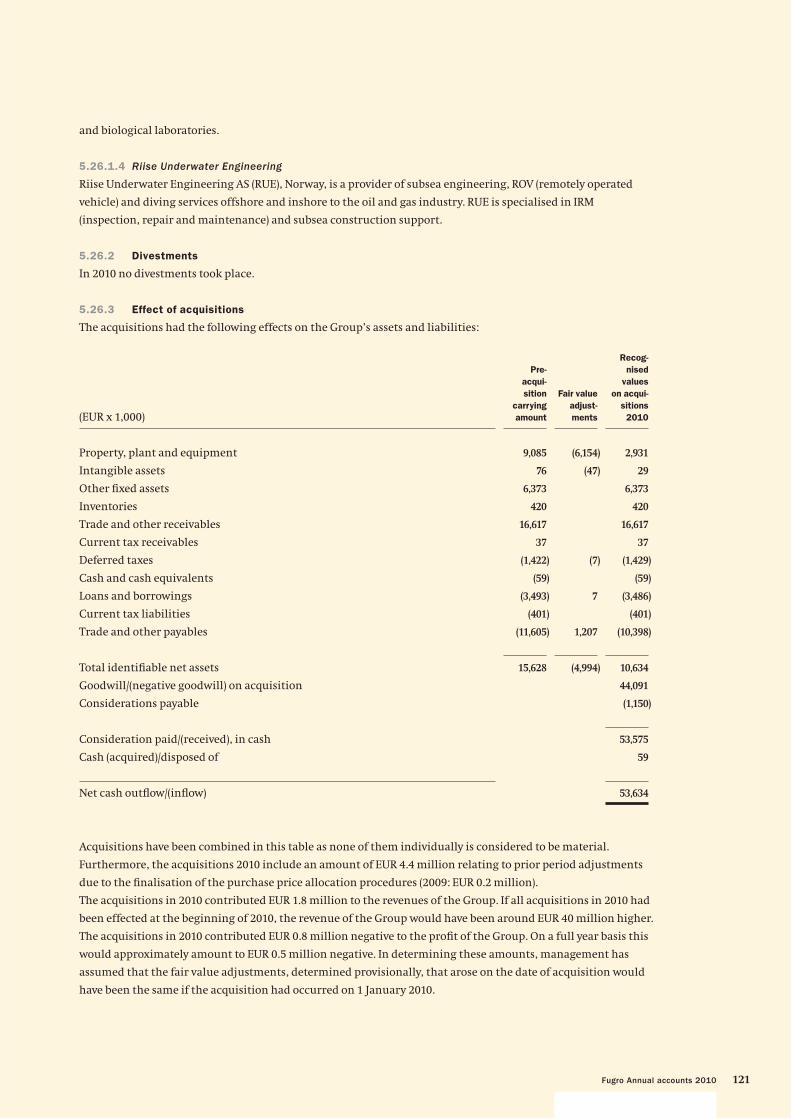
121Fugro Annual accounts 2010
and biological laboratories.
5.26.1.4 Riise Underwater Engineering
Riise Underwater Engineering AS (RUE), Norway, is a provider of subsea engineering, ROV (remotely operated
vehicle) and diving services offshore and inshore to the oil and gas industry. RUE is specialised in IRM
(inspection, repair and maintenance) and subsea construction support.
5.26.2 Divestments
In 2010 no divestments took place.
5.26.3 Effect of acquisitions
The acquisitions had the following effects on the Group’s assets and liabilities:
(EUR x 1,000)
Pre-
acqui-
sition
carrying
amount
Fair value
adjust-
ments
Recog-
nised
values
on acqui-
sitions
2010
Property, plant and equipment 9,085 (6,154) 2,931
Intangible assets 76 (47) 29
Other fi xed assets 6,373 6,373
Inventories 420 420
Trade and other receivables 16,617 16,617
Current tax receivables 37 37
Deferred taxes (1,422) (7) (1,429)
Cash and cash equivalents (59) (59)
Loans and borrowings (3,493) 7 (3,486)
Current tax liabilities (401) (401)
Trade and other payables (11,605) 1,207 (10,398)
Total identifi able net assets 15,628 (4,994) 10,634
Goodwill/(negative goodwill) on acquisition 44,091
Considerations payable (1,150)
Consideration paid/(received), in cash 53,575
Cash (acquired)/disposed of 59
Net cash outfl ow/(infl ow) 53,634
Acquisitions have been combined in this table as none of them individually is considered to be material.
Furthermore, the acquisitions 2010 include an amount of EUR 4.4 million relating to prior period adjustments
due to the fi nalisation of the purchase price allocation procedures (2009: EUR 0.2 million).
The acquisitions in 2010 contributed EUR 1.8 million to the revenues of the Group. If all acquisitions in 2010 had
been effected at the beginning of 2010, the revenue of the Group would have been around EUR 40 million higher.
The acquisitions in 2010 contributed EUR 0.8 million negative to the profi t of the Group. On a full year basis this
would approximately amount to EUR 0.5 million negative. In determining these amounts, management has
assumed that the fair value adjustments, determined provisionally, that arose on the date of acquisition would
have been the same if the acquisition had occurred on 1 January 2010.

122
The goodwill from the acquisitions is attributable mainly to market share, the skills and technical talent of the
acquired business’ work force, and the synergies expected to be achieved from integrating the companies into
the Group’s existing business. None of the goodwill recognised is expected to be deductible for income tax
purposes.
The fair value of acquired assets and (contingent) liabilities related to the acquisitions has been determined
provisionally pending completion of fi nal valuations.
The group incurred acquisition-related costs of EUR 481 thousand related to external legal fees and due diligence
costs. The legal fees and due diligence costs have been included in the other expenses in profi t or loss.
Acquisition of non-controlling interest
In October 2010 Fugro acquired an additional 30 percent interest in Fugro Jacques GeoSurveys Inc, Canada
for EUR 7.8 million in cash, increasing its ownership from 70 to 100 percent. Fugro recognised a decrease in
non-controlling interests of EUR 1.2 million and a decrease in other reserves of EUR 6.6 million.
The following summarises the effect of changes in the Company’s ownership interest in Fugro Jacques
GeoSurveys Inc:
(EUR x 1,000) 2010
Company’s ownership interest at the beginning of the year 2,860
Effect of exchange variance 368
Effect of increase in Company’s ownership interest 1,169
Share of comprehensive income 2,650
Dividends paid (3,790)
Company’s ownership interest at the end of the year 3,257
5.27 G o ve r n m e n t g r a n t s
The Company has not been awarded any signifi cant government grants in 2010.
5.28 T h i r d p a r t y c o s t s
(EUR x 1,000) 2010 2009
Cost of suppliers 408,651 352,566
Operational lease expenses 195,007 156,182
Seismic and geological data libraries 88,758 63,987
Other costs 73,171 51,678
765,587 624,413
5.29 O t h e r i n c o m e
(EUR x 1,000) 2010 2009
Government grants 1,052 1,057
Net gain on sale of property, plant and equipment 3,323 4,059
Sundry income 17,527 19,324
21,902 24,440

123Fugro Annual accounts 2010
5.30 Pe r s o n n e l e x p e n s e s
(EUR x 1,000) 2010 2009
Wages and salaries 612,151 555,784
Compulsory social security contributions 68,320 59,858
Equity-settled share-based payments 12,654 9,094
Contributions to defi ned contribution plans 20,318 19,193
Expense related to defi ned benefi t plans 8,978 8,389
Increase in liability for long service leave 720 489
723,141 652,807
5.30.1 Share-based payments
Fugro’s share option scheme allows some assigned Group employees to acquire shares in Fugro. A share option
entitles the employee to purchase ordinary shares in Fugro. The granting of options is dependent on the
achievement of the targets of the Group as a whole and of the individual operating companies as well as on the
contribution of the relevant employee to the long term development of the company. In order to become entitled
to options the employee has to be employed by the Group twelve months prior to the granting of the options.
The Group stipulates that in addition to the services provided in the twelve months prior to the granting of the
options, services also must be provided in the future. The vesting period for the granted options is three years
starting at the fi rst of January of the year following the grant date. The option period is six years. The options
granted are not subject to any further conditions of exercise, except that the option holder is still employed by
Fugro or one of its operating companies. Standard exceptions apply to the latter rule in connection with
retirement, long-term disability and death.
The Board of Management and the Supervisory Board decide annually on the granting of options. Options are
granted annually on 31 December and the option exercise price is equal to the price of the certifi cates of shares
at the closing of Euronext Amsterdam on the last trading day of the year. The costs of the options are recognised
in profi t or loss over the related period of employment (four years).
With respect to options granted before 31 December 2007 a difference exists between conditions for Dutch
residents and foreign residents. Options to Dutch residents are unconditional, the options could be exercised
immediately after the grant notwithstanding a 90% fi ne on the profi t, to be retained by the Group. Costs related
to these options were recognised in profi t or loss in the year of granting. For foreign residents the same
conditions were applicable on options granted after 31 December 2007, e.g. the options could only be exercised
after three years starting at the fi rst of January of the year following the grant date. The costs of the options are
recognised in profi t or loss over the related period of employment (four years).
The weighted average stock price on Euronext Amsterdam during 2010 was EUR 47.03 (2009: EUR 31.11). As at
31 December 2010, Fugro N.V. granted 1,107,350 options to 663 employees. These options have an exercise price
of EUR 61.50 (2009: 1,166,550 options were granted to 639 employees with an exercise price of
EUR 40.26).
In 2010 Fugro sold 1,135,980 certifi cates of shares in relation to options that were exercised. Fugro issued no new
(certifi cates of) shares in relation to the exercise of options in 2010 (2009: nil). The (certifi cates of) shares that were
sold had an average purchase price of EUR 44.70 per certifi cate. The options were exercised throughout the year,
with the exception of determined closed periods.

124
As at 31 December the following options were outstanding:
Year of issue Duration
Number of
partici-
pants Granted
Out-
standing
at 01-01-
2010
Forfeited
in 2010
Exercised
in 2010
Out-
standing
at 31-12-
2010
Exercis-
able at
31-12-
2010
Exercise
price
(EUR)
2004 6 years 493 1,064,800 727,780 2,800 724,980 – – 15.35
2005 6 years 521 1,155,000 1,063,300 1,400 266,150 795,750 795,750 27.13
2006 6 years 547 1,140,500 1,109,700 1,300 144,850 963,550 963,550 36.20
2007 6 years 565 1,140,500 1,129,150 8,200 – 1,120,950 1,120,950 52.80
2008 6 years 620 1,141,900 1,137,950 7,200 – 1,130,750 – 20.485
2009 6 years 639 1,166,550 1,166,550 4,800 – 1,161,750 – 40.26
2010 6 years 663 1,107,350 – – – 1,107,350 – 61.50
7,916,600 6,334,430 25,700 1,135,980 6,280,100 2,880,250
The outstanding options as at 31 December 2010 have an exercise price ranging from EUR 20.485 to EUR 61.50.
The average remaining term of the options is four years (2009: four years). The movement during the year of
options and the average exercise price is as follows:
2010 2009
Weighted
average
exercise
price
(EUR)
Number of
options
Weighted
average
exercise
price
(EUR)
Number of
options
Options outstanding at 1 January 33.17 6,334,430 28.97 5,993,550
Forfeited during the period 34.79 (25,700) 30.22 (24,750)
Options granted during the period 61.50 1,107,350 40.26 1,166,550
Options exercised during the period 20.77 (1,135,980) 12.25 (800,920)
Options outstanding at 31 December 40.40 6,280,100 33.17 6,334,430
Exercisable at 31 December 2,880,250 2,357,130
The valuation of the share options is determined by using a binomial model.
Concerning early departure, different percentages for different categories of staff are used: Board of
Management 1%, other Executive Committee members 2%, managers of operating companies 7%. The expected
behaviour for exercising the options by Directors is estimated till the end of the vesting period and for the other
two groups with a multiple of three. Expected volatility is estimated by considering historic average share price
volatility.

125Fugro Annual accounts 2010
The inputs used in the measurement of the fair values at grant date of the share options are the following:
2010 2009
Average share price during the year in EUR 47.03 31.11
Average fair value of the granted options during the year in EUR 16.71 10.84
Exercise price (fair value at grant date) in EUR 61.50 40.26
Expected volatility (weighted average volatility) 39% 38%
Option term (expected weighted average term) 4 years 4 years
Expected dividends 3.38% 3.38%
Risk-free interest rate (based on government bonds) 2.74% 3.01%
Costs of granted options at the end of 2006 in EUR – 1,067,164
Costs of granted options at the end of 2007 in EUR 3,291,433 3,291,433
Costs of granted options at the end of 2008 in EUR 1,582,401 1,582,401
Costs of granted options at the end of 2009 in EUR 3,153,277 3,153,277
Costs of granted options at the end of 2010 in EUR 4,627,100 –
Total 12,654,211 9,094,275
5.30.2 Number of employees as at 31 December 2010 2009
Nether-
lands Foreign Total
Nether-
lands Foreign Total
Technical staff 607 9,545 10,152 635 9,677 10,312
Management and administrative staff 154 2,643 2,797 141 2,542 2,683
Temporary and contract staff 182 332 514 171 316 487
943 12,520 13,463 947 12,535 13,482
Average number of employees during the year 944 12,500 13,444 935 12,652 13,587
5.31 O t h e r e x p e n s e s
(EUR x 1,000) 2010 2009
Maintenance and operational supplies 60,779 75,106
Indirect operating expenses 62,429 55,231
Occupancy costs 43,176 43,730
Communication and offi ce equipment 34,181 30,060
Restructuring costs 544 367
Research cost 3,278 1,957
Loss on disposal of property, plant and equipment 273 1,127
Other 47,822 41,500
252.482 249,078
Audit fees, presented under other expenses, charged by KPMG are disclosed in note 9.13.

126
5.32 N e t f i n a n c e ( i n c o m e ) c o s t s
(EUR x 1,000) 2010 2009
Interest income on loans and receivables (4,853) (4,862)
Dividend income on available-for-sale fi nancial assets (1,049) (2,312)
Net change in fair value of fi nancial assets at fair value through
profi t or loss (22,337) –
Finance income (28,239) (7,174)
Interest expense on fi nancial liabilities measured at amortised cost 16,960 12,544
Net change in fair value of fi nancial assets at fair value through
profi t or loss – 1,639
Net foreign exchange variance 5,105 13,358
Finance expense 22,065 27,541
Net fi nance (income)/costs recognised in profi t or loss (6,174) 20,367
(EUR x 1,000) 2010 2009
Recognised in other comprehensive income
Net gain (loss) on hedge of net investment in foreign operations 864 1,788
Foreign currency translation differences of foreign operations 108,638 47,517
Foreign currency translation differences of equity-accounted investees 121 –
109,623 49,305
Net change in fair value of cash fl ow hedges transferred to profi t or loss 1,034 1,034
Net change in fair value of available-for-sale fi nancial assets (438) 1,879
Total 110,219 52,218
Recognised in:
Hedging reserve 1,034 1,034
Translation reserve 108,739 49,468
Other reserves (438) 1,879
Non-controlling interests 884 (163)
Total 110,219 52,218

127Fugro Annual accounts 2010
5.33 I n c o m e t a x e x p e n s e
Recognised in profi t or loss
(EUR x 1,000) 2010 2009
Current tax expense
Current year 67,298 69,726
Adjustment for prior years (3,356) (3,486)
63,942 66,240
Deferred tax expense
Origination and reversal of temporary differences 14,210 9,337
Recognition of previously unrecognised temporary differences – (773)
Reduction in tax rate 333 –
Utilisation of tax losses recognised 188 1,733
Recognition of previously unrecognised tax losses (495) (1,208)
Effect of write-down deferred tax assets 1 149
Adjustments for prior years 339 (1,066)
14,576 8,172
Total income tax expense 78,518 74,412
Reconciliation of effective tax rate
(EUR x 1,000)2010
%2010 2009
%2009
Profi t for the period 280,153 273,065
Income tax expense 78,518 74,412
Profi t before income tax 358,671 347,477
Income tax using the weighted domestic average tax rates 23.0 82,522 22.8 79,644
Recognition of previously unrecognised temporary differences – – (0.2) (773)
Reduction in tax rate 0.1 333 – –
Recognition of previously unrecognised tax losses (0.2) (495) (0.3) (1,208)
Effect of write-down deferred tax assets 0.0 1 0.0 149
Non-deductible expenses 0.9 3,246 0.8 2,643
Tax exempt income (0.9) (3,250) (0.3) (1,052)
Effect of utilisation previously unrecognised tax losses (0.2) (822) (0.1) (439)
Adjustments for prior years (deferred) 0.1 339 (0.3) (1,066)
Adjustments for prior years (current) (0.9) (3,356) (1.0) (3,486)
21.9 78,518 21.4 74,412
The weighted average domestic tax rate increased from 22.8% to 23.0%.

128
Improvement of results above expectations in certain tax jurisdictions resulted in utilisation of EUR 0.8 million
(2009: EUR 0.4 million) of previously unrecognised tax losses.
Adjustments for prior years relate to settlement of outstanding tax returns of several years and various fi scal tax
entities as well as the recognition of tax liabilities for fi scal positions taken that are currently being challenged
or probably will be challenged by tax authorities.
Income tax recognised in other comprehensive income and in equity
(EUR x 1,000) 2010 2009
Before tax
Tax (ex-
pense)/
benefi t Net of tax Before tax
Tax (ex-
pense)/
benefi t Net of tax
Defi ned benefi t plan actuarial gains (losses) 1,274 (539) 735 (14,493) 4,044 (10,449)
Net change in fair value of cash fl ow hedges
transferred to profi t or loss 1,388 (354) 1,034 1,388 (354) 1,034
Net change in fair value of hedge
of net investment in foreign operations 2,700 (1,836) 864 2,400 (612) 1,788
Share-based payment transactions 22,728 2,552 25,280 9,037 1,394 10,431
Net change in fair value of available-for-sale fi nancial
assets (438) – (438) 1,879 – 1,879
Foreign currency translation differences of
foreign operations and equity-accounted investees 108,493 266 108,759 45,515 2,002 47,517
136,145 89 136,234 45,726 6,474 52,200
Reference is also made to note 5.40.
5.34 C u r r e n t t a x a s s e t s a n d l i a b i l i t i e s
The net current tax liability of EUR 7,057 thousand (2009: EUR 36,200 thousand) represents the balance of
income tax payable and receivable in respect of current and prior periods less advance tax payments.

129Fugro Annual accounts 2010
5.35 P r o p e r t y , p l a n t a n d e q u i p m e n t
(EUR x 1,000) 2010
Land and
buildings
Plant and
equip-
ment Vessels
Fixed
assets
under con-
struction Other Total
Cost
Balance at 1 January 2010 155,595 922,775 450,189 164,319 190,266 1,883,144
Acquisitions through business combinations 2,112 (1,317) – – 2,136 2,931
Investments in assets under construction – – – 226,285 – 226,285
Other additions 5,793 147,339 3,309 – 16,295 172,736
Capitalised fi xed assets under construction – 61,860 209,228 (271,088) – –
Disposals (3,505) (64,384) (6,967) – (10,512) (85,368)
Effects of movement in foreign exchange rates 11,400 77,772 20,487 14,797 16,106 140,562
Balance at 31 December 2010 171,395 1,144,045 676,246 134,313 214,291 2,340,290
Depreciation and impairment losses
Balance at 1 January 2010 44,100 527,383 110,778 – 157,656 839,917
Depreciation 6,292 136,553 35,823 – 22,825 201,493
Disposals (2,161) (45,219) (6,956) – (8,137) (62,473)
Effects of movement in foreign exchange rates 2,152 47,935 6,459 – 13,493 70,039
Balance at 31 December 2010 50,383 666,652 146,104 – 185,837 1,048,976
Carrying amount
At 1 January 2010 111,495 395,392 339,411 164,319 32,610 1,043,227
At 31 December 2010 121,012 477,393 530,142 134,313 28,454 1,291,314
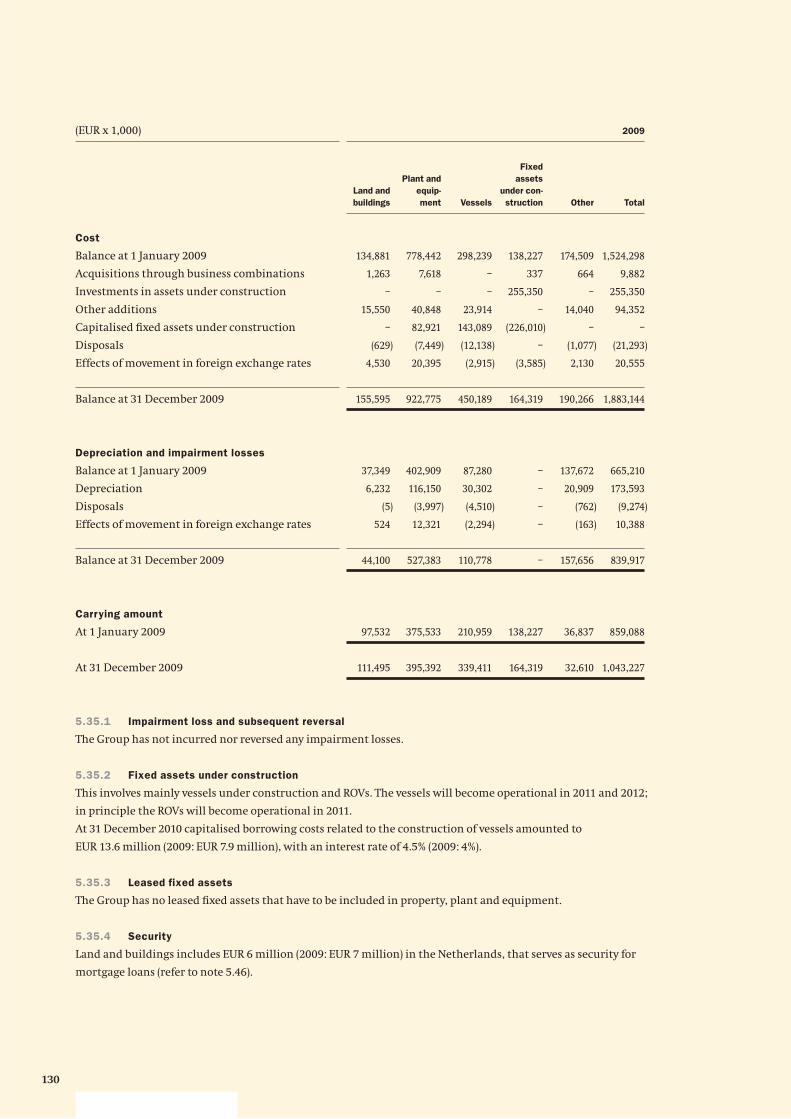
130
(EUR x 1,000) 2009
Land and
buildings
Plant and
equip-
ment Vessels
Fixed
assets
under con-
struction Other Total
Cost
Balance at 1 January 2009 134,881 778,442 298,239 138,227 174,509 1,524,298
Acquisitions through business combinations 1,263 7,618 – 337 664 9,882
Investments in assets under construction – – – 255,350 – 255,350
Other additions 15,550 40,848 23,914 – 14,040 94,352
Capitalised fi xed assets under construction – 82,921 143,089 (226,010) – –
Disposals (629) (7,449) (12,138) – (1,077) (21,293)
Effects of movement in foreign exchange rates 4,530 20,395 (2,915) (3,585) 2,130 20,555
Balance at 31 December 2009 155,595 922,775 450,189 164,319 190,266 1,883,144
Depreciation and impairment losses
Balance at 1 January 2009 37,349 402,909 87,280 – 137,672 665,210
Depreciation 6,232 116,150 30,302 – 20,909 173,593
Disposals (5) (3,997) (4,510) – (762) (9,274)
Effects of movement in foreign exchange rates 524 12,321 (2,294) – (163) 10,388
Balance at 31 December 2009 44,100 527,383 110,778 – 157,656 839,917
Carrying amount
At 1 January 2009 97,532 375,533 210,959 138,227 36,837 859,088
At 31 December 2009 111,495 395,392 339,411 164,319 32,610 1,043,227
5.35.1 Impairment loss and subsequent reversal
The Group has not incurred nor reversed any impairment losses.
5.35.2 Fixed assets under construction
This involves mainly vessels under construction and ROVs. The vessels will become operational in 2011 and 2012;
in principle the ROVs will become operational in 2011.
At 31 December 2010 capitalised borrowing costs related to the construction of vessels amounted to
EUR 13.6 million (2009: EUR 7.9 million), with an interest rate of 4.5% (2009: 4%).
5.35.3 Leased fixed assets
The Group has no leased fi xed assets that have to be included in property, plant and equipment.
5.35.4 Security
Land and buildings includes EUR 6 million (2009: EUR 7 million) in the Netherlands, that serves as security for
mortgage loans (refer to note 5.46).

131Fugro Annual accounts 2010
5.36 I n t a n g i b l e a s s e t s
(EUR x 1,000) 2010
Goodwill Software Other Total
Cost
Balance at 1 January 2010 459,745 92,163 15,273 567,181
Acquisitions through business combinations 39,735 29 – 39,764
Adjustments prior period 4,356 – – 4,356
Purchase of intangible assets – 13,740 2 13,742
Internally developed intangible assets – 8,486 – 8,486
Effect of movements in foreign exchange rates 22,787 5,611 2,259 30,657
Balance at 31 December 2010 526,623 120,029 17,534 664,186
Amortisation and impairment losses
Balance at 1 January 2010 – 68,339 6,152 74,491
Amortisation of intangible assets – 6,228 1,883 8,111
Effect of movements in foreign exchange rates – 4,361 790 5,151
Balance at 31 December 2010 – 78,928 8,825 87,753
Carrying amount
At 1 January 2010 459,745 23,824 9,121 492,690
At 31 December 2010 526,623 41,101 8,709 576,433

132
(EUR x 1,000) 2009
Goodwill Software Other Total
Cost
Balance at 1 January 2009 418,521 79,937 15,553 514,011
Acquisitions through business combinations 20,178 3,340 913 24,431
Adjustments prior period (221) – (1,543) (1,764)
Purchase of intangible assets – 694 – 694
Internally developed intangible assets – 5,893 – 5,893
Effect of movements in foreign exchange rates 21,267 2,299 350 23,916
Balance at 31 December 2009 459,745 92,163 15,273 567,181
Amortisation and impairment losses
Balance at 1 January 2009 – 57,690 4,191 61,881
Amortisation of intangible assets – 8,324 1,791 10,115
Effect of movements in foreign exchange rates – 2,325 170 2,495
Balance at 31 December 2009 – 68,339 6,152 74,491
Carrying amount
At 1 January 2009 418,521 22,247 11,362 452,130
At 31 December 2009 459,745 23,824 9,121 492,690
5.36.1 Impairment loss and subsequent reversal
The Company has not incurred nor reversed any impairment losses.
5.37 I m p a i r m e n t t e s t i n g fo r c a s h - ge n e r a t i n g u n i t s c o n t a i n i n g go o d w i l l
For the purpose of impairment testing, goodwill is allocated to cash-generating units which represent the lowest
level within the Group at which the goodwill is monitored for internal management purposes and which is not
higher than the Group’s operating segments as reported in note 5.25. The aggregate carrying amounts of
goodwill are allocated to the following groups of cash-generating units:
(EUR x 1,000) 2010 2009
Geotechnical 76,830 65,647
Survey 252,663 203,391
Geoscience 197,130 190,707
Total 526,623 459,745

133Fugro Annual accounts 2010
The recoverable amounts of the cash-generating units that carry goodwill are determined based on calculations
of value in use. Value in use was determined by discounting the expected future cash fl ows from the continuing
use of the units. Unless indicated otherwise, value in use in 2010 was determined similarly as in 2009. The
calculation of the value in use was based on the following key assumptions:
– The period for the discounted cash fl ow calculations is in principle indefi nite. However the Group has set the
period at fi fty years, subject to periodic evaluation, for the following reasons. About 73% of the Group’s
activities relate to the oil and gas industry. The services are in principle of such a nature that our clients use us
to help them to explore and extract hydrocarbon and mineral resources. Experts are without doubt that these
resources will continue to be available to mankind for many decades and their reports indicate periods
between fi fty and hundred years. The Group recognises that harnessing alternative means of energy, like
wind, nuclear and hydro electric energy will continue. These sources however have limited output and will be
diffi cult to transport.
– Cash fl ows in the fi rst year of the forecast are based on the approved profi t plan. The anticipated annual
revenue growth for following years has been based on average growth levels ranging from 0 to 3.5%.
– The pre-tax discount rate used to discount the pre-tax cash fl ows used for impairment testing purposes is
determined through an iterative calculation method using the projected post-tax cash fl ows, expected tax rate
for the respective cash generating unit and post-tax discount rate for the Group. The weighted average pre-tax
discount rate for the Group is 10.6% (2009: 10.8%).
The key assumptions and the approach to determine their value are the growth rates that are based on analysis
of the long-term market price trends in the oil and gas industry adjusted for actual experience.
The carrying amounts of the units remain below the recoverable amounts and as such no impairment losses are
accounted for. Considering the signifi cant headroom (recoverable amounts exceeding carrying amounts), no
sensitivity analysis has been prepared. Future adverse changes in the assumptions could however reduce the
recoverable amounts below the carrying amount. As at 31 December 2010 no cumulative impairment losses have
been recognised (2009: none).
5.38 I n ve s t m e n t s i n e q u i t y - a c c o u n t e d i n ve s t e e s
The carrying amount of the equity-accounted investees of the Group can be summarised as follows:
(EUR x 1,000) 2010 2009
Equity-accounted investees 7,836 1,359
The Group’s share in realised profi t in the above mentioned equity-accounted investees amounted to
EUR 1,018 thousand positive in 2010 (2009: EUR 422 thousand positive).
In 2010 and 2009 the Group did not receive dividends from any of its investments in equity-accounted investees
or other investments.
None of the group’s equity-accounted investees are publicly listed entities and consequently they do not have
published price quotations.
Not adjusted for the percentage ownership held by the Group, the equity-accounted investees have assets
of EUR 46 million (2009: EUR 4 million), liabilities of EUR 30 million (2009: EUR 1 million), revenues of
EUR 20 million (2009: EUR 12 million) and profi t of EUR 4 million (2009: EUR 2 million). The increase compared to
2009 is mainly a result of the acquisition of RUE.

134
5.39 O t h e r i n ve s t m e n t s
The Group holds the following other investments:
(EUR x 1,000) 2010 2009
Other investments in equity instruments 1,095 1,095
Long-term loans 31,623 13,177
Financial assets at fair value through profi t or loss 25,636 5,129
Available-for-sale fi nancial assets 2,812 2,653
Other long-term receivables 1,367 1,487
62,533 23,541
The Group has the following other investments in equity instruments accounted for at cost:
Name of the company
(EUR x 1,000) Country Ownership Assets Liabilities Equity Revenue
Profi t/
loss
La Coste & Romberg-Scintrex USA 11% 13,520 12,545 975 14,549 (595)
The Group’s other investments in equity instruments are not listed. A reliable fair value estimate cannot
be made.
In July 2010, Fugro granted a loan to Electro Magnetic GeoServices ASA (EMGS) of US dollar 20 million. The loan
has a maturity of 3.5 years, carries an interest rate of Libor plus 8% and is secured by the income of the Pemex
contract which EMGS is carrying out.
In 2009 the Group has provided a long-term convertible loan of NOK 150 million at 7.0% per annum to Electro
Magnetic GeoServices ASA. The conversion feature has been accounted for as fi nancial asset at fair value through
profi t or loss. The loan can at any time be converted into common shares in EMGS at the conversion price of
NOK 5.40 per share until the maturity date on 2 January 2012.
The fair value of the available for sale fi nancial assets is based on quoted prices of these companies on the
Australian Securities Exchange (ASX).
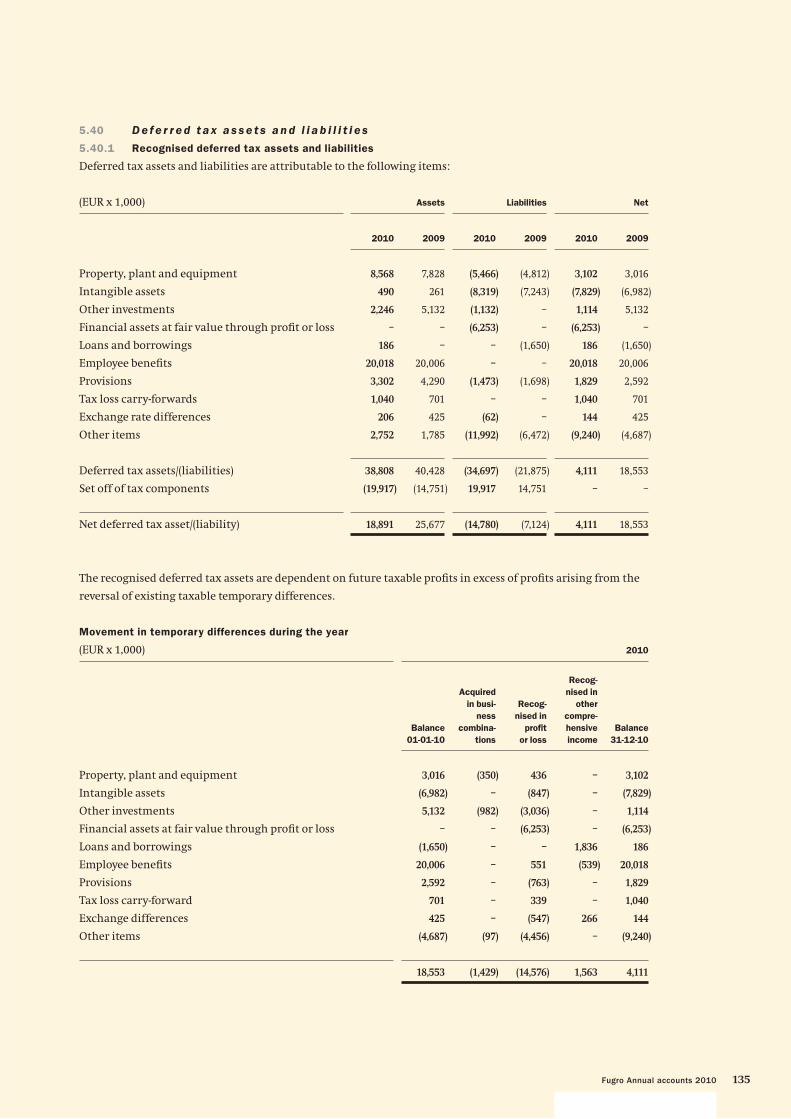
135Fugro Annual accounts 2010
5.40 D e f e r r e d t a x a s s e t s a n d l i a b i l i t i e s
5.40.1 Recognised deferred tax assets and liabilities
Deferred tax assets and liabilities are attributable to the following items:
(EUR x 1,000) Assets Liabilities Net
2010 2009 2010 2009 2010 2009
Property, plant and equipment 8,568 7,828 (5,466) (4,812) 3,102 3,016
Intangible assets 490 261 (8,319) (7,243) (7,829) (6,982)
Other investments 2,246 5,132 (1,132) – 1,114 5,132
Financial assets at fair value through profi t or loss – – (6,253) – (6,253) –
Loans and borrowings 186 – – (1,650) 186 (1,650)
Employee benefi ts 20,018 20,006 – – 20,018 20,006
Provisions 3,302 4,290 (1,473) (1,698) 1,829 2,592
Tax loss carry-forwards 1,040 701 – – 1,040 701
Exchange rate differences 206 425 (62) – 144 425
Other items 2,752 1,785 (11,992) (6,472) (9,240) (4,687)
Deferred tax assets/(liabilities) 38,808 40,428 (34,697) (21,875) 4,111 18,553
Set off of tax components (19,917) (14,751) 19,917 14,751 – –
Net deferred tax asset/(liability) 18,891 25,677 (14,780) (7,124) 4,111 18,553
The recognised deferred tax assets are dependent on future taxable profi ts in excess of profi ts arising from the
reversal of existing taxable temporary differences.
Movement in temporary differences during the year
(EUR x 1,000) 2010
Balance
01-01-10
Acquired
in busi-
ness
combina-
tions
Recog-
nised in
profi t
or loss
Recog-
nised in
other
compre-
hensive
income
Balance
31-12-10
Property, plant and equipment 3,016 (350) 436 – 3,102
Intangible assets (6,982) – (847) – (7,829)
Other investments 5,132 (982) (3,036) – 1,114
Financial assets at fair value through profi t or loss – – (6,253) – (6,253)
Loans and borrowings (1,650) – – 1,836 186
Employee benefi ts 20,006 – 551 (539) 20,018
Provisions 2,592 – (763) – 1,829
Tax loss carry-forward 701 – 339 – 1,040
Exchange differences 425 – (547) 266 144
Other items (4,687) (97) (4,456) – (9,240)
18,553 (1,429) (14,576) 1,563 4,111

136
(EUR x 1,000) 2009
Balance
01-01-09
Acquired
in busi-
ness com-
bina-tions
Recog-
nised in
profi t or
loss
Recog-
nised in
other
compre-
hensive
income
Balance
31-12-09
Property, plant and equipment 725 (232) 2,523 – 3,016
Intangible assets (5,821) (362) (799) – (6,982)
Other investments – – 5,132 – 5,132
Loans and borrowings 1,213 – 594 (3,457) (1,650)
Employee benefi ts 14,495 (273) 1,740 4,044 20,006
Provisions 12,868 – (10,276) – 2,592
Tax loss carry-forward 1,215 – (514) – 701
Exchange differences 178 – (1,755) 2,002 425
Other items 441 (311) (4,817) – (4,687)
25,314 (1,178) (8,172) 2,589 18,553
5.40.2 Unrecognised deferred tax assets and liabilities
Deferred tax has not been recognised in respect of the following items:
Unrecognised deferred tax assets
(EUR x 1,000) 2010 2009
Deductible temporary differences 3,073 1,624
Tax losses 21,352 16,860
Capital allowances 3,199 3,227
Total 27,624 21,711
Unrecognised deferred tax assets relate to tax units previously suffering losses for which it is currently not
probable that future taxable profi t will be available to offset these losses, taking into account fi scal restrictions
on the utilisation of loss compensation.

137Fugro Annual accounts 2010
Unrecognised tax assets changed over the period as follows:
Unrecognised deferred tax assets
(EUR x 1,000) 2010 2009
As of 1 January 21,711 14,867
Movements during the period:
Additional losses 4,789 8,748
Utilisation (822) (439)
Recognition of previously unrecognised temporary differences – (773)
Recognition of previously unrecognised tax losses (495) (1,208)
Effect of change in tax rates (105) (56)
Exchange rate differences 1,583 1,139
Change from reassessment 963 (567)
As of 31 December 27,624 21,711
Reassessment of tax compensation opportunities under applicable tax regulations has resulted in an increase of
unrecognised deferred tax assets of EUR 1.0 million (2009: EUR 0.6 million decrease).
Of the total recognised and unrecognised deferred tax assets in respect of tax losses carried forward an amount
of EUR 1,308 thousand expires in periods varying from two to fi ve years. An amount of EUR 4,022 thousand
expires between fi ve and ten years and an amount of EUR 17,062 thousand can be offset indefi nitely.
The deductible temporary differences and capital allowances do not expire under current tax legislation.
Deferred tax assets have not been recognised in respect of these items, because it is not probable that future
taxable profi t will be available against which the Group can utilise these benefi ts.
Based on forecasted results per tax jurisdiction, management considered it probable that suffi cient future
taxable profi t will be generated to utilise deferred tax assets depending on taxable profi ts in excess of the profi ts
arising from the reversal of existing temporary differences.
Unrecognised deferred tax liabilities
At 31 December 2010 no deferred tax liabilities relating to investments in subsidiaries have been recognised
(2009: nil), because Fugro controls whether the liability will be incurred and it is satisfi ed that it will not be
incurred in the foreseeable future.
In some of the countries where the Group operates, local tax laws provide that gains on disposal of certain assets
are tax exempt, provided that the gains are not distributed. The company does not intend to distribute such
gains; therefore no tax liabilities are recognised in this respect.
5.41 I n ve n t o r i e s
(EUR x 1,000) 2010 2009
Seismic and geological data libraries 204,485 68,511
Other inventories 14,543 12,123
219,028 80,634

138
Seismic and geological data libraries
Seismic and geological data libraries are stated at the lower of cost and net realisable value. During 2010
EUR 88.8 million (2009: EUR 64.0 million) of seismic and geological data libraries were recorded in third party
costs.
Other inventories
During 2010 EUR 19,340 thousand (2009: EUR 19,936 thousand) of other inventories were recognised as an
expense and EUR 504 thousand (2009: EUR 136 thousand) was written down. The write down is included in third
party costs.
5.42 Tr a d e a n d o t h e r r e c e i va b l e s
(EUR x 1,000) 2010 2009
Unbilled revenue on completed projects 221,355 154,426
Trade receivables 444,097 328,403
Non-trade receivables 135,106 86,924
Work in progress 2,683 2,257
803,241 572,010
Unbilled revenue on completed projects includes aggregated costs and recognised profi ts, net of recognised
losses for all contracts in progress for which this amount exceeds progress billings.
At 31 December 2010 trade receivables include retentions of EUR 7.2 million (2009: EUR 7.3 million) relating to
completed projects.
Trade receivables are shown net of impairment losses amounting to EUR 47.3 million (2009: EUR 41.9 million)
arising from identifi ed doubtful receivables from customers. Trade receivables were impaired taking into
account the fi nancial position of the debtors, the days outstanding and expected outcome of negotiations and
legal proceedings against debtors. Unbilled revenue on completed projects does not include impairment losses
(2009: EUR 5.0 million).
Reference is made to note 5.51 and 5.53 for detailed information on the credit and currency risks,
and impairment losses related to trade receivables.
5.43 C a s h a n d c a s h e q u i va l e n t s
(EUR x 1,000) 2010 2009
Cash and cash equivalents 81,363 107,795
Bank overdraft (300,301) (167,556)
Cash and cash equivalents in the consolidated statement of cash fl ows (218,938) (59,761)
At 31 December 2010 and 31 December 2009 all cash and cash equivalents are freely available to the Group.

139Fugro Annual accounts 2010
5.44 To t a l e q u i t y
5.44.1 Share capital
(In thousands of shares) Ordinary shares
2010 2009
On issue and fully paid at 1 January 78,773 76,608
Stock dividend 2009 respectively 2008 1,497 2,165
Repurchased for option programme at year-end (883) (1,219)
On issue and fully paid at 31 December – entitled to dividend 79,387 77,554
On 31 December 2010 the authorised share capital amounts to EUR 16 million (2009: EUR 16 million) divided into
96 million ordinary shares, each of EUR 0.05 nominal value (2009: 96 million) and 224 million various types of
preference shares, each of EUR 0.05 nominal value (2009: 224 million). On 31 December 2010 the issued share
capital amounted to EUR 4,013,484.20. As of this date, 83.6% of the ordinary shares (80,269,684 shares) were
issued. No preference shares have been issued. In 2010 a total number of 1,497,206 certifi cates of shares were
issued by Fugro Trust Offi ce (2009: 2,164,520). The holders of ordinary shares are entitled to dividends as
approved by the Annual General Meeting of Shareholders from time to time. Furthermore they are entitled to
one vote per share in Fugro’s shareholders meeting. The holders of certifi cates of shares are entitled to the same
dividend but they are not entitled to voting rights. Under certain conditions the holder of certifi cates can
exchange his certifi cates into ordinary shares and vice versa. For more details reference is made to page 80.
The Board of Management proposes a dividend for 2010 of EUR 1.50 (2009: EUR 1.50) per (certifi cate of) share,
to be paid at the option of the holder in cash or in (certifi cates of) shares. This dividend proposal is currently part
of unappropriated result.
5.44.2 Share premium
The share premium can be considered as paid in capital.
5.44.3 Translation reserve
The Translation reserve comprises all foreign currency differences arising from the translation of the fi nancial
statements of foreign operations, as well as from the translation of liabilities that hedge the Company’s net
investment in a foreign subsidiary.
5.44.4 Hedging reserve
The Hedging reserve comprises the effective portion of the cumulative net change in the fair value of cash fl ow
hedging instruments related to hedged transactions that have not yet occurred.
5.44.5 Reserve for own shares
Fugro purchases certifi cates of own shares to cover its option scheme. Fugro purchased 800,000 certifi cates of
shares during the year under review at an average price of EUR 44.70 (2009: 550,000 certifi cates at an average
price of EUR 22.49). 1,135,980 (certifi cates of) shares were sold at an average price of EUR 49.11 with respect to
exercise of options (2009: 800,920 at an average price of EUR 35.84). As per 31 December 2010 Fugro holds 882,796
own certifi cates of shares (2009: 1,218,776) with respect to the option scheme. This was 1.1% of the issued capital
(2009: 1.5%).

140
5.44.6 Unappropriated result
After the reporting date the following dividends were proposed by the Board of Management. There are no
corporate income tax consequences related to this proposal.
(EUR x 1,000) 2010 2009
EUR 1.50 per qualifying (certifi cate of a) share (2009: EUR 1.50) 119,081 116,331
119,081 116,331
5.45 E a r n i n g s p e r s h a r e
The basic earnings per share for 2010 amount to EUR 3.47 (2009: EUR 3.46); the diluted earnings per share
amount to EUR 3.42 (2009: EUR 3.42).
The calculation of basic earnings per share at 31 December 2010 is based on the profi t attributable to owners of
the Company of EUR 272,219 thousand (2009: EUR 263,410 thousand) and a weighted average number of shares
outstanding during the year ended 31 December 2010 of 78,357 thousand (2009: 76,210 thousand), calculated as
follows:
5.45.1 Basic earnings per share
Profit attributable to owners of the Company
(EUR x 1,000) 2010 2009
Profi t for the period 280,153 273,065
Non-controlling interest (7,934) (9,655)
Profi t attributable to owners of the Company 272,219 263,410
Weighted average number of ordinary shares
(In thousands of shares) 2010 2009
On issue and fully paid at 1 January 77,554 75,138
Effect of own shares held (493) (427)
Effect of shares issued due to exercised options 410 227
Effect of shares issued due to optional dividend 886 1,272
Weighted average number of ordinary shares at 31 December 78,357 76,210

141Fugro Annual accounts 2010
5.45.2 Diluted earnings per share
The calculation of diluted earnings per share at 31 December 2010 was based on profi t attributable to owners
of the Company of EUR 272,219 thousand (2009: EUR 263,410 thousand), and a weighted average number of
ordinary shares outstanding after adjustment for the effects of all dilutive potential ordinary shares of
79,554 thousand (2009: 77,002 thousand), calculated as follows:
Net profit attributable to owners of the Company (diluted)
(EUR x 1,000) 2010 2009
Profi t attributable to owners of the Company 272,219 263,410
Profi t attributable to owners of the Company (diluted) 272,219 263,410
Weighted average number of ordinary shares (diluted)
(In thousands of shares) 2010 2009
Weighted average number of ordinary shares at 31 December 78,357 76,210
Effect of share options on issue 1,197 792
Weighted average number of ordinary shares (diluted) at 31 December 79,554 77,002
5.46 L o a n s a n d b o r r ow i n g s
This note provides information about the contractual terms of the Group’s interest-bearing loans and
borrowings, which are measured at amortised cost. For more information about the Group’s exposure to
currency risk, interest rate risk, and liquidity risk, refer to note 5.52, 5.53 and 5.54.
Non-current liabilities
(EUR x 1,000) 2010 2009
Bank loans 491,820 343,889
Private Placement loans in USD 89,634 82,376
Private Placement loans in EUR 20,000 20,000
Mortgage loans 5,808 6,234
Other loans and long-term borrowings 7,258 14,666
Subtotal 614,520 467,165
Less: current portion of loans and borrowings 23,658 25,826
590,862 441,339

142
Terms and debt repayment schedule
Terms and conditions of outstanding loans were as follows:
(EUR x 1,000) 2010 2009
Currency
Nominal
interest
rate
Year of
maturity
Face
value
Carrying
value
Face
value
Carrying
value
Bank loans EUR
EURIBOR
+180 bps 2011-2013 500,000 491,820 345,000 343,889
Private Placement loans:
44 million USD bonds USD 6.85% 2012 33,000 32,878 30,360 30,219
39 million USD bonds USD 6.95% 2014 29,250 29,128 26,910 26,769
37 million USD bonds USD 7.10% 2017 27,750 27,628 25,530 25,388
20 million Eurobonds EUR 6.45% 2012 20,000 20,000 20,000 20,000
Mortgage and other loans and long-term
borrowings Variable 4.34% 2011-2012 13,066 13,066 20,900 20,900
623,066 614,520 468,700 467,165
The mortgage loans are secured over land and buildings with a carrying amount of EUR 6 million
(2009: EUR 7 million).
5.46.1 Bank loans
The bank loans consist of revolving credit facilities with the Royal Bank of Scotland (EUR 100 million), Rabobank
(EUR 100 million), ING Groep N.V. (EUR 100 million) and BNP Paribas (EUR 50 million) maturing in April 2012.
In 2010 the facility with BNP Paribas was increased to EUR 100 million.
In 2008 agreement was reached with Rabobank for a revolving facility of EUR 100 million, maturing in 2013.
The Rabobank facility is repaid in quarterly instalments of EUR 5 million.
Early 2010 agreement was reached with ABN AMRO Bank N.V. for a revolving facility of EUR 50 million against
similar conditions as the facilities already in place, maturing in April 2012. Early 2011 agreement was reached to
increase the existing credit facility by EUR 50 million to EUR 100 million under the same terms and conditions.
The average interest rate of the facilities is Euribor plus 180 base points. At 31 December 2010 a total amount of
EUR 492 million of the credit facilities was in use.
5.46.2 Private Placement loans
In May 2002 long-term loans were concluded with twenty American and two British institutional investors.
As per 8 May 2007 the Group terminated a Cross Currency Swap (foreign exchange contract related to the
US Dollar exposure of the loans). The cumulative exchange differences as per termination date have been added
to equity (Hedging reserve) and are being charged to profi t or loss account during the remaining term of the
loan. This resulted during 2010 in a cost of EUR 1,034 thousand (2009: EUR 1,034 thousand).
At reporting date the loans are valued at the closing rate. The currency exchange difference on the loans between
the initial exchange rate and the exchange rate at the reporting date is accounted for in the Translation reserve.
For the year under review the currency exchange differences on loans in US dollars amount to EUR 7,200
thousand negative (2009: EUR 2,400 thousand positive).

143Fugro Annual accounts 2010
5.46.3 Covenant requirements
Both the credit facilities as well as the Private Placement loans contain covenant requirements which can be
summarised as follows:
– Equity > EUR 200 million (only applicable to Private Placement loans)
– EBITDA/Interest > 2.5
– Debt/EBITDA < 3.0
– Solvency > 30% (only applicable to credit facilities agreed on or after 3 November 2009)
– Consolidated Financial Indebtedness of the Subsidiaries (only applicable to Private Placement loans) < 15%
of the consolidated balance sheet total.
At the twelve month rolling forward measurement dates in 2010 and 2009, the Company complied with the
above conditions.
5.46.4 Mortgage and other loans and long-term borrowings
The average interest rate on mortgage loans and other loans and long-term borrowings over one year amounts to
4.3% (2009: 4.2%).
5.46.5 Change of control provisions
A change of control of Fugro could result in early repayment of the credit facilities (5.46.1) and the Private
Placement loans (5.46.2).
5.47 E m p l oy e e b e n e f i t s
(EUR x 1,000) 2010 2009
Present value of funded obligations 272,497 244,362
Fair value of plan assets (207,978) (179,643)
Recognised net liability for defi ned benefi t obligations 64,519 64,719
Liability for long-service leave 11,581 7,863
Total employee benefi t liabilities 76,100 72,582
The Group makes contributions to a number of pension plans, both defi ned benefi t plans as well as defi ned
contribution plans, that provide pension benefi ts for employees upon retirement in a number of countries.
The most important plans relate to plans in the Netherlands, United Kingdom, Norway and the United States;
details of which are as follows:
– In the Netherlands the Group provides for a pension plan based on average salary. This plan qualifi es as a
defi ned benefi t scheme. The pension commitments from this scheme are fully insured on the basis of a
guarantee contract. The scheme includes a (conditional) indexation of pension benefi ts as far as the return on
the separated investments surpasses the actuarial required interest.
– In the United Kingdom the Group operates two defi ned benefi t pension schemes considering either a
guaranteed minimum pension or a maximum lump sum entitlement. The pension schemes have been closed
in previous years for new participants, but include the on-going obligations to their members (both former
and present employees). The pension scheme assets are held in separate Trustee-administered funds to meet
long-term pension liabilities to former and present employees. The Trustees are required to act in the best
interest of the scheme’s participants and the appointment of trustees is determined by the scheme’s trust
documentation.
– In Norway a defi ned benefi t pension plan exists that, combined with the available State pension plan, leads to
a pension at the age of 67 years based on a defi ned maximum. The pension rights have been secured in an
external pension insurance.

144
– In the United States of America the Group operates a 401K plan for its employees. The Group contributes
towards the deposits of its employees in accordance with agreed rules and taking into account the regulations
of the IRS, the US tax authority. This plan qualifi es as a defi ned contribution plan.
Liability for defined benefit obligations
Plan assets consist of the following:
(EUR x 1,000) 2010 2009
Equity securities 69,063 64,763
Government bonds 99,759 84,909
Corporate bonds 16,269 8,500
Real estate 14,578 11,727
Cash 8,309 9,744
207,978 179,643
Movements in the present value of the funded defined benefit obligations
(EUR x 1,000) 2010 2009
Defi ned benefi t obligations at 1 January 244,362 190,269
Benefi ts paid by the plan (4,268) (4,278)
Contributions paid by plan participants 2,198 2,158
Current service costs and interest (see below) 19,717 17,092
Actuarial gains and losses recognised in other comprehensive income
(see below) 5,792 29,096
Effect of movement in exchange rates 4,696 10,025
Defi ned benefi t obligations at 31 December 272,497 244,362
Movement in the fair value of plan assets
(EUR x 1,000) 2010 2009
Fair value of plan assets at 1 January 179,643 143,757
Contributions paid by the employer 9,717 8,044
Contributions paid by plan participants 2,198 2,158
Benefi ts paid by the plan (4,268) (4,278)
Expected return on plan assets 10,739 8,703
Actuarial gains and losses recognised in other comprehensive income
(see below) 7,066 14,603
Effect of movement in exchange rates 2,883 6,656
Fair value of plan assets at 31 December 207,978 179,643

145Fugro Annual accounts 2010
Expenses recognised in profit or loss
(EUR x 1,000) 2010 2009
Current service costs 6,201 5,503
Interest on obligation 13,516 11,589
19,717 17,092
Expected return on plan assets (10,739) (8,703)
8,978 8,389
The expenses are recognised in the following line items in the statement of comprehensive income:
(EUR x 1,000) 2010 2009
Personnel expenses 8,978 8,389
Actual return on plan assets
(EUR x 1,000) 2010 2009
Actual return on plan assets 17,806 23,306
Actuarial gains and losses recognised directly in other comprehensive income
(EUR x 1,000) 2010 2009
Cumulative amount at 1 January (33,914) (17,826)
Recognised during the year 1,274 (14,493)
Effect of movement in exchange rates (269) (1,595)
Cumulative amount at 31 December (32,909) (33,914)
Actuarial assumptions
Principal actuarial assumptions at the reporting date (expressed as a range of weighted averages):
2010 2009
Discount rate at 31 December 4.0 – 5.4% 4.4 – 5.7%
Expected return on plan assets 5.0 – 6.9% 5.0 – 7.45%
Future salary increases 2.0 – 4.0% 2.0 – 4.25%
Medical cost trend rate n/a n/a
Future pension increases 2.0 – 3.75% 2.0 – 4.0%
The fi nancial effects of differences between the actuarial assumptions and actuals for the pension liability and
plan assets are included in the actuarial gains and losses.

146
Assumptions regarding future mortality are based on published statistics and mortality tables:
Netherlands: Generation table 2010-2060 For men and women, an age correction of (– 1: – 1) is applied.
United Kingdom: PxA (00) rated + 2, by year of birth with long coherent improvements.
Norway: K2005
The calculation of the defi ned benefi t obligation is sensitive to the mortality assumptions. As the actuarial
estimates of mortality continue to be refi ned, an increase of one year in the lives is considered reasonably
possible in the next fi nancial year. The effect of this change would be an increase in the employee benefi t liability
by EUR 6.8 million.
The overall expected long-term rate of return on assets is 5.9%. The expected long-term rate of return is based on
the portfolio as a whole and not on the sum of the returns on individual asset categories. The return is based
exclusively on historical returns, without adjustments.
Historical information
(EUR x 1,000) 2010 2009 2008 2007 2006
Present value of the defi ned obligation 272,497 244,362 190,269 209,738 216,474
Fair value of plan assets 207,978 179,643 143,757 185,917 183,207
Defi cit in the plan (64,519) (64,719) (46,512) (23,821) (33,267)
Experience adjustments arising on plan liabilities 1,418 1,269 (1,982) (14,204) 1,932
Experience adjustments arising on plan assets 7,066 14,603 (35,150) (4,358) (813)
The estimated planned contributions 2011 amount to EUR 10.0 million (estimate 2010: EUR 8.8 million).
5.48 P r o v i s i o n s
(EUR x 1,000) 2010 2009
Restruc-
turing
Proce-
dures Total
Restruc-
turing
Proce-
dures Total
Balance at 1 January 36 6,204 6,240 137 13,018 13,155
Provisions made during the year – – – – 1,050 1,050
Provisions used during the year (36) (36) (101) (194) (295)
Provisions reversed during the year – (1,045) (1,045) – (7,807) (7,807)
Unwinding of discount – 45 45 – 137 137
Balance at 31 December – 5,204 5,204 36 6,204 6,240
Non-current – 5,204 5,204 36 6,204 6,240

147Fugro Annual accounts 2010
Procedures
The Group is involved in several legal proceedings in various jurisdictions (including the USA) as a result of its
normal business activities, either as plaintiff or as defendant. The Board of Management ensures that these cases
are vigorously defended. Fugro has set up adequate provisions for those claims where management believes it is
probable that a liability has been incurred and the amount is reasonably estimable. These provisions are
reviewed periodically and adjusted if necessary. Considering the expected duration of the (legal) proceedings,
management does not expect the legal actions, for which a provision has been set-up, to be completed within the
next year. The expected outfl ows of economic benefi ts have been discounted at a rate of 4.5%, and are based on
management’s best estimate. Final settlements can differ from this estimate, and could require revisions to the
estimated provisions. In 2010, Fugro settled a number of claims without incurring costs. Consequently part of
the provision for procedures has been reversed.
5.49 Tr a d e a n d o t h e r p a ya b l e s
(EUR x 1,000) 2010 2009
Trade payables 147,709 74,249
Advance instalments to work in progress 49,285 32,527
Non-trade payables and accrued expenses 277,214 243,267
Balance at 31 December 474,208 350,043
5.50 F i n a n c i a l r i s k m a n a ge m e n t
5.50.1 Overview
The Company’s risk management policy includes the long-term sustainable management of its business
activities and where possible, the mitigation of the associated business risks. Based on the nature and relative
signifi cance of the risks related to the Group’s wide diversity of markets, clients and regions and its broad
portfolio of activities the risks have been quantifi ed to the extent possible.
The Group has exposure to the following risks from its use of fi nancial instruments:
– credit risk
– liquidity risk
– market risk
This note presents information about the Group’s exposure to each of the above risks, the Group’s objectives,
policies and processes for measuring and managing risk, and the Group’s management of capital.
The Board of Management has overall responsibility for the establishment and oversight of the Group’s risk
management framework.
The Group’s risk management policies are established to identify and analyse the risks faced by the Group, to set
appropriate risk limits and controls, and to monitor risks and adherence to limits. Risk management policies
and systems are reviewed regularly to refl ect changes in market conditions and the Group’s activities. The Group,
through its training and management standards and procedures, aims to develop a disciplined and constructive
control environment in which all employees understand their role and obligations.
The Audit Committee oversees how management monitors compliance with the Group’s risk management
policies and procedures and reviews the adequacy of the risk management framework in relation to the risks
faced by the Group. The Audit Committee is assisted in its oversight role by internal audit. Both regular and
ad hoc reviews of risk management controls and procedures are performed, the results of which are reported

148
directly to the Board of Management and Executive Committee. A summary of important observations is
reported to the Audit Committee.
5.50.2 Credit risk
Credit risk is the risk of fi nancial loss to the Group if a customer or counterparty to a fi nancial instrument fails to
meet its contractual obligations, and arises principally from the Group’s receivables from customers.
Trade and other receivables
The Group’s exposure to credit risk is infl uenced mainly by the individual characteristics of each client. However,
management also considers the composition of the Group’s client base, including the default risk of the industry
and country in which clients operate, as these factors may have an infl uence on credit risk. As the Group operates
to a large extent in the oil and gas industry a signifi cant portion of trade and other receivables relates to clients
from this industry.
Some of the Group’s orders are awarded on the basis of long-term preferred supplier agreements. In the course of
a year Fugro often carries out multiple projects for the same client. The projects carried out for any single client
do not, however, account for more than some 4% on an annual basis of the total revenue. Having a large number
of clients and short project time spans mitigates Fugro’s credit risk as the individual amounts receivable with
the same client are limited.
New customers are analysed individually for creditworthiness before payment and delivery terms and conditions
are offered. The Group’s review may include external ratings, where available, and in some cases bank
references. Customers that fail to meet the Group’s benchmark creditworthiness may transact with the Group
only on a prepayment basis or have to provide a bank guarantee.
The majority of the Group’s clients has done business with the Group for many years and signifi cant losses have
only occurred incidentally in prior years. However, as a result of the expected negative effects of the current
worldwide economic crisis the credit risk has increased signifi cantly. Clients that are known to have negative
credit characteristics are individually monitored by the group controllers. Findings are reported on a bi-weekly
basis to the Board of Management. If clients fail to pay timely the Group re-assesses the creditworthiness and
stronger debt collection is started if deemed necessary. The Group publishes an internal list of clients that need
extra attention before a contract is closed.
The Board of Management reviews frequently the outstanding trade receivables. Local management is requested
to take additional precaution in working with affected clients.
The Group establishes an allowance for impairment that represents its estimate of incurred losses in respect of
trade and other receivables. The main components of this allowance are a specifi c loss component that relates to
individually signifi cant exposures, and a collective loss component established for groups of similar assets in
respect of losses that have been incurred but not yet identifi ed. The collective loss allowance is determined based
on historical data of payment statistics for similar fi nancial assets.
The Group held cash and cash equivalents of EUR 81.4 million at 31 December 2010 (2009: EUR 107.8 million),
which represents its maximum credit exposure on these assets. The cash and cash equivalents are held with
bank and fi nancial institution counterparties, which have ‘investment grade’ credit ratings.
Guarantees
In principle Fugro does not provide parent company guarantees to its subsidiaries, unless signifi cant commercial
reasons exist. Fugro has fi led declarations of joint and several liability for a number of subsidiaries at the
Chambers of Commerce. Fugro has fi led a list with the Chamber of Commerce which includes all fi nancial

149Fugro Annual accounts 2010
interests of Fugro as well as a reference to each subsidiary for which such a declaration of liability has been
deposited. At 31 December 2010 and at 31 December 2009 no signifi cant guarantees were outstanding.
5.50.3 Liquidity risk
Liquidity risk is the risk that the Group will encounter diffi culty in meeting the obligations associated with
its fi nancial liabilities that are settled by delivering cash or another fi nancial asset. The Group’s approach to
managing liquidity is to ensure, as far as possible, that it will always have suffi cient liquidity to meet its
liabilities when due, under both normal and stressed conditions, without incurring unacceptable losses or
risking damage to the Group’s reputation.
The Group monitors cash fl ow on a regular basis. Consolidated cash fl ow information including a six months
projection is reported on a monthly basis to the Executive Committee, ensuring that the Group has suffi cient
cash on demand (or available lines of credit) to meet expected operational expenditures for the next half-year,
including the servicing of fi nancial obligations from lease commitments not included in the statement of
fi nancial position and investment programs in vessels. Cash fl ows exclude the potential impact of extreme
circumstances that cannot reasonably be predicted, such as natural disasters. The Group maintains the following
lines of credit:
– Revolving lines of credit with ABN AMRO Bank N.V. (verbally agreed increase from EUR 50 million to EUR 100
million in 2010), ING Groep N.V., Rabobank, Royal Bank of Scotland and BNP Paribas of each EUR 100 million
maturing on 1 April 2012. The average interest rate is currently EURIBOR plus 180 base points. At 31 December
2010 (EUR 442 million) and 2009 (EUR 275 million) the facilities are almost fully drawn.
– Revolving lines of credit with Rabobank of EUR 100 million, maturing in May 2013. The Rabobank facility is
fully drawn at 31 December 2010. The facility is being repaid in equal quarterly instalments. The balance at
31 December 2010 is EUR 50 million.
– A variety of unsecured overdraft facilities in various currencies totalling around EUR 525 million of which
EUR 270 million has been drawn at 31 December 2010 (2009: around EUR 425 million with EUR 62.3 million
drawn).
5.50.4 Market risk
Market risk includes changes in market prices, such as foreign exchange rates, interest rates and equity prices
will affect the Group’s income or the value of its holdings of fi nancial instruments. The objective of market risk
management is to manage and control market risk exposures within acceptable parameters, while optimising
the return.
Currency risk
The global nature of the business of the Group exposes the operations and reported fi nancial results and cash
fl ows to the risks arising from fl uctuations in exchange rates. The Group’s business is exposed to currency risk
whenever it has revenues in a currency that is different from the currency in which it incurs the costs of
generating those revenues. In the case that the revenues can be offset against the costs incurred in the same
currency, the balance may be affected if the value of the currency in which the revenues and costs are generated
varies relative to the Euro. This risk exposure primarily affects those operations of the Group that generate a
portion of their revenue in foreign currencies and incur their costs primarily in Euros.
Cash infl ows and outfl ows of the operating segments are offset if they are denominated in the same currency.
This means that revenue generated in a particular currency balance out costs in the same currency, even if the
revenues arise from a different transaction than that in which the costs are incurred. As a result, only the
unmatched amounts are subject to currency risk.
To mitigate the impact of currency exchange rate fl uctuations, the Group continually assesses the exposure to
currency risks and if deemed necessary a portion of those risks is hedged by using derivative fi nancial

150
instruments. The principal derivative fi nancial instruments used to cover foreign currency exposure are forward
foreign currency exchange contracts. Given the current investment program in vessels and the fact that the
majority of the investments are denominated in US dollar, the Group is currently not using derivative fi nancial
instruments as positive cash fl ow in US dollar from operations is offset to a large extent by these investments.
Interest on borrowings is denominated in the currency of the borrowing. Generally, borrowings are
denominated in currencies that match the cash fl ows generated by the underlying operations of the Group,
primarily Euro and US dollar. This provides an economic hedge without derivatives being entered into and
therefore hedge accounting is not applied in these circumstances.
The Group’s investment in its subsidiaries in the United States of America is partly hedged by means of the
US dollar Private Placement loans and USD bank loans, which mitigates the currency risk arising from the
subsidiary’s net assets. The Group’s investment in other subsidiaries are not hedged.
The hedge on the investment is fully effective. Consequently all exchange differences relating to this hedge have
been accounted for in other comprehensive income.
Interest rate risk
The Group’s liabilities bear both fi xed and variable interests. The Group’s objective is to limit the effect of
interest rate changes on the results by matching long term investment with long term (fi xed interest) fi nancing
as much as possible. The Group continuously considers interest rate swaps to limit signifi cant (short term)
interest exposures.
5.50.5 Capital Management
The Board of Management’s policy is to maintain a strong capital base in order to maintain investor, creditor and
market confi dence and to sustain future development of the business. Capital consists of share capital, retained
earnings and non-controlling interests of the Group. The Board of Management monitors the geographic spread
of shareholders, the return on capital as well as the level of dividends to ordinary share holders. The Board
strives:
– for a dividend pay-out ratio of 35 to 55% of the net result.
– to maintain a healthy fi nancial position with a targeted solvency of 30 – 35%.
– to maintain a balance between the higher returns that might be possible with higher levels of borrowings and
the advantages and security afforded by a sound capital position.
The Group’s objective is to achieve a healthy return on shareholders’ equity. The return in 2010 was 20.2% (2009:
24.9%). In comparison the weighted average interest expense on interest-bearing borrowings was 4.0% (2009:
3.7%).
From time to time Fugro purchases its own certifi cates of shares. These certifi cates are used to cover the options
granted by Fugro. Purchase and sale decisions are made on a specifi c transaction basis by the Board of
Management. Fugro does not have a defi ned share buy-back plan.
There were no changes to the Group’s approach to capital management during the year.
The Group is subject to the externally imposed capital requirements related to covenant requirements as set out
in note 5.46.3. As per 31 December 2010 and 31 December 2009 the Group complied with all imposed external
capital requirements.

151Fugro Annual accounts 2010
5.51 C r e d i t r i s k
Exposure to credit risk
(EUR x 1,000) Carrying amount
2010 2009
Other investments in equity instruments 1,095 1,095
Available-for-sale fi nancial assets 2,812 2,653
Long-term loans 31,623 13,177
Financial assets at fair value through profi t or loss 25,636 5,129
Other long-term receivables 1,367 1,487
Unbilled revenue on completed projects 221,355 154,426
Trade receivables 444,097 328,403
Non-trade receivables 135,106 86,924
Cash and cash equivalents 81,363 107,795
944,454 701,089
The maximum exposure to credit risk at the reporting date is the carrying amount of each class of fi nancial
assets mentioned above. The Group holds collateral as security on the long-term loans.
The maximum exposure for trade receivables and unbilled revenue on completed contracts at the reporting date
by geographic region was:
(EUR x 1,000) Carrying amount
2010 2009
Netherlands 43,047 44,512
Europe other 267,517 211,655
Africa 21,905 16,408
Middle East 74,414 55,763
Asia 69,641 45,634
Australia 68,424 33,956
Americas 120,504 74,901
665,452 482,829

152
The maximum exposure to credit risk for trade receivables and unbilled revenue on completed contracts at the
reporting date by type of customer was:
(EUR x 1,000) Carrying amount
2010 2009
Oil and gas 503,941 340,392
Infrastructure 118,915 99,217
Mining 18,886 14,480
Other 23,710 28,740
665,452 482,829
Impairment losses
The ageing of trade receivables and unbilled revenue on completed contracts at the reporting date was:
– As of 31 December 2010, trade receivables and unbilled revenue on completed projects of EUR 665,452
thousand (2009: EUR 482,829 thousand) were fully performing.
– As of 31 December 2010, trade receivables of EUR 152,562 thousand (2009: EUR 110,954 thousand) were past
due but not impaired. These relate to a number of independent customers for whom there is no recent history
of default. The average credit term for these trade receivables is 30 days.
– As of 31 December 2010, trade receivables and unbilled revenue on completed projects of EUR 47,314 thousand
(2009: EUR 46,921 thousand) were impaired and provided for.
The individually impaired receivables mainly relate to customers, which are in unexpectedly diffi cult economic
situations. It was assessed that a portion of the receivables is expected to be recovered. The ageing of trade
receivables and unbilled revenue on completed projects is as follows:
(EUR x 1,000) 2010 2009
Gross
Impair-
ment Gross
Impair-
ment
From 0 to 30 days 512,890 – 376,875 5,000
From 31 to 60 days 80,620 – 62,566 1,546
From 61 to 90 days 34,303 9,490 25,862 6,543
Over 90 days 76,294 35,198 56,609 31,376
Retentions and special items 8,659 2,626 7,838 2,456
712,766 47,314 529,750 46,921

153Fugro Annual accounts 2010
The movement in the allowance for impairment in respect of trade receivables and unbilled revenue on
completed contracts during the year was as follows:
(EUR x 1,000) 2010 2009
Balance at 1 January 46,921 56,709
Impairment loss recognised 5,513 2,344
Impairment loss reversed (3,657) (11,072)
Trade receivables written off (2,525) (1,353)
Effect of movement in exchange rates 1,062 293
Balance at 31 December 47,314 46,921
The allowance accounts in respect of trade receivables and unbilled revenue on completed contracts are used to
record impairment losses unless the Group is satisfi ed that no recovery of the amount owing is possible; at that
point the amount considered irrecoverable is written off directly against the allowance.
No impairments related to other fi nancial assets than trade receivables and unbilled revenue on completed
contracts is recognised. In general, the Group considers credit risk on other receivables and cash and cash
equivalents to be limited. Cash and cash equivalents are held with large well known banks with adequate credit
ratings only. Refer to 5.50.2.
At the end of 2008 an allowance for impairment in respect of trade receivables and unbilled revenue on
completed contracts of EUR 20 million was recognised, as a consequence of the fi nancial crisis. In 2009 and 2010
approximately EUR 4 million of this allowance was used. At the end of 2010 an evaluation of remaining potential
risks was done. A total amount of EUR 15 million for specifi cally identifi ed issues has been maintained.

154
5.52 L i q u i d i t y r i s k
The following are the contractual maturities of fi nancial liabilities, excluding interest payments:
(EUR x 1,000) 2010
Carrying
amount
Contrac-
tual cash
fl ows
6 months
or less
6 – 12
months
1 – 2
years
2 – 5
years
More than
5 years
Bank loans 491,820 500,000 10,000 10,000 470,000 10,000 –
Private Placement loans:
44 million USD bonds 32,878 33,000 – – 33,000 – –
39 million USD bonds 29,128 29,250 – – – 29,250 –
37 million USD bonds 27,628 27,750 – – – – 27,750
20 million Eurobonds 20,000 20,000 – – 20,000 – –
Mortgage and other loans and
long-term borrowings 13,066 13,066 – 3,658 9,408 – –
Trade and other payables 474,208 474,208 474,208 – – – –
Bank overdraft 300,301 300,301 300,301 – – – –
1,389,029 1,397,575 784,509 13,658 532,408 39,250 27,750
It is not expected that the cash fl ows included in the maturity analysis could occur signifi cantly earlier, or at
signifi cantly different amounts.
(EUR x 1,000) 2009
Carrying
amount
Contrac-
tual cash
fl ows
6 months
or less
6 – 12
months
1 – 2
years
2 – 5
years
More than
5 years
Bank loans 343,889 345,000 10,000 10,000 40,000 285,000 –
Private Placement loans:
44 million USD bonds 30,219 30,360 – – – 30,360 –
39 million USD bonds 26,769 26,910 – – – 26,910 –
37 million USD bonds 25,388 25,530 – – – – 25,530
20 million Eurobonds 20,000 20,000 – – – 20,000 –
Mortgage and other loans and long-term
borrowings 20,900 20,900 2,484 3,342 7,646 7,428 –
Trade and other payables 350,043 350,043 350,043 – – – –
Bank overdraft 167,556 167,556 167,556 – – – –
984,764 986,299 530,083 13,342 47,646 369,698 25,530

155Fugro Annual accounts 2010
5.53 C u r r e n c y r i s k
The following signifi cant exchange rates applied during the year:
(In EUR)Average
rate
Reporting
date mid-
spot rate
USD 0.76 0.75
GBP 1.17 1.16
NOK 0.125 0.128
Sensitivity analysis
A 10 percent strengthening of the Euro against the above currencies at 31 December would have increased
(decreased) equity and profi t or loss by the amounts shown below. This analysis is based on foreign currency
exchange rate variances that the Group considered to be reasonably possible at the reporting date. This analysis
assumes that all other variables, in particular interest rates, remain constant and ignores any impact of
forecasted sales and purchases. The analysis is performed on the same basis as for 2009.
Effect in Euro thousands Equity
Profi t
or (loss)
31 December 2010
USD (42,368) (5,066)
GBP (16,399) (1,467)
NOK (14,799) (5,385)
31 December 2009
USD (6,030) (9,850)
GBP (12,877) (3,161)
NOK (14,877) (1,244)
CHF (34,073) (4,520)
A 10 percent weakening of the Euro against the above currencies at 31 December would have had the equal but
opposite effect on the amounts shown above, on the basis that all other variables remain constant.
As a result of a change in functional currency of two Swiss subsidiaries from CHF to Euro as per 1 January 2010,
the Group no longer experiences (signifi cant) currency risk with regards to the CHF.

156
5.54 I n t e r e s t r a t e r i s k
Profile
At the reporting date the interest rate profi le of the Group’s interest-bearing fi nancial instruments was:
(EUR x 1,000) Carrying amount
2010 2009
Fixed rate instruments
Financial assets 31,623 13,177
Financial liabilities (122,700) (123,276)
Variable rate instruments
Financial liabilities (710,758) (403,650)
(801,835) (513,749)
Fair value sensitivity analysis for fixed rate instruments
The Group does not account for any fi xed rate fi nancial assets and liabilities at fair value through profi t or loss,
and the Group does not designate derivatives (interest rate swaps) as hedging instruments under a fair value
hedge accounting model. Therefore a change in interest rates at the reporting date would not affect profi t or loss.
Cash flow sensitivity analysis for variable rate instruments
A change of 100 basis points in interest rates at the reporting date would have increased (decreased) equity and
profi t or loss by the amounts shown below. This analysis assumes that all other variables, in particular foreign
currency rates, remain constant. This analysis is performed on the same basis for 2009.
(EUR x 1,000) Profi t or loss Equity
100 bp in-
crease
100 bp
decrease
100 bp in-
crease
100 bp
decrease
31 December 2010
Variable rate instruments (7,108) 7,108 – –
Cash fl ow sensitivity (net) (7,108) 7,108 – –
31 December 2009
Variable rate instruments (4,037) 4,037 – –
Cash fl ow sensitivity (net) (4,037) 4,037 – –
At 31 December 2010 it is estimated that a general increase of 100 basis points in interest rates would decrease
the Group’s profi t before income tax by approximately EUR 7.1 million (2009: negative impact of EUR 4.0 million).

157Fugro Annual accounts 2010
5.55 Fa i r va l u e s
The fair values of fi nancial assets and liabilities, together with the carrying amounts shown in the statement of
fi nancial position, are as follows:
(EUR x 1,000) 2010 2009
Carrying
amount Fair value
Carrying
amount Fair value
Financial assets at fair value through profit or loss
Financial assets at fair value through profi t or loss 25,636 25,636 5,129 5,129
Loans and receivables
Trade receivables, unbilled revenue on completed projects 803,241 803,241 572,010 572,010
Cash and cash equivalents 81,363 81,363 107,795 107,795
Long-term loans 31,623 31,623 13,177 13,177
Other long-term receivables 1,367 1,367 1,487 1,487
Available-for-sale financial assets
Other investments in equity instruments* 1,095 1,095 1,095 1,095
Available-for-sale fi nancial assets 2,812 2,812 2,653 2,653
Financial liabilities measured at amortised cost
Bank loans (491,820) (491,820) (343,889) (343,889)
Mortgage and other loans and long-term borrowings (13,066) (13,066) (20,900) (20,900)
Private Placement loans in USD (89,634) (89,514) (82,376) (83,212)
Private Placement loans in EUR (20,000) (19,874) (20,000) (19,817)
Bank overdraft (300,301) (300,301) (167,556) (167,556)
Trade and other payables (474,208) (474,208) (350,043) (350,043)
Total (441,892) (441,646) (281,418) (282,071)
Unrecognised gains/(losses) 246 (653)
* The other investments in equity instruments do not have a quoted market price in an active market. The fair value cannot be reliably
measured by the Group.
Interest rates used for determining fair value
The Group uses the government yield curve as per the reporting date plus an adequate constant credit spread to
discount fi nancial instruments. The interest rates used are as follows:
Derivatives 2010 2009
Loans and borrowings 2.0 – 7.1% 2.0 – 7.1%
Leases n/a n/a
Receivables n/a n/a

158
Fair value hierarchy
The table below analyses fi nancial instruments carried at fair value, by valuation method. The different levels
have been defi ned as follows:
– Level 1: quoted prices (unadjusted) in active markets for identical assets or liabilities.
– Level 2: inputs other than quoted prices included within Level 1 that are observable for the asset or liability,
either directly (i.e. as prices) or indirectly (i.e. derived from prices).
– Level 3: inputs for the asset or liability that are not based on observable market data (unobservable inputs).
31 December 2010
Level 1
EUR
1,000
Level 2
EUR
1,000
Level 3
EUR
1,000
Total
EUR
1,000
Available-for-sale fi nancial assets 2,812 – – 2,812
Financial assets at fair value through profi t or loss – 25,636 – 25,636
Total 2,812 25,636 – 28,448
31 December 2009
Level 1
EUR
1,000
Level 2
EUR
1,000
Level 3
EUR
1,000
Total
EUR
1,000
Available-for-sale fi nancial assets 2,653 – – 2,653
Financial assets at fair value through profi t or loss – 5,129 – 5,129
Total 2,653 5,129 – 7,782
There have been no transfers from Level 2 to Level 1 in 2010 (2009: no transfers in either direction).
5.56 C o m m i t m e n t s n o t i n c l u d e d i n t h e s t a t e m e n t o f f i n a n c i a l p o s i t i o n
5.56.1 Operating leases as lessee
Non-cancellable operating lease rentals are payable as follows:
(EUR x 1,000) 2010 2009
Less than one year 126,248 128,959
Between one and fi ve years 233,097 256,356
More than fi ve years 49,135 77,463
408,480 462,778
The Group leases a number of offi ces and warehouse/laboratory facilities and vessels under operating leases.
The leases typically run for an initial period of between three and ten years, with in most cases an option to
renew the lease after that date. Lease payments are adjusted annually to refl ect market rentals. None of the leases
include contingent rentals.
During the year an amount of EUR 195 million was recognised as an expense in profi t or loss in respect of
operating leases (2009: EUR 156 million).
The Group does, in principle, not act as a lessor.

159Fugro Annual accounts 2010
5.56.2 Capital commitments
At 31 December 2010 the Group has contractual obligations to purchase property, plant and equipment for
EUR 235.9 million (2009: EUR 289.1 million).
5.56.3 Contingencies
Some Group companies are, as a result of their normal business activities, involved either as plaintiffs or
defendants in claims. Based on information presently available and management’s best estimate the fi nancial
position of the Group is not likely to be signifi cantly infl uenced by any of these matters. Should the actual
outcome differ from the assumptions and estimates, the fi nancial position of the Group would be impacted.
Fugro N.V. and its Dutch operating companies form a fi scal unit for corporate tax. Each of the operating
companies is severally liable for corporate tax to be paid by the fi scal unit.
5.57 S u b s e q u e n t e ve n t s
Early March 2011, Fugro has acquired 100% of the shares in TSmarine Group Holdings Pty Ltd (TSM) and its
subsidiaries. TSM, with its headquarters in Perth Australia and subsidiaries in Singapore, Labuan (Malaysia) and
Aberdeen (UK), is a specialist provider of subsea construction, IRM (inspection, repair and maintenance) and light
well intervention. The company operates ROV (Remotely Operated Vehicle) and diving services and has four high
specifi cation chartered vessels in its fl eet.
The combination of Fugro’s existing strength and its global network with TSM’s business will lead to substantial
synergies and will enable Fugro to strengthen its subsea services business in support of the offshore oil and gas
industry, with a particular focus on Asia-Pacifi c and Europe-Africa.
TSM will be renamed Fugro-TSM and will be part of Fugro’s Subsea Services Business Line. TSM management will
continue to work in Fugro.
TSM’s revenue amounts at present to over EUR 90 million per annum. The company has 70 permanent offi ce-
based professional staff and has up to 100 contract staff at any one time. The purchase price amounts to EUR 77
million. Quantitative information on the fair value of assets and liabilities acquired are not yet available and are
therefore not disclosed at this stage.
5.58 R e l a t e d p a r t i e s
5.58.1 Identity of related parties
The Group has a related party relationship with its subsidiaries, its equity-accounted investees and other
investments, its Directors, Executive Committee, and its Supervisory Board.

160
5.58.2 Transactions with Directors (Board of Management)
Directors of Fugro hold 0.5% of the outstanding voting shares and certifi cates of shares in Fugro. Directors also
participate in Fugro’s share option scheme (refer note 5.30.1).
The remuneration of the Board of Management for 2010 and 2009 is as follows:
(in EUR) K.S. Wester A. Jonkman P. van Riel A. Steenbakker J. Rüegg*
2010 2009 2010 2009 2010 2009 2010 2009 2010 2009
Fixed salary 563,680 563,680 312,000 312,000 312,000 312,000 312,000 312,000 312,000 91,000
Bonus with respect to the
previous year 469,733 516,707 260,000 286,000 260,000 286,000 260,000 286,000 203,792 --
Pension costs (including
disability insurance) 350,000 367,420 265,303 265,342 265,303 265,342 265,303 265,342 18,001 8,371
1,383,413 1,447,807 837,303 863,342 837,303 863,342 837,303 863,342 533,793 99,371
Value of options granted 1,491,132 1,092,600 993,462 728,400 993,462 728,400 993,462 728,400 993,462 637,350
Total 2,874,545 2,540,407 1,830,765 1,591,742 1,830,765 1,591,742 1,830,765 1,591,742 1,527,255 736,721
* J. Rüegg was appointed to the Board of Management as per 16 September 2009. The remuneration is disclosed as of this date.
The fringe benefi ts for the Board of Management are commensurate with the position held.
There are no guarantees or obligations towards or on behalf of the Board of Management.
The determination of the annual bonus is based upon the remuneration policy as adopted by the Annual
General Meeting of Shareholders on 14 May 2008. This remuneration policy is available on Fugro’s website:
www.fugro.com.
The Supervisory Board determines the remuneration of the individual members of the Board of Management, on
a proposal by the Remuneration and Nomination Committee, within the scope of the remuneration policy.
161Fugro Annual accounts 2010
Annual bonus
Each member of the Board of Management will be eligible for an annual bonus, with a maximum of twelve
months (100%) of annual fi xed salary. On-target performance will result in a bonus of eight months of annual
fi xed salary. The bonus is related to quantifi ed fi nancial targets and accounts for 2/3 of the annual bonus and the
other part of the bonus is related to non-fi nancial / personal targets and will account for 1/3 of the annual bonus.
At the beginning of each year the Supervisory Board sets the fi nancial and the non-fi nancial targets for the
relevant year. The Supervisory Board ensures that targets are challenging, realistic and consistent with Fugro’s
strategy. The performance measures and the weighing given to the individual measures are set by the
Supervisory Board. Achievement of the targets will be measured shortly after the end of the relevant year.
The weighting given to the individual fi nancial elements is as follows: earnings per share (EPS) 60%, net profi t
margin 20% and return on capital employed (ROCE) 20%. These fi nancial elements are based upon Fugro’s annual
budget. The maximum bonus related to the fi nancial targets will be granted if the targets are exceeded by 30%,
and if the performance is only 70% of target, the bonus will be 50% of on-target performance. If performance is
less than 70% of target, the part of the bonus that is related to fi nancial targets will be zero.
The non-fi nancial targets are derived from Fugro’s strategic agenda. These are qualitative individual targets and/
or collective targets that are the responsibility of one or more directors and can be infl uenced by them. These
targets could include, among other things, health safety and environment (HSE), corporate social responsibility
(CSR), personal development, etc.
Based on the results for the non-fi nancial and fi nancial targets, the Supervisory Board has established the extent
to which the targets for 2010 were achieved. Both the fi nancial targets relating to the Group’s fi nancial
performance as the non-fi nancial targets were met and even exceeded. As a result the Supervisory Board has
decided to award to each of the members of the Board of Management an annual bonus of 10 months of the
annual fi xed salary over the year 2010.
The actual targets are not disclosed because they qualify as competition-sensitive and hence commercially
confi dential and potentially price sensitive information.

162
The following table gives details of the options granted to members of the Board of Management:
Board of Management Number of options In EUR Number of months
Year
Number at
01-01-10
Granted in
2010
Exercised
in 2010
Forfeited
in 2010
Number at
31-12-10
Exercise
price
Share
price at
exercise
day
Expiring
date Bonus1)
K.S. Wester 2004 108,000 108,000 – 15.35 49.22 31-12-2010 6
2005 113,000 113,000 27.13 31-12-2011 7
2006 125,000 125,000 36.20 31-12-2012 8
2007 125,000 125,000 52.80 31-12-2013 8
2008 107,500 107,500 20.485 31-12-2014 11
2009 90,000 90,000 40,26 31-12-2015 10
2010 79,400 79,400 61.50 31-12-2016 10
Total 668,500 79,400 108,000 – 639,900
A. Jonkman 2004 80,000 80,000 – 15.35 48.73 31-12-2010 6
2005 85,000 85,000 27.13 31-12-2011 7
2006 85,000 85,000 36.20 31-12-2012 8
2007 85,000 85,000 52.80 31-12-2013 8
2008 72,500 72,500 20.485 31-12-2014 11
2009 60,000 60,000 40.26 31-12-2015 10
2010 52,900 52,900 61.50 31-12-2016 10
Total 467,500 52,900 80,000 – 440,400
P. van Riel 2004-2005 82,400 32,000 50,400 27.13 52.56 31-12-2011 –
2006 75,000 75,000 36.20 31-12-2012 8
2007 75,000 75,000 52.80 31-12-2013 8
2008 67,500 67,500 20.485 31-12-2014 11
2009 60,000 60,000 40.26 31-12-2015 10
2010 52,900 52,900 61.50 31-12-2016 10
Total 359,900 52,900 32,000 – 380,800
A. Steenbakker 2005 50,400 17,000 33,400 27.13 49.00 31-12-2011 –
2006 75,000 75,000 36.20 31-12-2012 8
2007 75,000 75,000 52.80 31-12-2013 8
2008 67,500 67,500 20.485 31-12-2014 11
2009 60,000 60,000 40.26 31-12-2015 10
2010 52,900 52,900 61.50 31-12-2016 10
Total 327,900 52,900 17,000 – 363,800
J. Rüegg 2005-2008 150,200 150,200 34.94 2) 31-12-2014 –
2009 52,500 52,500 40.26 31-12-2015 10
2010 52,900 52,900 61.50 31-12-2016 10
Total 202,700 52,900 – – 255,600
Total 2,026,500 291,000 237,000 – 2,080,500
1) Bonus in the book year; paid in the next year.
2) Weighted average.

163Fugro Annual accounts 2010
5.58.3 Executive Committee
The Group considers the Executive Committee, including the Board of Management, as ‘key management’.
In addition to their salaries, the Group also provides non-cash benefi ts to the Executive Committee and
contributes to their post-retirement plan. The members of the Executive Committee also participate in Fugro’s
share option scheme. The Executive Committee’s compensation comprises:
2010 2009
Fixed salary 2,886,950 2,773,917
Bonus with respect to the previous year 2,349,584 2,300,412
Pension costs (including disability insurance) 1,650,473 1,538,463
Value of options granted 8,265,675 5,913,650
15,152,682 12,526,442
5.58.4 Supervisory Board
The remuneration of the Supervisory Board is as follows:
2010 2009
F.H. Schreve, Chairman 66,000 68,000
F.J.G.M. Cremers, Vice-Chairman 48,000 48,000
J.A. Colligan 46,000 46,000
P.J. Crawford – 16,138
M. Helmes 46,000 29,862
G-J. Kramer 48,000 46,000
H.C. Scheffer* 29,932 –
Th. Smith 61,000 61,000
344,932 315,000
* Mr. Scheffer was appointed to the Board of Supervisory Directors on 6 May 2010
There are no options granted and no company assets available to the members of the Supervisory Board.
There are no loans outstanding to the members of the Supervisory Board and no guarantees given on behalf of
members of the Supervisory Board.

164
Below is a summary of the number of options to acquire ordinary shares in Fugro that are held by Mr. G-J. Kramer.
These share options were granted to Mr. Kramer when he was a member (CEO) of the Board of Management of
Fugro.
Number of options In EUR
Year
Number at
01-01-10
Exercised
in 2010
Forfeited
in 2010
Number at
31-12-10
Exercise
price
Share
price at
exercise
day
Expiring
date
G-J. Kramer 2004 129,600 129,600 – 15.35 48.71 31-12-2010
2005 129,600 129,600 27.13 31-12-2011
Total 259,200 129,600 – 129,600
Per 31 December 2010 Mr. Kramer held (privately and via Woestduin Holding N.V.) 4,350.075 (certifi cates of)
ordinary shares in Fugro.
5.58.5 Other related party transactions
5.58.5.1 Joint ventures
The Group has not entered into any joint ventures.
5.59 S u b s i d i a r i e s
5.59.1 Significant subsidiaries
For an overview of (signifi cant) subsidiaries we refer to chapter 6.
5.60 E s t i m a t e s a n d m a n a ge m e n t j u d ge m e n t s
Management discussed with the Audit Committee the development in and choice of critical accounting
principles and estimates and the application of such principles and estimates.
Key sources of estimation uncertainty
The preparation of fi nancial statements in conformity with EU-IFRS requires management to make judgements,
estimates and assumptions that affect the application of accounting policies and the reported amounts of assets,
liabilities, income and expenses. Actual results may differ from these estimates. Estimates and underlying
assumptions are reviewed on an ongoing basis. Revisions to accounting estimates are recognised in the period in
which the estimates are revised if the revision affects only that period, or in the period of the revision and future
periods if the revision affects both current and future periods. Information about critical judgements in
applying accounting policies that have the most signifi cant effect on the amounts recognised in the consolidated
fi nancial statements is included in the following notes:
– Deferred tax; The assumptions used in recognition and measurement of deferred taxes are disclosed in note
5.40.
– Impairments; Impairment analyses of goodwill are performed annually and whenever a triggering event has
occurred to determine whether the carrying value exceeds the recoverable amount. These analyses are based
on estimates of future cash fl ows. The accounting policies regarding impairments are included in note 5.15.
Note 5.37 contains information about the key assumptions used to determine the recoverable amount of the
various cash generating units. Note 5.41 contains information about the impairment of seismic and
geological data. The expected negative effect of the current worldwide economic crisis on credit risk is
disclosed in notes 5.50.2 and 5.51. These notes contain information about the assumptions used relating to
impairment of trade receivables, unbilled revenue on completed projects and other receivables.

165Fugro Annual accounts 2010
– Assets and liabilities from employee benefi ts; Actuarial assumptions are established to anticipate future
events and are used in calculating pension and other post retirement benefi t expenses and liabilities. These
factors include assumptions with respect to interest rates, expected investment returns on plan assets, rates of
future compensation increases, turnover rates and life expectancy. Note 5.47 contains information about the
(actuarial) assumptions related to employee benefi ts. Actuarial gains and losses related to defi ned benefi t
plans are accounted for in other comprehensive income.
– Other provisions, tax and other contingencies; Information on the assumptions used in estimating the effect
of legal proceedings is included in note 5.48.
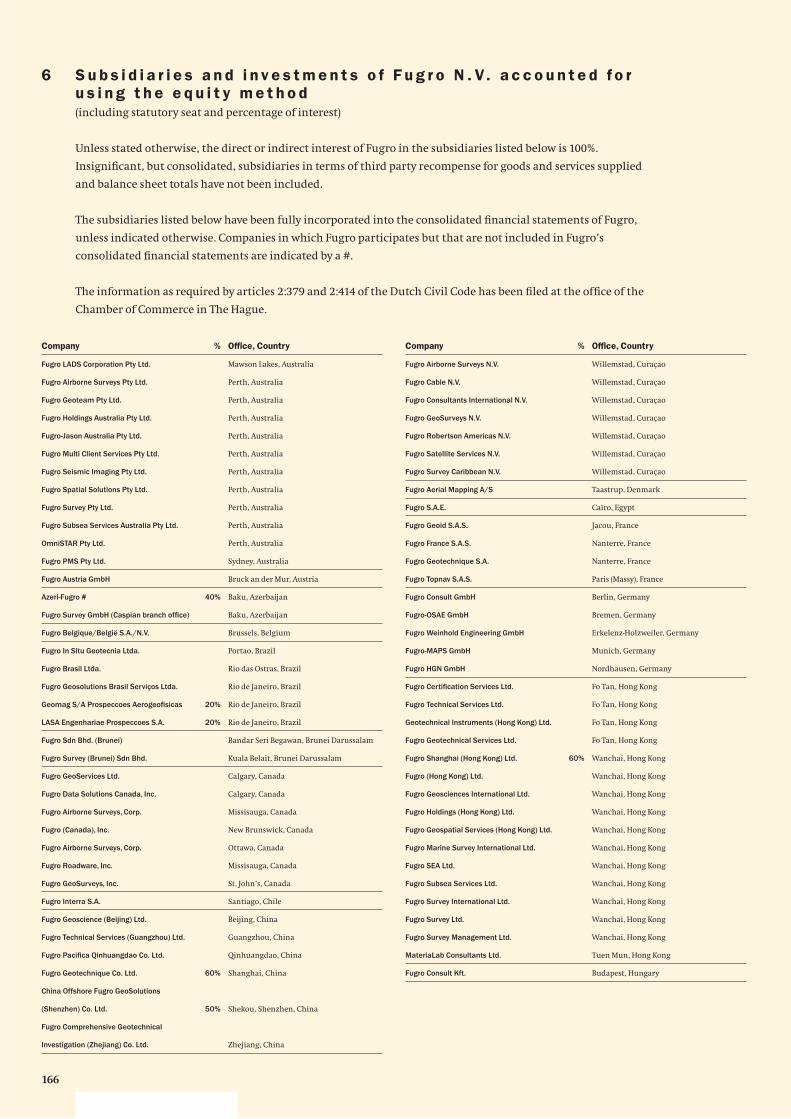
166
6 S u b s i d i a r i e s a n d i n v e s t m e n t s o f F u g r o N . V. a c c o u n t e d f o r u s i n g t h e e q u i t y m e t h o d(including statutory seat and percentage of interest)
Unless stated otherwise, the direct or indirect interest of Fugro in the subsidiaries listed below is 100%.
Insignifi cant, but consolidated, subsidiaries in terms of third party recompense for goods and services supplied
and balance sheet totals have not been included.
The subsidiaries listed below have been fully incorporated into the consolidated fi nancial statements of Fugro,
unless indicated otherwise. Companies in which Fugro participates but that are not included in Fugro’s
consolidated fi nancial statements are indicated by a #.
The information as required by articles 2:379 and 2:414 of the Dutch Civil Code has been fi led at the offi ce of the
Chamber of Commerce in The Hague.
Company % Offi ce, Country
Fugro LADS Corporation Pty Ltd. Mawson Lakes, Australia
Fugro Airborne Surveys Pty Ltd. Perth, Australia
Fugro Geoteam Pty Ltd. Perth, Australia
Fugro Holdings Australia Pty Ltd. Perth, Australia
Fugro-Jason Australia Pty Ltd. Perth, Australia
Fugro Multi Client Services Pty Ltd. Perth, Australia
Fugro Seismic Imaging Pty Ltd. Perth, Australia
Fugro Spatial Solutions Pty Ltd. Perth, Australia
Fugro Survey Pty Ltd. Perth, Australia
Fugro Subsea Services Australia Pty Ltd. Perth, Australia
OmniSTAR Pty Ltd. Perth, Australia
Fugro PMS Pty Ltd. Sydney, Australia
Fugro Austria GmbH Bruck an der Mur, Austria
Azeri-Fugro # 40% Baku, Azerbaijan
Fugro Survey GmbH (Caspian branch offi ce) Baku, Azerbaijan
Fugro Belgique/België S.A./N.V. Brussels, Belgium
Fugro In Situ Geotecnia Ltda. Portao, Brazil
Fugro Brasil Ltda. Rio das Ostras, Brazil
Fugro Geosolutions Brasil Serviços Ltda. Rio de Janeiro, Brazil
Geomag S/A Prospeccoes Aerogeofi sicas 20% Rio de Janeiro, Brazil
LASA Engenhariae Prospeccoes S.A. 20% Rio de Janeiro, Brazil
Fugro Sdn Bhd. (Brunei) Bandar Seri Begawan, Brunei Darussalam
Fugro Survey (Brunei) Sdn Bhd. Kuala Belait, Brunei Darussalam
Fugro GeoServices Ltd. Calgary, Canada
Fugro Data Solutions Canada, Inc. Calgary, Canada
Fugro Airborne Surveys, Corp. Missisauga, Canada
Fugro (Canada), Inc. New Brunswick, Canada
Fugro Airborne Surveys, Corp. Ottawa, Canada
Fugro Roadware, Inc. Missisauga, Canada
Fugro GeoSurveys, Inc. St. John’s, Canada
Fugro Interra S.A. Santiago, Chile
Fugro Geoscience (Beijing) Ltd. Beijing, China
Fugro Technical Services (Guangzhou) Ltd. Guangzhou, China
Fugro Pacifi ca Qinhuangdao Co. Ltd. Qinhuangdao, China
Fugro Geotechnique Co. Ltd. 60% Shanghai, China
China Offshore Fugro GeoSolutions
(Shenzhen) Co. Ltd. 50% Shekou, Shenzhen, China
Fugro Comprehensive Geotechnical
Investigation (Zhejiang) Co. Ltd. Zhejiang, China
Company % Offi ce, Country
Fugro Airborne Surveys N.V. Willemstad, Curaçao
Fugro Cable N.V. Willemstad, Curaçao
Fugro Consultants International N.V. Willemstad, Curaçao
Fugro GeoSurveys N.V. Willemstad, Curaçao
Fugro Robertson Americas N.V. Willemstad, Curaçao
Fugro Satellite Services N.V. Willemstad, Curaçao
Fugro Survey Caribbean N.V. Willemstad, Curaçao
Fugro Aerial Mapping A/S Taastrup, Denmark
Fugro S.A.E. Caïro, Egypt
Fugro Geoid S.A.S. Jacou, France
Fugro France S.A.S. Nanterre, France
Fugro Geotechnique S.A. Nanterre, France
Fugro Topnav S.A.S. Paris (Massy), France
Fugro Consult GmbH Berlin, Germany
Fugro-OSAE GmbH Bremen, Germany
Fugro Weinhold Engineering GmbH Erkelenz-Holzweiler, Germany
Fugro-MAPS GmbH Munich, Germany
Fugro HGN GmbH Nordhausen, Germany
Fugro Certifi cation Services Ltd. Fo Tan, Hong Kong
Fugro Technical Services Ltd. Fo Tan, Hong Kong
Geotechnical Instruments (Hong Kong) Ltd. Fo Tan, Hong Kong
Fugro Geotechnical Services Ltd. Fo Tan, Hong Kong
Fugro Shanghai (Hong Kong) Ltd. 60% Wanchai, Hong Kong
Fugro (Hong Kong) Ltd. Wanchai, Hong Kong
Fugro Geosciences International Ltd. Wanchai, Hong Kong
Fugro Holdings (Hong Kong) Ltd. Wanchai, Hong Kong
Fugro Geospatial Services (Hong Kong) Ltd. Wanchai, Hong Kong
Fugro Marine Survey International Ltd. Wanchai, Hong Kong
Fugro SEA Ltd. Wanchai, Hong Kong
Fugro Subsea Services Ltd. Wanchai, Hong Kong
Fugro Survey International Ltd. Wanchai, Hong Kong
Fugro Survey Ltd. Wanchai, Hong Kong
Fugro Survey Management Ltd. Wanchai, Hong Kong
MateriaLab Consultants Ltd. Tuen Mun, Hong Kong
Fugro Consult Kft. Budapest, Hungary
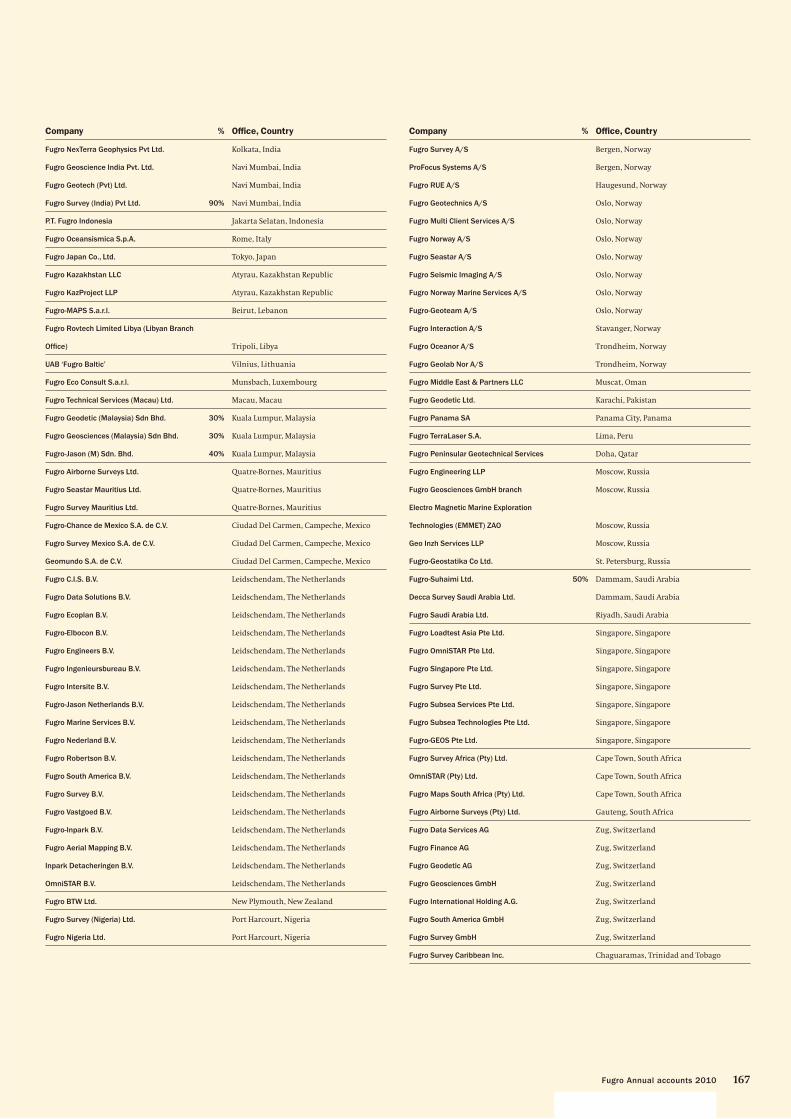
167Fugro Annual accounts 2010
Company % Offi ce, Country
Fugro NexTerra Geophysics Pvt Ltd. Kolkata, India
Fugro Geoscience India Pvt. Ltd. Navi Mumbai, India
Fugro Geotech (Pvt) Ltd. Navi Mumbai, India
Fugro Survey (India) Pvt Ltd. 90% Navi Mumbai, India
P.T. Fugro Indonesia Jakarta Selatan, Indonesia
Fugro Oceansismica S.p.A. Rome, Italy
Fugro Japan Co., Ltd. Tokyo, Japan
Fugro Kazakhstan LLC Atyrau, Kazakhstan Republic
Fugro KazProject LLP Atyrau, Kazakhstan Republic
Fugro-MAPS S.a.r.l. Beirut, Lebanon
Fugro Rovtech Limited Libya (Libyan Branch
Offi ce) Tripoli, Libya
UAB ‘Fugro Baltic’ Vilnius, Lithuania
Fugro Eco Consult S.a.r.l. Munsbach, Luxembourg
Fugro Technical Services (Macau) Ltd. Macau, Macau
Fugro Geodetic (Malaysia) Sdn Bhd. 30% Kuala Lumpur, Malaysia
Fugro Geosciences (Malaysia) Sdn Bhd. 30% Kuala Lumpur, Malaysia
Fugro-Jason (M) Sdn. Bhd. 40% Kuala Lumpur, Malaysia
Fugro Airborne Surveys Ltd. Quatre-Bornes, Mauritius
Fugro Seastar Mauritius Ltd. Quatre-Bornes, Mauritius
Fugro Survey Mauritius Ltd. Quatre-Bornes, Mauritius
Fugro-Chance de Mexico S.A. de C.V. Ciudad Del Carmen, Campeche, Mexico
Fugro Survey Mexico S.A. de C.V. Ciudad Del Carmen, Campeche, Mexico
Geomundo S.A. de C.V. Ciudad Del Carmen, Campeche, Mexico
Fugro C.I.S. B.V. Leidschendam, The Netherlands
Fugro Data Solutions B.V. Leidschendam, The Netherlands
Fugro Ecoplan B.V. Leidschendam, The Netherlands
Fugro-Elbocon B.V. Leidschendam, The Netherlands
Fugro Engineers B.V. Leidschendam, The Netherlands
Fugro Ingenieursbureau B.V. Leidschendam, The Netherlands
Fugro Intersite B.V. Leidschendam, The Netherlands
Fugro-Jason Netherlands B.V. Leidschendam, The Netherlands
Fugro Marine Services B.V. Leidschendam, The Netherlands
Fugro Nederland B.V. Leidschendam, The Netherlands
Fugro Robertson B.V. Leidschendam, The Netherlands
Fugro South America B.V. Leidschendam, The Netherlands
Fugro Survey B.V. Leidschendam, The Netherlands
Fugro Vastgoed B.V. Leidschendam, The Netherlands
Fugro-Inpark B.V. Leidschendam, The Netherlands
Fugro Aerial Mapping B.V. Leidschendam, The Netherlands
Inpark Detacheringen B.V. Leidschendam, The Netherlands
OmniSTAR B.V. Leidschendam, The Netherlands
Fugro BTW Ltd. New Plymouth, New Zealand
Fugro Survey (Nigeria) Ltd. Port Harcourt, Nigeria
Fugro Nigeria Ltd. Port Harcourt, Nigeria
Company % Offi ce, Country
Fugro Survey A/S Bergen, Norway
ProFocus Systems A/S Bergen, Norway
Fugro RUE A/S Haugesund, Norway
Fugro Geotechnics A/S Oslo, Norway
Fugro Multi Client Services A/S Oslo, Norway
Fugro Norway A/S Oslo, Norway
Fugro Seastar A/S Oslo, Norway
Fugro Seismic Imaging A/S Oslo, Norway
Fugro Norway Marine Services A/S Oslo, Norway
Fugro-Geoteam A/S Oslo, Norway
Fugro Interaction A/S Stavanger, Norway
Fugro Oceanor A/S Trondheim, Norway
Fugro Geolab Nor A/S Trondheim, Norway
Fugro Middle East & Partners LLC Muscat, Oman
Fugro Geodetic Ltd. Karachi, Pakistan
Fugro Panama SA Panama City, Panama
Fugro TerraLaser S.A. Lima, Peru
Fugro Peninsular Geotechnical Services Doha, Qatar
Fugro Engineering LLP Moscow, Russia
Fugro Geosciences GmbH branch Moscow, Russia
Electro Magnetic Marine Exploration
Technologies (EMMET) ZAO Moscow, Russia
Geo Inzh Services LLP Moscow, Russia
Fugro-Geostatika Co Ltd. St. Petersburg, Russia
Fugro-Suhaimi Ltd. 50% Dammam, Saudi Arabia
Decca Survey Saudi Arabia Ltd. Dammam, Saudi Arabia
Fugro Saudi Arabia Ltd. Riyadh, Saudi Arabia
Fugro Loadtest Asia Pte Ltd. Singapore, Singapore
Fugro OmniSTAR Pte Ltd. Singapore, Singapore
Fugro Singapore Pte Ltd. Singapore, Singapore
Fugro Survey Pte Ltd. Singapore, Singapore
Fugro Subsea Services Pte Ltd. Singapore, Singapore
Fugro Subsea Technologies Pte Ltd. Singapore, Singapore
Fugro-GEOS Pte Ltd. Singapore, Singapore
Fugro Survey Africa (Pty) Ltd. Cape Town, South Africa
OmniSTAR (Pty) Ltd. Cape Town, South Africa
Fugro Maps South Africa (Pty) Ltd. Cape Town, South Africa
Fugro Airborne Surveys (Pty) Ltd. Gauteng, South Africa
Fugro Data Services AG Zug, Switzerland
Fugro Finance AG Zug, Switzerland
Fugro Geodetic AG Zug, Switzerland
Fugro Geosciences GmbH Zug, Switzerland
Fugro International Holding A.G. Zug, Switzerland
Fugro South America GmbH Zug, Switzerland
Fugro Survey GmbH Zug, Switzerland
Fugro Survey Caribbean Inc. Chaguaramas, Trinidad and Tobago

168
Company % Offi ce, Country
Fugro Geoscience Middle East Abu Dhabi, United Arab Emirates
Fugro Survey (Middle East) Ltd. Abu Dhabi, United Arab Emirates
Fugro Middle East B.V. Dubai, United Arab Emirates
Fugro-MAPS (UAE) Sharjah, United Arab Emirates
Fugro-Rovtech Ltd. Aberdeen, United Kingdom
Fugro Survey Ltd. Aberdeen, United Kingdom
Fugro-ImpROV Ltd. Aberdeen, United Kingdom
Fugro Aperio Ltd. Cambridge, United Kingdom
Fugro BKS Ltd. Coleraine, United Kingdom
Fugro Data Solutions Ltd. Conwy, United Kingdom
Fugro NPA Ltd. Edenbridge, United Kingdom
Fugro Seacore Ltd. Falmouth, United Kingdom
Fugro Alluvial Offshore Ltd. Great Yarmouth, United Kingdom
Fugro-Robertson Ltd. Llandudno, United Kingdom
Fugro Loadtest Ltd. Middlesex, United Kingdom
Fugro General Robotics Ltd. Milton Keynes, United Kingdom
Fugro ERT (Scotland) Ltd. Edinburgh, United Kingdom
Fugro Seismic Imaging Ltd. Swanley, United Kingdom
Fugro Multi Client Services (UK) Ltd. Wallingford, United Kingdom
Fugro GeoConsulting Ltd. Wallingford, United Kingdom
Fugro Airborne Surveys Ltd. Wallingford, United Kingdom
Fugro Engineering Services Ltd. Wallingford, United Kingdom
Fugro-GEOS Ltd. Wallingford, United Kingdom
Fugro Holdings (UK) Ltd. Wallingford, United Kingdom
Fugro-Jason (UK) Ltd. Wallingford, United Kingdom
Fugro LADS, Inc. Biloxi, United States
Fugro EarthData, Inc. Frederick, United States
LoadTest, Inc. Gainesville, United States
Fugro (USA), Inc. Houston, United States
Fugro Data Solutions, Inc. Houston, United States
Fugro Geoteam, Inc. Houston, United States
Fugro GeoServices, Inc. Houston, United States
Fugro Multi Client Services, Inc. Houston, United States
Fugro GeoConsulting, Inc. Houston, United States
Fugro Consultants, Inc. Houston, United States
Fugro, Inc. Houston, United States
Fugro-GEOS, Inc. Houston, United States
Fugro-ImpROV, Inc. Houston, United States
Fugro-Jason, Inc. Houston, United States
Fugro-McClelland Marine Geosciences, Inc. Houston, United States
Fugro Gravity & Magnetic Services, Inc. Houston, United States
Fugro Seismic Imaging, Inc. Houston, United States
Fugro Drilling & Well Services, Inc. Houston, United States
OmniSTAR, Inc. Houston, United States
John Chance Land Surveys, Inc. Lafayette, United States
Fugro Chance, Inc. Lafayette, United States
Company % Offi ce, Country
Fugro Horizons, Inc. Rapid City, United States
Fugro Roadware, Inc. Richmond, United States
Fugro Pelagos, Inc. San Diego, United States
Fugro West, Inc. Ventura, United States
Fugro William Lettis & Associates, Inc. Walnut Creek, United States
Fugro Geotechnics Vietnam LLC Ho Chi Minh City, Vietnam
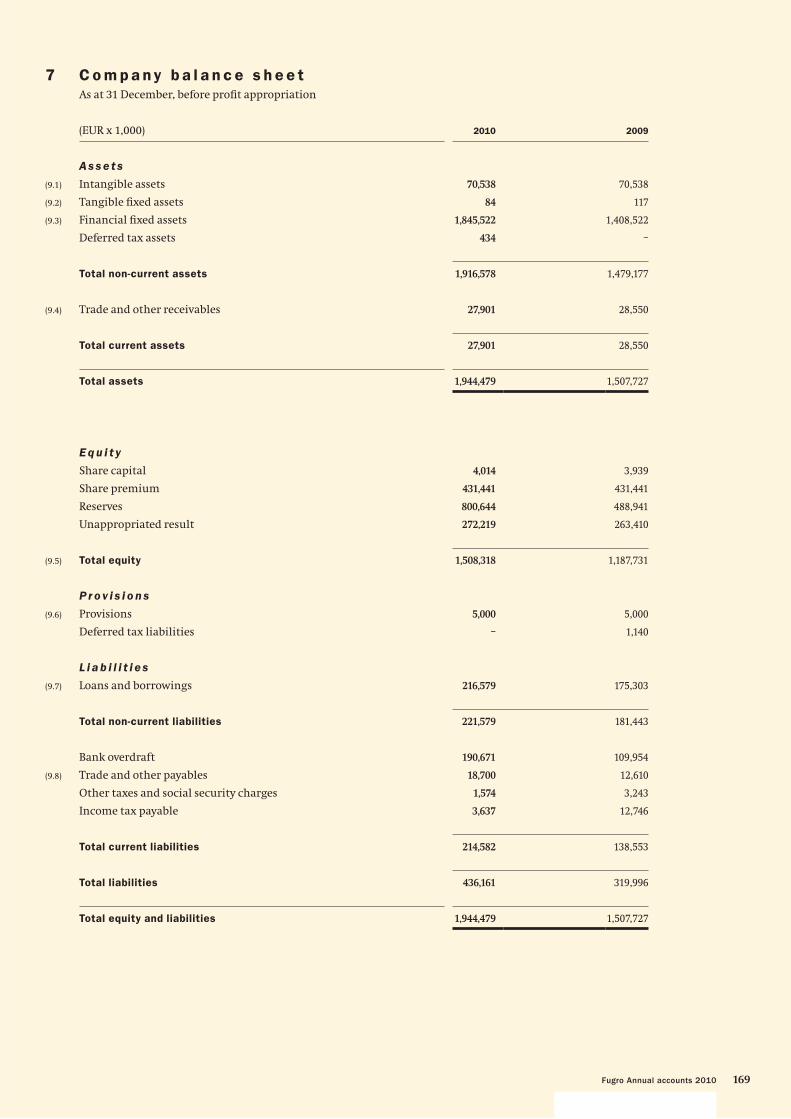
169Fugro Annual accounts 2010
(EUR x 1,000) 2010 2009
A s s e t s
(9.1) Intangible assets 70,538 70,538
(9.2) Tangible fi xed assets 84 117
(9.3) Financial fi xed assets 1,845,522 1,408,522
Deferred tax assets 434 –
Total non-current assets 1,916,578 1,479,177
(9.4) Trade and other receivables 27,901 28,550
Total current assets 27,901 28,550
Total assets 1,944,479 1,507,727
E q u i t y
Share capital 4,014 3,939
Share premium 431,441 431,441
Reserves 800,644 488,941
Unappropriated result 272,219 263,410
(9.5) Total equity 1,508,318 1,187,731
P r o v i s i o n s
(9.6) Provisions 5,000 5,000
Deferred tax liabilities – 1,140
L i a b i l i t i e s
(9.7) Loans and borrowings 216,579 175,303
Total non-current liabilities 221,579 181,443
Bank overdraft 190,671 109,954
(9.8) Trade and other payables 18,700 12,610
Other taxes and social security charges 1,574 3,243
Income tax payable 3,637 12,746
Total current liabilities 214,582 138,553
Total liabilities 436,161 319,996
Total equity and liabilities 1,944,479 1,507,727
7 C o m p a ny b a l a n c e s h e e tAs at 31 December, before profi t appropriation

170
(EUR x 1,000) 2010 2009
Share in results from participating interests, after taxation 268,593 260,945
Other results after taxation 3,626 2,465
Net result 272,219 263,410
Other results concern the costs of the Company less reimbursements from subsidiaries.
8 C o m p a ny i n c o m e s t a t e m e n tFor the year ended 31 December

171Fugro Annual accounts 2010
9 N o t e s t o t h e c o m p a ny f i n a n c i a l s t a t e m e n t s
G e n e r a l
The company fi nancial statements form part of the 2010 consolidated fi nancial statements of Fugro. With
reference to the company income statement of Fugro, use has been made of the exemption pursuant to Article
2:402 of the Netherlands Civil Code.
A c c o u n t i n g p o l i c i e s
For setting the principles for the recognition and measurement of assets and liabilities and determination of
the result for its company fi nancial statements, Fugro makes use of the option provided in Article 2:362 Clause 8
of the Netherlands Civil Code. This means that the principles for the recognition and measurement of assets and
liabilities and determination of the result (hereinafter referred to as principles for recognition and
measurement) of the company fi nancial statements of Fugro N.V. are the same as those applied for the
consolidated EU-IFRS fi nancial statements. Participating interests, over which signifi cant infl uence is exercised,
are stated on the basis of the net asset value. These consolidated fi nancial statements have been prepared in
accordance with International Financial Reporting Standards (IFRS) as adopted by the European Union (EU-IFRS)
and with Part 9 of Book 2 of the Netherlands Civil Code. Reference is made to pages 96 to 115 for a description of
these principles.
The share in the result of participating interests consists of the share of Fugro in the result of these participating
interests. Results on transactions, where the transfer of assets and liabilities between Fugro and its participating
interests, and mutually between participating interests themselves, are not incorporated as far as they can be
deemed to be unrealised.
9.1 I n t a n g i b l e a s s e t s
(EUR x 1,000) 2010 2009
Cost
Balance at 1 January 70,538 70,538
Balance at 31 December 70,538 70,538
Carrying amount
At 1 January 70,538 70,538
At 31 December 70,538 70,538
The capitalised goodwill is not systematically amortised. Goodwill is tested for impairment annually, or when
there is an indication for impairment. Goodwill represents amounts arising on acquisition of subsidiaries.
No impairment has been recognised.

172
9.2 Ta n g i b l e f i xe d a s s e t s
(EUR x 1,000)2010
Other
2009
Other
Cost
Balance at 1 January 1,464 1,454
Other investments 65 27
Disposals (1) (17)
Balance at 31 December 1,528 1,464
Depreciation
Balance at 1 January 1,347 1,252
Depreciation 97 112
Disposals – (17)
Balance at 31 December 1,444 1,347
Carrying amount
At 1 January 117 202
At 31 December 84 117
9.3 F i n a n c i a l f i xe d a s s e t s
(EUR x 1,000) 2010 2009
Subsidiaries 1,687,049 1,344,226
Long-term loans 158,473 64,296
1,845,522 1,408,522
9.3.1 Subsidiaries
(EUR x 1,000) 2010 2009
Balance at 1 January 1,344,226 1,064,734
Share in result of participating interests 268,593 260,945
Dividends (31,637) (20,494)
Currency exchange differences 113,698 47,670
Other (7,831) (8,629)
Balance 31 December 1,687,049 1,344,226
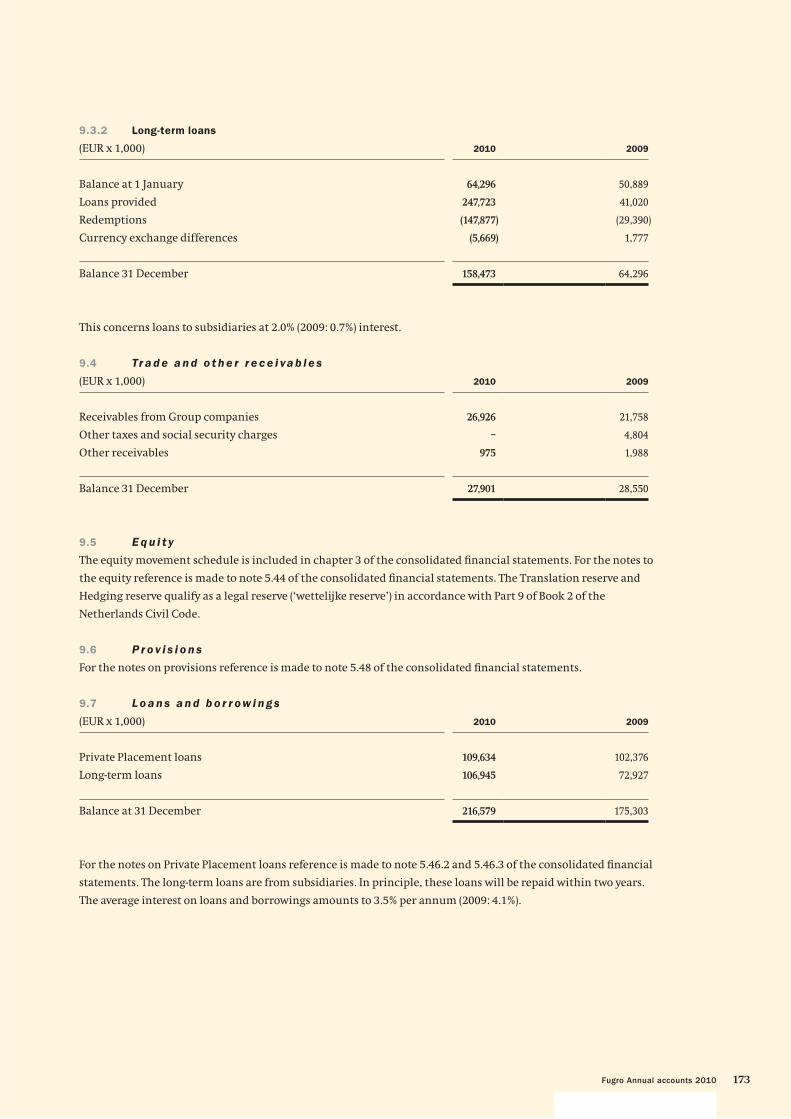
173Fugro Annual accounts 2010
9.3.2 Long-term loans
(EUR x 1,000) 2010 2009
Balance at 1 January 64,296 50,889
Loans provided 247,723 41,020
Redemptions (147,877) (29,390)
Currency exchange differences (5,669) 1,777
Balance 31 December 158,473 64,296
This concerns loans to subsidiaries at 2.0% (2009: 0.7%) interest.
9.4 Tr a d e a n d o t h e r r e c e i va b l e s
(EUR x 1,000) 2010 2009
Receivables from Group companies 26,926 21,758
Other taxes and social security charges – 4,804
Other receivables 975 1,988
Balance 31 December 27,901 28,550
9.5 E q u i t y
The equity movement schedule is included in chapter 3 of the consolidated fi nancial statements. For the notes to
the equity reference is made to note 5.44 of the consolidated fi nancial statements. The Translation reserve and
Hedging reserve qualify as a legal reserve (‘wettelijke reserve’) in accordance with Part 9 of Book 2 of the
Netherlands Civil Code.
9.6 P r o v i s i o n s
For the notes on provisions reference is made to note 5.48 of the consolidated fi nancial statements.
9.7 L o a n s a n d b o r r ow i n g s
(EUR x 1,000) 2010 2009
Private Placement loans 109,634 102,376
Long-term loans 106,945 72,927
Balance at 31 December 216,579 175,303
For the notes on Private Placement loans reference is made to note 5.46.2 and 5.46.3 of the consolidated fi nancial
statements. The long-term loans are from subsidiaries. In principle, these loans will be repaid within two years.
The average interest on loans and borrowings amounts to 3.5% per annum (2009: 4.1%).

174
9.8 Tr a d e a n d o t h e r p a ya b l e s
(EUR x 1,000) 2010 2009
Trade payables 2,198 1,869
Interest Private Placement loans 1,117 1,024
Non-trade payables and accrued expenses 15,385 9,717
Balance 31 December 18,700 12,610
9.9 C o m m i t m e n t s n o t i n c l u d e d i n t h e b a l a n c e s h e e t
Tax unit
Fugro N.V. and the Dutch operating companies form a fi scal unit for corporate tax. Each of the operating
companies is severally liable for corporate tax to be paid by the fi scal unit.
9.10 G u a r a n t e e s
In principle Fugro does not provide parent company guarantees to its subsidiaries, unless signifi cant commercial
reasons exist. Fugro has fi led declarations of joint and several liability for a number of subsidiaries at the
Chambers of Commerce. Fugro has fi led a list with the Chamber of Commerce, which includes all fi nancial
interests of the Group in subsidiaries as well as a reference to each subsidiary for which such a declaration of
liability has been deposited. At 31 December 2010 and at 31 December 2009 no signifi cant guarantees were
outstanding.
9.11 C o n t i n ge n c i e s
For the notes to contingencies reference is made to note 5.56.3 of the consolidated fi nancial statements.
9.12 R e l a t e d p a r t i e s , R e m u n e r a t i o n D i r e c t o r s , E xe c u t i ve C o m m i t t e e
a n d S u p e r v i s o r y B o a r d
For the notes to related parties, reference is made to note 5.58 of the consolidated fi nancial statements. In note
5.58 the remuneration of the Directors, Executive Committee and Supervisory Board is disclosed.
9.13 Au d i t f e e s
With reference to Article 2:382a of the Netherlands Civil Code, the following fees for the fi nancial year have been
charged by KPMG to the Company and its subsidiaries:
(EUR x 1,000) 2010 2009
KPMG
Acoun-
tants N.V.
Other
KPMG
network
Total
KPMG
KPMG
Acoun-
tants N.V.
Other
KPMG
network
Total
KPMG
Statutory audit of annual accounts 691 1,355 2,046 692 1,518 2,210
Other assurance services 65 41 106 112 227 339
Tax advisory services – 9 9 – 66 66
Other non-audit services 5 – 5 10 – 10
Total 761 1,405 2,166 814 1,811 2,625
In 2010 the audit fees under the category ‘statutory audit of annual accounts’, include an amount of EUR 178
thousand for the audit of the 2009 statutory fi nancial statements of subsidiaries.
175Fugro Annual accounts 2010
Audit and (non-)audit related fees for the respective years are charged to the income statement on an accrual
basis.
The most important task of the external auditor is the audit of the (consolidated) fi nancial statements of Fugro.
Furthermore, the auditor assists with due diligence processes and fi nancial statements related audit work
within the Group. Tax advice is in principle given by specialist fi rms or specialised departments of local audit
fi rms, which hardly ever are involved in the audit of the annual accounts of the relevant subsidiary. Other than
these advisory services, Fugro makes only limited use of external advisors. In the case that such services are
required, specialists are engaged that are not associated with the external auditor.
The fees paid for the above mentioned services, which are included in profi t or loss of the consolidated fi nancial
statements in the line other expenses, are evaluated on a regular basis and in line with the market.
The members of the Supervisory Board have signed the fi nancial statements pursuant to their statutory
obligations under Article 2:101 sub 2 Netherlands Civil Code.
The members of the Board of Management have signed the fi nancial statements pursuant to their statutory
obligations under Article 2:101 sub 2 Netherlands Civil Code and Article 5:25c sub 2 (c) Financial Markets
Supervison Act.
Leidschendam, 9 March 2011
Board of Management Supervisory Board
K.S. Wester, President and Chief Executive Offi cer F.H. Schreve, Chairman
A. Jonkman, Chief Financial Offi cer F.J.G.M. Cremers, Vice-chairman
P. van Riel J.A. Colligan
J. Rüegg M. Helmes
A. Steenbakker G-J. Kramer
H.C. Scheffer
Th. Smith

176
10.1 I n d e p e n d e n t Au d i t o r ’s r e p o r t
To: the Supervisory Board and Shareholders of Fugro N.V.
Report on the financial statements
We have audited the accompanying fi nancial statements
2010 of Fugro N.V., Leidschendam, as set out on pages 88
to 175. The fi nancial statements include the consolidated
fi nancial statements and the company fi nancial
statements. The consolidated fi nancial statements
comprise the consolidated statement of fi nancial position
as at 31 December 2010, the consolidated statement of
comprehensive income, of changes in equity, and of cash
fl ows for the year then ended, and notes, comprising
a summary of the signifi cant accounting policies and
other explanatory information. The company fi nancial
statements comprise the company balance sheet as at
31 December 2010, the company income statement for the
year then ended and the notes, comprising a summary of
the accounting policies and other explanatory
information.
Management’s responsibility
Management is responsible for the preparation and fair
presentation of the fi nancial statements in accordance
with International Financial Reporting Standards as
adopted by the European Union and with Part 9 of Book 2
of the Netherlands Civil Code, and for the preparation of
the report of the board of management in accordance
with Part 9 of Book 2 of the Netherlands Civil Code.
Furthermore, management is responsible for such
internal control as it determines is necessary to enable
the preparation of the fi nancial statements that are free
from material misstatement, whether due to fraud or
error.
Auditor’s responsibility
Our responsibility is to express an opinion on these
fi nancial statements based on our audit. We conducted
our audit in accordance with Dutch law, including the
Dutch Standards on Auditing. This requires that we
comply with ethical requirements and plan and perform
the audit to obtain reasonable assurance about whether
the fi nancial statements are free from material
misstatement.
An audit involves performing procedures to obtain audit
evidence about the amounts and disclosures in the
fi nancial statements. The procedures selected depend on
the auditor’s judgment, including the assessment of the
risks of material misstatement of the fi nancial
statements, whether due to fraud or error. In making
those risk assessments, the auditor considers internal
control relevant to the entity’s preparation and fair
presentation of the fi nancial statements in order to design
audit procedures that are appropriate in the
circumstances, but not for the purpose of expressing
an opinion on the effectiveness of the entity’s internal
control. An audit also includes evaluating the
appropriateness of accounting policies used and the
reasonableness of accounting estimates made by
management, as well as evaluating the overall
presentation of the fi nancial statements.
We believe that the audit evidence we have obtained is
suffi cient and appropriate to provide a basis for our audit
opinion.
Opinion with respect to the consolidated financial
statements
In our opinion, the consolidated fi nancial statements give
a true and fair view of the fi nancial position of Fugro N.V.
as at 31 December 2010 and of its result and its cash fl ows
for the year then ended in accordance with International
Financial Reporting Standards as adopted by the
European Union and with Part 9 of Book 2 of the
Netherlands Civil Code.
Opinion with respect to the company financial
statements
In our opinion, the company fi nancial statements give a
true and fair view of the fi nancial position of Fugro N.V.
as at 31 December 2010 and of its result for the year then
ended in accordance with Part 9 of Book 2 of the
Netherlands Civil Code.
1 0 O t h e r i n f o r m a t i o n

177Fugro Annual accounts 2010
Report on other legal and regulatory requirements
Pursuant to the legal requirements under section 2:393
sub 5 at e and f of the Netherlands Civil Code, we have no
defi ciencies to report as a result of our examination
whether the report of the board of management, to the
extent we can assess, has been prepared in accordance
with part 9 of Book 2 of this Code, and whether the
information as required under section 2:392 sub 1 at b - h
has been annexed. Further, we report that the report of
the board of management, to the extent we can assess, is
consistent with the fi nancial statements as required by
section 2:391 sub 4 of the Netherlands Civil Code.
Rotterdam, 9 March 2011
KPMG ACCOUNTANTS N.V.
H. Heijnraets RA

178
10.2 S u b s e q u e n t e ve n t s
Reference is made to note 5.57.
10.3 Fo u n d a t i o n B o a r d s
Stichting Administratiekantoor Fugro
The Board of Stichting Administratiekantoor Fugro (Trust
Offi ce), Leidschendam, The Netherlands, is composed as
follows:
name function term
R. van der Vlist, Chairman Board member 2012
L.P.E.M. van den Boom Board member 2013
J.F. van Duyne Board member 2011
J.A.W.M. van Rooijen Board member 2014
All Board members are independent of Fugro.
Stichting Beschermingspreferente aandelen Fugro
The Board of Stichting Beschermingspreferente aandelen
Fugro , Leidschendam, The Netherlands, is composed as
follows:
name function term
M.W. den Boogert, Chairman Board member B 2014
M.A.M. Boersma Board member B 2014
J.V.M. Commandeur Board member B 2012
J.C. de Mos Board member B 2013
F.H. Schreve Board member A 2011
All Board members, with the exception of Mr. F.H. Schreve,
are independent of Fugro. Mr. Schreve is Chairman of the
Supervisory Board of Fugro.
Stichting Continuïteit Fugro
The Board of Stichting Continuïteit Fugro, Curaçao,
is composed as follows:
name function term
G. Elias, Chairman Board member B 2014
A.C.M. Goede Board member B 2013
R. de Paus Board member B 2011
M. van de Plank Board member B 2014
F.H. Schreve Board member A indefi nite
* In capacity as a member of the Supervisory Board of Fugro.
All Board members, with the exception of Mr. F.H. Schreve,
are independent of Fugro. Mr. Schreve is Chairman of the
Supervisory Board of Fugro.
*
10.4 S t a t u t o r y p r o v i s i o n s r e ga r d i n g
t h e a p p r o p r i a t i o n o f p r o f i t
The provisions regarding the appropriation of profi t are
contained in article 36 of the articles of association of
Fugro and, as far as relevant, read as follows:
36.2 a. The profi t shall, if suffi cient, be applied fi rst in
payment to the holders of protective preference
shares of a percentage as specifi ed below of the
compulsory amount paid on these shares as at
the commencement of the fi nancial year for
which the distribution is made.
b. The percentage referred to above in
subparagraph a. shall be equal to the average of
the Euribor interest charged for loans with a
term of one year – weighted by the number of
days for which this interest was applicable –
during the fi nancial year for which the
distribution is made, increased by at most four
percentage points; this increase shall each time
be fi xed by the Board of Management for a
period of fi ve years, after approval by the
Supervisory Board.
36.3 a. Next, if possible, a dividend shall be paid on the
fi nancing preference shares of each series and
on the convertible fi nancing preference shares
of each series, equal to a percentage calculated
on the amount effectively paid on the fi nancing
preference shares of the respective series and
the convertible fi nancing preference shares of
the respective series, including a share
premium, if any, upon the fi rst issue of the
series in question, and which percentage shall
be related to the average effective return on
‘state loans general with a term of 7 – 8 years’,
calculated and determined in the manner as
described hereinafter.
b. The percentage of the dividend for the fi nancing
preference shares of each or for the convertible
fi nancing preference shares of each series, as
the case may be, shall be calculated by taking
the arithmetic mean of the average effective
return on the aforesaid loans, as published by
Bloomberg, or if Bloomberg does not publish
this information, by Reuters, for the last fi ve
stock market trading days preceding the day of
the fi rst issue of fi nancing preference shares of
the respective series or the convertible
fi nancing preference shares of the respective
series, as the case may be, or preceding the day
on which the dividend percentage is adjusted,

179Fugro Annual accounts 2010
increased or decreased, if applicable, by a
mark-up or mark-down set by the Board of
Management upon issue and approved by the
Supervisory Board of at most two percentage
points, depending on the market conditions
then obtaining, which mark-up or mark-down
may differ for each series, or, if Reuters does not
publish this information or if such state loan
and information source that is or are most
comparable thereto as to be determined by
the board of Management and approved by
the Supervisory Board.
36.4 If in any fi nancial year the profi t is insuffi cient
to make the distributions referred to above in
paragraph 3 of this article, then in subsequent
fi nancial years the provisions of paragraph 3
shall not apply until the defi cit has been made
good and until the provisions of paragraph 3
have been applied or until the Board of
Management, with the approval of the
Supervisory Board, resolves to charge an
amount equal to the defi cit to the freely
distributable reserves, with the exception of
the reserves which have been set aside as share
premium upon the issue of fi nancing
preference shares or convertible fi nancing
preference shares.
36.5 If the fi rst issue of fi nancing preference shares
or convertible fi nancing preference shares
of a series takes place during the course of a
fi nancial year, the dividend for that fi nancial
year on the respective series of fi nancing
preference shares or convertible fi nancing
preference shares shall be decreased
proportionately up to the fi rst day of such issue.
36.6 After application of paragraphs 2 trough 5 no
further distribution of shall be made on the
protective preference shares, the fi nancing
preference shares or the convertible fi nancing
preference shares.
36.7 Of any profi t remaining after application of
the paragraphs 2 trough 5 such amount shall
be allocated to the reserves by the Board of
Management with the approval of the
Supervisory Board as the Board of Management
shall deem necessary. Insofar as the profi t is not
allocated to the reserves pursuant to the
provisions of the preceding sentence, it shall be
at the disposal of the General Meeting either for
allocation in whole or in part to the reserves or
for distribution in whole or in part to the
holders of ordinary shares pro rata to the
aggregate amount of their ordinary shares.
10.5 P r o p o s a l r e ga r d i n g t h e
a p p r o p r i a t i o n o f p r o f i t
In accordance with article 36 of the articles of association,
it shall be proposed to the Annual General Meeting on
10 May 2011 that the net result of EUR 272.2 million
be appropriated as follows: EUR 119.1 million (EUR 1.50
per share) as dividend to holders of (certifi cates of)
ordinary shares, to be paid either in cash in or (certifi cates
of) ordinary shares, and the remaining EUR 153.1 million
to be allocated to the reserves. The dividend proposal is
stated on page 15 of the Report of the Supervisory Board
and also on page 29.

180
R e p o r t o f S t i c h t i n g A d m i n i s t r a t i e k a n t o o r
F u g r o ( Tr u s t O f f i c e )
In accordance with article 19 of the conditions of
administration for registered shares in the share capital of
Fugro N.V. (Fugro) and best practice provision IV.2.6 of the
Corporate Governance Code, the undersigned issues the
following report to the holders of certifi cates of ordinary
shares Fugro.
During the 2010 reporting year all the Trust Offi ce’s
activities were related to the administration of ordinary
shares against which certifi cates have been issued.
During 2010 the Board met twice. The meeting of 1 April
2010 was dedicated, among other things, to the succession
of Mr. W. Schatborn who passed away at the beginning of
2010 and to the preparation for the annual general
meeting of Fugro on 6 May 2010. The meeting of 9
September 2010, after the publication of Fugro’s half-
yearly results, was dedicated, among other things, to
the composition of the Board and to general business
developments. It was discussed also if it would be
necessary or useful to convene a meeting of holders of
certifi cates. It was decided that at the moment this was
not the case. Prior to both meetings the Board discussed
with the chairman of the Board of Management and the
chairman of the Supervisory Board of Fugro the activities
and performance of Fugro on the basis of the Annual
Report 2009 and the Half-yearly report 2010 respectively.
Corporate Governance within Fugro and the Trust Offi ce
was also discussed in both meetings.
All the Trust Offi ce’s Board members are independent of
Fugro. The Board may offer holders of certifi cates the
opportunity to recommend candidates for appointment
to the Board. Further regulations related to the holding of
a meeting of holders of certifi cates have been drawn-up.
The Trust Offi ce is authorised to accept voting
instructions from holders of certifi cates and to cast
these votes during a general meeting of Fugro.
The Board attended the annual general meeting of Fugro
held on 6 May 2010. In this meeting the Trust Offi ce
represented 63.5% of the votes cast. The Trust Offi ce voted
in favour of all the proposals submitted to the meeting.
In accordance with the terms of administration, holders
of certifi cates were offered the opportunity to vote, in
accordance with their own opinion, as authorised
representatives of the Trust Offi ce. This opportunity was
taken by 174 holders of certifi cates holding 21,755,551
certifi cates.
Because of the death of Mr. Schatborn, the Board
temporarily comprised three persons. In accordance with
article 4.3 of the articles of association, the Board offered
holders of certifi cates who represent at least 15% of the
issued certifi cates the opportunity to request, until 1 April
2010, that the Board convenes a meeting of holders of
certifi cates in order to recommend a candidate to the
Trust Offi ce’s Board. As no request for a meeting of
holders of certifi cates was submitted, in its meeting
of 1 April 2010 the Board, in accordance with its
announced intention, appointed Mr. J.A.W.M. van Rooijen
as a member of the Board for a period of four years.
In accordance with the roster, on 30 June 2011 Mr. J.F. van
Duyne will step down as a member of the Trust Offi ce’s
Board. The Board intends reappointing Mr. Van Duyne
as a Board member for a third term of four years. In
accordance with article 4.3 of the articles of association,
the Board offers holders of certifi cates who represent at
least 15% of the issued certifi cates the opportunity to
request, until 4 April 2011, that the Board convenes a
meeting of holders of certifi cates in order to recommend
a candidate to the Trust Offi ce’s Board. The request should
be submitted in writing and should state the name and
address of the recommended candidate.
At present the Board of the Trust Offi ce comprises:
1. R. van der Vlist, Chairman
2. L.P.E.M. van den Boom
3. J.F. van Duyne
4. J.A.W.M. van Rooijen
Mr. Van der Vlist was General Secretary of N.V. Koninklijke
Nederlandsche Petroleum Maatschappij.
Mr. Van den Boom was a member of the Board of
Management of NIB Capital Bank N.V. and he is a
Senior Partner of PARK Corporate Finance.
Mr. Van Duyne was Chairman of the Board of
Management of Koninklijke Hoogovens N.V. and after-
wards joint Chief Executive Offi cer of Corus Group PLC.
Mr. Van Rooijen was, amongst others, Chairman of KPMG
Corporate fi nance N.V. and member (CFO) of the Board
of Management of KPMG Holding N.V.
In 2010 the total remuneration of the members of the
Board amounted to EUR 29,250 and the total costs of
the Trust Offi ce amounted to EUR 115,690.

181Fugro Annual accounts 2010
On 31 December 2010, 72,990,098 ordinary shares with a
nominal value of EUR 0.05 were in administration against
which 72,990,098 certifi cates of ordinary shares had been
issued. During the fi nancial year 190,866 certifi cates were
exchanged into ordinary shares and 96,422 ordinary
shares were exchanged into certifi cates. 1,323,865
certifi cates of ordinary shares were issued as a result of
the stock dividend.
The activities related to the administration of the shares
are carried out by the administrator of the Trust Offi ce:
Administratiekantoor van het Algemeen Administratie-
en Trustkantoor B.V. in Amsterdam, The Netherlands.
The Trust Offi ce’s address is: Veurse Achterweg 10,
2264 SG Leidschendam, The Netherlands.
Leidschendam, 1 March 2011
The Board

182
H i s t o r i c r e v i e w
IFRS
2010
IFRS
2009
IFRS
2008 IFRS
2007
IFRS
2006
IFRS
2005
IFRS
2004
I n c o m e a n d e x p e n s e s (x EUR 1,000)
Revenue 2,280,391 2,052,988 2,154,474 1,802,730 1,434,319 1,160,615 1,008,008
Third party costs 765,587 624,413 722,321 604,855 503,096 405,701 364,644
Net revenue own services (revenue less third party costs) 1,514,804 1,428,575 1,432,153 1,197,875 931,223 754,914 643,364
Results from operating activities (EBIT) 2) 351,479 367,422 385,732 324,813 211,567 144,070 104,236
EBITDA 561,083 551,130 535,178 439,590 295,948 218,833 177,453
Cash fl ow 489,757 456,773 438,902 337,106 226,130 176,093 125,802
Net result 2) 272,219 263,410 283,412 216,213 141,011 99,412 49,317
of which non-recurring items – – – – – – –
B a l a n c e s h e e t (x EUR 1,000)
Property, plant and equipment 1,291,314 1,043,227 859,088 599,298 412,232 262,759 232,956
Investments 446,755 330,244 337,469 299,699 203,944 90,414 71,028
of which in acquisitions 2,931 9,882 14,423 8,666 21,041 10,057 2,296
Depreciation of property, plant and equipment 201,493 173,593 140,429 107,684 78,169 69,445 66,139
Net current assets 1) 253,186 140,301 56,060 171,347 150,733 222,485 (95,348)
Total assets 3,089,991 2,366,317 2,123,306 1,700,130 1,405,698 1,138,660 983,350
Provisions 5,204 6,240 13,155 16,278 13,888 398 1,075
Loans and borrowings 590,862 441,339 395,384 449,957 341,997 300,753 184,268
Equity attributable to owners of the company 1) 1,508,318 1,187,731 928,329 699,989 562,417 465,460 223,913
Key r a t i o s (in %) 2)
Results from operating activities (EBIT)/revenue 15.4 17.9 17.9 18.0 14.8 12.9 10.3
Profi t/revenue 11.9 12.8 13.2 12.0 9.8 8.6 4.9
Profi t/net revenue own services 18.0 18.4 19.8 18.0 15.1 13.2 7.7
Profi t/capital and reserves 1) 22.3 24.9 34.8 34.3 27.4 28.8 22.7
Total equity/total assets 1) 49.3 50.7 44.1 41.6 40.2 41.3 23.2
Interest cover 29.0 47.8 13.9 13.1 10.9 7.2 3.7
D a t a p e r s h a r e (x EUR 1.–) 2) 4)
Equity attributable to owners of the Company 1) 18.79 15.08 12.12 9.94 8.08 6.76 3.60
Results from operating activities (EBIT) 3) 4.49 4.82 5.29 4.67 3.08 2.18 1.76
Cash fl ow 3) 6.25 5.99 6.01 4.84 3.29 2.67 2.12
Net result 3) 3.47 3.46 3.88 3.11 2.05 1.51 0.83
Dividend paid in year under review 1.50 1.50 1.25 0.83 0.60 0.48 0.48
S h a r e p r i c e (x EUR 1.–) 4)
Year-end share price 61.50 40.26 20.485 52.80 36.20 27.13 15.35
Highest share price 62.06 41.85 59.95 62.00 36.64 27.40 16.41
Lowest share price 37.095 19.085 19.32 34.91 27.13 15.14 10.05
N u m b e r o f e m p l oy e e s
At year-end 13,463 13,482 13,627 11,472 9,837 8,534 7,615
S h a r e s i n i s s u e (x 1,000) 4)
Of nominal EUR 0.05 at year-end 80,270 78,772 76,608 70,421 69,582 68,825 62,192
1) As of 2002 no accrued dividend has been incorporated.
2) For 2002 and earlier years, before amortisation of goodwill.
3) Unlike preceding years the figures as from the year 1999 have been calculated based upon the weighted average number of outstanding shares.
4) As a result of the share split (4:1) in 2005, the historical figures have been restated.

183Fugro Annual accounts 2010
IFRS
2003
Dutch
GAAP
2002
Dutch
GAAP
2001
Dutch
GAAP
2000
Dutch
GAAP
1999
Dutch
GAAP
1998
Dutch
GAAP
1997
Dutch
GAAP
1996
Dutch
GAAP
1995
822,372 945,899 909,817 712,934 546,760 578,207 482,096 375,276 296,636
273,372 328,401 331,685 250,132 176,067 197,258 172,346 123,337 99,378
549,000 617,498 578,132 462,765 370,648 380,948 309,750 251,939 197,258
63,272 111,873 98,470 73,697 61,805 61,669 46,195 25,911 12,434
124,056 158,814 142,039 113,269 98,334 97,926 75,781 49,371 32,037
80,480 119,161 105,301 85,596 77,233 74,057 60,670 39,479 26,773
18,872 72,220 61,732 46,024 40,704 37,800 31,084 16,018 7,170
– – – – – – 3,630 – (4,538)
268,801 192,293 163,298 120,526 114,035 108,181 93,479 68,521 64,800
123,983 100,036 89,352 49,008 37,301 61,487 58,220 27,000 24,776
70,888 24,852 11,196 3,686 9,257 6,081 5,763 1,724 3,222
54,004 46,941 43,569 39,572 36,529 36,257 29,586 23,460 19,603
114,852 129,071 (50,514) 92,269 15,066 7,170 6,308 11,571 9,121
1,056,003 793,245 814,772 474,741 380,495 338,021 289,512 216,272 170,122
584 12,706 8,056 6,746 10,573 8,894 7,805 4,447 2,723
431,895 273,520 121,450 120,713 23,234 24,368 17,153 18,741 23,823
211,196 271,698 244,660 101,453 107,909 90,575 77,370 61,260 51,050
9.2 11.8 10.8 10.3 11.3 10.7 9.6 6.9 4.2
2.3 7.6 6.8 6.5 7.4 6.5 6.4 4.3 2.4
8.3 11.7 10.7 9.9 11.0 9.9 10.0 6.4 3.6
17.6 27.4 35.7 45.4 41.0 45.0 44.8 28.5 13.1
20.2 34.6 30.4 22.1 29.3 27.9 27.7 28.9 30.4
2.2 6.1 7.8 8.1 13.1 12.1 10.4 – –
3.48 4.57 4.17 2.10 2.29 1.91 1.65 1.36 1.11
1.09 1.95 1.86 1.48 1.27 1.30 0.98 0.58 0.27
1.39 2.08 1.98 1.72 1.59 1.56 1.29 0.88 0.58
0.33 1.26 1.16 0.92 0.84 0.80 0.66 0.36 0.16
0.46 0.46 0.40 0.34 0.31 0.28 0.25 0.17 0.08
10.20 10.78 12.53 17.19 9.23 4.99 7.01 3.48 1.96
12.86 16.50 18.91 17.81 9.98 10.99 8.28 3.71 4.14
6.13 9.88 10.75 9.31 4.10 4.06 3.44 1.93 1.45
8,472 6,923 6,953 5,756 5,114 5,136 4,429 4,222 3,968
60,664 59,449 58,679 51,048 50,449 48,682 47,673 46,053 46,044

184
G l o s s a r y
Te c h n i c a l t e r m s
2D Seismic: Acoustic measuring technology which uses single vessel-towed hydrophone
streamers. This technique generates a 2D cross-Article of the deep seabed and is used
primarily when initially reconnoitring for the presence of oil or gas reservoirs.
3D Seismic: Acoustic measuring technology which uses multiple vessel-towed long
hydrophone streamers. This technique generates a 3D model of the deep seabed and is
used to locate and analyse oil and gas reservoirs.
AUV (Autonomous Underwater Vehicle): An unmanned submersible launched
from a ‘mother-vessel’ but not connected to it via a cable. Propulsion and control are
autonomous and use pre-defi ned mission protocols.
Construction Support: Offshore services related to the installation and construction
of structures such as pipelines, drilling platforms and other oil and gas related
infrastructure, usually involving the use of ROVs.
DGPS (Differential Global Positioning System): A GPS based positioning system
using territorial reference points to enhance accuracy.
EM: Electromagnetic.
Fugro Pressure Corer (FPC): The FPC uses a water hammer, driven by the circulating
fl uid pumped down the drill pipe, to drive the core barrel into the sediment.
Gas hydrates: mixture of semi-solid methane gas and water molecules that are created
by water pressure and cold temperatures found deep in the ocean.
Geophysics: The mapping of subterranean soil characteristics using non-invasive
techniques such as sound.
Geoscience: A range of scientifi c disciplines (geology, geophysics, petroleum
engineering, bio stratifi cation, geochemistry, etc.) related to the study of rocks, fossils
and fl uids.
Geotechnics: The determination of subterranean soil characteristics using invasive
techniques such as probing, drilling and sampling.
Glonass: Global Navigation Satellite System.
GPS: Global Positioning System.
Gravity: Precision gravity measurements to detect geological and other anomalies.
LiDAR: a measuring system based on laser technology that can make extremely accurate
recordings from an aircraft.
Multi client data: Data collected at own risk and expense and sold to several clients.
ROV (Remotely Operated Vehicle): Unmanned submersible launched from a vessel
and equipped with measuring and manipulation equipment. A cable to the mother-
vessel provides power, video and data communication.
Seismic: Acoustic measurement of seabed characteristics and stratifi cation with the
objective of detecting oil and gas. These measurements are conducted using specialised
vessels equipped with powerful acoustic energy sources and long receiving streamers
(hydrophones) to measure (sub) seabed acoustic echoes.
Starfi x: DGPS positioning system, specifi cally for use offshore. This system is intended
for the professional user and, in addition to a high degree of accuracy, is equipped with
a wide range of data analysis and quality control possibilities.
Survey Services: Services related to the measurement, management and mapping of
locations, objects and operations, most of which involve a substantial navigation and
positioning component.
F i n a n c i a l t e r m s
Cash fl ow: The profi t for the period attributable to equity holders of the company plus
depreciation, amortisation of intangible fi xed assets and minority interest.
Debt (on ‘Private Placement’ covenants): Long-term loans including obligations
arising from leasing agreements.
Dividend yield: Dividend as a percentage of the (average) share price.
EBIT: Result from operating activities.
EBITDA: Result from operating activities before depreciation and amortisation.
Gearing: Loans and borrowings plus bank overdraft minus cash and cash equivalents,
divided by shareholders equity.
Interest cover: Result from operating activities (EBIT) compared with the net interest
charges.
Invested capital: The capital made available to the Company, i.e. Group equity plus
the available loans and the balance of current account deposits/withdrawals.
Net profi t margin: profi t as a percentage of Revenue.
Private Placement: Long-term fi nancing (10 – 15 years), entered into in May 2002 via
a private placement with over twenty American and two British institutional investors.
Return on invested capital: The profi t (before profi t appropriation) including
minority interest and interest charges as a percentage of the average invested capital.
Solvency: Shareholders’ equity as a percentage of the balance sheet total.
Fugro N.V.
Veurse Achterweg 10
P.O. Box 41
2260 AA Leidschendam
The Netherlands
Telephone: +31 (0)70 3111422
Fax: +31 (0)70 3202703
E-mail: [email protected]
www.fugro.com
Trade Register number 27120091
VAT number 00 56 21 409 B01
C o l o p h o n
Fugro N.V.
Veurse Achterweg 10
2264 SG Leidschendam
The Netherlands
Telephone: +31 (0)70 3111422
Fax: +31 (0)70 3202703
Concept and realisation:
C&F Report Amsterdam B.V.
Photography and images:
Fugro N.V.
Fugro has endeavoured to fulfil all legal requirements
related to copyright. Anyone who, despite this, is of
the opinion that other copyright regulations could
be applicable should contact Fugro.
This annual report is a translation of the official
report published in the Dutch language.
This annual report is also available on www.fugro.com.
For complete information, see www.fugro.com.
Cautionary Statement regarding Forward-Looking Statements
This annual report may contain forward-looking statements. Forward-looking statements are statements that are not historical facts, including
(but not limited to) statements expressing or implying Fugro N.V.’s beliefs, expectations, intentions, forecasts, estimates or predictions (and the
assumptions underlying them). Forward-looking statements necessarily involve risks and uncertainties. The actual future results and situations
may therefore differ materially from those expressed or implied in any forward-looking statements. Such differences may be caused by various
factors (including, but not limited to, developments in the oil and gas industry and related markets, currency risks and unexpected operational
setbacks). Any forward-looking statements contained in this annual report are based on information currently available to Fugro N.V.’s manage-
ment. Fugro N.V. assumes no obligation to make a public announcement in each case where there are changes in information related to,
or if there are otherwise changes or developments in respect of, the forward-looking statements in this annual report.

GEOTECHNIEK
MILIEU ONDERZOEK
MARINER
AN
NU
AL
RE
PO
RT
20
10
FU
GR
O N
.V
.
Annua l Re p o r t 2010FUGRO N .V.