
Fuelling the next generationoilandgasuk.co.uk/wp-content/uploads/2015/10/EY-Report-Fuelling... ·...
48
Fuelling the next generation A study of the UK upstream oil and gas workforce December 2014
-
Upload
dinhkhuong -
Category
Documents
-
view
220 -
download
2
Transcript of Fuelling the next generationoilandgasuk.co.uk/wp-content/uploads/2015/10/EY-Report-Fuelling... ·...

Fuelling the next generation A study of the UK upstream oil and gas workforce
December 2014

p8p91. The UK oil and gas
labour market in context
2. Current labour market position
Commissioned by:
Fuelling the next generation - A study of the UK upstream oil and gas workforce1

p31Contents
Foreword from the Oil and Gas Industry Council 4
Executive Summary 5
The UK oil and gas labour market in context 8
Current labour market position 9
Estimated future labour market demand 25
Looking ahead 31
Appendices 34
Appendix A - Methodology 35
Appendix B - Footnotes 39
Appendix C - Bibliography 41
Glossary 43
Acknowledgements 45
p25
4. Looking ahead
3. Estimated future labour market demand
2
1
3
4
Fuelling the next generation - A study of the UK upstream oil and gas workforce 2

3 Fuelling the next generation - A study of the UK upstream oil and gas workforce

Foreword from the Oil and Gas Industry Council
Skills are one of the key themes of our Oil and Gas Industrial Strategy. Over the past 40 years, the industry has generated hundreds of thousands of exciting and rewarding careers. The ingenuity and expertise of this workforce has built an enviable global reputation. Its achievements have made a unique contribution to the UK’s economic well-being. But what does the future hold? And how can we ensure the workforce is in shape to meet the challenges ahead?Earlier this year, Oil & Gas UK, OPITO, and the Department for Business, Innovation and Skills, commissioned EY to gather workforce data to identify the demographic and skills composition of the current oil and gas industry workforce, the key challenges faced by the industry and how the demand for skills is likely to change over the next five years. The purpose was to understand where targeted actions would be needed to sustain the UK oil and gas industry’s reputation as a global centre of excellence.
‘Fuelling the next generation’ paints a detailed picture of the UK’s current and future upstream oil and gas labour market, and contains unique insights that will allow us to look at ways of addressing the issues affecting the industry. For example, while 70 per cent of respondents said they were experiencing difficulties to recruit, it seems the scale of the shortage is less pronounced than 12-18 months ago, and is limited to specific areas such as Technical Safety, Drilling Engineering, Geosciences and Business support services. Most of these are in Aberdeen.
A key message from this report is that oil and gas is a young sector, with strong opportunities for new entrants. It currently employs 1 in 80 of the UK workforce at an average annual salary of £64,000. Over the next five years, total employment is expected to fall, but there will still be opportunities for 12,000 new entrants. While investment in the UK Continental Shelf is likely to decline, the impact
should be offset in part by growing supply chain opportunities in export markets, the need to decommission North Sea assets, and new prospects for an onshore shale industry.
The recent fall in oil prices has brought home the challenges ahead, but now more than ever the industry needs to stay the course and continue to invest in developing its own – not repeating the mistakes from the 1980s and 1990s.
The Industrial Strategy provides a framework to act on the report findings and develop a ‘skills alliance’. Steps are already in train such as the new Centre for Doctoral Training, the National College for Onshore Oil and Gas, a national programme to retrain ex-military personnel, and industry’s support for initiatives like Tomorrow’s Engineers and See Inside Manufacturing. Last month’s OPITO National Oil and Gas Skills Week also saw collaboration across the sector with close to 80 organisations involved in around 50 different events from Aberdeen to London.
Industry, government and education institutions, working together, now need to build on this momentum to ensure a workforce fully equipped to sustain the oil and gas industry for the next 40 years at least.
Gordon Ballard Co-Chair of the Oil and Gas Industry Council
Matthew Hancock Minister of State for Energy
4Fuelling the next generation - A study of the UK upstream oil and gas workforce

Executive summary
Fuelling the next generation - A study of the UK upstream oil and gas workforce5
This report, commissioned by Oil & Gas UK, Opito and the Department for Business, Innovation and Skills (BIS), covers the current and future skills the UK needs to sustain the oil and gas industry.
► Its purpose is to provide data to calibrate the Oil and Gas Industrial Strategy published in March 2013; inform the planning and delivery of skills for the sector; and continue to raise awareness of the sector’s future potential and contribution to the UK.
► It establishes a fact base identifying the current upstream workforce profile and the activities that will drive talent demand over the next two to five years.
► In particular, the focus is on five key questions:
1. What is the current workforce profile (age, gender, employment status)?
2. What skills are in demand?
3. Are there any shortages?
4. How might demand for skills change over the next five years?
5. What factors are driving this change?
We selected a sample1 of over 280 UK-registered companies, covering Exploration & Production (defined as Tier 1 in the report) and five supply chain segments (Facilities, Marine & Subsea, Reservoirs, Wells, and Support & Services).
►The supply chain companies considered generate at least 50% of their turnover in the upstream oil and gas sector2 and are split into 31 supply chain sub-sectors, which roll up to the five supply chain segments. This categorisation is in line with the mapping set out in “UK upstream oil and gas supply chain: Economic contribution” report published in April 2014.
►We conducted in-depth interviews with over 50 organisations from the defined Tier 1 and supply chain sample; these were supplemented with input from educational institutions and recruitment consultancies. In addition, we collated data from 50 online questionnaires to provide a snapshot of the current workforce and skills profile, and to validate future demand requirements.
►Through interviews and questionnaires, we gathered input from Tier 1 companies responsible for 62% of total UK North Sea oil and gas production revenues over 2013-143, and from supply chain companies covering 29% of the oil and gas supply chain revenue.
►Based on the sample of respondents, the number of employees supported by the industry stands at 375,000. We applied a number of drivers to estimate future employment demand over five years; this places the 2019 workforce at 340,000.
►More detailed information about the methodology used to compile this report is included in the Appendices.
The oil and gas industry is a valuable asset to the UK economy. It provides 1 in every 80 jobs and has a strong reputation globally as a centre of excellence. Looking to the future there are significant opportunities both in the UKCS and overseas.
Based on our sample, key findings on the current profile of the oil and gas sector workforce can be summarised as follows:
► The results dispel the ‘ageing workforce’ myth. The proportion of over-55s is lower than the national average (13% vs 32%).
► The perceived gap at mid-career level is not as significant as previously thought. We found that the industry has a high proportion of mid-career professionals with half the workforce aged 25-45.
Fuelling the next generation - A study of the UK upstream oil and gas workforce 6
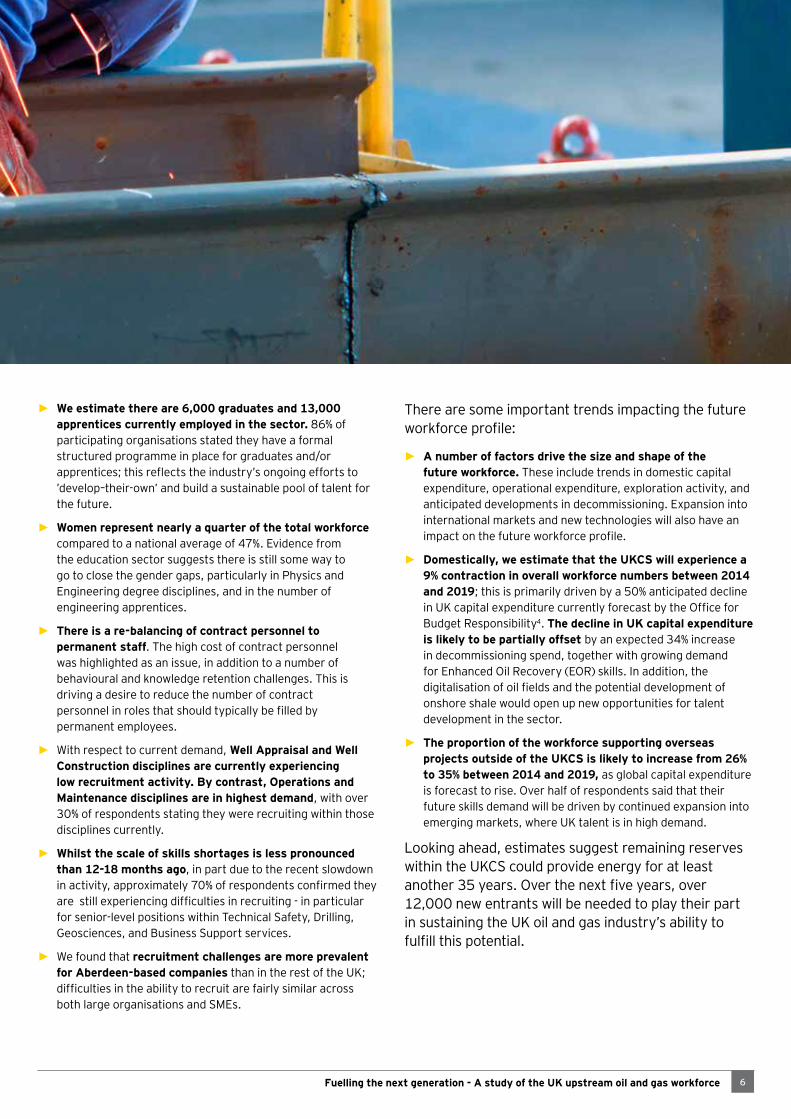
► We estimate there are 6,000 graduates and 13,000 apprentices currently employed in the sector. 86% of participating organisations stated they have a formal structured programme in place for graduates and/or apprentices; this reflects the industry’s ongoing efforts to ’develop–their-own’ and build a sustainable pool of talent for the future.
► Women represent nearly a quarter of the total workforce compared to a national average of 47%. Evidence from the education sector suggests there is still some way to go to close the gender gaps, particularly in Physics and Engineering degree disciplines, and in the number of engineering apprentices.
► There is a re-balancing of contract personnel to permanent staff. The high cost of contract personnel was highlighted as an issue, in addition to a number of behavioural and knowledge retention challenges. This is driving a desire to reduce the number of contract personnel in roles that should typically be filled by permanent employees.
► With respect to current demand, Well Appraisal and Well Construction disciplines are currently experiencing low recruitment activity. By contrast, Operations and Maintenance disciplines are in highest demand, with over 30% of respondents stating they were recruiting within those disciplines currently.
► Whilst the scale of skills shortages is less pronounced than 12-18 months ago, in part due to the recent slowdown in activity, approximately 70% of respondents confirmed they are still experiencing difficulties in recruiting - in particular for senior-level positions within Technical Safety, Drilling, Geosciences, and Business Support services.
► We found that recruitment challenges are more prevalent for Aberdeen-based companies than in the rest of the UK; difficulties in the ability to recruit are fairly similar across both large organisations and SMEs.
There are some important trends impacting the future workforce profile:
► A number of factors drive the size and shape of the future workforce. These include trends in domestic capital expenditure, operational expenditure, exploration activity, and anticipated developments in decommissioning. Expansion into international markets and new technologies will also have an impact on the future workforce profile.
► Domestically, we estimate that the UKCS will experience a 9% contraction in overall workforce numbers between 2014 and 2019; this is primarily driven by a 50% anticipated decline in UK capital expenditure currently forecast by the Office for Budget Responsibility4. The decline in UK capital expenditure is likely to be partially offset by an expected 34% increase in decommissioning spend, together with growing demand for Enhanced Oil Recovery (EOR) skills. In addition, the digitalisation of oil fields and the potential development of onshore shale would open up new opportunities for talent development in the sector.
► The proportion of the workforce supporting overseas projects outside of the UKCS is likely to increase from 26% to 35% between 2014 and 2019, as global capital expenditure is forecast to rise. Over half of respondents said that their future skills demand will be driven by continued expansion into emerging markets, where UK talent is in high demand.
Looking ahead, estimates suggest remaining reserves within the UKCS could provide energy for at least another 35 years. Over the next five years, over 12,000 new entrants will be needed to play their part in sustaining the UK oil and gas industry’s ability to fulfill this potential.

Footnotes to be revised
Estimated overall workforce –
70%Proportion of respondents
experiencing someskills shortages
23%Proportion of
women vsnational average of 47%
13%Proportion ofover 55s vs
national average of 32%
55+86%
Proportion ofrespondents investing
in ‘developing their own’ in-house
26%Proportion of
workforce spending time on overseas activities
20%Proportion of contract personnel FTEs within
Tier 1 and supply chain
375,000
2014Disciplines in highest demand
Geosciences Drilling Technical /Process Safety
Operations &Maintenance
Business Support

The oil and gas industry is a valuable asset to the UK economy. It provides 1 in every 80 jobs in the UK, and has a strong reputation globally as a centre of excellence.
A significant contributor to the UK economyOver the past 50 years, almost 43bn5 barrels of oil have been extracted from the North Sea; in 2012 alone, UK oil and gas production provided for 67% of the UK’s oil demand and 53% of its gas demand6. In the UKCS, over 40 potential new developments as well as over 100 brownfield projects are currently being considered for investment7. The UK is the second largest oil and gas producer in Europe with the industry generating the largest gross value added of all the industrial sectors8. In 2013/14, it contributed £4.7bn in offshore corporation tax and petroleum revenue tax to the UK Exchequer9.
In addition, the UK oil and gas supply chain comprises over 1,500 companies that generated a turnover of more than £35bn in 201210. The UK has become a global centre of excellence for oil and gas with £14.8bn of export revenue delivered over the same period11. The UK oil and gas industry boosts the country’s trade balance by £30bn per year, which is approximately 27% of the UK’s total trade deficit9.
However, the UKCS is among the most expensive offshore basins globally, with development costs per barrel having risen fivefold over the last decade7. To minimise the impact on UK competitiveness, the UK Government has introduced a series of new field allowances9 - including one for High Pressure High Temperature Fields - to support continued development and investment in the sector.
Provider of 1 in every 80 jobs in the UKBased on the sample of respondents, we found that the industry currently supports 375,000 jobs, including 57,000 contract personnel12. The average salary in the industry is nearly £64,00013, which is equal to two-and-a-half times the national average of £26,50014.
In terms of new employment, the industry is a strong recruiter of graduates and apprentices15; it also has a track record of supporting retraining efforts using skills from other sectors, for example, the Armed Forces, ship building and downstream refining.
As the UKCS continues to mature, the industry will experience increased demand for skills and experience in relation to decommissioning projects, enhanced oil recovery techniques, and to some extent digital oil field management. On top of this, nascent industries in the UK such as shale will lead to new skills requirements and could act as potential competition for existing talent pools.
Furthermore, Tier 1 and supply chain companies face an increasingly challenging export market as the search for oil and gas focuses on hard to reach locations such as ultra-deep water. This trend supports the development of the UK oil and gas industry as a base for building specialist capabilities that can be exported to other regions globally; for example, the increasing demand for subsea experience and technology in key UK export markets.
1
Fuelling the next generation - A study of the UK upstream oil and gas workforce 8
The UK oil and gas labour market in context

Current labour market position2
Fuelling the next generation - A study of the UK upstream oil and gas workforce9
Overall workforce profileThe study found the UK upstream oil and gas industry supports a total workforce of 375,000, which includes jobs provided by Tier 1 companies and the supply chain, and induced activities16. In this section, we break down this total workforce number in more detail, and we analyse the current workforce from the following perspectives:
1. Demographic: Age, gender and employment status
2. Skills: An assessment of the current demand levels across 33 disciplines
Based on the sample of respondents, Figure 1 shows how the total workforce number of 375,000 breaks down into 281,000 jobs across Tier 1 and supply chain companies; a sizeable proportion (26%) of these jobs support overseas projects with the UK serving as one of the global hubs for the oil and gas supply chain.
A further 94,000 jobs are induced as a result of local activity generated by Tier 1 and supply chain companies.
Focusing on the combined Tier 1 and supply chain workforce number, Reservoirs is showing a higher proportion of activity linked to international activities, with 56% of employees supporting work on overseas projects, followed by Wells at 47% (Figure 2).
This reflects the increased growth in activity in markets outside of the UKCS; it also demonstrates demand for talent with experience of technically challenging plays as found in the UKCS, confirming the UK’s reputation as a global centre of excellence.
In terms of location, these jobs can be either based in the UK (as is the case for some of the activity within Reservoirs, e.g. reservoir simulation) or delivered by UK talent deployed locally to the field (e.g. drilling contractors).
Total = 375,000
Tier 1Supply ChainInduced
8%
67%
25%
Figure 1: Total oil and gas workforce breakdown
Source: EY, Oil and Gas Labour Model, 2014

10Fuelling the next generation - A study of the UK upstream oil and gas workforce
Export
Facilities Marine & Subsea
Reservoirs Support & Services
Wells
42%
58%
34%
66%
56%
44%
24%
76%
47%
53%
Source: EY, Oil and Gas Labour Model, 2014
Figure 2: Domestic/Export employees by sector %
Domestic

Footnotes to be revised
11 Fuelling the next generation - A study of the UK upstream oil and gas workforce

Fuelling the next generation - A study of the UK upstream oil and gas workforce 12
Under 25
25–35
36–45
46–55
Over 55
National Oil and Gas
14% 15%
17% 25%
16% 25%
21% 22%
32% 13%
Figure 3: % of workforce by age bracket - National average/oil and gas
Source: EY, Oil and Gas Labour Model, 2014; ONS, Labour Force Survey, 2014
Dispelling the ‘ageing workforce’ mythOne of the enduring perceptions of the industry is that of an ageing workforce and of a significant shortage of mid-career professionals. This viewpoint was reinforced in our interviews; the belief was the oil price collapse in the 1980s, followed by a sustained downturn in the 1990s, led to a period of reduced recruitment.
Figure 3 shows the industry has in fact a lower proportion of over-55s at just over 10% compared to a national average of 32%. In addition, the proportion of those aged 35 and below represents approximately 40% of the workforce compared to a national average of 31%.
The perceived gap at mid-career level also seems to be less significant than previously believed; we found there is a high proportion of mid-career professionals with nearly half of the workforce aged 36-55.
Under 25
25–35
36–45
46–55
Over 55
Tier 1 Supply Chain
7% 16%
25% 25%
26% 25%
27% 21%
15% 13%
Figure 4: % of workforce by age bracket - Tier 1/Supply chain
Source: EY, Oil and Gas Labour Model, 2014
Figure 4 highlights the difference between Tier 1 companies and the supply chain. The supply chain workforce shows twice as high a proportion of under 25s but a slightly lower proportion
of over 55s. In some cases, this is indicative of the supply chain acting as a ‘training ground’ for many graduates and apprentices.

Fuelling the next generation - A study of the UK upstream oil and gas workforce13
Figure 5: % of workforce by age bracket – Tier 1/Supply chain
Tier 1
Tier 1Non
-Tec
hnic
alTe
chni
cal
Facilities
Facilities
Marine & Subsea
Marine & Subsea
Reservoirs
Reservoirs
Support & Services
Support & Services
Wells
Wells
Over 45 45 and under
Figure 6: % of workforce by age bracket and technical and non-technical disciplines – Tier 1/Supply chain
44%
56%
27%
73%
43%
57%
43%
57%
13%
87%
27%
73%
49%
51%
37%
63%
22%
78%
9%
91%
43%
57%
33%
67%
Source: EY, Oil and Gas Labour Model, 2014
Source: EY, Oil and Gas Labour Model, 2014
Tier 1 Facilities Marine & Subsea
Reservoirs Support & Services
Wells
58%
42%
65%
35%
65%
35%
63%
37%
68% 67%
33%32%
Over 45 45 and under
Overall across the Tier 1 companies and the supply chain, there is broad consistency in terms of the proportion of employees over 45 (Figure 5).
Building a sustainable talent pool for the futureWe estimate there are 6,000 graduates and 13,000 apprentices currently employed in the sector. With 86% of participating organisations stating they have a formal structured programme
The age breakdown varies across technical and non-technical disciplines (Figure 6)17.
Within Marine & Subsea and Reservoirs, a higher proportion of technical roles are filled by those aged over 45 compared to
in place for graduates and/or apprentices, this reflects the industry’s ongoing efforts to ’develop–their-own’ and build a sustainable pool of talent for the future.
non-technical roles. Respondents indicated that the distinction in age profile reflects the greater degree of experience required for technical roles at the supervisory level.

14Fuelling the next generation - A study of the UK upstream oil and gas workforce
Over 45 45 and under
“The average age of our workforce is healthy in comparison to other industries - and it is getting younger”.
HR Director, Supply Chain Company
Over 45 45 and under

Fuelling the next generation - A study of the UK upstream oil and gas workforce15
Women represent nearly a quarter of the total workforceAt an aggregate level, women make up nearly a quarter of the workforce, compared to a national average of 47%18.
Whilst this represents a sizeable difference to the national average, it is comparable to other industries which require qualifications in Science, Technology, Engineering and Maths (STEM).
Figure 7 shows that only aerospace employs a smaller proportion of women than oil and gas. Pharmaceuticals, by contrast, has the largest proportion of women compared with other STEM industries.
Evidence from the education sector suggests there is still some way to go to close the gender gaps, particularly in Physics and Engineering degree disciplines, and in the number of engineering apprentices:
► ►Secondary education: The proportion of women studying A-level Chemistry, Further Maths and Physics in 2012 stood at 47%, 30% and 21% respectively15.
National average
Pharmaceutical Water Industry
Defence Construction Oil & Gas Aerospace
47%
53%
38%
62%
28%
72%
26%
74%
24%
76%
23%
77%
12%
88%
Figure 7: Proportion of women working across UK industries (%)
► ►University education: The proportion of women undergraduates studying Geology, Physics and Engineering in 2012 was 43%, 20% and 12% respectively15.
► ►Technical apprenticeships: In the 2011/12 academic year in England, 400 women started the engineering framework apprenticeship, representing 3% of the total intake19.
At a discipline level, results show there is a significant gender disparity between technical and non-technical roles (Figure 8). This is in line with the proportion of female engineers in the UK across all industries standing at 7%, the lowest proportion within Europe20.
When comparing Tier 1 companies with the supply chain (Figure 9), there are some clear differences; in particular, Facilities and Wells employ half the proportion of women compared to Tier 1 and other supply chain segments.
Source: EY analysis based on industry breakdowns provided by ONS, ARCOM, Aerospace Society, and Cogent. The Oil & Gas estimate is from EY, Oil and Gas Labour model, 2014.
23% The proportion of women in the oil & gas industry.
Source: EY, Oil and Gas Labour Model, 2014
Men Women

16Fuelling the next generation - A study of the UK upstream oil and gas workforce
87%
58%
13%
42%
Tech
nica
l
Figure 8: Gender split by Technical/Non-Technical Disciplines (%)
Source: EY, Oil and Gas Labour Model, 2014
Non
-Tec
hnic
al
Facilities Marine & Subsea
Reservoirs Support & Services
Wells
30% 15%36% 36% 31%
14%
Figure 9: Gender split by segment of total workforce (%)
70% 85% 64% 64% 69% 86%
Source: EY, Oil and Gas Labour Model, 2014
Tier 1
Men Women
Men Women

Fuelling the next generation - A study of the UK upstream oil and gas workforce17
Women in technical roles Women in non-technical roles
A number of trends may help rebalance the gender divide. For example, the use of digital technology, which enables companies to conduct exploration and production activities remotely using real time visualisation technologies, may boost the number of women in the industry; women are better represented within the technology space where 43% of Technology A-Level students are women20.
In addition to this, feedback from interviews highlighted an increase in demand for Health, Safety, Security and Environment (HSSE) management; this follows the 2010 Deepwater Horizon event in the Gulf of Mexico, which has led to industry and governments placing a renewed focus on HSSE. This provides a potential channel for increased participation of women in the industry as 36% of degree holders in Environmental Sciences in 2013 were women23.
There is considerable variation across segments in the proportion of women holding technical positions (Figure 10). In all but the Wells segment, a higher proportion of women work in non-technical disciplines than in technical disciplines.
Feedback from interviews suggests the lower ratio of women in technical disciplines within segments such as Marine & Subsea reflects wider barriers to attracting skilled women to the industry; these include challenging cultural environments and working practices that can restrict flexible working.
In addition, a recent study by Oil & Gas HR (OGHR) found only 11% of board seats in oil and gas companies were occupied by women21. This compares to women occupying nearly a fifth of executive and non-executive director roles across manufacturing firms in the FTSE 10022.
“We really struggle to persuade women with the required level of experience to apply for senior leadership positions in our organisation”.
HR Director, Supply Chain Company
Tier 1 Facilities Marine & Subsea
Reservoirs Support & Services
Wells
43% 38% 34% 36% 25% 65%
57% 62% 66% 64% 75% 35%
Figure 10: Proportion of women split by technical/non-technical discipline and by Tier 1/Supply chain (%)
Source: EY, Oil and Gas Labour Model, 2014

Footnotes to be revised
18Fuelling the next generation - A study of the UK upstream oil and gas workforce

Footnotes to be revised
19 Fuelling the next generation - A study of the UK upstream oil and gas workforce
Rebalancing of contract personnel vs. permanent staffThe survey found approximately 57,000 of FTEs employed in the sector are contract personnel (Figure 11). Contract personnel can bring significant immediate benefit to an organisation if used to address short term surges in demand or to plug specific skills gaps.
The high cost of contract personnel however was highlighted as an issue, in addition to a number of knowledge-related challenges - from ensuring an effective transfer of skills through to managing knowledge continuity during a project. Interview respondents also highlighted behavioural competencies as a pressing concern for the industry; although candidates may display the correct technical competencies, testing for the right cultural fit requires greater rigour in the recruitment process.
The challenges around contract personnel may represent a particular issue within the Facilities segment, which employs nearly half of the total contract personnel pool within the industry.
Feedback from interviews indicates there is a rebalancing effort from companies looking to reduce reliance on contract personnel. Some of the largest companies in the supply chain have reduced day rates to close the pay divide while some Tier 1 companies are maintaining day rates at current levels rather than agreeing to increases.
Furthermore both Tier 1 and supply chain companies interviewed expressed the desire to reduce the number of contract personnel in roles that should typically be filled by permanent employees.
Permanent staff Contract Staff
19%
45%
21%
20%80%
12% <2%<1%
Tier 1
Facilities
Marine & Subsea
Support & Services
Wells
Reservoirs
Figure 11: Permanent and contract staff as a proportion of total workforce – overall and contract staff by sector
“Getting people with the right attitude and qualities is the most important thing when we recruit, because everything else can be taught”.
Director, Supply Chain Company
Source: EY, Oil and Gas Labour Model, 2014

Footnotes to be revised
Fuelling the next generation - A study of the UK upstream oil and gas workforce 20
Assessment of current skills profile and demand
Figure 12 highlights that nearly half of the industry work in the following five disciplines: Operations, Business Support, Mechanical, Construction and Maintenance.
26,700
25,700
22,100
Operations
Business Support (Finance, HR, IT)
Mechanical
Construction and Installation
Maintenance
Drilling
Business Development/Commercial
Subsea/Pipelines
Marine/Naval
HSSE
Facilities Management (incl. Catering)
Piping
Production Management
Reservoir/Petroleum Engineering
Hydraulic
Instrumentation, Control & Automation
QA/QC
Logistics
Electrical
Contracts & Procurement
Cost Engineering/Estimating
Commissioning
Planning & Scheduling
Process Engineering (Chemical)
Process Safety/Technical Safety
Warehousing & Preservation
Geoscience
Data Management
Environmental Sciences
Well Appraisal
Well Intervention
Well Completions
Well Construction
14,100
12,400
12,000
11,700
11,300
10,700
9,300
8,600
8,300
7,400
5,500
5,300
5,200
5,100
4,400
4,000
3,900
2,500
2,100
4,300
3,900
3,600
2,200
1,500
1,400
1,300
1,200
600
500
Figure 12: Discipline breakdown Full Time Equivalents (FTE)
42,200
Source: EY, Oil & Gas Labour Model, 2014

Fuelling the next generation - A study of the UK upstream oil and gas workforce21
Two thirds of the industry currently work in technical disciplines (Figure 13). Areas with a particularly high concentration of their workforce in technical disciplines include Sea/air transport (90%) and Structure & topside design & fabrication (89%). Due to their reliance on technical skills which are sought after globally, these areas are likely to be strong contributors of export-led growth in the future.
Disciplines in demandWell Appraisal and Well Construction are experiencing low recruitment activity. This is in line with the slowdown in the level of drilling activity in the UKCS - 13 new exploration wells drilled year-to-date compared to 22 in 201224. By contrast, over 30% of respondents identified Operations and Maintenance as disciplines for which they are currently recruiting (Figure 14).
In addition, Operations and Maintenance spend is expected to increase 8% per year over the period 2012-1625. The ageing of assets is a key driver of demand, and more skilled staff are needed to support increased asset maintenance and integrity management activities. This covers a broad spectrum of the oil and gas workforce that serves live assets, e.g. technicians, welders and offshore superintendents.
Operations also encompasses tasks associated with the commissioning phase of project developments where the focus is primarily geared towards testing, inspection and start-up activities. Figure 15 confirms demand for Operations and Maintenance skills is a top priority for both Tier 1 and supply chain companies.
Technical
Non-Technical
34%66%
Figure 13: Technical vs. non-technical split
Source: EY, Oil & Gas Labour Model, 2014

Fuelling the next generation - A study of the UK upstream oil and gas workforce 22
37%
4% 4%2%
< 2% < 2%
31% 29%24% 22%
Five disciplines in highest demand
Five disciplines in lowest demand
Operations
Warehousing & Logistics
Maintenance
Reservoir/Petroleum Engineering
Business Support (Finance, HR,IT)
Commissioning
Business Development/Commercial
Well Appraisal
Mechanical
Well Construction
Figure 14: Response to question “Which disciplines are you currently recruiting for?” (% of companies)
Source: EY, Survey analysis, 2014
55%
32% 29% 29% 29%
36% 36%27%
Tier 1: Five disciplines in highest demand
Supply Chain: Five disciplines in highest demand
Operations
Operations
Maintenance
Maintenance
Drilling
Business Support (Finance,HR,IT)
Business Support (Finance, HR, IT)
Business Development /Commercial
HSSE
Mechanical
Figure 15: Response to question “Which disciplines are you currently recruiting for?” (% of companies, Tier 1 vs. Supply Chain)
27%
24%
Source: EY, Survey analysis, 2014

Fuelling the next generation - A study of the UK upstream oil and gas workforce23
Over 70% of companies indicated they are currently experiencing difficulties in recruiting (Figure 16), with little distinction reported between large companies and SMEs. However, from a geographical perspective, this type of issue is more prevalent in Aberdeen than the rest of the UK, with nearly three-quarters of Aberdeen-based companies reporting difficulties compared to approximately half of companies based elsewhere.
Looking across the supply chain, there are more noticeable differences, with Wells (63%) and Support & Services (75%) seemingly experiencing greater shortages than the rest of the industry.
NoYes
28% 72%
Tier 1
Facilities
Support & Services
Marine and Subsea
Wells
Reservoirs
55%
50%
75%
50%
63%
50%
Figure 16: Response to question “Are you currently experiencing a skills shortage?” (% of companies)
Source: EY, Survey analysis, 2014
When asked to reflect upon the reasons for shortages, respondents across the sample suggested the high level of activity over recent years had resulted in intense competition for talent.
However, they went on to comment that with activity and capital expenditure slowing down over the last 12-18 months and with increasing efforts to develop skills in-house, those shortages were currently related to very specific grades and roles – in particular shortages were seen at senior-level positions within Technical Safety, Drilling, Geosciences, and Business Support services.
“The most difficult people to recruit for are Technical Safety staff, particularly those at the Technical Authority level”.
HR Director, Supply Chain Company

Footnotes to be revised
24Fuelling the next generation - A study of the UK upstream oil and gas workforce

Estimated future labour market demand3
Future workforce profileA number of factors drive the size and shape of the future workforce. These include trends in domestic capital expenditure, operational expenditure, exploration activity, and anticipated developments in decommissioning. Expansion into international markets and new technologies will also have an impact on the future workforce profile.
We estimate that the overall workforce will experience a 9% contraction from 375,000 to 340,000 between 2014-2019, driven primarily by a significant decline forecast in UK capital expenditure. This could be partly offset by increased spending on decommissioning over this period and expansion into overseas markets, where the proportion of the UK supply chain workforce supporting overseas projects could account for 35% of activity (Figure 17).
Fuelling the next generation - A study of the UK upstream oil and gas workforce25
375,000
2014
358,000
2016
340,000
2019
Tier 1Supply Chain (domestic)Supply chain (export)Induced
Figure 17: Changing workforce profile - 2014-19
8%
41%
7%
38%
7%
33%
35%
25%
30%
25%
26%
25%
Source: EY, Oil & Gas Labour Model, 2014
“The growth in digital will help to draw more young people in to the industry”.
Director, Supply Chain Company

Impact on future demand For Tier 1 companies, the workforce profile will remain largely static with Operations, Business Support, Geoscience, Facilities Management and Production Management all continuing to occupy the top five disciplines in demand (Figure 18).
31%
12%10% 9%
7% 6%
11% 9%4% 4%
Tier 1: disciplines in highest demand in 2019 (% of total workforce)
Supply chain: disciplines in highest demand in 2019 (% of total workforce)
Operations
Operations
Business Support (Finance, HR, IT)
Mechanical
Facilities Management (incl. catering)
Business Support (Finance, HR, IT)
Geoscience
Construction & Installation
Production Management
Maintenance
Figure 18: Disciplines in highest demand in 2019
In line with the expected rise in domestic decommissioning activity, there will be growing demand in the supply chain for disciplines such as Mechanical and Construction & Installation (Figure 18). In addition, international expansion will drive the greatest increase in demand for Drilling (+7%), Marine/Naval (+6%), and HSSE (+3%) disciplines compared to 2014 levels.
Fuelling the next generation - A study of the UK upstream oil and gas workforce 26
Source: EY, Oil and Gas Labour Model, 2014

► Enhanced oil recovery – The Wood Report focused on maximising recovery from the UKCS. In line with this, some technically challenging fields (e.g. Clair Ridge, Magnus and Captain) are starting to use more complex EOR technologies such as low salinity water injection and miscible gas injection29. 21% of survey respondents cited a growing demand for these skills over the next two years. In turn, this will drive demand for well interventions and subsea disciplines.
► ►Digital oilfields – Digitalisation is applicable to both brownfield and greenfield sites30. This will mean an increased focus on technological skills, including the remote operation of vehicles and systems and the deployment of new data technologies to support remote environmental monitoring and a potential streamlining of operations through improved efficiency.
Beyond this, there may be an increase in onshore activity. A recent EY report, ‘Getting ready for UK Shale gas’ highlights the development of UK shale gas could represent a £33bn opportunity for the supply chain over 2016 - 2032 and support 64,500 jobs during peak years (2024-26)31. In 2019, shale exploration and development activity could be supporting up to 21,000 jobs.
The core skills required for onshore shale development include Drilling (in particular horizontal drilling), Well completions, Hydraulic Fracturing, Reservoir and Petroleum Engineering, and Geosciences (including environmental consultants). Supporting roles within Operations, Construction, and Business Support will also be in demand.
In addition to the onshore shale sector, the British Geological Survey has estimated the UK’s total offshore shale gas resources could be between five and ten times the size of the resources available onshore32. Initial exploration activity is currently under way in the Irish Sea in the Morecambe Bay area.
An evolving domestic activityCapital expenditure is set to decline to £7.9bn in 2018-19 from a 2013-14 peak of £14.4bn4 (Figure 19). Factors driving this change include the maturing of UKCS fields resulting in declining production rates since 2000 and significant industry cost inflation; they also reflect the greater technical challenges associated with new smaller fields and more complex environments such as ultra-deep water or high pressure, high temperature reservoirs.
In the near-term, expenditure is expected to be directed primarily to development wells, topside equipment and subsea systems for new field developments; incremental investment on existing fields will also be important26.
Over the same period, operational expenditure is expected to remain broadly unchanged, with increased expenditure on ageing infrastructure likely to be offset by fewer live operational assets.
The UKCS has seen limited decommissioning activity to date, explained in part by high oil prices and improvements in technology, which have extended the life of certain fields. The majority of decommissioning activity thus far has been in well plugging and abandonment, and it is forecast to remain the largest activity component going forward.
Between 2014-2019, the total amount spent in 2019 compared to 2014 on decommissioning projects will increase by 34%, amounting to a cumulative total of £8bn27. Plugging and abandonment will affect 87 wells per year over the period; there will also be increased demand for topside removals with over 50 structures per year needing to be displaced equating in weight to 146,000 tonnes28.
These changes in domestic activity could impact the demand for skills as follows:
► ►Decommissioning – Respondents highlighted that the demand for decommissioning skills could be partly met by substitution from the existing workforce. 33% of survey respondents said an increase in decommissioning activity would drive skills demand over the coming years.
2014 2015 2016 2017 2018 2019
14
12
10
8
6
4
2
0
Capital Expenditure Operational Expenditure Exploration Decommissioning
Figure 19: UKCS activity drivers (annual spend, £ billions)
£bn
Fuelling the next generation - A study of the UK upstream oil and gas workforce27
Source: Office for Budget Responsibility, Economic and Fiscal Outlook, March 2014
Footnotes to be revised
28Fuelling the next generation - A study of the UK upstream oil and gas workforce
“Decommissioning is increasingly on our radar. We are now actively planning for it, so we’re able to provide services across the full lifecycle of a project”.
HR Manager, Supply Chain Company

Footnotes to be revised
29 Fuelling the next generation - A study of the UK upstream oil and gas workforce
“Increasingly our focus is on overseas client demand with the majority of our UK workforce now serving international clients”.
Regional Director, Global Supply Chain Company

Footnotes to be revised
Growing expansion into emerging markets Global oil and gas trends will have an impact on the size of the UK export market. EY’s 2014 Economic Contribution report highlights that the export market for supply chain companies is £14.8bn, up from £10.3bn in 200810.
In addition, 51% of survey respondents said their future skills demand will be driven by continued expansion into emerging markets (e.g. West Africa, Brazil).
Recently, growth in foreign markets has provided opportunities for growing export sales for the UK supply chain. Globally, capital expenditure is forecast to rise significantly between 2014 and 2019, especially in key international markets such as West
Africa (Figure 20), where support required from the UK oil and gas workforce may double from 16% in 2014 to 32% in 2019 (Figure 21).
New local content legislation in countries such as Nigeria and Ghana may start to impact the extent to which resource based outside of these countries’ domestic markets can deliver services, both in-country and elsewhere. Feedback from the interviews suggests UK companies will retain a competitive advantage for some time in disciplines such as Subsea, Geosciences and Petroleum Engineering, which are in high demand internationally.
Figure 21: Export trends – key current vs future regional market shares of UK exports
35%
2014 2016 2019
31% 32%
9%11%
32%
16%
12%
12%
26%
19%
17%
14%
16%
18%
North America Western Europe Asia Pacific Africa Other
Figure 20: Capital expenditure trends by region (annual spend, index 2014=100)
350
300
250
200
150
100
0
North America Western Europe Asia Pacific AfricaOther
2014 2015 2016 2017 2018 2019
Fuelling the next generation - A study of the UK upstream oil and gas workforce 30
Source: Scottish Enterprise, Spends & Trends 2009-2017; EY analysis
Source: Scottish Enterprise, Spends & Trends 2009-2017; Scottish Enterprise, Survey of International Activity 2012—2013; EY analysis

4Looking ahead
31 Fuelling the next generation - A study of the UK upstream oil and gas workforce
Figure 22: Future workforce supply requirements
290,000
280,000
270,000
260,000
250,000
0
281,000 38,000
12,000 255,000
Current workforce (Tier 1 and supply chain)
Expected retirees Opportunity for new entrants
Future workforce requirement (Tier 1 and supply chain)
Source: EY analysis
Sustaining the UK oil and gas sectorRecent estimates put remaining reserves between 15-24bn barrels5, providing energy to the UK for at least another 35 years. Looking to the future, once the recommendations from the Wood Review are implemented, the oil and gas industry could contribute an additional £200bn to the UK economy over the next 20 years5.
The UK oil and gas industry must continue to invest in talent to support the development of the significant potential from estimated remaining reserves. Hence, there is a need to understand the impact of people expected to retire over that period, and whether there is a sufficient talent pool coming through to counter-balance the impact of retirees.
The combined workforce for Tier 1 and the supply chain represents 281,000 FTEs (out of the 375,000 total). We estimate that this number will reduce to 255,000 by 2019.
We expect around 38,000 FTEs within the combined Tier 1 and supply chain workforce to retire over the period; this assumes the average age of retirement in the oil and gas industry is in line with the national average of 64.6 years for men and 61.2 years for women33. As previously mentioned, the anticipated decline in UK capital expenditure over the next five years is expected to translate into an overall workforce reduction of 9%. For Tier 1 and the supply chain, this equates to a combined decline of 26,000 FTEs.
Considering this, we estimate this opens up opportunities for over 12,000 new entrants (Figure 22) to join the upstream UKCS workforce over 2014-2019. With the recent fall in oil price to under $80 a barrel placing renewed focus on operational effectiveness and cost reduction, this talent pool will be key to unlocking the sector’s ability to delivering sustainable value for the UK economy.

73%Average forecast
increase in global capital expenditure between
2014-2019
>50%Proportion of
respondents citinggrowth in emerging markets as driving
demand
21%Proportion of
respondents citing future demand for Enhanced Oil
Recovery skills
35%Proportion of
workforce spending time on overseas activities
12,000Estimated number ofnew entrants required
for UKCS upstream
£
34%Forecast increase in
UKCS decommissioning spend
Estimated overall workforce – 340,000
Drilling Marine/Naval HSSE
2019Top three growth disciplines

33 Fuelling the next generation - A study of the UK upstream oil and gas workforce

Fuelling the next generation - A study of the UK upstream oil and gas workforce 34
Appendices

ApproachEY’s approach is summarised in Table 1 above.
Sample definitionsThis study builds on the findings from EY’s “UK Upstream oil and gas supply chain: economic contribution” report published in April 2014. A sample of 288 companies was selected covering Exploration and Production companies (defined as Tier 1) and five supply chain segments, split into 31 sub-sectors.
Table 2 provides more detailed information on the sub-sector classification used.
With regards to the supply chain companies included in the sample considered here, they meet the same selection criteria as used in the aforementioned report, i.e. they are registered in the UK and have filed 2012 accounts with Companies House.
Table 1: Overview of approach
In addition, as it is not possible to accurately extract the portion of financial information relating to the upstream oil and gas sector from each company’s annual financial statements, the supply chain companies included are subject to the threshold that at least 50% of a company’s turnover is required to be generated in the upstream oil and gas sector.
Although this will overstate the financial information for companies which are not 100% engaged in oil and gas, it excludes those companies that do not have the majority of their business in the sector. As a result, the estimated total workforce numbers outlined in this report may be understated compared to other published estimates.
Fuelling the next generation - A study of the UK upstream oil and gas workforce35
Appendix A: Methodology
Our approach
Research preparation
Conducted industry research to:
► Identify range of skills types
► Develop hypotheses and drivers of future demand
► Identify trends affecting future Oil and Gas skills requirements
Data Gathering ► Defined representatives sample based on company size (revenue, headcount)
► Conducted in-depth interviews with 55 companies in the industry (from the defined sample as well as educational institutions and recruitment agencies)
► Developed and issued online questionnaire to sample companies
► Conducted secondary research activities, consulting nearly 60 different sources, to provide additional context and validation of results
Data Analysis ► Reviewed questionnaire results and extrapolated data as needed at sub-sector and segment level
► Developed forecasting model over five years (2014-2019) to estimate future demand for specific skills
► Tested findings against input from interviews and secondary research
Report Development
► Validated or disproved initial hypotheses
► Tested findings with key stakeholders - Oil and Gas UK, OPITO, the Department for Business, Innovation and Skills and industry champions

Facilities ► Engineering support contractors
► Engineering, operation, maintenance and decommissioning contractors
► Inspection services
► Machinery/plant design and manufacture
► Specialist engineering services
► Specialist steels and tubulars
► Structure and topside design and fabrication
Marine & Subsea ► Floating production storage units
► Marine/subsea contractors
► Marine/subsea equipment
► Pipe lay/heavy lift contractors
► Subsea inspection services
► Subsea manifold/riser design and manufacture
Reservoirs ► Data interpretation consultancies
► Geosciences consultancies
► Seismic data acquisition and processing contractors
► Seismic Instrumentation
Wells ► Drilling and well equipment design
and manufacture
► Drilling contractors
► Laboratory services
► Well engineering consultancies
► Well services contractors
Support & Services ► Catering/facility management
► Communications
► Energy consultancies
► Health, safety and environmental services
► IT Hardware/software
► Sea/air transport
► Training
► Warehousing/logistics
Tier 1 ► Integrated Majors
► Large/small Independents
► Energy Utility Companies
► Non-Operating Companies
► Exploration Companies
Table 2: Oil and gas industry Tier 1 and supply chain mapping
36Fuelling the next generation - A study of the UK upstream oil and gas workforce

Defining job disciplinesSources used to define the job disciplines listed in Table 3 and in the online survey questionnaire included:
► The Hays Salary Guide 201334
► The Mercer Job Families used in the bi-annual UK Oil and Gas Exploration & Production Survey35
► OilCareers.Com Job Directory36
The 33 job disciplines considered in this study cover both technical and non-technical work. A definition of technical and non-technical disciplines can be found in the Glossary.
Data Gathering In-depth interviews were conducted with over 50 organisations from the defined Tier 1 and supply chain sample, covering 18 supply chain sub-sectors, as well as 5 educational institutions and recruitment agencies.
The interviews were supplemented by data from 50 online questionnaires covering Tier 1 and 20 supply chain sub-sectors to provide a snapshot of current trends and validate future demand requirements.
Of these companies, 59% are classified as large companies (based on headcount) and 41% are SMEs across both Tier 1 and the supply chain. Furthermore, the split of respondents between companies based in Aberdeen and other regions is 41% and 59% respectively.
Respondents within the supply chain represented 29% of oil and gas supply chain revenue. Tier 1 companies accounted for approximately 62% of annual North Sea oil and gas production revenues in 2013/143.
In addition to primary data, this report draws on a number of reports and data sources to inform the creation of the initial hypotheses, the development of the online questionnaire and validation of report findings. A detailed bibilography can be found in Appendix C.
Data AnalysisIn order to determine the overall oil and gas workforce number and skills requirements, the following methods have been applied in the demand forecasting model.
► ►Response data for each supply chain sub-sector and Tier 1 have been extrapolated based on the ratio of turnover of respondents to the turnover of the sub-sector.
► ►For sub-sectors where there is insufficient data, an extrapolation has been conducted on the workforce profile of the relevant segment, as sub-sectors within a given supply chain segment are assumed to have similar characteristics (e.g. gender balance, job type mix).
1 Business Development / Commercial
2 Commissioning
3 Construction & Installation
4 Contracts & Procurement
5 Cost Engineering / Estimating
6 Data Management
7 Drilling
8 Electrical
9 Environmental Sciences
10 Geoscience
11 HSSE
12 Hydraulic
13 Instrumentation, Control & Automation
14 Logistics
15 Maintenance
16 Marine / Naval
17 Mechanical
18 Operations
19 Piping
20 Planning & Scheduling
21 Process Engineering (Chemical)
22 Process Safety / Technical Safety
23 Production Management
24 Reservoir / Petroleum Engineering
25 QA / QC
26 Subsea / Pipelines
27 Warehousing & Logistics
28 Well Appraisal
29 Well Construction
30 Well Completions
31 Well Intervention
32 Facilities Management (incl. Catering)
33 Business Support (Finance, HR, IT)
Table 3: Job Disciplines
Fuelling the next generation - A study of the UK upstream oil and gas workforce37

Footnotes to be revised
The total workforce numbers produced in this report are therefore a composite of both response data and extrapolation.
In order to estimate future demand to 2019, a selection of drivers has been used. These have been applied to each sub-sector with appropriate weightings, given the nature of that sub-sector.
To calculate the proportion of workforce in each sub-sector oriented towards export services, the revenue split between domestic and export has been assumed to be a proxy for workforce split.
We have then used the Oil & Gas UK multiplier of 25% to estimate the proportion of induced FTEs.
Different drivers have been applied to the domestic and export workforce to calculate future demand. International drivers used pertain specifically to key North Sea export regions. The drivers used in the model are as follows:
► ►UKCS / International Operational Expenditure, Office for Budget Responsibility
► UKCS / International Capital Expenditure, Office for Budget Responsibility
► UKCS / International Productivity, Office for Budget Responsibility
► UKCS Exploration Expenditure, Office for Budget Responsibility
► UKCS Offshore Well Production, Spears and Associates
► UKCS Wells Drilled Offshore (Footage), Spears and Associates
38Fuelling the next generation - A study of the UK upstream oil and gas workforce

1 Response data for each supply chain sub-sector and Tier 1 have been extrapolated based on the ratio of turnover of respondents to the turnover of the sub-sector. For sub-sectors where there is insufficient data, an extrapolation has been conducted on the workforce profile of the relevant segment, as sub-sectors within a given supply chain segment are assumed to have similar characteristics (e.g. gender balance, job type mix).
2 With regards to the supply chain companies included in the sample considered here, they meet the same selection criteria as used in EY’s “UK Upstream oil and gas supply chain: economic contribution” report published in April 2014, i.e. they are registered in the UK and have filed 2012 accounts with Companies House. In addition, as it is not possible to accurately extract the portion of financial information relating to the upstream oil and gas sector from each company’s annual financial statements, the supply chain companies included are subject to the threshold that at least 50% of a company’s turnover is required to be generated in the upstream oil and gas sector. Although this will overstate the financial information for companies that are not 100% engaged in the sector, it excludes those companies that do not have the majority of their business in the sector. As a result, the estimated total workforce numbers outlined in this report may be understated compared to other published estimates.
3 Based on DECC UK Production Data from Oil and Associated Gas volumes published in October 2014 for the period July 2013-June 2014.
4 Office for Budget Responsibility, Economic and Fiscal Outlook, March 2014
5 Sir Ian Wood, UKCS Maximising Recovery Review: Final Report, 2014
6 DECC, Energy Trends, 2013
7 Oil & Gas UK: Activity Survey 2014
8 House of Lords Economic Affairs Committee – Economic Implications for the United Kingdom of Scottish Independence (Appendix 5)
9 HM Treasury Budget 2014, 19th March 2014
10 EY, UK upstream oil and gas supply chain: Economic contribution, 2014
11 Oil & Gas UK, Economic Report, 2014 & ONS trade report
12 EY, Oil and gas labour market Model, 2014
13 Aberdeen & Grampian Chamber of Commerce, Oil & Gas Survey, 2012
14 Annual Hours and Earnings Survey, Office of National Statistics, 2012
15 Engineering UK, The State of Engineering, 2013
16 Induced jobs refer to employment created in sectors outside the oil and gas industry within local economies (e.g. hospitality and leisure) as a result of industry presence in the region.
17 Technical roles are defined as those where a formal engineering or sciences degree qualification is required and relevant industry experience may be needed.
18 Office of National Statistics, Full Report: Women in the Labour Market, 2013
19 Department for Business, Innovation and Skills, Professor John Perkins: Review of Engineering Skills, 2013
20 The Guardian, British Engineering Needs More Women, 2014
21 OGHR, Diversity in the oil and gas industry: Empowering Women Leaders, 2014
22 FTSE 100 – Women in Manufacturing, EEF, 2014
Appendix B: Footnotes
Fuelling the next generation - A study of the UK upstream oil and gas workforce39

23 Office of National Statistics, Full Report - Graduates in the UK Labour Market, 2013
24 https://www.gov.uk/oil-and-gas-wells#drilling-activity
25 Douglas Westwood, Maintenance Market Forecast, 2012
26 Scottish Enterprise, Spend & Trends UKCS, 2012-2016
27 Office for Budget Resonsibility, Economic and Fiscal Outlook, 2013
28 Oil & Gas UK - Decommissioning Insight 2014
29 Process Engineering, Regulator to speed oil recovery, 2014 - http://processengineering.theengineer.co.uk/oil-and-gas/regulator-to-speed-oil-recovery/1018886.article
30 Oxford Economics, US Oil & Gas Outlook, 2012
31 EY, Getting Ready for UK Shale Gas, 2014
32 Shale Energy Insider, 2014
33 ONS: Pension Trends, Chapter 4: The Labour Market and Retirement, 2013 edition
34 http://hays.clikpages.co.uk/Oil_and_Gas_Salary_Guide_2013/
35 http://www.imercer.com/uploads/Europe/pdfs/e_p_functions.pdf
36 http://www.oilcareers.com/content/jobsearch/job_directory.asp
40Fuelling the next generation - A study of the UK upstream oil and gas workforce

Oil and gas activity/expenditure forecasts
1 Barclays Equity Research, E&P Spending Outlook, 2014
2 Barclays, The North Sea: vital to the future of the oil and gas industry, August 2013
3 GE Oil & Gas, Maximizing Value Creation in a Challenging Oil and Gas Scenario, February 2014
4 IHS, Global Offshore Drilling Rig Market Analysis and Outlook, May 2012
5 OECD, Productivity Dataset, 2013
6 Office for Budget Responsibility, Economic and fiscal outlook, March 2013
7 ONS, Labour Productivity Release, 2013
8 Petrofac, Capital Markets Day, December 2013
9 Scottish Enterprise, Spends & Trends 2008-2017: Key Global Oil & Gas Markets
10 Scottish Enterprise, Spends & Trends: UKCS 2012-2016
11 Scottish Enterprise, Survey of International Activity in the Oil and Gas Sector 2011-2012
Labour market data
12 EY, UK upstream oil and gas supply chain: Economic contribution, 2014
13 Hays, Oil and Gas Global Salary Guide, 2013
14 Institute of Chemical Engineering, Biennial Salary Survey, 2014
15 NES Global Talent, Attracting and retaining women in Oil and Gas engineering: A survey examining the gender talent gap, 2014
16 Office of National Statistics, Full Report: Women in the Labour Market, 2013
17 Oil and Gas Survey, Aberdeen & Grampian Chamber of Commerce, June 2014
18 Oil and Gas UK, UK Continental Shelf Offshore Workforce Demographics Report, 2014
19 ONS, Annual Survey of Hours and Earnings, 2009-13
20 OPITO, Labour Market Intelligence Survey 2011
General
21 Aberdeen & Grampian Chamber of Commerce, Oil and Gas Survey, 2013
22 Bain & Company, Flexible work models: How to bring sustainability to the world 24/7, October 2010
23 Brock N Meeks, Crucial Skills Gap Puts Oil & Gas Industry in Bind, 2014
24 Centrica, Innovation in Flexible Working, February 2009
25 CIPD, Managing an aging workforce: the role of total reward, 2008
26 DECC, Energy Trends, 2013
27 DECC, Fossil Fuel Price Projections, July 2013
28 Department for Business, Innovation and Skills, Professor John Perkins: Review of Engineering Skills, 2013
Appendix C: Bibliography
Fuelling the next generation - A study of the UK upstream oil and gas workforce41

General
29 Department of Media, Culture and Sport, Secondary Analysis of the Gender Pay Gap, 2013
30 Engineering UK, State of Engineering, 2013
31 EP Magazine, Subsea Sector is Set for Growth, 2013
32 EY Report, Global Mobility-Driving Chevron’s Success in Angola, 2013
33 EY Report, Overview of our Oil & Gas Lean Process Improvement Capability, 2013
34 EY Report, The role of business to direct and channel appropriate infrastructure development in support of growth in Oil & Gas industry, 2013
35 EY Report, Getting ready for shale gas, 2014
36 EY, UK Oilfield Services Database
37 Financial Times, Aberdeen: The city outpacing even London’s property boom, 2014
38 Harvard Business Review, Who Can Fix the Middle Skills Gap? 2012
39 Offshore Magazine, Collaborative research assesses future needs of UK decommissioning sector, 2013
40 KCA Deutag, Innovative KCA Deutag training services unveiled at new RGU Energy Centre
41 McKinsey and Company, The Future of the North Sea, 2014
42 OGHR, Diversity in the Oil & Gas industry: Empowering Women Leaders, 2014
43 Oxford Economics, US Oil and Gas Outlook, 2012
44 Schlumberger Business Consulting, The Strategic Importance of Talent
45 Schlumberger Business Consulting, Oil & Gas HR Benchmark, 2011
46 Sir Ian Wood, UKCS Maximising Recovery Review: Final Report, 2014
47 Society of Petroleum Engineers, Global Oil and Gas Training and Development Report, 2013
48 The Guardian, British Engineering Needs More Women, 2014
49 UK Government, Recovery Boost for North Sea oil and gas through the 28th licensing round, 2014
50 Harvard Business Review, Balancing Act: How to Capture Knowledge Without Killing It, May-June 2000
51 Executive Secretary Magazine, Help From the Trenches: Where Great Ideas Are Born, July 2011
52 Parc, Harnessing Communal Expertise: Sharing to Enhance Services
53 NISC, Good Practice Workforce Strategies, April 2008
54 Douglas Westwood, Maintenance Market Forecast, 2012
55 Shale Energy Insider, 2014
56 Office of National Statistics, Pension Trends, 2013
Fuelling the next generation - A study of the UK upstream oil and gas workforce 42

Fuelling the next generation - A study of the UK upstream oil and gas workforce43
GlossaryCapital Expenditure Funds used by operators to develop fields by designing and constructing fixed assets
such as offshore platforms, drilling rigs and topside equipment.
Decommissioning The process for removal of an offshore facility from an operational state once a field ceases production. This involves plugging and abandonment of wells and removal of topsides and subsea facilities.
Engineer & Technician Engineers are degree qualified professionals who are primarily focused on the design of production facilities in the industry. Technicians have vocational qualifications which are used in maintaining and operating existing assets.
Enhanced Oil Recovery (EOR) The process whereby oil is recovered other than by the natural pressure in a reservoir. The process typically involves injecting a liquid such as water or gas such as nitrogen or carbon dioxide to increase the amount of oil recovered from the well.
Horizontal Drilling The process of drilling along a horizontal track which enables draining gas from a geographical area that is much larger than a single vertical well in the same rock formation. This technique has expanded the ability of operators to profitably recover natural gas from reservoir basins.
FTE Stands for Full-Time Equivalent. It is a ratio of the total number of paid hours during a period (part time, full time, contracted) by the number of working hours in that period. One FTE is equivalent to one employee working full-time.
Hydraulic Fracturing Once a shale gas well is drilled it is fractured in order to release the gas. This means pumping fluids into the well at high pressures in order to fracture the shale rock. A propping agent, such as silica sand is then used to allow fractures to remain open.
Induced Workforce Employment created in sectors outside the Oil & Gas industry within local economies (e.g. hospitality and leisure) as a result of industry presence in the region.
Local Content The development of skills, capability and legislation to build a competitive domestic supplier base to serve a local market.
Mid-career Mid-career professionals in the Oil & Gas sector are those with typically 8-15 years of experience who possess technical proficiency and industry expertise.
Non-Technical Disciplines Roles or disciplines which do not require a formal technical qualification and/or industry experience. These are typified as roles with skills transferable across industries (e.g. administrative, sales, back-office support services).

44Fuelling the next generation - A study of the UK upstream oil and gas workforce
Oil Field Digitalisation An industry trend which involves harnessing high speed data communications systems to deploy digital and data management technologies; it enhances the spectrum of oil and gas operations from exploration and production to remote environmental monitoring.
Operational Expenditure Expenditure by operators primarily on operations, modifications and maintenance of existing live assets.
Shale Gas A hydrocarbon formed in impermeable rock which can be rich in oil and gas. The UK onshore shale industry is still in its infancy with exploration focussed in the Bowland and Weald Basins. The offshore shale industry is still in very early stages of development in the Irish Sea.
SME Stands for Small- and Medium-sized Enterprise. Headcount is 250 or less.
STEM Stands for Science, Technology, Engineering and Maths qualifications.
Technical Disciplines Roles or disciplines where a formal and relevant technical qualification and/or industry experience is required.
UKCS United Kingdom Continental Shelf; the body of water surrounding the UK, in which the country claims mineral rights, principally referring to the North Sea.

Authors
Marketing enquiries: Media enquiries:
Acknowledgements
EY would like to recognise and thank the organisations who have contributed their time to share their experiences and perspectives with us over the course of writing this report. These include ABB, Advanced Resource Managers, Alta Blue, Aker Solutions UK, AMEC Group, APSCo, Aramark, AVEVA Solutions, Bluewater Manning Services, BP Exploration Operating Company, Burntisland Fabrications, Centrica Energy, CNR International (U.K.), ConocoPhillips UK, Costain Upstream, Dolphin Drilling, Enermech, EnQuest, Exova, Expro North Sea, GDF SUEZ E&P UK, Genesis, GE Oil and Gas, Gulfmark, KCA Deutag Drilling, Kongsberg Maritime, Maersk Oil UK, McGregor Consultants, NES Global Talent, Oceaneering, OGN North Sea, The Parkmead Group, Petrofac, Offshore Projects & Operations, Premier Oil, Proserv, Centre for International Labour Market Studies at Robert Gordon University, Schlumberger, Score Group (Europe), Scopus Engineering, Shell, Sodexo, Statoil Production (UK), Stork Technical Services, Swire Oilfield Services, TAQA, Technip (UK), Total E&P UK, Transocean, Tullow Oil plc, University of Surrey.
Fuelling the next generation - A study of the UK upstream oil and gas workforce45
Chris Lewis Partner – Energy Advisory T – 44 20 7951 5085 E – [email protected]
Andrew Deane Director – Energy Advisory T – 44 7976 296751 E – [email protected]
Julie Speirs Senior Manager – Energy Advisory T – 44 20 7951 3712 E – [email protected]
Jill Simpson Marketing Manager [email protected] 44 1224 653004
Ross Nisbet Media Relations Manager [email protected] 44 131 777 2810

For further information
ey.com/uk/oilandgas EY Energy Hub: ey.com/uk/energy
Follow us on twitter: @ey_uk_energy @EY_OilGas
Fuelling the next generation - A study of the UK upstream oil and gas workforce 46
EY energy insights
Getting ready for UK shale gas
This study, commissioned by UKOOG identifies supply chain or skills blockages that will prevent the UK realising shale gas’s economic potential.
Powering the UK 2014
Commissioned by Energy UK, this report considers the energy sector’s economic contribution to the UK economy through job creation both directly and through the supply chain.
The UK upstream oil and gas supply chain: Economic Contribution
This report quantifies the economic contribution of the upstream oil and gas supply chain to the UK economy, showing key findings across turnover growth, cost pressures and actions needed to maintain margins.
Spotlight on megaprojects
The report examines megaproject development trends, analyses project performance and investigates the reasons why project performance can be poor.
UK upstream oil and gas supply chain: Market intelligence
This report considers three key sub-sectors within the UK upstream oil and gas supply chain, providing additional information on the size and composition of the sub sectors and the future demand for products and services.
Commissioned by Oil & Gas UK with support from Department for Business Innovation and Skills, the Department for Energy and Climate Change and the Scottish Government, we’ve created two reports that consider the UK offshore supply chain, the value it creates for the economy and the value of its exports globally. The reports are split into two parts — Economic contribution and Market intelligence.

EY | Assurance | Tax | Transactions | Advisory
About EYEY is a global leader in assurance, tax, transaction and advisory services. The insights and quality services we deliver help build trust and confidence in the capital markets and in economies the world over. We develop outstanding leaders who team to deliver on our promises to all of our stakeholders. In so doing, we play a critical role in building a better working world for our people, for our clients and for our communities.
EY refers to the global organization, and may refer to one or more, of the member firms of Ernst & Young Global Limited, each of which is a separate legal entity. Ernst & Young Global Limited, a UK company limited by guarantee, does not provide services to clients. For more information about our organization, please visit ey.com.
Ernst & Young LLPThe UK firm Ernst & Young LLP is a limited liability partnership registered in England and Wales with registered number OC300001 and is a member firm of Ernst & Young Global Limited.
Ernst & Young LLP, 1 More London Place, London, SE1 2AF.
© 2014 Ernst & Young LLP. Published in the UK. All Rights Reserved.
EYG No. DW04581490280.indd (UK) 12/14. Artwork by Creative Services Group Design. ED None.
In line with EY’s commitment to minimise its impact on the environment, this document has been printed on paper with a high recycled content.
Information in this publication is intended to provide only a general outline of the subjects covered. It should neither be regarded as comprehensive nor sufficient for making decisions, nor should it be used in place of professional advice. Ernst & Young LLP accepts no responsibility for any loss arising from any action taken or not taken by anyone using this material.
The views of third parties set out in this publication are not necessarily the views of the global EY organization or its member firms. Moreover, they should be seen in the context of the time they were made.
ey.com/uk/oilandgas