Fuel Processing Technology - umexpert.um.edu.my Simulation of fatty acid methyl ester production in...
13
3D Simulation of fatty acid methyl ester production in a packed membrane reactor Baharak Sajjadi a , Abdul Aziz Abdul Raman a, ⁎, Saeid Baroutian b , Shaliza Ibrahim c , Raja Shazrin Shah Raja Ehsan Shah a a Department of Chemical Engineering, Faculty of Engineering, University of Malaya, 50603 Kuala Lumpur, Malaysia b SCION, Te Papa Tipu Innovation Park, 49 Sala Street, Private Bag 3020, Rotorua, New Zealand c Department of Civil Engineering, Faculty of Engineering, University of Malaya, 50603 Kuala Lumpur, Malaysia abstract article info Article history: Received 5 February 2013 Received in revised form 20 July 2013 Accepted 20 July 2013 Available online 7 September 2013 Keywords: Transesterification Biodiesel Membrane reactor Computational Fluid Dynamics (CFD) The current work is aimed to simulate the production of high quality fatty acid methyl ester (biodiesel) production from palm oil in a micro porous ceramic membrane reactor. The TiO 2 /Al 2 O 3 ceramic membrane was used as the separator and catalytic bed. It was packed with potassium hydroxide catalyst supported on palm shell activated carbon. The investigation of component distribution within the system was not possible. Hence CFD analysis was used to predict the distribution of the fatty acid methyl ester and the other by-products in the membrane module. The Brinkman equation was used to simulate fluid flow within the porous media. In addition, the Maxwell–Stefan equation was applied for simulation of reaction kinetics and mass transfer. The combination of the mentioned models was solved mathematically by means of the finite element method and PARDISO algorithm. In addition, the effect of temperature on transesterification reaction has been examined. The CFD results were indicated that increasing the reaction temperature leads to the same conversion in shorter time, or increase in temperature by 10 °C, results in 5% growth of reaction for the same time period. The molar concentrations of each component are also shown in the total system for 85 s and 400 s. As we see from the diagrams, the simulated liquid velocity within the system reaches agreement with experimental results at 8.1% deviation and 0.61% overestimation in the reaction part. © 2013 Elsevier B.V. All rights reserved. 1. Introduction The necessity to replace conventional fossil fuels with an environ- mental friendly substitute to fulfil the increasing energy demand has been a great concern in this century [1,2]. Reserves have been cited to last only for another 50 years at the current consumption rate of crude oil [3]. Biodiesel (fatty acid alkyl esters) is one of the most promising alternative fuels. It is now recognised as “green fuel” and brings several advantages over conventional fossil fuels. It is biodegrad- able, renewable, non-toxic and has very similar properties to diesel fuel [4]. Biodiesel is the only alternative fuel that can be used directly in any existing, unmodified diesel engine as it has similar properties to petroleum diesel. Furthermore biodiesel can be blended in any ratio with petroleum diesel [5–7]. Biodiesel can be produced using homoge- neous, heterogeneous or biocatalysts. Generally, transesterification of triglycerides using homogeneous catalysts is the most preferable processing technique. This method contains three steps to exchange the alkoxy group of an alcohol with the alkoxy group of an ester compound. However, this technique suffers from high cost for purification and wastewater treatment [8]. Although enzymatic catalysts give high conversion rate and are very selective, they are unstable and very ex- pensive [9]. Heterogeneous acid-catalysed process is an advantageous alternative method that can overcome the above challenges. The main difficulty in biodiesel production is the immiscible nature of the reactants and the difference in their densities. This can result in poor contact between the reactants thereby reducing mass transfer and reaction rate and also direct increase in the reaction time. Transport of mass, heat and fluid between two immiscible fluids is similar to heterogeneous transport phenomena and depends on the lag in the film between them. Changing fluid physical properties or increasing the driving force could raise the transport rates. The best way to overcome the lag is the film mixing membrane reactor which is one of the techniques employed to overcome process challenges and produce high quality biodiesel [10]. Besides this, the method can overcome the usual technical problems such as higher energy consumption of continuous stirred tank reactors (CSTR), high alcohol usage, high reaction temperature as well as high time demand to obtain complete conversion. In fact, the membrane is used in both the reaction bed and separator and then it provides high surface/volume ratio for mass transfer and separation. This method is easy to scale up [11]. Based on the membrane material, the membrane can be classified into organic, inorganic, dense or porous membrane. [12]. The inorganic Fuel Processing Technology 118 (2014) 7–19 ⁎ Corresponding author. Tel.: +60 379675300; fax: +60 379675319. E-mail address: [email protected] (A.A. Abdul Raman). 0378-3820/$ – see front matter © 2013 Elsevier B.V. All rights reserved. http://dx.doi.org/10.1016/j.fuproc.2013.07.015 Contents lists available at ScienceDirect Fuel Processing Technology journal homepage: www.elsevier.com/locate/fuproc
Transcript of Fuel Processing Technology - umexpert.um.edu.my Simulation of fatty acid methyl ester production in...
Fuel Processing Technology 118 (2014) 7–19
Contents lists available at ScienceDirect
Fuel Processing Technology
j ourna l homepage: www.e lsev ie r .com/ locate / fuproc
3D Simulation of fatty acid methyl ester production in a packedmembrane reactor
Baharak Sajjadi a, Abdul Aziz Abdul Raman a,⁎, Saeid Baroutian b,Shaliza Ibrahim c, Raja Shazrin Shah Raja Ehsan Shah a
a Department of Chemical Engineering, Faculty of Engineering, University of Malaya, 50603 Kuala Lumpur, Malaysiab SCION, Te Papa Tipu Innovation Park, 49 Sala Street, Private Bag 3020, Rotorua, New Zealandc Department of Civil Engineering, Faculty of Engineering, University of Malaya, 50603 Kuala Lumpur, Malaysia
⁎ Corresponding author. Tel.: +60 379675300; fax: +6E-mail address: [email protected] (A.A. Abdul Ra
0378-3820/$ – see front matter © 2013 Elsevier B.V. All rihttp://dx.doi.org/10.1016/j.fuproc.2013.07.015
a b s t r a c t
a r t i c l e i n f oArticle history:Received 5 February 2013Received in revised form 20 July 2013Accepted 20 July 2013Available online 7 September 2013
Keywords:TransesterificationBiodieselMembrane reactorComputational Fluid Dynamics (CFD)
The currentwork is aimed to simulate the production of high quality fatty acidmethyl ester (biodiesel) productionfrom palm oil in a micro porous ceramic membrane reactor. The TiO2/Al2O3 ceramic membrane was used as theseparator and catalytic bed. It was packed with potassium hydroxide catalyst supported on palm shell activatedcarbon. The investigation of component distribution within the system was not possible. Hence CFD analysiswas used to predict the distribution of the fatty acid methyl ester and the other by-products in the membranemodule. The Brinkman equation was used to simulate fluid flow within the porous media. In addition, theMaxwell–Stefan equation was applied for simulation of reaction kinetics and mass transfer. The combination ofthementionedmodelswas solvedmathematically bymeans of the finite elementmethod and PARDISO algorithm.In addition, the effect of temperature on transesterification reaction has been examined. The CFD results wereindicated that increasing the reaction temperature leads to the same conversion in shorter time, or increase intemperature by 10 °C, results in 5% growth of reaction for the same time period. The molar concentrations ofeach component are also shown in the total system for 85 s and 400 s. Aswe see from the diagrams, the simulatedliquid velocity within the system reaches agreement with experimental results at 8.1% deviation and 0.61%overestimation in the reaction part.
© 2013 Elsevier B.V. All rights reserved.
1. Introduction
The necessity to replace conventional fossil fuels with an environ-mental friendly substitute to fulfil the increasing energy demand hasbeen a great concern in this century [1,2]. Reserves have been cited tolast only for another 50 years at the current consumption rate ofcrude oil [3]. Biodiesel (fatty acid alkyl esters) is one of the mostpromising alternative fuels. It is now recognised as “green fuel” andbrings several advantages over conventional fossil fuels. It is biodegrad-able, renewable, non-toxic and has very similar properties to diesel fuel[4]. Biodiesel is the only alternative fuel that can be used directly in anyexisting, unmodified diesel engine as it has similar properties topetroleum diesel. Furthermore biodiesel can be blended in any ratiowith petroleum diesel [5–7]. Biodiesel can be produced using homoge-neous, heterogeneous or biocatalysts. Generally, transesterification oftriglycerides using homogeneous catalysts is the most preferableprocessing technique. This method contains three steps to exchange thealkoxy group of an alcohol with the alkoxy group of an ester compound.
However, this technique suffers from high cost for purification andwastewater treatment [8]. Although enzymatic catalysts give high
0 379675319.man).
ghts reserved.
conversion rate and are very selective, they are unstable and very ex-pensive [9]. Heterogeneous acid-catalysed process is an advantageousalternative method that can overcome the above challenges.
The main difficulty in biodiesel production is the immiscible natureof the reactants and the difference in their densities. This can result inpoor contact between the reactants thereby reducing mass transferand reaction rate and also direct increase in the reaction time.
Transport of mass, heat and fluid between two immiscible fluids issimilar to heterogeneous transport phenomena and depends on thelag in the film between them. Changing fluid physical properties orincreasing the driving force could raise the transport rates. The bestway to overcome the lag is the film mixing membrane reactor whichis one of the techniques employed to overcome process challengesand produce high quality biodiesel [10].
Besides this, themethod can overcome the usual technical problemssuch as higher energy consumption of continuous stirred tank reactors(CSTR), high alcohol usage, high reaction temperature as well as hightime demand to obtain complete conversion. In fact, the membrane isused in both the reaction bed and separator and then it provides highsurface/volume ratio for mass transfer and separation. This method iseasy to scale up [11].
Based on the membrane material, the membrane can be classifiedinto organic, inorganic, dense or porous membrane. [12]. The inorganic

Nomenclature
SymbolsCV control volume, [m3]c component concentration [mol/m3]Dij Fick diffusivity, [m2/s]DiT thermal diffusion coefficient, [kg/(m·s)]
div divergenceE rate-of-strain tensorF acting force [N]K kinetic rate constant, [dm3/(mol·min)]M molecular mass, [g/mol]n normal vectort time, [s]T temperature, [°C]T deviatoric stress tensoru velocity vector, [m/s]V volume, [m3]w weight, variousp pressure, [Pa]xj molar fraction of species, [j]Ri reaction rate, [kg/(m3·s)]Qbr mass sink source, [kg/(m3·s)]
Greek symbolsρ density of the mixture, [kg/m3]μ molecular viscosity, [Ns/m2]Sϕ source-sink termε fractional hold up of each componentεp porosityκ permeability, [m2]βf Forchheimer coefficient [kg/m4], for considering of the
drag of the fluid on the porous matrix, [kg/m4]ωi mass fraction of species iΓ appropriate coefficient for variable ε (here is the diffu-
sion constant)Sϕ source-sink term per unit volume∂ gradient
SubscriptsMeOH methanolTG triglycerideDG diglycerideMG monoglycerideFAME fatty acid methyl esterG glyceride
8 B. Sajjadi et al. / Fuel Processing Technology 118 (2014) 7–19
membranes especially ceramic ones are able to endure higher pressureand temperature; thus they are more suitable for use with organicsolvents in comparison with the organic or porous types. The otherclassification means the membrane is either able to incorporate withthe catalyst or not. That is to say, it is known as a catalytic or inert mem-brane reactor. In the inert type, catalysts are charged to the reactants. Themost widely used inert membranes in biodiesel production are theceramic membrane [13], carbon membrane [14] and the TiO2/Al2O3 inceramic membrane [15].
Furthermore, potassium hydroxide, sodium hydroxide and sulphuricacid are the most common catalysts used for catalytically inertmembranes [13–16].
In this research, a packed bed membrane reactor containing het-erogeneous catalyst was used with the aim of combining alkali
transesterification and triglyceride separation. For this purpose atubular ceramic (TiO2/Al2O3) membrane was employed as both areactor and a separator and it is filled with potassium hydroxidecatalyst supported on activated carbon.
Understanding the microscopic fluid flow in a membrane modulebased on CFD analysis can improve the design of the collection oftubes and spacers to enhance module performance and facilitate theconstruction of new designs; then CFD techniques were applied tosolve the model equations. A three-dimensional numerical solution ofthe coupledNavier–Stokes, Brinkman's lawand chemical reaction equa-tions has been developed using the control volume based finite differ-ence method. The main objective of the simulation is to predictconcentrations of the components in the membrane contactor. More-over, the laminar fluid flow and chemical reaction through the catalyticbed and the component concentrations inside the ceramic membranehave been investigated. Finally, the model predicted results were vali-dated with experimental data.
2. Experimental data
The experimental data was taken from the work of Baroutian et al.and consisted of two different temperatures and two different fluidcross flow velocities [17,27]. Fig. 1 shows the laboratory scale experi-mental setup for FAME production. A tubular TiO2/Al2O3 membrane(Atech Innovations Gmbh, Germany) with 0.05 μm nominal pore sizewas used as reactor and separator (Fig. 2). The length, inner diameterand outer diameter of the membrane were 40 cm, 1.60 cm and2.54 cm, respectively. The effective filtration area for the membranewas 0.0201 m2. The inner section was packed with potassium hydrox-ide catalyst supported on palm shell activated carbon. It loaded themembrane with 50 vol.% of the catalyst, which was considered as thecatalytic bed porosity. Beside these, they were kept in a place usingstainless steel screens attached to the upstream and downstreamtubing; then uniform distribution of the catalyst has been assumed inthe CFD section. The characterisation result of the catalytic bed hasbeen shown in Table 1. A coiled heat exchanger equipped with a hotwater circulator bath was used to maintain the reaction temperature.The system pressure (transmembrane pressure, TMP) was maintainedthroughout the run andwas controlled at 1 barg. Palm oil andmethanolwith the volume ratio of 1:1 were charged into the system. Palm oil hadwith molecular weight of 762.223 (gr/mol) density of 870.2 (kg/m3)and viscosity of 16.93 (mPa·s). The other properties of palm oil includean acid value of 0.5, iodine value of 53.2 and water mass fraction of400 × 10−6. Methanol with amolecularweight of 32.04 (g/mol), purityof 99.8%, density of 791.8 (kg/m3) and viscosity of 0.59 (mPa·s) is theother reactant. Finally, potassiumhydroxide loaded on activated carbonwas used as the heterogeneous catalyst within the catalytic bed.
In this study, selection of level for each parameter was based onthe literature reports on the applications of alkali transesterificationreactions. The lower and upper levels of temperature (50 and 60 °C) re-spectively were due to the very slow rate of the reaction in the temper-ature less than 50 °C and the boiling point of methanol at the upperlevel. The levels of cross flow circulation velocity were selected due tothe capability of the circulating pump. The catalyst concentration wasalso based on the design matrix. Finally, selection of methanol to palmoil ratio was due to the mixing limitation of ceramic membrane. Sincein this technology, there is no effectivemixingwithin the ceramicmem-brane, the other mass transfer limitation such as the immiscible natureof the reactantswill join the process. Therefore themethanol concentra-tion should be more than what is normally used in the other methods.According to literature, the alcohol concentration of 40:1 43:1 is suffi-cient in membrane technology in the presence of heterogeneous cata-lyst [18]. In this study the alcohol to methanol ratio of 1:1 (vol.%) wasused which is less than 24:1 molar ratio.
Triglyceride (TG) was not miscible in MeOH, it was found in form ofsmall droplets during the transesterification reaction. Therefore, the
1: Palm oil 2: MeOH 3: Raw material pump 4: Magnetic stirrer 5: Mixing vessel 6: Circulating pump 7: Hot water circulator 8: Water chiller 9: Coiled heat exchanger 10: Ceramic membrane 11: Pressure gauge 12: Temp. indicator 13: MeOH recovery unit 14: Pump15: Separating funnel
Fig. 1. Schematic diagram of packed bed membrane reactor to produce biodiesel [13].
9B. Sajjadi et al. / Fuel Processing Technology 118 (2014) 7–19
produced biodiesel which consists of fatty acid alkyl esters with smallmolecular sizes was able to pass through the membrane along with al-cohol and glycerol while the large droplet of oil cannot pass through themembrane pores. Therefore, in the CFD simulation, it was consideredthat all components can pass through the membrane except the TGdue to its droplet size [19–25]. Generally, the membrane technology isa new and complicated knowledge especially in biodiesel field. Further-more, there are still, so many unknowns in this area. In this study, wetried to find out some of these unknowns such as local component con-centration within the ceramic membrane and catalytic bed at differenttimes with the assistance of CFD simulation. 30 different experimentswere designed and optimised. According to the available kinetic infor-mation with the literature the mentioned two runs were selected forthe simulation [26]. Table 2 shows all the reaction rate constants, k(wt.% min)−1 in two different temperatures.
a
L
r2
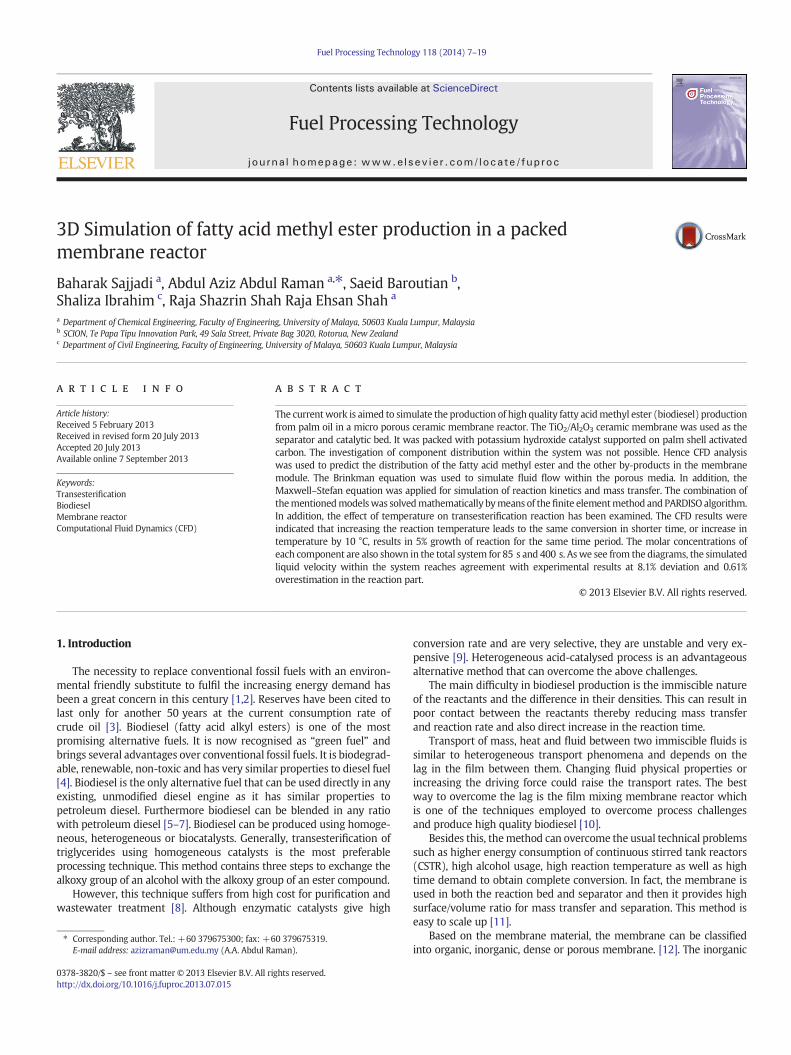
r1
Fig. 2. Combination of heterogeneous catalytic bed and ceramic m
The first runwas in the temperature of 50 °C, the reactant cross flowvelocity of 0.195 cm/s and the catalyst mass per unit volume of reactorof 143.75 mg/cm3 with the conversion of 87.5. The second run is in thetemperature of 60 °C, the reactant cross flow velocity of 0.212 cm/s andthe catalyst mass per unit volume of reactor of 143.75 mg/cm3 with theconversion of 92.4.
3. Theoretical study
3.1. The system model
The model for the membrane reactor module is illustrated in Fig. 2.The catalytic bed is at the module core and is surrounded by the mem-brane. The membrane reactor is symmetrical and for that reason onlyhalf of the system was simulated to optimise computational demand.
Catalytic Bed
Ceramic Membrane
embrane. With r1 = 0.008 m, r2 = 0.0127 m and L = 0.4 m.
Table 1Characterisation results for the catalytic bed.
Property Value Unit Technique
BET surface area 214.46 m2/g BETPore volume 0.174 cm3/g BETMicro pore volume 0.114 cm3/g BETAverage pore width 3.06 nm BETActive site concentration 1.558 mmol/g TPD-CO2
10 B. Sajjadi et al. / Fuel Processing Technology 118 (2014) 7–19
3.2. Governing equations for the fluid flow
3.2.1. Continuity equationThe flow field was obtained by solving the continuity equation and
the momentum balance equations of the system. The continuity equa-tion is expressed by:
∂ ρεð Þ∂
zfflffl}|fflffl{Unsteady Term
¼ −div ρ u!ε� �zfflfflfflfflfflfflffl}|fflfflfflfflfflfflffl{Convection Term
þ div Γεgrad εð Þzfflfflfflfflfflfflfflfflfflffl}|fflfflfflfflfflfflfflfflfflffl{Diffusion Term
þ Sϕz}|{Source Term
ð1Þ
This equation describes the increasing rate of each component (ρε)at any point as the (negative) rate. They are being removed at thatpoint by convection (div{ρu ε}) plus the rate they are being added bydiffusion (div{grad(ε)}) plus the rate at which solutes are beingproduced (Sφ) [28]. Integrating Eq. (1) and transforming the resultingequation using the divergence theorem gives:
∂ ρε∂t
� �þ ρ
Zcv
div εuð ÞdV ¼ DZcv
div grad εð Þð ÞdVþ Sε ð2Þ
∂ ρεð Þ∂t þ ρ
ZF
n � εuð ÞdA ¼ DZF
n � grad εð Þð ÞdAþ Sε ð3Þ
where n is the normal vector to the force and the integrals indicateeither a surface integral over the forces (F) or a volume integral overthe control volume (CV).
3.2.2. Momentum equationsBy extending the equation using the ‘u’ component we have defined
momentum equations in x, y and z directions in the Cartesiancoordinates.
In an inertial frame of reference, the general form of the equations offluid motion is:
ρ∂u∂t ¼ −∇pþ∇ � T þ f ð4Þ
The left side of the equation describes acceleration. It may becomposed of convective or time dependent effects. The right side ofthe equation is in effect a divergence of stress and summation of bodyforces.
Table 2Reaction rate constant k (wt.% min)−1 for triglyceride (TG), diglyceride (DG), andmonoglyceride (MG) at different temperatures [26].
Reaction Temperature°C
Reaction rate constant(wt%-min)−1
R2
TG + CH3OH → DG + R1COOCH3 50 0.018 0.986560 0.036 0.9822
DG + CH3OH → MG + R2COOCH3 50 0.036 0.994060 0.070 0.9860
MG + CH3OH → MG + R3COOCH3 50 0.112 0.973360 0.141 0.9843
In the Navier–Stokes equations, the deviatoric stress tensor issymmetric. Therefore it can be expressed in terms of two scalar dynamicviscosities μ and μ″:
T ¼ 2μE þ μ″Δl ð5Þ
where E ¼ 12 ∇uð Þ þ 1
2 ∇uð ÞT is the rate-of-strain tensor. In the three-dimensional flow the deviatoric stress tensor has zero trace, hence2μ + 3μ″ = 0 and the deviatoric stress tensor are defined with thefollowing form:
T ¼ 2μ E−13Δl
� �ð6Þ
But, ceramicmembrane is a porousmedia andNavier–Stokes cannotexplain the fluid flow within this system lonely. The Brinkman equa-tions describe fluid flow in porous bed to modify the Navier–Stokesequation [29]. These equations extend Darcy's law to include a termthat accounts for viscous transport in the momentum balance and isvalidwhere the porosity is high (i.e. N90%). The validity of this approachhas been confirmedby several investigations in relation to the boundaryconditions at the fluid as well as solid interface [30–32].
Brinkman equation in the x direction
ρεp
∂ux
∂t þ ux∂ux
∂x þ uy∂ux
∂y þ uZ∂uZ
∂z
� �
¼ −∂p∂x þ
μεp
∂2ux
∂x2þ ∂2uy
∂y2þ ∂2uz
∂z2
!þ ∂2ux
∂x2þ ∂2uy
∂y2þ ∂2uz
∂z2
!T !" #
− 2μ3εp
∂2ux
∂x2þ ∂2uy
∂y2þ ∂2uz
∂z2
!l− μ
κbrþ β F uj j þ Qbr
� �uþ Fx
∇ � ½− ηεp
∂2ux
∂x2þ ∂2uy
∂y2þ ∂2uz
∂z2
!þ ∂2ux
∂x2þ ∂2uy
∂y2þ ∂2uz
∂z2
!T
þ pI
!¼ −η
ku
ð7Þ
Brinkman equation in the y direction
ρεp
∂uy
∂t þ ux∂uy
∂x þ uy∂uy
∂y þ uZ∂uy
∂z
!
¼ −∂p∂y þ μ
εp
∂2uy
∂x2þ ∂2uy
∂y2þ ∂2uy
∂z2
!þ ∂2uy
∂x2þ ∂2uy
∂y2þ ∂2uy
∂z2
!T !" #
− 2μ3εp
∂2uy
∂x2þ ∂2uy
∂y2þ ∂2uy
∂z2
!l− μ
κbrþ β F uj j þ Qbr
� �uþ Fy
∇ � ½− ηεp
∂2uy
∂x2þ ∂2uy
∂y2þ ∂2uy
∂z2
!þ ∂2uy
∂x2þ ∂2uy
∂y2þ ∂2uy
∂z2
!T
þ pI
!¼ −η
ku
ð8Þ
Brinkman equation in the z direction
ρεp
∂uz
∂t þ ux∂uz
∂x þ uy∂uz
∂y þ uZ∂uz
∂z
� �
¼ −∂p∂z þ
μεp
∂2uz
∂x2þ ∂2uz
∂y2þ ∂2uz
∂z2
!þ ∂2uz
∂x2þ ∂2uz
∂y2þ ∂2uz
∂z2
!T !" #
− 2μ3εp
∂2uz
∂x2þ ∂2uz
∂y2þ ∂2uz
∂z2
!l− μ
κbrþ β F uj j þ Qbr
� �uþ Fz
∇:½− ηεp
∂2uz
∂x2þ ∂2uz
∂y2þ ∂2uz
∂z2
!þ ∂2uz
∂x2þ ∂2uz
∂y2þ ∂2uz
∂z2
!T
þ pI
!¼ −η
ku
ð9Þ
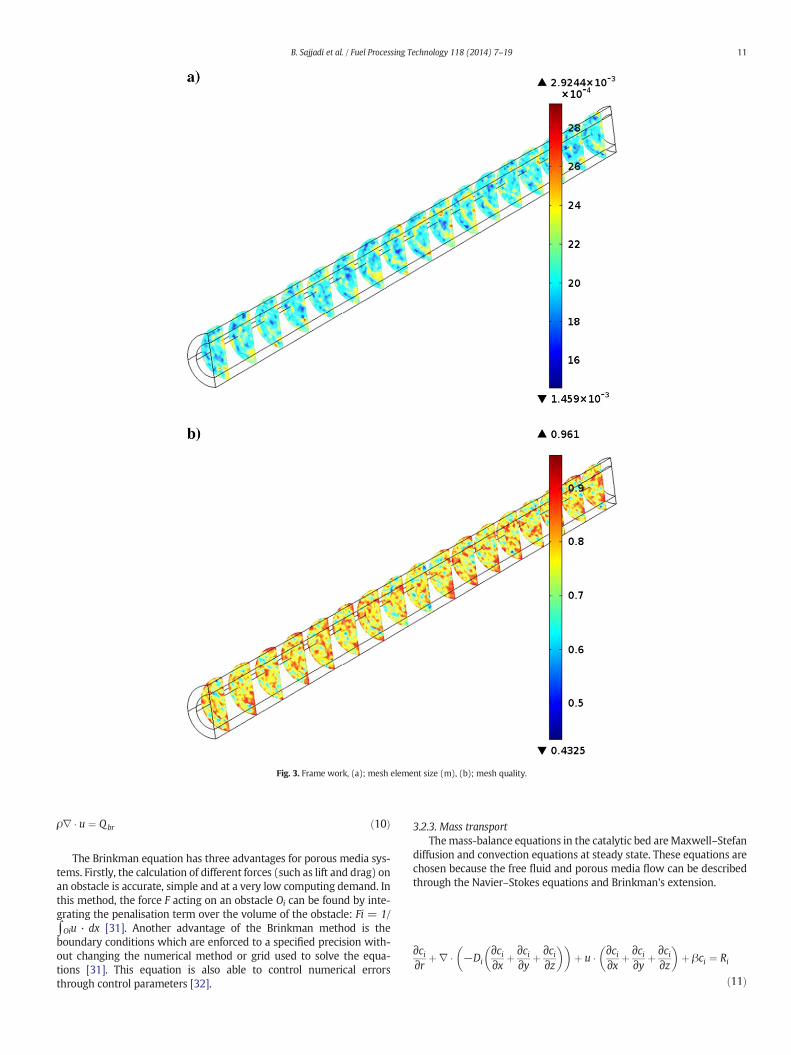
Fig. 3. Frame work, (a); mesh element size (m), (b); mesh quality.
11B. Sajjadi et al. / Fuel Processing Technology 118 (2014) 7–19
ρ∇ � u ¼ Qbr ð10Þ
The Brinkman equation has three advantages for porous media sys-tems. Firstly, the calculation of different forces (such as lift and drag) onan obstacle is accurate, simple and at a very low computing demand. Inthis method, the force F acting on an obstacle Oi can be found by inte-grating the penalisation term over the volume of the obstacle: Fi = 1/∫Oiu · dx [31]. Another advantage of the Brinkman method is theboundary conditions which are enforced to a specified precision with-out changing the numerical method or grid used to solve the equa-tions [31]. This equation is also able to control numerical errorsthrough control parameters [32].
3.2.3. Mass transportThemass-balance equations in the catalytic bed areMaxwell–Stefan
diffusion and convection equations at steady state. These equations arechosen because the free fluid and porous media flow can be describedthrough the Navier–Stokes equations and Brinkman's extension.
∂ci∂r þ∇ � −Di
∂ci∂x þ ∂ci
∂y þ ∂ci∂z
� �� �þ u � ∂ci
∂x þ ∂ci∂y þ ∂ci
∂z
� �þ βci ¼ Ri
ð11Þ
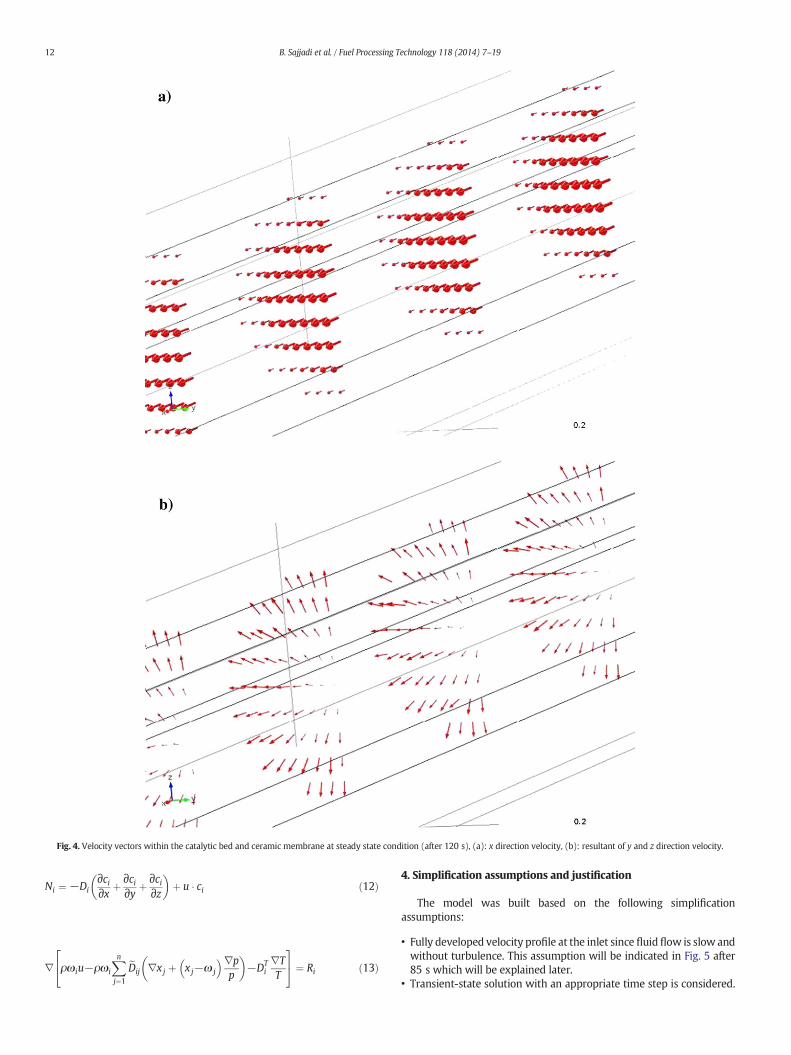
Fig. 4. Velocity vectors within the catalytic bed and ceramic membrane at steady state condition (after 120 s), (a): x direction velocity, (b): resultant of y and z direction velocity.
12 B. Sajjadi et al. / Fuel Processing Technology 118 (2014) 7–19
Ni ¼ −Di∂ci∂x þ ∂ci
∂y þ ∂ci∂z
� �þ u � ci ð12Þ
∇ ρωiu−ρωi
Xnj¼1
eDij ∇xj þ xj−ω j
� �∇pp
� �−DT
i∇TT
24 35 ¼ Ri ð13Þ
4. Simplification assumptions and justification
The model was built based on the following simplificationassumptions:
• Fully developed velocity profile at the inlet since fluidflow is slow andwithout turbulence. This assumption will be indicated in Fig. 5 after85 s which will be explained later.
• Transient-state solution with an appropriate time step is considered.
5 sec
15 sec
20 sec
30 sec
40 sec
50 sec
60 sec
70 sec
80 sec
Steady state
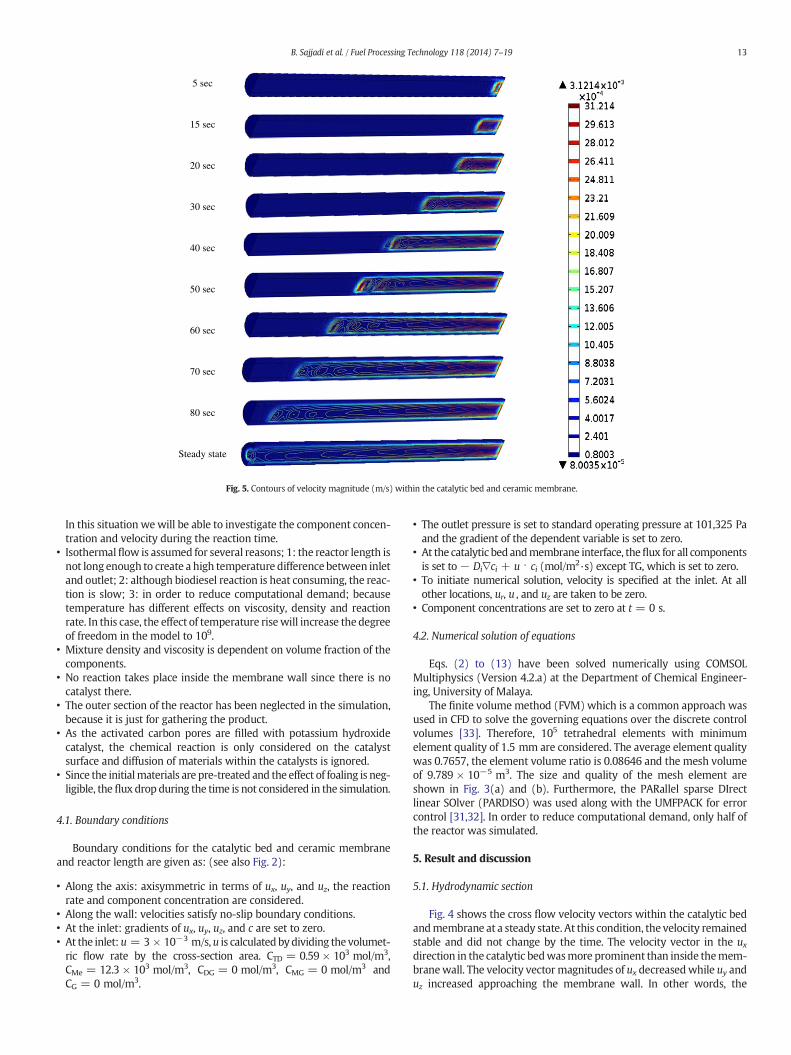
Fig. 5. Contours of velocity magnitude (m/s) within the catalytic bed and ceramic membrane.
13B. Sajjadi et al. / Fuel Processing Technology 118 (2014) 7–19
In this situation wewill be able to investigate the component concen-tration and velocity during the reaction time.
• Isothermalflow is assumed for several reasons; 1: the reactor length isnot long enough to create a high temperature difference between inletand outlet; 2: although biodiesel reaction is heat consuming, the reac-tion is slow; 3: in order to reduce computational demand; becausetemperature has different effects on viscosity, density and reactionrate. In this case, the effect of temperature risewill increase the degreeof freedom in the model to 109.
• Mixture density and viscosity is dependent on volume fraction of thecomponents.
• No reaction takes place inside the membrane wall since there is nocatalyst there.
• The outer section of the reactor has been neglected in the simulation,because it is just for gathering the product.
• As the activated carbon pores are filled with potassium hydroxidecatalyst, the chemical reaction is only considered on the catalystsurface and diffusion of materials within the catalysts is ignored.
• Since the initialmaterials are pre-treated and the effect of foaling is neg-ligible, the flux drop during the time is not considered in the simulation.
4.1. Boundary conditions
Boundary conditions for the catalytic bed and ceramic membraneand reactor length are given as: (see also Fig. 2):
• Along the axis: axisymmetric in terms of ux, uy, and uz, the reactionrate and component concentration are considered.
• Along the wall: velocities satisfy no-slip boundary conditions.• At the inlet: gradients of ux, uy, uz, and c are set to zero.• At the inlet:u = 3 × 10⁻³ m/s,u is calculated bydividing the volumet-ric flow rate by the cross-section area. CTD = 0.59 × 10³ mol/m3,CMe = 12.3 × 10³ mol/m3, CDG = 0 mol/m3, CMG = 0 mol/m3 andCG = 0 mol/m3.
• The outlet pressure is set to standard operating pressure at 101,325 Paand the gradient of the dependent variable is set to zero.
• At the catalytic bed andmembrane interface, theflux for all componentsis set to− Di∇ci + u ⋅ ci (mol/m2·s) except TG, which is set to zero.
• To initiate numerical solution, velocity is specified at the inlet. At allother locations, ur, u , and uz are taken to be zero.
• Component concentrations are set to zero at t = 0 s.
4.2. Numerical solution of equations
Eqs. (2) to (13) have been solved numerically using COMSOLMultiphysics (Version 4.2.a) at the Department of Chemical Engineer-ing, University of Malaya.
The finite volumemethod (FVM) which is a common approach wasused in CFD to solve the governing equations over the discrete controlvolumes [33]. Therefore, 105 tetrahedral elements with minimumelement quality of 1.5 mm are considered. The average element qualitywas 0.7657, the element volume ratio is 0.08646 and the mesh volumeof 9.789 × 10⁻⁵ m3. The size and quality of the mesh element areshown in Fig. 3(a) and (b). Furthermore, the PARallel sparse DIrectlinear SOlver (PARDISO) was used along with the UMFPACK for errorcontrol [31,32]. In order to reduce computational demand, only half ofthe reactor was simulated.
5. Result and discussion
5.1. Hydrodynamic section
Fig. 4 shows the cross flow velocity vectors within the catalytic bedandmembrane at a steady state. At this condition, the velocity remainedstable and did not change by the time. The velocity vector in the uxdirection in the catalytic bedwasmore prominent than inside themem-branewall. The velocity vector magnitudes of ux decreasedwhile uy anduz increased approaching the membrane wall. In other words, the

14 B. Sajjadi et al. / Fuel Processing Technology 118 (2014) 7–19
convection termwasmore effective in the catalytic bedwhile the diffu-sion termwasmore effective inside themembranewall. Thiswas owingto theporosity of themembrane,whichwas lower in the catalytic bed incomparison with the ceramic walls. The velocity vectors in uy and uzdirections inside the membrane were more than 2.5 times comparedto the corresponding velocity vector in the catalytic bed, especially inand near the centre where the uy and uz velocity vectors approach zero.
Fig. 6. Velocity magnitude (m/s) within the catalytic be
The contour plot for velocity magnitudes at different times isdepicted in Fig. 5. Higher velocitymagnitudeswere observed at the cen-tre of the catalytic bed due to higher porosity. The velocity contours alsoindicate that there was no generation of local high velocity magnitudeto increase the scouring force on the membrane wall. Thus, there wasnot any fluid deceleration and acceleration near the membrane wall;and the fluid entered the membrane smoothly and uniformly, which
d and ceramic membrane at steady state condition.

Com
pone
nt C
once
ntra
tion
(mol
/m3 )
Time (sec)
Com
pone
nt C
once
ntra
tion
(mol
/m3 )
Time (sec)
a)
b)
Fig. 7. Concentration distribution (mol/m3) based on the reaction rate constants. (a) At50 °C and (b) at 60 °C),☆: FAME, ○: TG, ◊: DG, □: MG, Δ: G.
Table 3The deviation between experimental data and CFD results.
Run 1 2
EXP CFD Deviation EXP CFD Deviation
Cross flow velocity (cm/s) 0.195 0.179 8.2% 0.212 0.195 8.0%Conversion (%) 87.5 88 0.57% 92.4 93 0.65%
15B. Sajjadi et al. / Fuel Processing Technology 118 (2014) 7–19
is one of themembrane technology advantages. However, this situationonly exists in the first minutes when the membrane is still fresh. Thefeed phase has a fully developed laminar velocity profile in the catalyticbed. In order to determine the accuracy of the simulation result, tworepresentative points were selected to be compared with the experi-mental data; one at the catalytic bed outlet, and the other outside themembrane surface. The superficial velocity at these points, was definedas the volumetric flow rate divided by the frontal surface area.
The velocity magnitudes within the catalytic bed and membrane in50 °C and 60 °C are shown in Fig. 6(a) and (b), respectively. Liquid ve-locity decreased by almost 77% and 58% by diffusion from the catalyticbed into the membrane wall at the inlet and outlet of the reactor. Also,the liquid phase velocity decreased by approximately 37% within thecatalytic bed between the import and out port side. One importantreason for thiswas the decrease in the amount of thematerial in the cat-alytic bed (or the volume fraction); in fact, the amount of the materialhad been transported to the membrane. Another reason was relatedto viscosity change that depends on the volume fraction of new produc-tions or consumptions. The last reasonwas the existence of the catalyticbed that acts as a solid obstacle in the direction offluidflow. Consideringthese results, the movement of the material into the membrane can bedefined by the summation of convection and diffusion terms. The outletvelocities of the catalytic bed at 60 and 50 °C were 0.0195 and0.0179 m/s, respectively, which had a difference of about 8% averagelycompared to the experimental values.
The effect of temperature is also illustrated in this figure. Asobserved, raising the temperature from 50 °C to 60 °C, caused about8% increase in liquid velocity aswell as in the reaction rate. Then the vol-ume fraction of different components changed with different densitiesor viscosities. At higher temperatures, the liquid viscosity decreasedand the velocity increased. Furthermore, the main and direct effect ofcross flow velocity is on the time. In other words, by increasing thevelocity, the materials leave the system sooner and residence time de-creases consequently followed by reduction of the reaction conversion.
Also by increasing the temperature, higher amount of fatty acidmethyl ester can be produced in shorter time and it results in decreasingthe viscosity and density.
5.2. Reaction rate and component concentration
In this study, the simulation has been done step by step. At first stepthe hydrodynamic of the membrane was simulated without reaction.Secondly, the reaction has been simulated as a zero dimensional file. Fi-nally the reaction file is joined to the original file. Both files solved eachother and the data were transferred between them. In other words, theoutput of one file is the input of the other one. Fig. 7 is also the result ofthe reactionfilewhich should happen at the catalytic bed.When this fileis joined to the hydrodynamic part, the final results of Fig. 9 are pro-duced. By comparing these two figures we can judge that, the reactorlength and residence time were not enough to complete the reaction.
Fig. 7(a) and (b) shows the progress of transesterification reactionfor palm oil in 1200 s reaction time. The temperatures were 50 °C and60 °C in Fig. 7(a) and (b), respectively. Both concentration curvesfollowed a similar pattern, except for the MG and DG curves.
Themain effect of temperature difference is on the kinetic, hencewehave selected two different temperatureswhich had two different reac-tion rates and kinetics as well. As it has been mentioned in Table 2, byincreasing the temperature, the reaction rate constants (k) increasedas well which affects the component concentrations.
In the initial steps of the reaction (between 0 and 300 s), productionof FAME was rapid. Then the rate decreased and reached equilibrium atabout 700 s at 60 °C and 1000 s at 50 °C. The increase in FAME concen-tration was followed by an increase in G concentration as it was liberat-ed fromTGmolecules. But, due to intermediate products such asDG andMG, the relative proportion of G production was not always the sameas the FAME production. Following an initial increase the DG
concentration diminished. It seems that the life cycle of DG and MGwas only 600 s and the highest concentrations of DG and MG were ob-served in the first minutes (between 60 and 180 s).
The concentration of MG increased at the beginning, similar to DGand after reaching a peak decreased gently. It is obvious from these re-sults that the conversion of the reaction increased with reaction timeuntil the equilibrium point, which reached at the maximum of 98.3%.But in the reaction simulation, considering the residence time of thema-terial within the catalytic bed, the reaction yields were 93% and 88% at60 and 50 °C, respectively, which had 5.3% and 10.4% deviations. Thefinal CFD results (after joining the reaction to the hydrodynamic), hadthe deviation of 0.57% and 0.65% with the experimental data (Table 3).As the reaction temperature increased, the same conversion wasachieved in shorter times. The graphs show the molar concentrationof each component in the total system (ceramicmembrane and catalyticbed) until the steady state condition reaction at 60 °C shown in Fig. 8.

a) Triglyceride b) Methanol
c) Diglyceride d) Monoglyceride
e) Gelycerol f) Fatty Acid Methyl Ester
yx
z
yx
z
yx
z
yx
z
yx
z
yx
z
Fig. 8. Concentration distribution of different components (mol/m3)within the catalytic bed and ceramicmembrane. (a), Triglyceride; (b),methanol; (c), diglyceride; (d), monoglyceride;(e), glycerol; (f), fatty acid methyl ester.
16 B. Sajjadi et al. / Fuel Processing Technology 118 (2014) 7–19
Palm oil (TG) is the most important component which could not passfrom the ceramic membrane because its droplet size was bigger thanthe ceramic hole diameter. In this research to achieve this aim wehave defined the zero convection and diffusion for the inner boundarycondition of ceramic membrane for TG only. This solution providesgreat results which match with the experimental data within 8% devia-tion in hydrodynamic section and 0.57% and 0.65% deviation at 60 and
50 °C, respectively in the reaction part. As it is clear from the picture,TG only exists at the catalytic bed. In addition, since the movement ofmaterials depends on their viscosity, there was more residence timefor TG than for the other materials (nearly 200 s) and most of it wasconsumed in the first half section of the reactor during 120 s until itsconcentration decreased to 200 mol/m3 (nearly at the middle of reac-tor); it is completely matched with the Fig. 7(b). Methanol is the other

a) Diglyceride, :50 sec, 100 sec, :150, :200, :300, :400. b)Monoglyceride, :50 sec, 100 sec, :150, :200, :300, :400.
Com
pone
nt C
once
ntra
tion
(mol
/m3 )
Reactor length
Com
pone
nt C
once
ntra
tion
(mol
/m3 )
Reactor length (m)
c) Glycerol, :50 sec, 100 sec, :150, :200, :300, :400. d)Fatty Acid Methyl Ester, :50 sec, 100 sec, :150, :200, :300, Δ:400.
Com
pone
nt C
once
ntra
tion
(mol
/m3 )
Reactor length (m)
Com
pone
nt C
once
ntra
tion
(mol
/m3 )
Reactor length (m)
e) Methanol, :50 sec, 100 sec, :150, :200, :300, :400.
Com
pone
nt C
once
ntra
tion
(mol
/m3 )
Reactor length (m)
Fig. 9. Simulated concentration distribution of different components (mol/m3) at the ceramic membrane. ■: 50 s, ○: 100 s, ◊: 150, □: 200,☆: 300, Δ: 400. (a), Diglyceride; (b), mono-glyceride; (c), glycerol; (d), fatty acid methyl ester; (e), methanol.
17B. Sajjadi et al. / Fuel Processing Technology 118 (2014) 7–19
initial component which was charged with the volume ratio of 1:1 tothe palm oil, thus the whole three reactions were completed due to ad-ditional amount of methanol. Fig. 8 also shows that the methanol ratio
at the first section of the reactor was higher, and after its consumptionthe concentrationwas reduced but not completely. The graphic picturesalso show a similar pattern for both DG andMG,which are intermediate
18 B. Sajjadi et al. / Fuel Processing Technology 118 (2014) 7–19
productions. Since these components were produced by two separatedreactions, one after the other, the highest concentration of DGwas in theuppermiddle of the reactor and the highest concentration of MGwas inthe lowermiddle of the reactor.What is more, since no reactionwas as-sumed in the membrane section, each component which entered intothe section remained there till it went out. Hence, a concentration pro-file within the length of the ceramic membrane was observed for eachcomponent. The concentration of this profile is in proportion to the re-action. The typical distribution of FAME and Gwhichwere themost im-portant productionswas similar as well. The only differencewas in theirconcentration because the FAME was produced by three reactions buttheG by oneonly. In addition, the production of FAMEwas started soon-er because of the first and the second reactions. In other words, by pro-ducing the DG and MG, the FAME was also produced in parallel, but Gwas only produced by consuming the DG (the third reaction).
Fig. 9 illustrates the results of the concentration gradient profiles ofall components within the ceramic membrane except the TG (whichwas equal to zero) for different time periods until 400 s. It was observedthat, the DG concentration gradient profiles (see Fig. 9(a)) increasedthroughout the length of the membrane channel, reaching maximumvalue inside themembrane, then reduced from its peak along themem-brane length which depends on the consumption of this component. Ifwe consider the reactor into two sections again, in the first section theDG concentration doesn't change at different times but at the secondone the concentration is not stable and increases with time. Thismeans that increasing the residence time will result in higher produc-tionwithin the reactor and increasing the reactor length can be an opti-mal choice in this system. It is clear that there is less fluid velocity in themembrane than in the catalytic bed, then the components reach the endof the system nearly after 175 s in spite of the residence time of thema-terial in the catalytic bed with almost 85 s. Having used this simulationfile, it is easy to find the optimum length of the reactor to reach thehighest conservation rate. The last point is about the highest concentra-tion of the DGwhich is observed at exactly themiddle of themembrane(0.2 m). The MG concentration pattern was also like the DG with a dif-ference that themaximum points shifted towards the second section ofmembrane length at almost 0.3 m of the iterance because the MG wasproduced by the second reaction (after DGproduction). For this compo-nent, the highest concentration is observed in about 400 s (nearly after7 min). Fig. 9(c) and (d) belongs to G and FAME. Both of these figuresdepict positive growth of G and FAME at different time periods in themembrane as the reactor length increases. Since the third reactionwas not completed, the maximum peaks were not available in the fig-ures which clearly indicate that the reactor length has not matchedwith the optimum value. The two differences in their pattern areabout increasing rate of their concentration which is much faster inFAME in comparison with G; because, G was produced only by the lastreaction but FAME was produced by three parallel reactions. This issuealso shifted the concentration graphs of G towards the end of themem-brane length. Finally, the last figure explains the methanol concentra-tion which depicts that its concentration profile was decreasingtowards the ceramic membrane but its consumption rate during thefirst minutes was much higher and after that it was decreasing tillreaching the stable rate. The highest consumption rate of MeOH wasobviously at the 0.2 m from the entrance of the reactor from wherethree parallel reactions were started to use it up. Then passing the ma-terial within the reactor during the time, the concentration becomesstable. Aswe expected byfinishing thefirst two reactions, the consump-tion rate of MEOH was also decreased.
6. Conclusion
Analysing the samples for triglyceride (TG), diglyceride (DG),monoglycride (MG), total fatty acid methyl esters (FAME) and glycerol(G) contents in stirrer vessels and the other open reaction vessels is notchallenging. However, in membrane reactors due to the conversion of
all sections, sample analysis in different sections of catalytic bed and ce-ramic membrane and also in different times is very difficult. In thisstudy, CFD simulation was applied to overcome such limitations. Theaim of this work is to investigate the capability of CFD simulation forreliable prediction of fluid dynamic, and component concentration in aceramic membrane reactor along with the catalytic bed. In addition,extracting some information cannot be easily exported from experi-mental works. The reactor contains two different layers; the catalyticlayer and ceramic membrane. The membrane was modelled as a selec-tive layer to produce biodiesel. It allows the permeation of all compo-nents except the triglyceride due to its droplet size which is biggerthan the ceramic membrane holes. The simulation was based onthree-dimensional (3D) numerical solutions from the combination ofNavier–Stokes and Brinkman equations for fluid flow in porous mediaalong with the Stephan–Maxwell for the mass transfer and reactions.Two different temperatures together with two different reaction rateshave been examined. In the hydrodynamic section the simulation re-sults of velocity outlet from the catalytic bed and ceramic membranewere compared with the experimental data. The results are satisfactorywith the maximum error of 8%. In the mass transfer and reactionsection, the simulation results were compared with the experimentalreaction yield with the maximum overestimation of 0.57% and 0.65%of deviations. This simulation file enables us to inspect the effect ofporosity in both hydrodynamic and mass transfer, scale up and findout the optimum size (both of the length and radius) of the catalyticbed and the ceramic membrane. It also helps us to investigate the roleof the initial value (oil to alcohol ratio and import flow rate of material)and find the optimum conditions. It can predict the concentration of dif-ferent components after each circulation as well, to reach the optimumcondition. Considering the importance of temperature and the otherparameters' dependency on it, error can be decreased.
Acknowledgements
The authors are grateful to the University of Malaya High Impact Re-search Grant (HIR-MOHE-D000038-16001) from theMinistry of HigherEducation Malaysia and University of Malaya Bright Spark Unit, whichfinancially supported this work. The authors would like to acknowledgeMahsa Ebrahim Moghaddam for English language editing.
References
[1] H. Zou, M. Lei, Optimum process and kinetic study of Jatropha curcas oilpre-esterification in ultrasonical field, Journal of the Taiwan Institute of ChemicalEngineers 43 (2012) 730–735.
[2] M.R. Monteiro, A.R.P. Ambrozin, L.M. Lião, A.G. Ferreira, Critical review on analyticalmethods for biodiesel characterization, Talanta 77 (2008) 593–605.
[3] Z. Yang, W. Xie, Soybean oil transesterification over zinc oxide modified with alkaliearth metals, Fuel Processing Technology 88 (2007) 631–638.
[4] A. Kawashima, K. Matsubara, K. Honda, Acceleration of catalytic activity ofcalcium oxide for biodiesel production, Bioresource Technology 100 (2009)696–700.
[5] G. Jing, P. Edward, E.C. Ray, J.K. Alex, S.W. Susan, M.D. Christopher, Wastecooking oil biodiesel use in two off-road diesel engines, ISRN Renewable Energy(2012) 1–10.
[6] I.M. Atadashi, M.K. Aroua, A.A. Aziz, Biodiesel separation and purification: a review,Renewable Energy 36 (2011) 437–443.
[7] E. Crabbe, C. Nolasco-Hipolito, G. Kobayashi, K. Sonomoto, A. Ishizaki, Biodieselproduction from crude palm oil and evaluation of butanol extraction and fuelproperties, Process Biochemistry 37 (2001) 65–71.
[8] S. Semwal, A.K. Arora, R.P. Badoni, D.K. Tuli, Biodiesel production using heteroge-neous catalysts, Bioresource Technology 102 (2011) 2151–2161.
[9] P.T. Vasudevan, M. Briggs, Biodiesel production—current state of the art andchallenges, Journal of Industrial Microbiology and Biotechnology 35 (2008)421–430.
[10] P. Cao, A.Y. Tremblay, M.A. Dubé, K. Morse, Effect of membrane pore size on theperformance of a membrane reactor for biodiesel production, Industrial andEngineering Chemistry Research 46 (2006) 52–58.
[11] I.M. Atadashi, M.K. Aroua, A.R. Abdul Aziz, N.M.N. Sulaiman, Membrane biodieselproduction and refining technology: a critical review, Renewable and SustainableEnergy Reviews 15 (2011) 5051–5062.
19B. Sajjadi et al. / Fuel Processing Technology 118 (2014) 7–19
[12] S.H. Shuit, Y.T. Ong, K.T. Lee, B. Subhash, S.H. Tan, Membrane technology as a prom-ising alternative in biodiesel production: a review, Biotechnology Advances 30(2012) 1364–1380.
[13] P. Cao, M.A. Dubé, A.Y. Tremblay, High-purity fatty acid methyl ester productionfrom canola, soybean, palm, and yellow grease lipids bymeans of a membrane reac-tor, Biomass and Bioenergy 32 (2008) 1028–1036.
[14] M. Dubé, A. Tremblay, J. Liu, Biodiesel production using a membrane reactor,Bioresource Technology 98 (2006) 639–647.
[15] S. Baroutian, M.K. Aroua, A.A.A. Raman, N.M.N. Sulaiman, Methanol recovery duringtransesterification of palm oil in a TiO2/Al2O3 membrane reactor: experimentalstudy and neural network modeling, Elsevier, Kidlington, Royaume-Uni, 2010.
[16] P. Cao, M.A. Dubé, A.Y. Tremblay, Methanol recycling in the production of biodieselin a membrane reactor, Fuel 87 (2008) 825–833.
[17] S. Baroutian, M.K. Aroua, A.A.A. Raman, N.M.N. Sulaiman, A packed bed membranereactor for production of biodiesel using activated carbon supported catalyst,Bioresource Technology 102 (2011) 1095–1102.
[18] I.M. Atadashi, M.K. Aroua, A.R. Abdul Aziz, N.M.N. Sulaiman, Membrane biodieselproduction and refining technology: a critical review, Renewable and SustainableEnergy Reviews 15 (2011) 5051–5062.
[19] A. D2500-91, Standard Test Method for Cloud Point of Petroleum Products, vol.05.01, ASTM International, 1995.
[20] A. D4052-96, Standard Test Method for Density and Relative Density of Liquids byDigital Density Meter, vol. 05.02, ASTM International, 1996.
[21] A. D445-06, Standard Test Method for Kinematic Viscosity of Transparent and OpaqueLiquids (and Calculation of Dynamic Viscosity), vol. 05.01, ASTM International, 2006.
[22] A. D5768-02, Standard Test Method for Determination of Iodine Value of Tall OilFatty Acids, vol. 05.01, ASTM International, 2002.
[23] A. D6584-07, Test Method for Determination of Free and Total Glycerine in B-100Biodiesel Methyl Esters by Gas Chromatography, ASTM International, 100 BarHarbor Drive, West Conshohocken, PA, USA, 2003.
[24] A. D664-06ae1, Standard Test Method for Acid Number of Petroleum Products byPotentiometric Titration, vol. 05.01, ASTM International, 2006.
[25] A. D93-07, Standard Test Methods for Flash Point by Pensky–Martens Closed CupTester, vol. 05.01, ASTM International, 2007.
[26] D. Darnoko, M. Cheryan, Kinetics of palm oil transesterification in a batch reactor,JAOCS 77 (2000) 1263–1268.
[27] BaroutianSaeid , K. Shahbaz, F. Mjalli Sabri, M.I. Alnashef, A.M. Hashim, Adsorptiveremoval of residual catalyst from palm biodiesel: application of response surfacemethodology, Hemijska Industrija 60 (2012) 92.
[28] R.B. Bird, W.E. Stewart, E.N. Lightfoot, Transport Phenomena, 2nd edition,John Wiley & Sons, Inc., New York, 2002.
[29] H. Liu, P.R. Patil, U. Narusawa, On Darcy–Brinkman equation: viscous flow betweentwo parallel plates packed with regular square arrays of cylinders, Entropy 9 (2007)118–131.
[30] U. Shavit, G. Bar-Yosef, R. Rosenzweig, Modified Brinkman equation for a free flowproblem at the interface of porous surfaces: the Cantor–Taylor brush configurationcase, Water Resources Research 38 (2002) 1–14.
[31] O.V. Vasilyev, K.R. Kevlahan, Hybrid wavelet collocation–Brinkman penalizationmethod for complex geometry ows, International Journal for Numerical Methodsin Fluids 40 (2002) 531–538.
[32] Q. Liu, O.V. Vasilyev, A Brinkman penalization method for compressible flows incomplex geometries, Journal of Computational Physics 227 (2007) 946–966.
[33] O.C. Zeinkiewicz, R.L. Taylor, The Finite Element Method, 5th ed. Oxford AucklandBoston Johannes, Boston, 2000.