
พายุหมุนเขตร้อน (Tropical Cyclone): กรณีภาคใต้ · พายุหมุนเขตร้อน (Tropical Cyclone): กรณีภาคใต้

Fuel Processing Technology 141 (2016) 148–158
Contents lists available at ScienceDirect
Fuel Processing Technology
j ourna l homepage: www.e lsev ie r .com/ locate / fuproc
Steam–oxygen gasification of forest residues and bark followed by hot gasfiltration and catalytic reforming of tars: Results of an extended time test
Esa Kurkela ⁎, Minna Kurkela, Ilkka HiltunenVTT Technical Research Centre of Finland Ltd, PO Box 1000, FI-02044 VTT, Finland
⁎ Corresponding author.E-mail address: [email protected] (E. Kurkela).
http://dx.doi.org/10.1016/j.fuproc.2015.06.0050378-3820/© 2015 VTT Technical Research Centre(http://creativecommons.org/licenses/by-nc-nd/4.0/).
a b s t r a c t
a r t i c l e i n f oArticle history:Received 2 March 2015Received in revised form 19 May 2015Accepted 1 June 2015Available online 15 June 2015
Keywords:BiomassGasificationFluidized-bedFiltrationReforming
Steam–oxygen gasification in a Circulating Fluidized-bed (CFB) reactor was developed for producing transporta-tion fuels from different wood residues. This article presents the results of a two week test campaign, in whichcrushed forest residues and industrial bark mixture were used as the feedstocks. The aim of the work was tocarry out extended time testing of the developed gasification and hot gas cleaning process and to determinethe fate of different gas contaminants and trace components of wood. In the test runs, wood fuels were gasifiedin the CFB reactor at a 0.2–0.25 MPa pressure using a mixture of steam and oxygen as the gasification agent. Amixture of sand and dolomitewas used as the bedmaterial in order tomaintain stablefluidization and to catalysein-situ tar decomposition before hot filtration. Raw gas was filtered at ca. 550 °C and the filtered gas was then ledinto a two-stage catalytic tar reformer. The gasifier performance and the concentrations of different gas contam-inants were determined at four different operating variable set points during a total of 215 h of operation. Theresults for carbon conversion efficiency, raw gas composition and the fate of fuel nitrogen, chlorine and tracemetals are presented in this paper. The concentrations of gas contaminants were determined after the ceramicfilter unit and after the catalytic reformer. The conversion efficiencies for hydrocarbon gases, tars and ammoniain the reformer are also presented. The test run was carried out as a continuous operation without any interrup-tions or operational problems.
© 2015 VTT Technical Research Centre of Finland Ltd. Published by Elsevier B.V. This is an open access articleunder the CC BY-NC-ND license (http://creativecommons.org/licenses/by-nc-nd/4.0/).
1. Introduction
Advanced 2nd generation biofuels can be produced from a widevariety of biomass feedstocks utilising many different biotechnical orthermochemical conversion pathways [1]. Gasification-based alterna-tives have two principal advantages over most other conversion routes.Firstly, a wide variety of biomass qualities as well as many wastestreams can be used as feedstock. Secondly, various different end prod-ucts (e.g., methanol, DME, Fischer Tropsch Diesel and Synthetic NaturalGas) can be produced fromamixture of hydrogen and carbonmonoxide(syngas).
Different types of fluidized-bed gasifiers have been industrially ap-plied in power and heat applications already since the 1980s. At presentseveral air-blown CFB gasifiers as well as dual fluidized-bed steam gas-ifiers operating at atmospheric pressure are in industrial use for exam-ple in Finland, Austria and Germany [1–3]. Atmospheric-pressure dualbed steam gasification has also recently been demonstrated in a semi-industrial scale production of Synthetic Natural Gas in Sweden [4].
of Finland Ltd. Published by
Pressurised oxygen-blown biomass gasification based on bubblingfluidised-bed reactors was also developed already in the 1980s inEurope and in the USA [5,6], but without commercial breakthrough. Inaddition, the first industrial scale pressurised fluidized-bed gasificationplants using brown coal and peat as the feedstock were operated inGermany and Finland in the late 1980s and early 1990s [7–9]. However,these gasification systems were initially developed for coal and not forbiomass feedstocks,which have significantly higher volatilematter con-tent and different ash composition. Very good operation experienceswere obtained at the High Temperature Winkler demonstration plantin Germany with Rhenish brown coal [7], whereas the operation withpeat at the Oulu ammonia plant in Finland already suffered from prob-lems related to the high tar content of syngas and sintering of the peatash [8,9]. At the Oulu gasification plant ash sintering problems limitedthe operation temperature of the gasifier to below 970 °C, resulting in0.5–1 g/m3 naphthalene concentrations. This led to deposit formationproblems in the final gas cooler and naphthalene condensation in thecooler of the syngas compression system [9]. In addition, ash sinteringand melting created deposits in the gas outlet pipe and in the cycloneand blocked the return leg of the recycling cyclone.
Previous studies on pressurised air-blown gasification of coal, peatand wood [10] have shown that tar yields in wood gasification were
Elsevier B.V. This is an open access article under the CC BY-NC-ND license
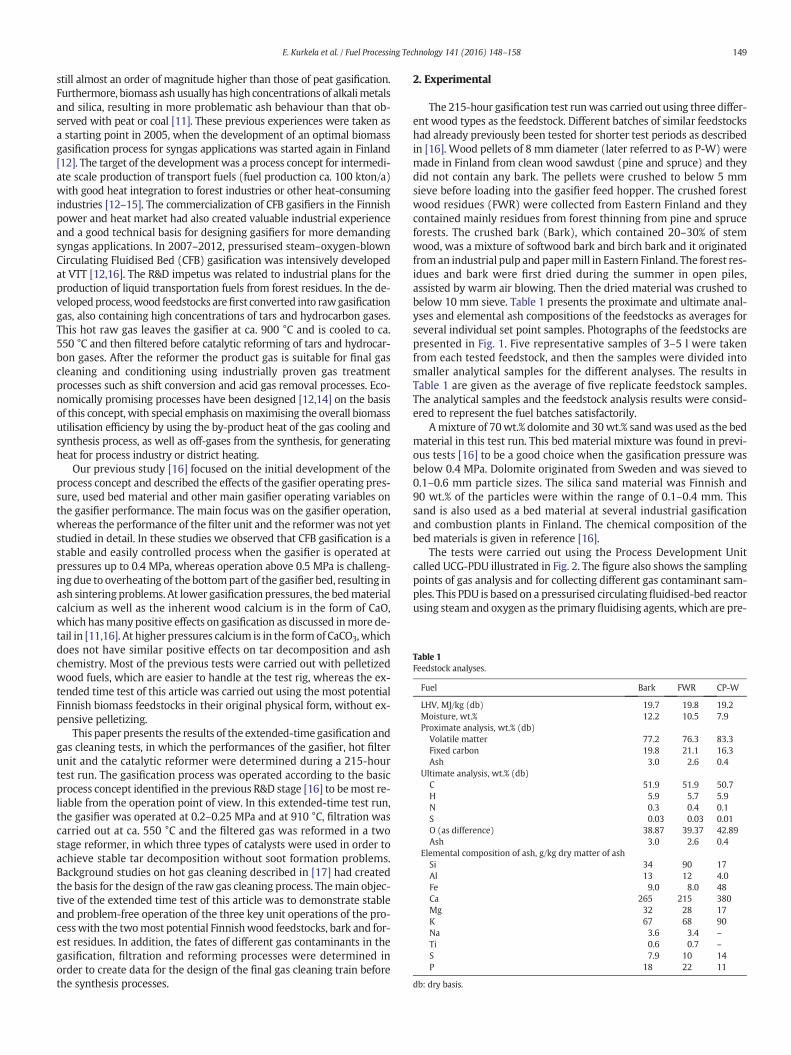
Table 1Feedstock analyses.
Fuel Bark FWR CP-W
LHV, MJ/kg (db) 19.7 19.8 19.2Moisture, wt.% 12.2 10.5 7.9Proximate analysis, wt.% (db)
Volatile matter 77.2 76.3 83.3Fixed carbon 19.8 21.1 16.3Ash 3.0 2.6 0.4
Ultimate analysis, wt.% (db)C 51.9 51.9 50.7H 5.9 5.7 5.9N 0.3 0.4 0.1S 0.03 0.03 0.01O (as difference) 38.87 39.37 42.89Ash 3.0 2.6 0.4
Elemental composition of ash, g/kg dry matter of ashSi 34 90 17Al 13 12 4.0Fe 9.0 8.0 48Ca 265 215 380Mg 32 28 17K 67 68 90Na 3.6 3.4 –Ti 0.6 0.7 –S 7.9 10 14P 18 22 11
db: dry basis.
149E. Kurkela et al. / Fuel Processing Technology 141 (2016) 148–158
still almost an order of magnitude higher than those of peat gasification.Furthermore, biomass ashusually hashigh concentrations of alkalimetalsand silica, resulting in more problematic ash behaviour than that ob-served with peat or coal [11]. These previous experiences were taken asa starting point in 2005, when the development of an optimal biomassgasification process for syngas applications was started again in Finland[12]. The target of the development was a process concept for intermedi-ate scale production of transport fuels (fuel production ca. 100 kton/a)with good heat integration to forest industries or other heat-consumingindustries [12–15]. The commercialization of CFB gasifiers in the Finnishpower and heat market had also created valuable industrial experienceand a good technical basis for designing gasifiers for more demandingsyngas applications. In 2007–2012, pressurised steam–oxygen-blownCirculating Fluidised Bed (CFB) gasification was intensively developedat VTT [12,16]. The R&D impetus was related to industrial plans for theproduction of liquid transportation fuels from forest residues. In the de-velopedprocess,wood feedstocks arefirst converted into rawgasificationgas, also containing high concentrations of tars and hydrocarbon gases.This hot raw gas leaves the gasifier at ca. 900 °C and is cooled to ca.550 °C and then filtered before catalytic reforming of tars and hydrocar-bon gases. After the reformer the product gas is suitable for final gascleaning and conditioning using industrially proven gas treatmentprocesses such as shift conversion and acid gas removal processes. Eco-nomically promising processes have been designed [12,14] on the basisof this concept, with special emphasis onmaximising the overall biomassutilisation efficiency by using the by-product heat of the gas cooling andsynthesis process, as well as off-gases from the synthesis, for generatingheat for process industry or district heating.
Our previous study [16] focused on the initial development of theprocess concept and described the effects of the gasifier operating pres-sure, used bed material and other main gasifier operating variables onthe gasifier performance. The main focus was on the gasifier operation,whereas the performance of the filter unit and the reformer was not yetstudied in detail. In these studies we observed that CFB gasification is astable and easily controlled process when the gasifier is operated atpressures up to 0.4 MPa, whereas operation above 0.5 MPa is challeng-ing due to overheating of the bottompart of the gasifier bed, resulting inash sintering problems. At lower gasification pressures, the bedmaterialcalcium as well as the inherent wood calcium is in the form of CaO,which hasmany positive effects on gasification as discussed inmore de-tail in [11,16]. At higher pressures calcium is in the formof CaCO3,whichdoes not have similar positive effects on tar decomposition and ashchemistry. Most of the previous tests were carried out with pelletizedwood fuels, which are easier to handle at the test rig, whereas the ex-tended time test of this article was carried out using the most potentialFinnish biomass feedstocks in their original physical form, without ex-pensive pelletizing.
This paper presents the results of the extended-time gasification andgas cleaning tests, in which the performances of the gasifier, hot filterunit and the catalytic reformer were determined during a 215-hourtest run. The gasification process was operated according to the basicprocess concept identified in the previous R&D stage [16] to bemost re-liable from the operation point of view. In this extended-time test run,the gasifier was operated at 0.2–0.25 MPa and at 910 °C, filtration wascarried out at ca. 550 °C and the filtered gas was reformed in a twostage reformer, in which three types of catalysts were used in order toachieve stable tar decomposition without soot formation problems.Background studies on hot gas cleaning described in [17] had createdthe basis for the design of the raw gas cleaning process. Themain objec-tive of the extended time test of this article was to demonstrate stableand problem-free operation of the three key unit operations of the pro-cesswith the twomost potential Finnishwood feedstocks, bark and for-est residues. In addition, the fates of different gas contaminants in thegasification, filtration and reforming processes were determined inorder to create data for the design of the final gas cleaning train beforethe synthesis processes.
2. Experimental
The 215-hour gasification test runwas carried out using three differ-ent wood types as the feedstock. Different batches of similar feedstockshad already previously been tested for shorter test periods as describedin [16]. Wood pellets of 8 mm diameter (later referred to as P-W) weremade in Finland from clean wood sawdust (pine and spruce) and theydid not contain any bark. The pellets were crushed to below 5 mmsieve before loading into the gasifier feed hopper. The crushed forestwood residues (FWR) were collected from Eastern Finland and theycontained mainly residues from forest thinning from pine and spruceforests. The crushed bark (Bark), which contained 20–30% of stemwood, was a mixture of softwood bark and birch bark and it originatedfrom an industrial pulp and papermill in Eastern Finland. The forest res-idues and bark were first dried during the summer in open piles,assisted by warm air blowing. Then the dried material was crushed tobelow 10 mm sieve. Table 1 presents the proximate and ultimate anal-yses and elemental ash compositions of the feedstocks as averages forseveral individual set point samples. Photographs of the feedstocks arepresented in Fig. 1. Five representative samples of 3–5 l were takenfrom each tested feedstock, and then the samples were divided intosmaller analytical samples for the different analyses. The results inTable 1 are given as the average of five replicate feedstock samples.The analytical samples and the feedstock analysis results were consid-ered to represent the fuel batches satisfactorily.
Amixture of 70wt.% dolomite and 30wt.% sandwas used as the bedmaterial in this test run. This bed material mixture was found in previ-ous tests [16] to be a good choice when the gasification pressure wasbelow 0.4 MPa. Dolomite originated from Sweden and was sieved to0.1–0.6 mm particle sizes. The silica sand material was Finnish and90 wt.% of the particles were within the range of 0.1–0.4 mm. Thissand is also used as a bed material at several industrial gasificationand combustion plants in Finland. The chemical composition of thebed materials is given in reference [16].
The tests were carried out using the Process Development Unitcalled UCG-PDU illustrated in Fig. 2. The figure also shows the samplingpoints of gas analysis and for collecting different gas contaminant sam-ples. This PDU is based on a pressurised circulatingfluidised-bed reactorusing steam and oxygen as the primary fluidising agents, which are pre-
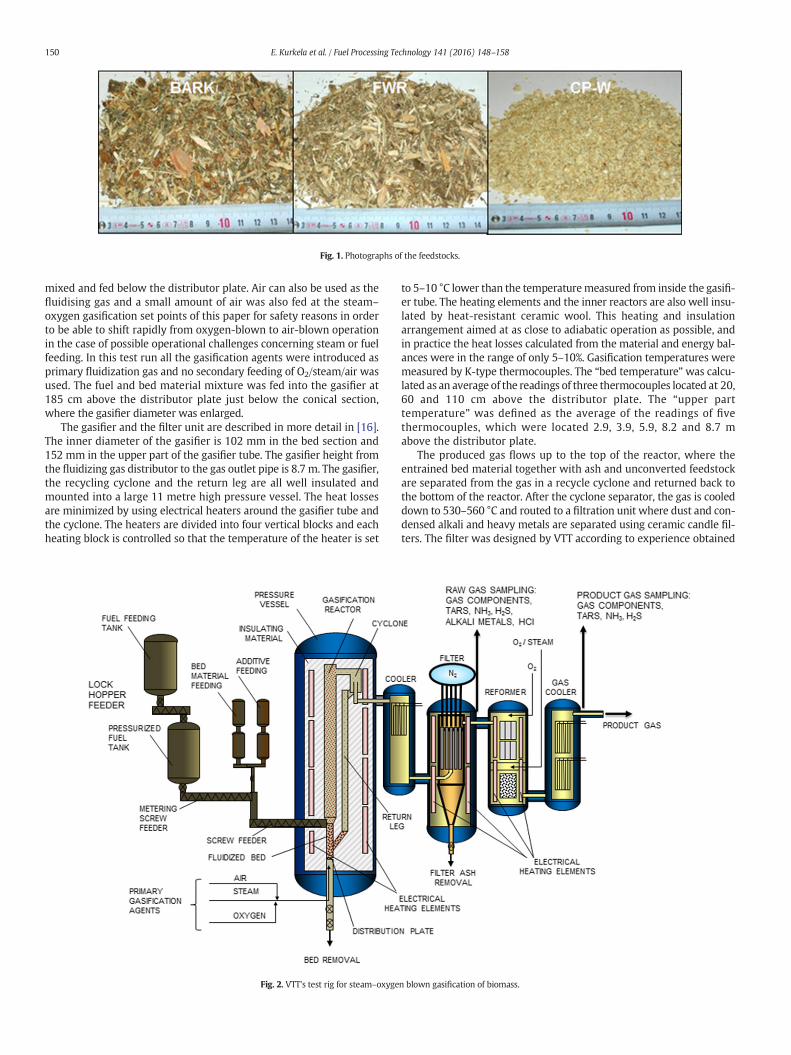
Fig. 1. Photographs of the feedstocks.
150 E. Kurkela et al. / Fuel Processing Technology 141 (2016) 148–158
mixed and fed below the distributor plate. Air can also be used as thefluidising gas and a small amount of air was also fed at the steam–oxygen gasification set points of this paper for safety reasons in orderto be able to shift rapidly from oxygen-blown to air-blown operationin the case of possible operational challenges concerning steam or fuelfeeding. In this test run all the gasification agents were introduced asprimary fluidization gas and no secondary feeding of O2/steam/air wasused. The fuel and bed material mixture was fed into the gasifier at185 cm above the distributor plate just below the conical section,where the gasifier diameter was enlarged.
The gasifier and the filter unit are described in more detail in [16].The inner diameter of the gasifier is 102 mm in the bed section and152 mm in the upper part of the gasifier tube. The gasifier height fromthe fluidizing gas distributor to the gas outlet pipe is 8.7 m. The gasifier,the recycling cyclone and the return leg are all well insulated andmounted into a large 11 metre high pressure vessel. The heat lossesare minimized by using electrical heaters around the gasifier tube andthe cyclone. The heaters are divided into four vertical blocks and eachheating block is controlled so that the temperature of the heater is set
Fig. 2. VTT's test rig for steam–oxyge
to 5–10 °C lower than the temperaturemeasured from inside the gasifi-er tube. The heating elements and the inner reactors are also well insu-lated by heat-resistant ceramic wool. This heating and insulationarrangement aimed at as close to adiabatic operation as possible, andin practice the heat losses calculated from the material and energy bal-ances were in the range of only 5–10%. Gasification temperatures weremeasured by K-type thermocouples. The “bed temperature”was calcu-lated as an average of the readings of three thermocouples located at 20,60 and 110 cm above the distributor plate. The “upper parttemperature” was defined as the average of the readings of fivethermocouples, which were located 2.9, 3.9, 5.9, 8.2 and 8.7 mabove the distributor plate.
The produced gas flows up to the top of the reactor, where theentrained bed material together with ash and unconverted feedstockare separated from the gas in a recycle cyclone and returned back tothe bottom of the reactor. After the cyclone separator, the gas is cooleddown to 530–560 °C and routed to a filtration unit where dust and con-densed alkali and heavy metals are separated using ceramic candle fil-ters. The filter was designed by VTT according to experience obtained
n blown gasification of biomass.
151E. Kurkela et al. / Fuel Processing Technology 141 (2016) 148–158
in IGCC-related projects realised in the 1990s [17,18]. The filterconsisted of 12 one-metre filter elements, which were organised infour pulse-cleaning clusters. Filter elements were mounted on a thickmetal tube sheet using an appropriate gasketmaterial to avoid leakages.The filter was designed for a face velocity of 1.5–2 cm/s. Relatively highfiltration surface area was needed due to the fact that the particle sizeand density of the char particles are rather low [17]. Dust cake was re-moved by using rapid cleaning pulses. One cluster of three elementswas pulsed at a time, and pulse cleaning intervals were controlled sothat stable pressure drop variation was achieved for a given gas flowrate. In this test run rigid candle filters (Pall Schumalith®) were usedas filter elements.
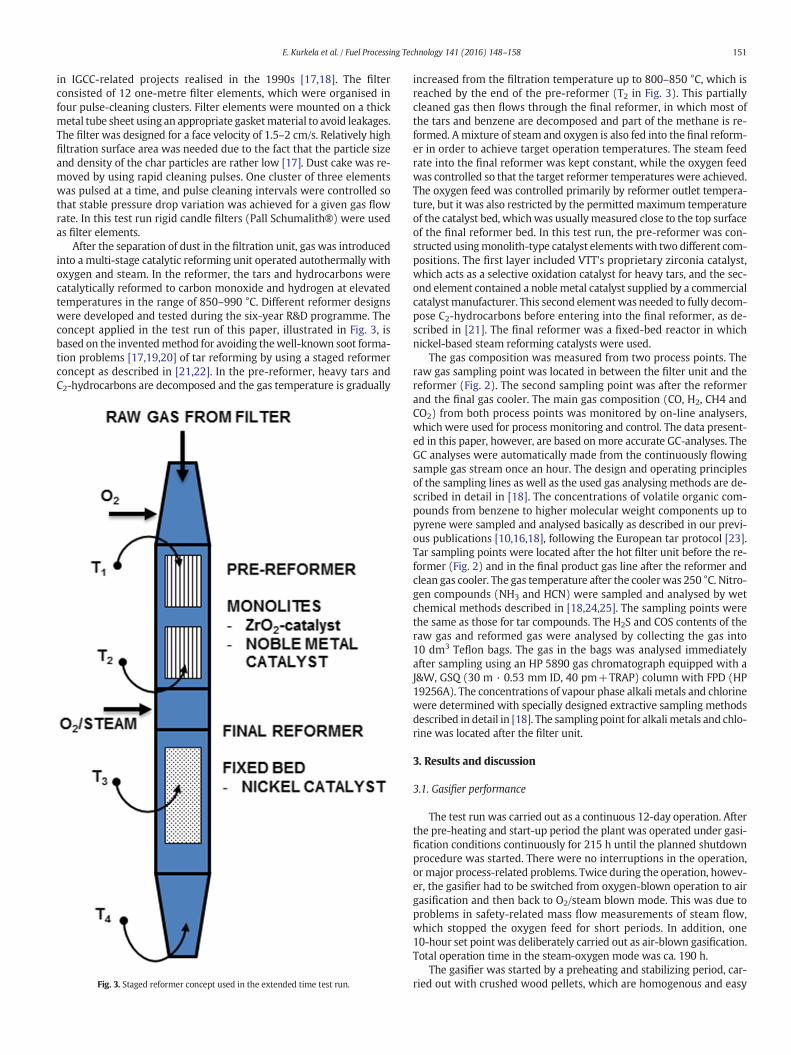
After the separation of dust in the filtration unit, gas was introducedinto a multi-stage catalytic reforming unit operated autothermally withoxygen and steam. In the reformer, the tars and hydrocarbons werecatalytically reformed to carbon monoxide and hydrogen at elevatedtemperatures in the range of 850–990 °C. Different reformer designswere developed and tested during the six-year R&D programme. Theconcept applied in the test run of this paper, illustrated in Fig. 3, isbased on the inventedmethod for avoiding thewell-known soot forma-tion problems [17,19,20] of tar reforming by using a staged reformerconcept as described in [21,22]. In the pre-reformer, heavy tars andC2-hydrocarbons are decomposed and the gas temperature is gradually
Fig. 3. Staged reformer concept used in the extended time test run.
increased from the filtration temperature up to 800–850 °C, which isreached by the end of the pre-reformer (T2 in Fig. 3). This partiallycleaned gas then flows through the final reformer, in which most ofthe tars and benzene are decomposed and part of the methane is re-formed. Amixture of steam and oxygen is also fed into the final reform-er in order to achieve target operation temperatures. The steam feedrate into the final reformer was kept constant, while the oxygen feedwas controlled so that the target reformer temperatures were achieved.The oxygen feed was controlled primarily by reformer outlet tempera-ture, but it was also restricted by the permitted maximum temperatureof the catalyst bed, whichwas usually measured close to the top surfaceof the final reformer bed. In this test run, the pre-reformer was con-structed usingmonolith-type catalyst elementswith two different com-positions. The first layer included VTT's proprietary zirconia catalyst,which acts as a selective oxidation catalyst for heavy tars, and the sec-ond element contained a noble metal catalyst supplied by a commercialcatalystmanufacturer. This second elementwas needed to fully decom-pose C2-hydrocarbons before entering into the final reformer, as de-scribed in [21]. The final reformer was a fixed-bed reactor in whichnickel-based steam reforming catalysts were used.
The gas composition was measured from two process points. Theraw gas sampling point was located in between the filter unit and thereformer (Fig. 2). The second sampling point was after the reformerand the final gas cooler. The main gas composition (CO, H2, CH4 andCO2) from both process points was monitored by on-line analysers,which were used for process monitoring and control. The data present-ed in this paper, however, are based onmore accurate GC-analyses. TheGC analyses were automatically made from the continuously flowingsample gas stream once an hour. The design and operating principlesof the sampling lines as well as the used gas analysing methods are de-scribed in detail in [18]. The concentrations of volatile organic com-pounds from benzene to higher molecular weight components up topyrene were sampled and analysed basically as described in our previ-ous publications [10,16,18], following the European tar protocol [23].Tar sampling points were located after the hot filter unit before the re-former (Fig. 2) and in the final product gas line after the reformer andclean gas cooler. The gas temperature after the coolerwas 250 °C. Nitro-gen compounds (NH3 and HCN) were sampled and analysed by wetchemical methods described in [18,24,25]. The sampling points werethe same as those for tar compounds. The H2S and COS contents of theraw gas and reformed gas were analysed by collecting the gas into10 dm3 Teflon bags. The gas in the bags was analysed immediatelyafter sampling using an HP 5890 gas chromatograph equipped with aJ&W, GSQ (30 m · 0.53 mm ID, 40 pm+TRAP) column with FPD (HP19256A). The concentrations of vapour phase alkali metals and chlorinewere determined with specially designed extractive sampling methodsdescribed in detail in [18]. The sampling point for alkali metals and chlo-rine was located after the filter unit.
3. Results and discussion
3.1. Gasifier performance
The test run was carried out as a continuous 12-day operation. Afterthe pre-heating and start-up period the plant was operated under gasi-fication conditions continuously for 215 h until the planned shutdownprocedure was started. There were no interruptions in the operation,or major process-related problems. Twice during the operation, howev-er, the gasifier had to be switched from oxygen-blown operation to airgasification and then back to O2/steam blown mode. This was due toproblems in safety-related mass flow measurements of steam flow,which stopped the oxygen feed for short periods. In addition, one10-hour set point was deliberately carried out as air-blown gasification.Total operation time in the steam-oxygen mode was ca. 190 h.
The gasifier was started by a preheating and stabilizing period, car-ried out with crushed wood pellets, which are homogenous and easy
152 E. Kurkela et al. / Fuel Processing Technology 141 (2016) 148–158
to feed into the gasifier. Then, several periods with constant operatingconditionswere completed using bark and forestwood residues. Finally,at the end of the test run the feedstock was switched back to crushedpellets. During the test run a total of 820 kg of crushed pellets,3920 kg of bark and 3190 kg of forest residueswere fed into the gasifier.Representative operational data for the selected set points carried outwith crushed bark (Bark), crushed forest wood residues (FWR) andcrushed wood pellets (CP-W) are presented in Table 2. The four setpoints selected for this paper were all carried out at a 0.2 MPa pressure.This pressure level was selected, instead of 0.4MPa, due to practical rea-sons related to the use of low bulk density wood fuels. At this pressurethe gasifier capacity was relatively low, resulting in reasonable loadingintervals of the wood feeding lock hopper system even with a fuel hav-ing a bulk density of only ca. 120 kg/m3.
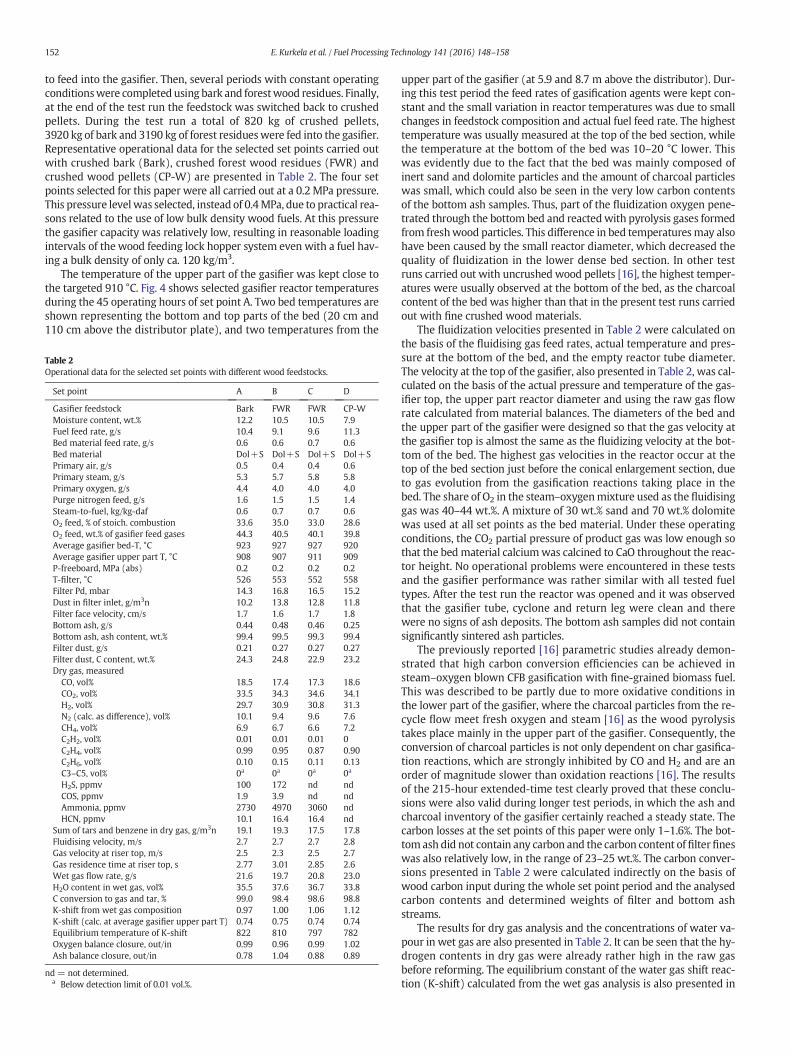
The temperature of the upper part of the gasifier was kept close tothe targeted 910 °C. Fig. 4 shows selected gasifier reactor temperaturesduring the 45 operating hours of set point A. Two bed temperatures areshown representing the bottom and top parts of the bed (20 cm and110 cm above the distributor plate), and two temperatures from the
Table 2Operational data for the selected set points with different wood feedstocks.
Set point A B C D
Gasifier feedstock Bark FWR FWR CP-WMoisture content, wt.% 12.2 10.5 10.5 7.9Fuel feed rate, g/s 10.4 9.1 9.6 11.3Bed material feed rate, g/s 0.6 0.6 0.7 0.6Bed material Dol+S Dol+S Dol+S Dol+SPrimary air, g/s 0.5 0.4 0.4 0.6Primary steam, g/s 5.3 5.7 5.8 5.8Primary oxygen, g/s 4.4 4.0 4.0 4.0Purge nitrogen feed, g/s 1.6 1.5 1.5 1.4Steam-to-fuel, kg/kg-daf 0.6 0.7 0.7 0.6O2 feed, % of stoich. combustion 33.6 35.0 33.0 28.6O2 feed, wt.% of gasifier feed gases 44.3 40.5 40.1 39.8Average gasifier bed-T, °C 923 927 927 920Average gasifier upper part T, °C 908 907 911 909P-freeboard, MPa (abs) 0.2 0.2 0.2 0.2T-filter, °C 526 553 552 558Filter Pd, mbar 14.3 16.8 16.5 15.2Dust in filter inlet, g/m3n 10.2 13.8 12.8 11.8Filter face velocity, cm/s 1.7 1.6 1.7 1.8Bottom ash, g/s 0.44 0.48 0.46 0.25Bottom ash, ash content, wt.% 99.4 99.5 99.3 99.4Filter dust, g/s 0.21 0.27 0.27 0.27Filter dust, C content, wt.% 24.3 24.8 22.9 23.2Dry gas, measured
CO, vol% 18.5 17.4 17.3 18.6CO2, vol% 33.5 34.3 34.6 34.1H2, vol% 29.7 30.9 30.8 31.3N2 (calc. as difference), vol% 10.1 9.4 9.6 7.6CH4, vol% 6.9 6.7 6.6 7.2C2H2, vol% 0.01 0.01 0.01 0C2H4, vol% 0.99 0.95 0.87 0.90C2H6, vol% 0.10 0.15 0.11 0.13C3–C5, vol% 0a 0a 0a 0a
H2S, ppmv 100 172 nd ndCOS, ppmv 1.9 3.9 nd ndAmmonia, ppmv 2730 4970 3060 ndHCN, ppmv 10.1 16.4 16.4 nd
Sum of tars and benzene in dry gas, g/m3n 19.1 19.3 17.5 17.8Fluidising velocity, m/s 2.7 2.7 2.7 2.8Gas velocity at riser top, m/s 2.5 2.3 2.5 2.7Gas residence time at riser top, s 2.77 3.01 2.85 2.6Wet gas flow rate, g/s 21.6 19.7 20.8 23.0H2O content in wet gas, vol% 35.5 37.6 36.7 33.8C conversion to gas and tar, % 99.0 98.4 98.6 98.8K-shift from wet gas composition 0.97 1.00 1.06 1.12K-shift (calc. at average gasifier upper part T) 0.74 0.75 0.74 0.74Equilibrium temperature of K-shift 822 810 797 782Oxygen balance closure, out/in 0.99 0.96 0.99 1.02Ash balance closure, out/in 0.78 1.04 0.88 0.89
nd = not determined.a Below detection limit of 0.01 vol.%.
upper part of the gasifier (at 5.9 and 8.7 m above the distributor). Dur-ing this test period the feed rates of gasification agents were kept con-stant and the small variation in reactor temperatures was due to smallchanges in feedstock composition and actual fuel feed rate. The highesttemperature was usually measured at the top of the bed section, whilethe temperature at the bottom of the bed was 10–20 °C lower. Thiswas evidently due to the fact that the bed was mainly composed ofinert sand and dolomite particles and the amount of charcoal particleswas small, which could also be seen in the very low carbon contentsof the bottom ash samples. Thus, part of the fluidization oxygen pene-trated through the bottom bed and reactedwith pyrolysis gases formedfrom freshwood particles. This difference in bed temperaturesmay alsohave been caused by the small reactor diameter, which decreased thequality of fluidization in the lower dense bed section. In other testruns carried out with uncrushed wood pellets [16], the highest temper-atures were usually observed at the bottom of the bed, as the charcoalcontent of the bed was higher than that in the present test runs carriedout with fine crushed wood materials.
The fluidization velocities presented in Table 2 were calculated onthe basis of the fluidising gas feed rates, actual temperature and pres-sure at the bottom of the bed, and the empty reactor tube diameter.The velocity at the top of the gasifier, also presented in Table 2, was cal-culated on the basis of the actual pressure and temperature of the gas-ifier top, the upper part reactor diameter and using the raw gas flowrate calculated from material balances. The diameters of the bed andthe upper part of the gasifier were designed so that the gas velocity atthe gasifier top is almost the same as the fluidizing velocity at the bot-tom of the bed. The highest gas velocities in the reactor occur at thetop of the bed section just before the conical enlargement section, dueto gas evolution from the gasification reactions taking place in thebed. The share of O2 in the steam–oxygenmixture used as the fluidisinggas was 40–44 wt.%. A mixture of 30 wt.% sand and 70 wt.% dolomitewas used at all set points as the bed material. Under these operatingconditions, the CO2 partial pressure of product gas was low enough sothat the bed material calciumwas calcined to CaO throughout the reac-tor height. No operational problems were encountered in these testsand the gasifier performance was rather similar with all tested fueltypes. After the test run the reactor was opened and it was observedthat the gasifier tube, cyclone and return leg were clean and therewere no signs of ash deposits. The bottom ash samples did not containsignificantly sintered ash particles.
The previously reported [16] parametric studies already demon-strated that high carbon conversion efficiencies can be achieved insteam–oxygen blown CFB gasification with fine-grained biomass fuel.This was described to be partly due to more oxidative conditions inthe lower part of the gasifier, where the charcoal particles from the re-cycle flow meet fresh oxygen and steam [16] as the wood pyrolysistakes place mainly in the upper part of the gasifier. Consequently, theconversion of charcoal particles is not only dependent on char gasifica-tion reactions, which are strongly inhibited by CO and H2 and are anorder of magnitude slower than oxidation reactions [16]. The resultsof the 215-hour extended-time test clearly proved that these conclu-sions were also valid during longer test periods, in which the ash andcharcoal inventory of the gasifier certainly reached a steady state. Thecarbon losses at the set points of this paper were only 1–1.6%. The bot-tom ash did not contain any carbon and the carbon content of filterfineswas also relatively low, in the range of 23–25 wt.%. The carbon conver-sions presented in Table 2 were calculated indirectly on the basis ofwood carbon input during the whole set point period and the analysedcarbon contents and determined weights of filter and bottom ashstreams.
The results for dry gas analysis and the concentrations of water va-pour in wet gas are also presented in Table 2. It can be seen that the hy-drogen contents in dry gas were already rather high in the raw gasbefore reforming. The equilibrium constant of the water gas shift reac-tion (K-shift) calculated from the wet gas analysis is also presented in

Fig. 4. Selected gasifier reactor temperatures at set point A.
Table 3GC tar analyses for the set points.
Set point A B C D
Fuel Bark FWR FWR CP-WConcentration, mg/m3n in dry gasBenzene 13,757 13,605 12,733 12,806Pyridine 27 65 38 71H-Pyrrole 0 0 0 0Toluene 200 212 165 160Ethenylbenzene 33 41 32 20m-Xylene 0 0 0 0Ethynylbenzene 2 1 1 1Styrene 119 113 90 112o-Xylene 0 0 0 0Benzaldehyde 0 0 0 0Phenol 10 12 10 10Benzonitrile 0 0 0 04-Methylstyrene 0 0 0 0Indene 111 144 108 110o-Cresol 0 0 0 0m+p-Cresol 0 0 0 0Naphthalene 3304 3376 2942 3089Quinoline 0 8 3 0Isoquinoline 0 0 0 01H-Indole 0 0 0 02-Methylnaphthalene 23 25 20 201-Methylnaphthalene 15 17 14 14Biphenyl 74 76 62 652-Ethylnaphthalene 16 15 11 9Acenaphthylene 298 377 302 363Acenaphthene 199 199 162 132Dibenzofurane 12 25 18 19Bibenzyl 0 0 0 02-Methyl-1-Naphthol 9 12 9 10Fluorene 30 44 30 33Phenanthere 492 541 444 472Anthracene 81 100 79 844H-Cyclopenta(def)Phenantherene 8 12 9 10Fluoranthene 129 169 132 153Benz(e)acenaphthylene 12 17 13 18Pyrene 108 133 102 124Sum of tars 5312 5735 4796 5034Sum of tars and benzene 19,069 19,340 17,529 17,840Benzene 13,757 13,605 12,733 12,806Light tars 502 589 445 419Naphthalene 3304 3376 2942 3089Heavier PAC 1506 1770 1409 1525
153E. Kurkela et al. / Fuel Processing Technology 141 (2016) 148–158
Table 2. This measured K-value can be compared to the equilibriumK-value calculated at the average gasifier upper part temperatureusing the equation given by Rhinehart et al. [26]. In addition, Table 2also shows the equilibrium temperature which would give the K-value corresponding to the measured gas composition. It should bementioned that the sampling point of gas analysis was located afterthe ceramic filter unit, where the process temperature was ca. 500 °C.Comparison of the K-value data shown in Table 2 indicates that thewater gas shift reaction was still continuing in the cyclone and in theupper part of the gas cooler, and the gas composition corresponded tothe equilibrium calculated at 780–820 °C. Methane and C2H4 were themost significant hydrocarbon gases, with lower concentrations of C2H2
and C2H6. The concentrations of C3–C5 hydrocarbon gases were belowthe detection limit of the used gas chromatographic analysis method(b0.01%).
Elemental material balances were calculated from the average mea-suring data for each set point in a way similar to that described in ourprevious air-blown gasification tests [10,18]. However, in oxygen–blown gasification the nitrogen balance could not be used for calculat-ing the dry gas flow rate due to the low input of nitrogen and due tothe fact that part of the purge nitrogen,whichwas fed into the fuel feed-ing lock-hoppers and ash removal hoppers, evidently did not enter intothe product gas but escaped from the hoppers during pressurising anddepressurising cycles. Neither was it possible to accurately measurethe flow rate of hot raw gas containing tar. Consequently, the elementalcarbon balance was used to calculate the dry gas flow rate. Hydrogenbalance was similarly used for calculating the water vapour mass flow.In this method the inaccuracies of all measurements and of thematerialbalance calculation accumulate in the oxygen balance. At these setpoints the oxygen balance closure was reasonably good. The ash bal-ances were directly calculated from output and input figures using theaverage analyses and weighed amounts of wood and bed material asthe input and the analyses and weighing results of the bottom ash andfilter fines as the output. Despite the long set points and careful analy-ses, the ash balance closures were not fully satisfactory. This is at leastpartly due to the low ash content of wood fuels, and similar inaccuracieshave also been reported in previous experiments [11,27,28].
Measured concentrations of different tar components are presentedin Table 3. In addition to the individual concentrations, the sum of lighttars (from Pyridine to Cresol) and the sum of PAC compounds heavierthan naphthalene are presented. Total tar concentration in the dry gaswas in the range of 4.8–5.7 g/m3n and that of benzene varied in the
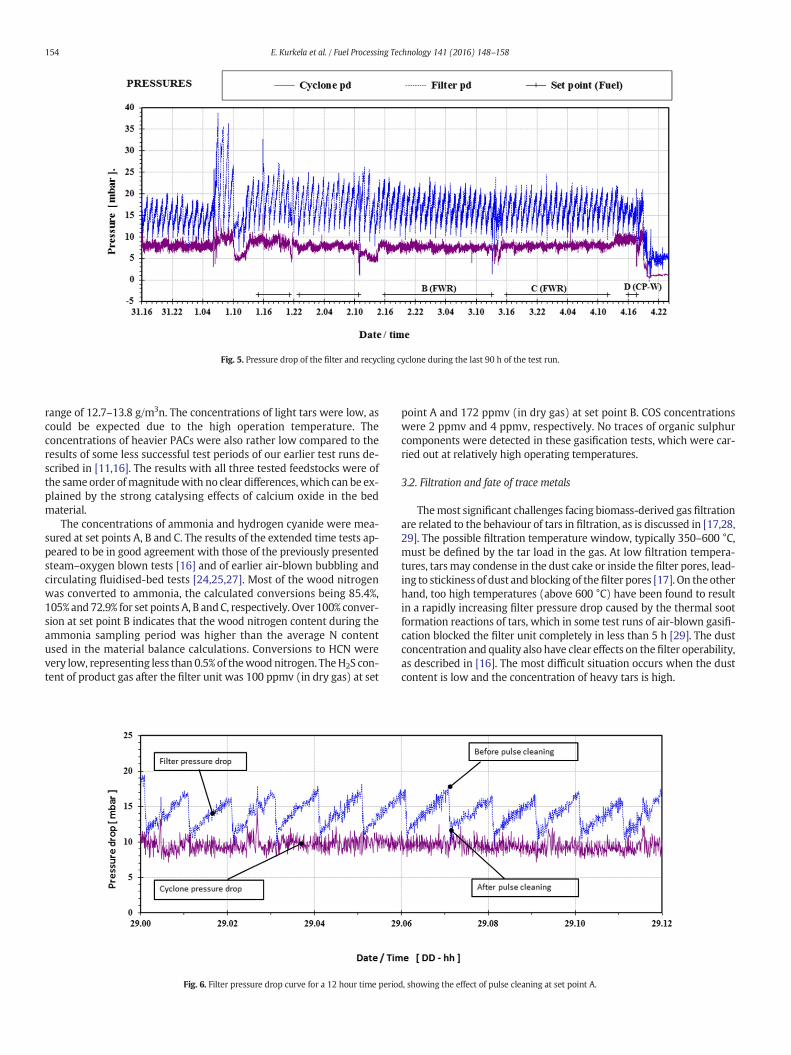
Fig. 5. Pressure drop of the filter and recycling cyclone during the last 90 h of the test run.
154 E. Kurkela et al. / Fuel Processing Technology 141 (2016) 148–158
range of 12.7–13.8 g/m3n. The concentrations of light tars were low, ascould be expected due to the high operation temperature. Theconcentrations of heavier PACs were also rather low compared to theresults of some less successful test periods of our earlier test runs de-scribed in [11,16]. The results with all three tested feedstocks were ofthe same order ofmagnitudewith no clear differences,which can be ex-plained by the strong catalysing effects of calcium oxide in the bedmaterial.
The concentrations of ammonia and hydrogen cyanide were mea-sured at set points A, B and C. The results of the extended time tests ap-peared to be in good agreement with those of the previously presentedsteam–oxygen blown tests [16] and of earlier air-blown bubbling andcirculating fluidised-bed tests [24,25,27]. Most of the wood nitrogenwas converted to ammonia, the calculated conversions being 85.4%,105% and 72.9% for set points A, B andC, respectively. Over 100% conver-sion at set point B indicates that the wood nitrogen content during theammonia sampling period was higher than the average N contentused in the material balance calculations. Conversions to HCN werevery low, representing less than 0.5%of thewood nitrogen. TheH2S con-tent of product gas after the filter unit was 100 ppmv (in dry gas) at set
Fig. 6. Filter pressure drop curve for a 12 hour time perio
point A and 172 ppmv (in dry gas) at set point B. COS concentrationswere 2 ppmv and 4 ppmv, respectively. No traces of organic sulphurcomponents were detected in these gasification tests, which were car-ried out at relatively high operating temperatures.
3.2. Filtration and fate of trace metals
Themost significant challenges facing biomass-derived gas filtrationare related to the behaviour of tars in filtration, as is discussed in [17,28,29]. The possible filtration temperature window, typically 350–600 °C,must be defined by the tar load in the gas. At low filtration tempera-tures, tarsmay condense in the dust cake or inside the filter pores, lead-ing to stickiness of dust and blocking of thefilter pores [17]. On the otherhand, too high temperatures (above 600 °C) have been found to resultin a rapidly increasing filter pressure drop caused by the thermal sootformation reactions of tars, which in some test runs of air-blown gasifi-cation blocked the filter unit completely in less than 5 h [29]. The dustconcentration and quality also have clear effects on thefilter operability,as described in [16]. The most difficult situation occurs when the dustcontent is low and the concentration of heavy tars is high.
d, showing the effect of pulse cleaning at set point A.
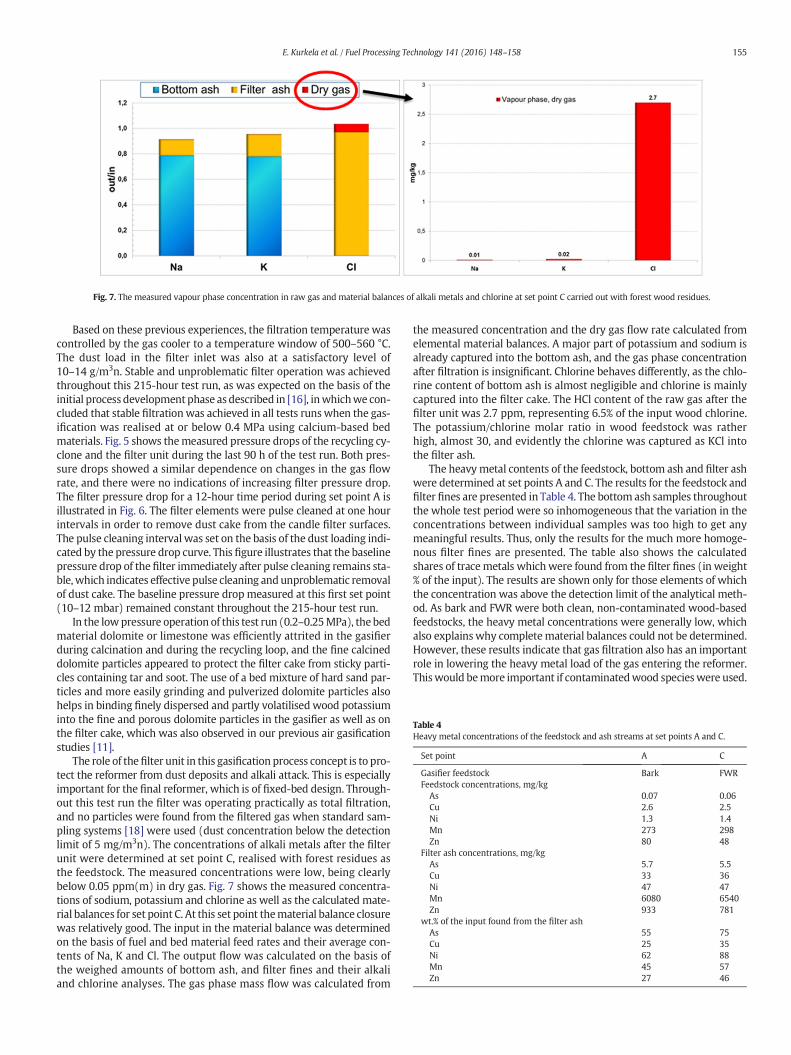
Table 4Heavy metal concentrations of the feedstock and ash streams at set points A and C.
Set point A C
Gasifier feedstock Bark FWRFeedstock concentrations, mg/kg
As 0.07 0.06Cu 2.6 2.5Ni 1.3 1.4Mn 273 298Zn 80 48
Filter ash concentrations, mg/kgAs 5.7 5.5Cu 33 36Ni 47 47Mn 6080 6540Zn 933 781
wt.% of the input found from the filter ashAs 55 75Cu 25 35Ni 62 88Mn 45 57Zn 27 46
Fig. 7. The measured vapour phase concentration in raw gas and material balances of alkali metals and chlorine at set point C carried out with forest wood residues.
155E. Kurkela et al. / Fuel Processing Technology 141 (2016) 148–158
Based on these previous experiences, the filtration temperature wascontrolled by the gas cooler to a temperature window of 500–560 °C.The dust load in the filter inlet was also at a satisfactory level of10–14 g/m3n. Stable and unproblematic filter operation was achievedthroughout this 215-hour test run, as was expected on the basis of theinitial process development phase as described in [16], inwhichwe con-cluded that stable filtrationwas achieved in all tests runs when the gas-ification was realised at or below 0.4 MPa using calcium-based bedmaterials. Fig. 5 shows themeasured pressure drops of the recycling cy-clone and the filter unit during the last 90 h of the test run. Both pres-sure drops showed a similar dependence on changes in the gas flowrate, and there were no indications of increasing filter pressure drop.The filter pressure drop for a 12-hour time period during set point A isillustrated in Fig. 6. The filter elements were pulse cleaned at one hourintervals in order to remove dust cake from the candle filter surfaces.The pulse cleaning interval was set on the basis of the dust loading indi-cated by the pressure drop curve. This figure illustrates that the baselinepressure drop of the filter immediately after pulse cleaning remains sta-ble,which indicates effective pulse cleaning andunproblematic removalof dust cake. The baseline pressure drop measured at this first set point(10–12 mbar) remained constant throughout the 215-hour test run.
In the lowpressure operation of this test run (0.2–0.25MPa), the bedmaterial dolomite or limestone was efficiently attrited in the gasifierduring calcination and during the recycling loop, and the fine calcineddolomite particles appeared to protect the filter cake from sticky parti-cles containing tar and soot. The use of a bed mixture of hard sand par-ticles and more easily grinding and pulverized dolomite particles alsohelps in binding finely dispersed and partly volatilised wood potassiuminto the fine and porous dolomite particles in the gasifier as well as onthe filter cake, which was also observed in our previous air gasificationstudies [11].
The role of thefilter unit in this gasification process concept is to pro-tect the reformer from dust deposits and alkali attack. This is especiallyimportant for the final reformer, which is of fixed-bed design. Through-out this test run the filter was operating practically as total filtration,and no particles were found from the filtered gas when standard sam-pling systems [18] were used (dust concentration below the detectionlimit of 5 mg/m3n). The concentrations of alkali metals after the filterunit were determined at set point C, realised with forest residues asthe feedstock. The measured concentrations were low, being clearlybelow 0.05 ppm(m) in dry gas. Fig. 7 shows the measured concentra-tions of sodium, potassium and chlorine as well as the calculated mate-rial balances for set point C. At this set point thematerial balance closurewas relatively good. The input in the material balance was determinedon the basis of fuel and bed material feed rates and their average con-tents of Na, K and Cl. The output flow was calculated on the basis ofthe weighed amounts of bottom ash, and filter fines and their alkaliand chlorine analyses. The gas phase mass flow was calculated from
the measured concentration and the dry gas flow rate calculated fromelemental material balances. A major part of potassium and sodium isalready captured into the bottom ash, and the gas phase concentrationafter filtration is insignificant. Chlorine behaves differently, as the chlo-rine content of bottom ash is almost negligible and chlorine is mainlycaptured into the filter cake. The HCl content of the raw gas after thefilter unit was 2.7 ppm, representing 6.5% of the input wood chlorine.The potassium/chlorine molar ratio in wood feedstock was ratherhigh, almost 30, and evidently the chlorine was captured as KCl intothe filter ash.
The heavy metal contents of the feedstock, bottom ash and filter ashwere determined at set points A and C. The results for the feedstock andfilter fines are presented in Table 4. The bottom ash samples throughoutthe whole test period were so inhomogeneous that the variation in theconcentrations between individual samples was too high to get anymeaningful results. Thus, only the results for the much more homoge-nous filter fines are presented. The table also shows the calculatedshares of tracemetals whichwere found from the filter fines (in weight% of the input). The results are shown only for those elements of whichthe concentration was above the detection limit of the analytical meth-od. As bark and FWR were both clean, non-contaminated wood-basedfeedstocks, the heavy metal concentrations were generally low, whichalso explainswhy completematerial balances could not be determined.However, these results indicate that gas filtration also has an importantrole in lowering the heavy metal load of the gas entering the reformer.Thiswould bemore important if contaminatedwood specieswere used.
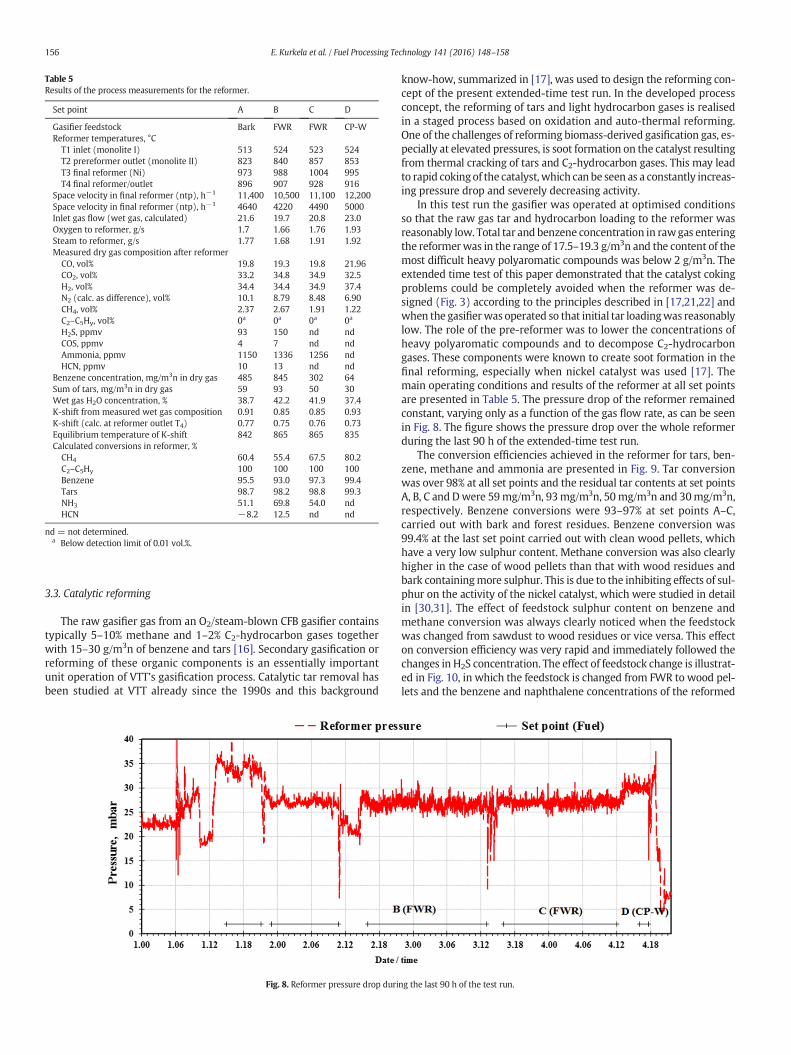
Table 5Results of the process measurements for the reformer.
Set point A B C D
Gasifier feedstock Bark FWR FWR CP-WReformer temperatures, °C
T1 inlet (monolite I) 513 524 523 524T2 prereformer outlet (monolite II) 823 840 857 853T3 final reformer (Ni) 973 988 1004 995T4 final reformer/outlet 896 907 928 916
Space velocity in final reformer (ntp), h−1 11,400 10,500 11,100 12,200Space velocity in final reformer (ntp), h−1 4640 4220 4490 5000Inlet gas flow (wet gas, calculated) 21.6 19.7 20.8 23.0Oxygen to reformer, g/s 1.7 1.66 1.76 1.93Steam to reformer, g/s 1.77 1.68 1.91 1.92Measured dry gas composition after reformer
CO, vol% 19.8 19.3 19.8 21.96CO2, vol% 33.2 34.8 34.9 32.5H2, vol% 34.4 34.4 34.9 37.4N2 (calc. as difference), vol% 10.1 8.79 8.48 6.90CH4, vol% 2.37 2.67 1.91 1.22C2–C5Hy, vol% 0a 0a 0a 0a
H2S, ppmv 93 150 nd ndCOS, ppmv 4 7 nd ndAmmonia, ppmv 1150 1336 1256 ndHCN, ppmv 10 13 nd nd
Benzene concentration, mg/m3n in dry gas 485 845 302 64Sum of tars, mg/m3n in dry gas 59 93 50 30Wet gas H2O concentration, % 38.7 42.2 41.9 37.4K-shift from measured wet gas composition 0.91 0.85 0.85 0.93K-shift (calc. at reformer outlet T4) 0.77 0.75 0.76 0.73Equilibrium temperature of K-shift 842 865 865 835Calculated conversions in reformer, %
CH4 60.4 55.4 67.5 80.2C2–C5Hy 100 100 100 100Benzene 95.5 93.0 97.3 99.4Tars 98.7 98.2 98.8 99.3NH3 51.1 69.8 54.0 ndHCN −8.2 12.5 nd nd
nd = not determined.a Below detection limit of 0.01 vol.%.
156 E. Kurkela et al. / Fuel Processing Technology 141 (2016) 148–158
3.3. Catalytic reforming
The raw gasifier gas from an O2/steam-blown CFB gasifier containstypically 5–10% methane and 1–2% C2-hydrocarbon gases togetherwith 15–30 g/m3n of benzene and tars [16]. Secondary gasification orreforming of these organic components is an essentially importantunit operation of VTT's gasification process. Catalytic tar removal hasbeen studied at VTT already since the 1990s and this background
Fig. 8. Reformer pressure drop duri
know-how, summarized in [17], was used to design the reforming con-cept of the present extended-time test run. In the developed processconcept, the reforming of tars and light hydrocarbon gases is realisedin a staged process based on oxidation and auto-thermal reforming.One of the challenges of reforming biomass-derived gasification gas, es-pecially at elevated pressures, is soot formation on the catalyst resultingfrom thermal cracking of tars and C2-hydrocarbon gases. This may leadto rapid cokingof the catalyst, which can be seen as a constantly increas-ing pressure drop and severely decreasing activity.
In this test run the gasifier was operated at optimised conditionsso that the raw gas tar and hydrocarbon loading to the reformer wasreasonably low. Total tar and benzene concentration in rawgas enteringthe reformerwas in the range of 17.5–19.3 g/m3n and the content of themost difficult heavy polyaromatic compounds was below 2 g/m3n. Theextended time test of this paper demonstrated that the catalyst cokingproblems could be completely avoided when the reformer was de-signed (Fig. 3) according to the principles described in [17,21,22] andwhen the gasifierwas operated so that initial tar loadingwas reasonablylow. The role of the pre-reformer was to lower the concentrations ofheavy polyaromatic compounds and to decompose C2-hydrocarbongases. These components were known to create soot formation in thefinal reforming, especially when nickel catalyst was used [17]. Themain operating conditions and results of the reformer at all set pointsare presented in Table 5. The pressure drop of the reformer remainedconstant, varying only as a function of the gas flow rate, as can be seenin Fig. 8. The figure shows the pressure drop over the whole reformerduring the last 90 h of the extended-time test run.
The conversion efficiencies achieved in the reformer for tars, ben-zene, methane and ammonia are presented in Fig. 9. Tar conversionwas over 98% at all set points and the residual tar contents at set pointsA, B, C and Dwere 59mg/m3n, 93mg/m3n, 50mg/m3n and 30mg/m3n,respectively. Benzene conversions were 93–97% at set points A–C,carried out with bark and forest residues. Benzene conversion was99.4% at the last set point carried out with clean wood pellets, whichhave a very low sulphur content. Methane conversion was also clearlyhigher in the case of wood pellets than that with wood residues andbark containingmore sulphur. This is due to the inhibiting effects of sul-phur on the activity of the nickel catalyst, which were studied in detailin [30,31]. The effect of feedstock sulphur content on benzene andmethane conversion was always clearly noticed when the feedstockwas changed from sawdust to wood residues or vice versa. This effecton conversion efficiency was very rapid and immediately followed thechanges in H2S concentration. The effect of feedstock change is illustrat-ed in Fig. 10, in which the feedstock is changed from FWR to wood pel-lets and the benzene and naphthalene concentrations of the reformed
ng the last 90 h of the test run.
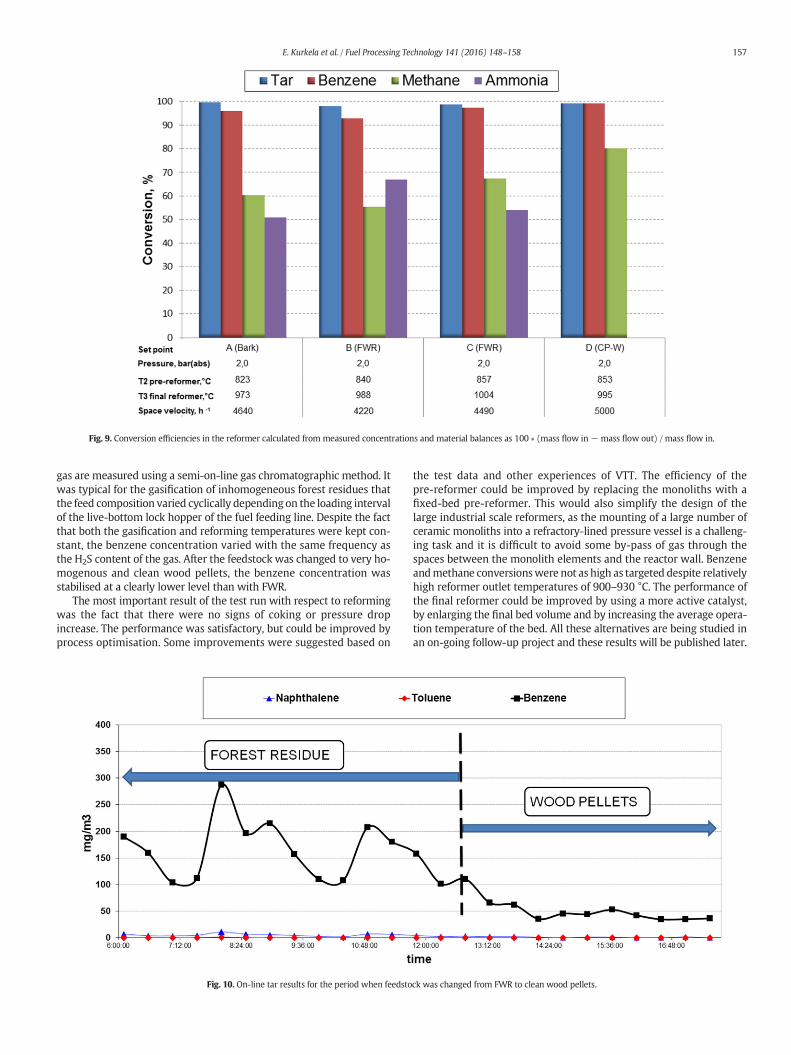
Fig. 9. Conversion efficiencies in the reformer calculated from measured concentrations and material balances as 100 ∗ (mass flow in− mass flow out) / mass flow in.
157E. Kurkela et al. / Fuel Processing Technology 141 (2016) 148–158
gas are measured using a semi-on-line gas chromatographic method. Itwas typical for the gasification of inhomogeneous forest residues thatthe feed composition varied cyclically depending on the loading intervalof the live-bottom lock hopper of the fuel feeding line. Despite the factthat both the gasification and reforming temperatures were kept con-stant, the benzene concentration varied with the same frequency asthe H2S content of the gas. After the feedstock was changed to very ho-mogenous and clean wood pellets, the benzene concentration wasstabilised at a clearly lower level than with FWR.
The most important result of the test run with respect to reformingwas the fact that there were no signs of coking or pressure dropincrease. The performance was satisfactory, but could be improved byprocess optimisation. Some improvements were suggested based on
Fig. 10. On-line tar results for the period when feedsto
the test data and other experiences of VTT. The efficiency of thepre-reformer could be improved by replacing the monoliths with afixed-bed pre-reformer. This would also simplify the design of thelarge industrial scale reformers, as the mounting of a large number ofceramic monoliths into a refractory-lined pressure vessel is a challeng-ing task and it is difficult to avoid some by-pass of gas through thespaces between the monolith elements and the reactor wall. Benzeneandmethane conversionswere not as high as targeted despite relativelyhigh reformer outlet temperatures of 900–930 °C. The performance ofthe final reformer could be improved by using a more active catalyst,by enlarging the final bed volume and by increasing the average opera-tion temperature of the bed. All these alternatives are being studied inan on-going follow-up project and these results will be published later.
ck was changed from FWR to clean wood pellets.
158 E. Kurkela et al. / Fuel Processing Technology 141 (2016) 148–158
4. Conclusions
The 215-hour extended time test was realised as an uninterruptedcontinuous gasification test run, without any process-related problems.The operation of the gasifier, ceramic filter and the catalytic reformerwas smooth and stable set points could be carried out with all threefeedstocks: industrial bark mixture, forest wood residues and crushedwood pellets. The test run demonstrated the technical feasibility of thebasic syngas production concept of VTT, which is based on steam–oxygen gasification at below 0.4 MPa pressure and 900 °C temperaturefollowed byfiltration at ca. 550 °C and catalytic reformingof tars andhy-drocarbon gases in a two-stage reformer.
The gasifier operationwas steady and a very high carbon conversionof 98.5–99%was reachedwith all three feedstocks. Raw gas tar contentswere reasonably lowdue to the catalytic effects of the used bedmaterialcontaining calcium. No signs of bed sintering or ash depositswere foundfrom the bottom ash or from the reactor wall when inspected after thetest run. Operation of the filter unit at a 530–560 °C temperature win-dow was smooth and there were no signs of increasing pressure drop.The filter unit removed practically all particulates and alkali metalsand over 90% of chlorine from the gas, and thus protected the catalyticreformer unit rather well. The operation of the reformer was alsostraightforward and the catalyst activity remained constant throughoutthe test run. The operation temperature could be controlled easily bychanging the oxygen feed rates. All C2-hydrocarbon gases, over 98% oftars and 92–99% of benzenewere decomposed in the reformer, whereasthe conversion of methane and ammonia was lower. There were nosigns of increasing pressure drop in the reformer. In addition, the visualinspection made after the test run showed that both the monoliths ofthe pre-reformer and the granular catalyst of the final fixed bed werepractically free of soot or ash deposits.
Follow-up process development work was later focused on furtherimprovement of the reformer performance. This was accomplished bychanging the pre-reformer type frommonolith to fixed-bed and by en-larging the volume of the final nickel catalyst bed.
Acknowledgements
This work was financially supported by the Finnish Funding Agencyfor Technology and Innovation (Tekes) (grant no. 40441/11) throughthe 2G-Biofuels 2020 project.
References
[1] E. Kurkela Girio, J. Kiel, R.K. Lankhorst, Longer Term R&D Needs and Priorities onBioenergy, EERA-EIBI Workshop Report, EERA European Energy Research AllianceBioenergy, Brussels, 2013. (47 p. http://setis.ec.europa.eu/system/files/EERA_EIBI_WORKSHOP_Report.pd).
[2] M. Nieminen, E. Kurkela, J. Palonen, Biomass andwaste gasification and gas co-firingin pulverised coal-fired boilers, Proc. of the 6th European Gasification Conference,Institution of Chemical Engineers, Brighton, UK, May 10–12 2004.
[3] S. Kern, C. Pfeifer, H. Hofbauer, Gasification of wood in a dual fluidized bed gasifier:Influence of fuel feeding on process performance, Chem. Eng. Sci. 90 (2013)284–298, http://dx.doi.org/10.1016/j.ces.2012.12.044.
[4] M. Hedenskog, Gasification of forest residues in a large demonstration scale — TheGoBiGas-project, SGC Int. Seminar on Gasification, Malmo, SwedenOct. 15–16, 2014.(http://conference.sgc.se/ckfinder/userfiles/files/2_1_%20Malin%20Hedenskog.pdf).
[5] A.G. Buekens, J.G. Schoeters, European experience in the pyrolysis and gasification ofsolid wastes, Conserv. Recycl. 9 (1986) 253–269, http://dx.doi.org/10.1016/0361-3658(86)90016-0 (ISSN 0361–3658).
[6] R.J. Evans, R.A. Knight, M. Onischak, S.P. Babu, Development of biomass gasificationto produce substitute fuels, Pacific Northwest Lab, Technical Report, PNL-65181988.http://dx.doi.org/10.2172/5206147.
[7] U. Femmer, J. Lambertz, K.A. Theis, Gasification of Brown Coal for the Generation ofSynthesis Gas, United States: American Institute of Chemical Engineers, New York,NY, 1986.
[8] J. Koljonen, E. Kurkela, C. Wilen, Peat based HTW-plant at Oulu, Bioresour. Technol.46 (1993) 95–101.
[9] E. Kurkela, J. Koljonen, Experiences in the operation of the HTW process at the peatammonia plant of Kemira Oy, in: M. Korhonen (Ed.), ,VTT Symposium 107, Lowgrade fuels, Helsinki, 12–16 June 1989, vol. 1 1990, pp. 361–372.
[10] E. Kurkela, P. Ståhlberg, Air gasification of peat, wood and brown coal in a pressurizedfluidized-bed reactor. I. Carbon conversion, gas yields and tar formation, Fuel Process.Technol. 31 (1992) 1–21, http://dx.doi.org/10.1016/0378-3820(92)90038-R.
[11] E. Kurkela, M. Kurkela, A. Moilanen, 2006, in: A.V. Bridgwater, D.G.B. Boocock (Eds.),Science in Thermal and Chemical Biomass Conversion, vol. 1, CPL Press 2006,pp. 662–676 (Science in Thermal and Chemical Biomass Conversion. Vancouver Is-land, Canada, 30 Aug.–2 Sept. 2004).
[12] P. McKeough, E. Kurkela, Process evaluations and design studies in the UCG project2004–2007, Espoo, VTT. 45 p. VTT Tiedotteita — Research Notes 2434, , 2008, ISBN978-951-38-7209-0. (978-951-38-7210-6).
[13] P. McKeough, K. Saviharju, Enhancing production of energy power and fuels inconjunction with chemical recovery and simultaneously reducing green-house gasemissions, International Chemical Recovery Conference. Quebec, Canada, May 9–June 1, 2007.
[14] I. Hannula, E. Kurkela, Liquid transportation fuels via large-scale fluidised-bed gasi-fication of lignocellulosic biomass. Espoo, VTT. 114 p.+ app. 3 p. VTT Technology 91,2013. (http://www.vtt.fi/inf/pdf/technology/2013/T91.pdf).
[15] P. McKeough, E. Kurkela, Detailed comparison of efficiencies and costs of producingFT liquids, methanol, SNG and hydrogen from biomass, 15th European Biomass Con-ference, Berlin, Germany, May 7–11, 2007.
[16] E. Kurkela, M. Kurkela, I. Hiltunen, The effects of wood particle size and differ-ent process variables on the performance of steam–oxygen blown circulatingfluidized-bed gasifier, Environmental Progress and Sustainable Energy, Am.Inst. Chem. Eng. Environ Prog. 33 (2014) (2014) 681–687, http://dx.doi.org/10.1002/ep.12003.
[17] P. Simell, I. Hannula, S. Tuomi, M. Nieminen, E. Kurkela, I. Hiltunen, N. Kaisalo, J.Kihlman, Clean syngas from biomass-process development and concept assessment,Biomass Convers. Bioref. 4 (2014) 357–370, http://dx.doi.org/10.1007/s13399-014-0121-y.
[18] E. Kurkela, P. Ståhlberg, J. Laatikainen, Pressurized fluidized-bed gasification exper-iments with wood, peat and coal at VTT in 1991–1992, Part 1. Test facilities and gas-ification experiments with sawdust, VTT Publications, Espoo, VTT, 1993. 55.
[19] P. Simell, J.B. Bredenberg, Catalytic purification of tarry fuel gas, Fuel 69 (1990)1219–1225.
[20] N. Kaisalo, J. Kihlman, I. Hannula, P. Simell, Reforming solutions for biomass-derivedgasification gas: experimental results and concept assessment, Fuel 147 (2015)208–220, http://dx.doi.org/10.1016/j.fuel.2015.01.056.
[21] P. Simell, E. Kurkela, Method for the purification of gasification gas. Pat. EP1404785B1, publication date 3 Jan. 2007, application number EP2002743308A, applicationdate 20 June 2002, priority EP2002743308A.
[22] P. Simell, E. Kurkela, I. Hiltunen, S. Toppinen, I. Eilos, Method of reforming gasifica-tion gas, WO/2013/030463.
[23] J. Neeft, et al., Tar guideline. A standard method for measurement of tars and parti-cles in biomass producer gases, 12th Eur. Conf. and Technology Exhibition on Bio-mass for Energy, Industry and Climate Protection, Amsterdam, NL June 17–212002, pp. 469–472.
[24] E. Kurkela, P. Ståhlberg, Air gasification of peat, wood and brown coal in a pressur-ized fluidized-bed reactor. 2. Formation of nitrogen compounds, Fuel Process.Technol. 31 (1991) 23–32.
[25] J. Leppälahti, E. Kurkela, The behaviour of nitrogen compounds and tars in fluidized-bed air gasification of peat, Fuel 70 (1991) 491–497.
[26] R.R. Rhinehart, R. Felder, J.K. Ferrel, Dynamicmodelling of a pilot-scale fluidized-bedcoal gasification reactor, Ind. Eng. Chem. Res. 26 (1987) 738–745.
[27] J. Laatikainen-Luntama, E. Kurkela, Air-blown CFB gasification of forest residues, de-molition wood and crushed wheat straw pellets, manuscript submitted for publica-tion, 22nd International Conference on Fluidized Bed Conversion, June 2015 (Turku,Finland).
[28] E. Kurkela, Formation and removal of biomass-derived contaminants in fluidized-bed gasification processes, VTT Publications, Espoo, VTT 1996, p. 47.
[29] E. Kurkela, P. Ståhlberg, J. Laatikainen, M. Nieminen, Removal of particulates and al-kali metals from the product gas of pressurized fluidized-bed gasifier, Proc. Int. Fil-tration & Separation Conf. FILTECH EUROPA 91, Karlsruhe, DE, 15–17 Oct, FiltrationSociety 1991, pp. 449–467.
[30] J. Hepola, P. Simell, Sulphur poisoning of nickel-based hot gas cleaning catalysts insynthetic gasification gas. I. Effect of different process parameters, Appl. Catal. B En-viron. 14 (1997) 287–303.
[31] J. Hepola, P. Simell, Sulphur poisoning of nickel-based hot gas cleaning catalysts insynthetic gasification gas. II. Chemisorption of hydrogen sulphide, Appl. Catal. B En-viron. 14 (1997) 305–321.